
Elevated geopolitical tensions, but the financial system is functioning well
As a result of the war in the Middle East, prices for oil and a number of other commodities have risen sharply and been highly volatile. There is pronounced uncertainty surrounding the outlook for the global economy and developments in financial markets, but the financial system functions well, and there is little effect on banks.
New participants and greater complexity in the financial system
New regulation means that new market participants and products, such as private credit and securitised loans, enter the Norwegian market. This may strengthen competition but could transfer risk and may make it more difficult to identify where it ultimately resides. International cooperation is therefore important for ensuring adequate information on cross border activities, and risk takers themselves must be able to absorb losses and liquidity stress.
Banks are equipped to manage stress
Norwegian banks are solid, liquid and highly profitable, and are expected to remain so, even though losses could increase somewhat. Norwegian banks have substantial exposures to real estate firms. Most commercial real estate firms are able to cover their financing costs, while the situation is more difficult for some real estate developers.
Financial system resilience must be maintained
Regulation contributes to ensuring that banks hold sufficient capital to cover unexpected losses. They can therefore continue to provide loans to credit-worthy customers, even in a deep economic downturn with substantial losses. Bank regulation changes are being considered internationally. There may be good reasons to simplify regulations, but this must not be at the expense of resilience.
Financial stabilty assessment
Norges Bank’s Monetary Policy and Financial Stability Committee considers the Norwegian financial system to be robust. The war in the Middle East is making the economic outlook more uncertain than normal. This may lead to market stress that could spread to the Norwegian financial system. The increasing emergence of non-bank financial institutions (NBFIs) may result in increased competition and better services but also reduced transparency and new risks. It is important to maintain system resilience so that vulnerabilities do not amplify an economic downturn. The Committee has decided to keep the countercyclical capital buffer unchanged and recommends maintaining the systemic risk buffer at the current level.
The international situation is marked by uncertainty
The global risk outlook is marked by geopolitical unrest, and the framework for international cooperation appears to be more unpredictable than before. The war in the Middle East has led to high volatility in energy and financial markets and is creating greater uncertainty than normal about the economic outlook. Prices for oil and a number of other commodities have risen substantially and are expected to dampen global growth. The overall impact of higher energy prices on activity in the Norwegian economy is likely to be limited. The war is increasing the risk of market stress that could spread to the Norwegian financial system. So far, movements in risk premiums have been moderate.
In a turbulent world, the risk of targeted cyberattacks and other operational disruptions increases. Cyberattacks that impact critical functions or lead to a broad-based loss of confidence may threaten financial stability, both internationally and in Norway. Attacks on banking and payment systems can develop rapidly from technical IT problems to serious consequences for banks’ operations and the broader economy. Artificial intelligence (AI) changes the cyberattack risk landscape by increasing attackers’ ability to swiftly and efficiently detect and exploit vulnerabilities before they are addressed. This development increases the demands placed on system owners’ prioritisation under time pressure. AI tools may over time help mitigate vulnerabilities more efficiently and thereby strengthen the defences of financial system participants.
At the same time, AI can change work processes and give rise to new services, reduce costs and improve the timeliness and quality of information. If AI expectations are not met, this could lead to significant market movements. Uncertainty surrounding productivity gains, investment needs and labour market implications remains high.
The international stablecoin market is expanding rapidly, but there are no stablecoins backed by assets denominated in NOK. Stablecoins are predominantly used in cryptoasset trading, and the rest of the financial system is so far exposed to a limited extent. Norges Bank does not consider stablecoins or other cryptoassets to currently pose a risk to financial stability but is monitoring developments closely.
The financial system is becoming more interconnected and complex
The importance of NBFIs in the financial system varies across countries. In recent years, private credit growth has been strong in the US and Europe, while the extent of synthetic securitisation has increased in particular in the EU. The emergence of NBFIs makes the financial system less transparent and more complex. Risk may be transferred out of the banking system to entities with less risk-bearing capacity, resulting in opaque interconnections with banks. This can amplify market stress. At the same time, NBFIs can also provide benefits, including stronger competition and improved access to credit. Risk can be distributed across more market participants than banks alone, thereby reducing risk concentration among banks.
The extent of private credit in Norway has so far been limited. The EU directives regulating lending by alternative investment funds (AIFs) have recently been circulated for consultation in Norway, and the regulatory framework is expected to be transposed into Norwegian law soon. This may lead to increased credit provision from AIFs to the Norwegian corporate sector. In its consultation response, Norges Bank supported the assessment of the Financial Supervisory Authority of Norway that such funds should not be permitted to provide credit to consumers, although this can be reconsidered once experience has been gained with lending from these funds to firms. In Norway, banks and mortgage companies are the dominant providers of credit, and the Committee assesses that the role of NBFIs in credit provision in Norway does not currently pose a risk to financial stability. The Committee is nevertheless of the view that all credit providers should be required to report their lending to Statistics Norway to enable more complete national credit statistics and improve the basis for monitoring systemic risk.
In synthetic securitisation, banks transfer credit risk from their loan portfolios to NBFIs, but the loans remain on their balance sheets. Banks may then achieve capital relief because they have purchased protection against credit risk. As a result of the transposition of the EU regulatory framework into Norwegian law in 2025, synthetic securitisation may also increase in Norway. Norges Bank will monitor developments closely and assess the impact on overall risk in the financial system. The Committee judges that it is important for financial stability that credit risk transfers are transparent and that risk-takers themselves absorb losses and manage liquidity problems.
The interconnectedness between banks and NBFIs is increasing across national borders. Foreign hedge funds have become an important investor group in the Norwegian covered bond market. These funds are highly leveraged and rely on short-term financing, while their assets are long-term. Hedge fund fire sales triggered by market stress or financing difficulties may also cause financing problems for banks and other market participants that rely on financing in the Norwegian market. The Committee is of the opinion that market participants themselves are responsible for helping to ensure that the Norwegian covered bond market is resilient to shocks, and that they themselves must be able to handle stress in the covered bond market and take into account that, in periods, funding markets may cease to function.
Increased use of, and limited information about, complex structures can weaken market participants’ basis for informed and prudent risk-taking. The Committee is therefore of the opinion that banks should provide clear information about their NBFI linkages, for example in Pillar 3 reports. Transparency may be even more difficult in the case of cross-border linkages, and Norwegian authorities have very limited influence over the regulation of foreign market participants. International cooperation between authorities is therefore important for ensuring access to necessary information on cross-border activities.
Norwegian banks are well equipped to manage market stress and higher losses
In Norway, the financial system has proven resilient to major market shocks and higher interest rates in recent years. The introduction of new regulation in Norway and abroad following the financial crisis has bolstered resilience both internationally and domestically.
Changes to capital adequacy requirements in 2025 has resulted in broadly unchanged overall capital ratios in the Norwegian banking sector. Requirements have increased somewhat for internal ratings-based banks, while standardised approach banks have received capital relief, making them more competitive in low-risk mortgage market segments. This may have strengthened competition for mortgage customers.
The European Commission has announced that it will propose changes to bank regulation in 2026. One objective of the changes will be to simplify the regulatory framework, including capital and reporting requirements. The Committee is of the opinion that there are good reasons to explore opportunities to simplify complex and comprehensive regulations, but it is important that this is not at the expense of financial system resilience. The growing role of NBFIs may increase the need for reporting to ensure transparency, and this may therefore conflict with the objective of simplification. In several countries, there is also increasing pressure to ease banks’ capital requirements, partly based on the need to strengthen competitiveness in relation to other jurisdictions. Under the current capital requirements, Norwegian households and firms have had ample access to credit, and the markets for banking services appear overall to function well.
Norwegian banks satisfy capital and liquidity requirements by a solid margin and have ample access to both deposit and wholesale funding. Banks obtain much of their funding on international markets, and they exchange some of this funding to finance lending in NOK. Analyses in this Report show that in a severe market stress scenario, where funding markets cease to function, banks may experience liquidity problems, but the analyses indicate that banks’ liquidity needs would primarily be in NOK. The Committee notes that Norwegian banks are well equipped to withstand foreign currency liquidity stress.
Banks’ profitability is the first line of defence against losses. Norwegian banks are highly profitable, primarily as a result of high net interest income, low operating costs and low credit losses. Low losses and solid profitability are expected to continue ahead. However, there is substantial uncertainty surrounding economic developments. Norwegian households are highly indebted, both historically and compared with other countries. If interest rates rise, income is reduced or house prices fall markedly, high debt levels, especially when combined with low liquidity, increase the risk of sharp falls in consumption. During the years following the pandemic, higher interest rates and high inflation tightened household finances. However, most households have been able to service debt and cover normal living expenses out of current income by an ample margin. Wage growth has outpaced inflation over the past two years, and there are prospects that this will continue in 2026. This increases households’ purchasing power and improves their debt-servicing capacity, also when taking into account higher interest rates.
The exposures of Norwegian banks to firms in the real estate sector are high. Real estate firms in particular have been affected by higher interest rates as they often have high debt-to-earnings ratios. High employment is helping sustain demand for office space. Most CRE firms therefore have sufficient earnings to handle financing costs. Continued low construction activity and higher interest rates may lead to debt-servicing problems for more real estate developers. Norges Bank’s analyses indicate that corporate credit losses have increased somewhat, albeit from low levels.
Banks’ losses may increase more than envisaged. Since the previous Financial Stability Report, long-term market rates have risen markedly. This reduces CRE profitability and puts pressure on property values. Should employment also fall markedly and rental income become notably lower than envisaged, many CRE firms could face difficulties servicing debt and banks’ loan losses could become substantial.
Climate policy affects financial stability
Higher oil and gas prices highlight the global economy’s dependency on fossil energy sources. The solvency stress test in this Report assumes a severe but plausible scenario involving both climate-related disasters and an abrupt and more rapid international transition towards a lower-emissions economy. Norway is less directly exposed to extreme weather events than many other countries but would be more adversely affected by an abrupt increase in carbon prices and new climate policy requirements since the petroleum sector still plays an important role in the Norwegian economy. In the stress test, the downturn is amplified by increased cost pressures and weak international developments, which lead to a broad-based downturn in the Norwegian economy.
The Committee notes that banks’ losses increase considerably due to the downturn, but also as a result of a sharp rise in losses on lending exposures in sectors that are particularly vulnerable to a sudden shift in climate policy. Variation in exposure across banks means that some banks are hit harder than others.
The risk of losses increases if firms do not adjust. By placing greater emphasis on the climate risk in their risk analyses, banks can reduce their own risk. At the same time, this may contribute to channelling, to a greater extent, bank funding to investment in firms that cut emissions and make the economy more resilient to severe climate events.
The stress test shows that banks as a whole hold sufficient capital to absorb large losses, but that new lending would need to be constrained to meet capital requirements. Reduced buffer requirements will give banks more room to continue to provide credit in a transition.
The capital buffers should be maintained
Norwegian banks’ capital buffer requirements reflect the vulnerabilities in the Norwegian financial system and bolster resilience. Norges Bank sets the countercyclical capital buffer (CCyB) rate each quarter and provides the Ministry of Finance with advice on the systemic risk buffer rate at least every other year. On 6 May, the Monetary Policy and Financial Stability Committee decided to keep the countercyclical capital buffer rate unchanged and to advise the Ministry of Finance to maintain the systemic risk buffer requirement at 4.5 percent.
Ida Wolden Bache
Pål Longva
Øystein Børsum
Hilde C. Bjørnland
Steinar Holden
The war in the Middle East has resulted in considerable changes in commodity prices, macroeconomic expectations and interest rates, both domestically and internationally, while the impact on risk premiums has remained relatively moderate. Domestically, growth in debt and property prices has been moderate, and banks remain resilient. Banks are sufficiently capitalised to absorb unexpected losses and have ample liquidity to withstand stress in funding markets. Interlinkages between banks and other financial institutions may influence systemic risk, and it is important that the authorities closely monitor these linkages.
1.1 Elevated geopolitical tensions have resulted in higher interest rates but have had little impact on risk premiums
Higher energy prices
The US-Israeli attack on Iran in late February triggered a sharp rise in oil and gas prices (Chart 1.1), resulting in higher short-term inflation expectations, upward shifts in international policy rate expectations and an increase in long-term interest rates. Oil prices have remained elevated, and markets are pricing in a certain probability of a further rise, pushing up international interest rates (Chart 1.2).
Oil prices: USD/barrel. Gas prices: EUR/MWh. Option-implied probability distribution for Brent crude1

10-year government bond yields. Percent2

Higher energy prices in March added to concerns about global growth prospects, particularly in countries reliant on oil and gas imports. Leading European and Asian equity indices fell markedly. US equity indices also declined somewhat, and international credit premiums rose (Chart 1.3).
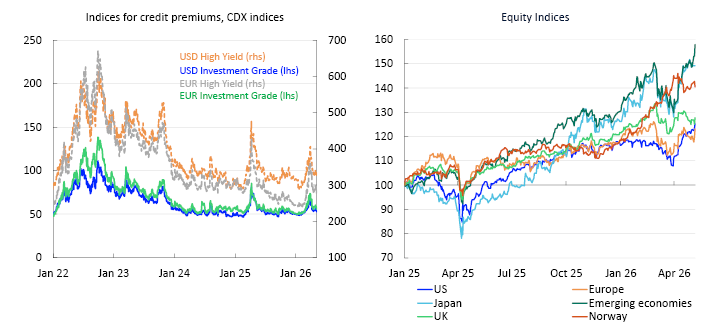
The ceasefire between the parties and hopes that the war would not be long-lasting contributed to a reversal of market movements in equity and credit indices in April (Chart 1.3). In addition, continued optimism about AI and companies in the AI sector has boosted international equity markets. Major equity indices in the US and Asia reached new highs at the end of April 2026.
Stronger Norwegian krone and moderate movements in credit premiums
Norwegian Policy rate expectations have risen since the November Report. Higher-than-expected consumer price inflation and a possible further increase in inflation due to higher oil and gas prices after the war in the Middle East have contributed to the rise.
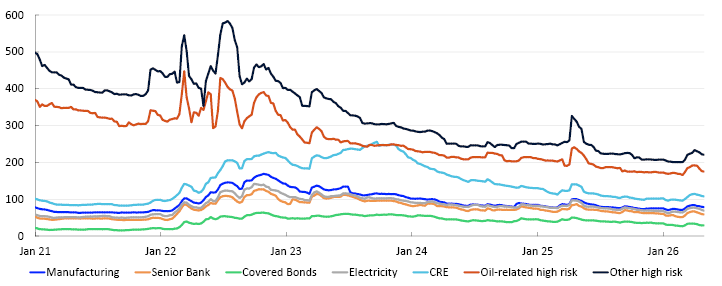
The Oslo Børs benchmark index has risen since last autumn and remained at a high level, reaching new record highs during the period. Advances in share prices have been driven in particular by oil and gas related sectors. Credit premiums for both financial and non-financial corporates rose slightly following the outbreak of the war but have since fallen back and are largely at the same level as in autumn 2025 (Chart 1.4). Heightened uncertainty has led to somewhat lower bond market activity, although market function has remained satisfactory. Market rates and premiums in Norway often follow developments abroad as investors adjust their exposures across markets and jurisdictions. An international effect, as discussed further in Section 4, is the linkage between Norwegian banks and hedge funds.
Basis points4
Systemic risk survey
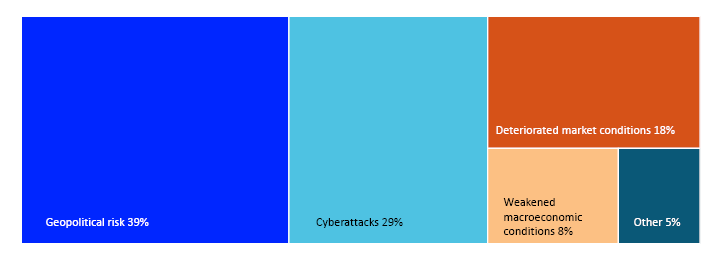
Norges Bank’s systemic risk survey conducted in March showed that Norwegian financial market participants consider geopolitical risk and cyberattacks to be the main sources of risk to the Norwegian financial system (Chart 1.A). Geopolitical risk and cyberattacks were also the two most important sources of risk in the surveys conducted in 2025 and in autumn 2024. In the surveys in 2023 and spring 2024, the decline in property prices was among the most important sources of risk highlighted by the respondents. Respondents were asked to assess the probability of an incident having a substantial impact on the financial system over the next three years and how this probability has changed over the past six months. The response alternatives were: decreased, decreased somewhat, unchanged, increased somewhat and increased. A majority assessed the probability as moderate and most reported that probability had increased somewhat, while none reported that it had decreased. Respondents were also asked to assess their confidence in the stability of the Norwegian financial system over the next three years, with the response alternatives: very low, low, medium, high or very high. While most reported high confidence levels and a few reported very high levels, none reported medium, low or very low levels.
Chart 1.A Norwegian market participants consider geopolitical risk and cyberattacks to be the main sources of risk
Norges Bank's systemic risk survey from March 2026.
Which financial system risks do you consider to be most probable?
The Norwegian krone has appreciated both as a result of higher energy prices and higher domestic inflation. Norwegian banks are robust with respect to potential turbulence in the foreign exchange market (see Section 3).
Norwegian financial market participants consider geopolitical risk and cyberattacks to be the main sources of risk to the Norwegian financial system in the period ahead (see «Systemic risk survey»).
1 Left panel:
Period: 1 January 2021–6 May 2026.
Right panel:
Distributions are estimated based on options prices in the oil market.
2 Period: 1 January 2021–6 May 2026.
3 Left panel:
Period: 1 January 2022–6 May 2026.
Right panel:
Period: 1 January 2025–6 May 2026.
Index. 1 January 2025=100
4 Period: 7 January 2021–30 April 2026. Weekly data.
1.2 Moderate growth in debt and property prices
Continued relatively moderate growth in household debt
Norwegian household DTI ratios rose over many years and are high both historically and compared with other countries (Chart 1.5).5,6 High debt among many households is a key vulnerability in the Norwegian financial system (see «Key vulnerabilities in the Norwegian financial system»). Higher interest rates and high inflation tightened household finances in the years following the pandemic. However, most households have been able to service debt and cover normal living expenses with current earnings by a solid margin (Financial Stability Report 2025 H2).

In 2024 and 2025, household real disposable income increased markedly, and mortgage lending rates edged down in 2025. In isolation, this strengthened households’ purchasing power and debt-servicing capacity. In March, the policy rate forecast was revised up, and in May, the policy rate was increased. Higher interest rates are likely to push up households’ interest burden slightly (Chart 1.5, right panel).
Following a period of increase since spring 2024, the 12-month rise in credit to households has remained stable at 4.7% so far in 2026. Household credit growth is still lower than in the pre-pandemic years. In Norges Bank’s lending survey, banks report that residential mortgage demand fell slightly in 2026 Q1, while they expect demand to edge up in Q2.
Total household debt has risen less than income in recent years. DTI ratios have declined broadly across households and most for those with the highest ratios. Looking ahead, household debt is expected to rise broadly in line with income, and changes in household DTI ratios will be minor (Chart 1.5, right panel).
In Norway, household credit growth is normally closely linked to housing market developments. Following a period of moderate house price inflation and high turnover in the secondary housing market in autumn 2025, the rise in house prices has slowed in 2026. Activity in the market for new homes remains low.
Moderate price developments for CRE
Banks’ substantial CRE exposure is another key vulnerability in the Norwegian financial system (Chart 1.6, left panel). Commercial property selling prices rose at the beginning of 2025, but developments have since been flat (Chart 1.6, right panel). Office vacancy rates have edged up over the past twelve months but is still low for the most attractive premises. Market participants report that demand for office space has weakened somewhat owing to heightened uncertainty. However, few new projects will be completed in the coming years, which may sustain rents, particularly in central Oslo.

Throughout 2025, equity-finance investors, such as insurance companies and pension funds, had an impact on the transaction market and contributed to the required rates of return being revised down somewhat. Norges Bank expects equity investors to continue to purchase more properties, albeit to a somewhat lesser extent ahead. This leads to a slightly higher yield projection. The monetary policy outlook also suggests a higher yield. On the whole, the projections for rent inflation and the yield imply that commercial property selling prices will remain fairly flat, albeit somewhat lower than projected in the previous Report (Chart 1.6, right panel).
Since the previous Report, long-term rates have risen markedly. This weakens debt-servicing capacity and may put pressure on the property values of Norwegian CRE firms. Should employment also fall markedly and rental income prove appreciably lower than envisaged, a number of CRE firms could face difficulties servicing debt and refinancing loans. In situations where the profitability of many firms has been weakened by higher financing costs, this could trigger property fire sales, which in turn could result in higher bank losses.
5 Statistics Norway has conducted a comprehensive main revision of the national accounts. In the revision, the value of housing services was revised upwards for the period between 1999 and 2025, which increased household production and consumption, with production affecting household income in the income and capital accounts. As a result, household debt burdens have been revised downwards. The revision also implies that Norwegian household debt burdens appear somewhat lower relative to other countries than previously estimated (Chart 1.5, left panel).
6 Chart 1.5 (left panel) compares the debt burden of Norwegian households with that of households in other countries using OECD figures. The OECD measures debt burdens as total debt relative to disposable income. Note that the definition of disposable income may vary across data sources. For example, Eurostat includes accrued pension entitlements in its income measure, which affects the ratio across countries.
7 Left panel:
Norges Bank’s own calculations based on data from Statistics Norway have been used for Norway.
For New Zealand and Korea, figures are for 2023.
Right panel:
Period: 1983 Q1–2029 Q4.
Projections from 2026 Q1 from MPR 1/2026.
Debt-to-income ratio is debt as a share of disposable income. Disposable income is after-tax income less interest expenses.
Debt service ratio is interest expenses and estimated principal payments on loan debt as a percentage of after-tax income.
Interest burden is interest payments as a percentage of after-tax income.
8 Right panel:
Period: 2006 Q4–2027 Q4. Projections from 2026 Q1 for Financial Stability Report 2026 H1 and from 2025 Q4 for Financial Stability Report 2025 H2.
Prime real estate refers to high-quality office buildings located in Vika and Aker Brygge. Selling prices are calculated as rents divided by an estimated yield. The yield is based on property sale information and depends on developments in long-term interest rates and risk premiums.
1.3 The banking sector is resilient, but new developments have to be monitored closely
Norwegian banks are well equipped to withstand stress in funding markets and higher credit losses
Banks assume liquidity risk by transforming short-term deposits into long-term loans. It is important that banks are also able to manage this risk during periods of financial market stress. All Norwegian banks meet the short-term liquidity buffer requirement (LCR) and the requirement for stable long-term funding (NSFR). Analyses in Section 3 show that banks are also well equipped to deal with liquidity risk in foreign currency.
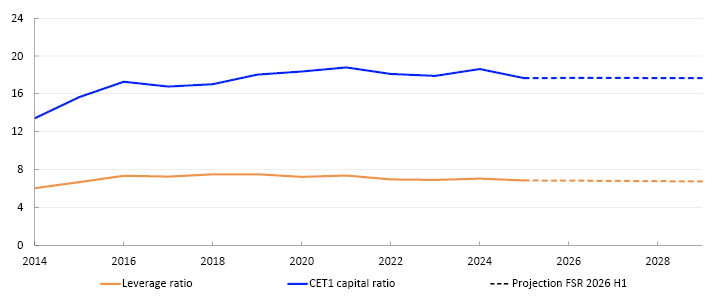
Banks are highly profitability (see Section 2.1). Profitability enables them to absorb losses through current operating income. Looking ahead, credit losses are expected to remain moderate, but higher interest rates may negatively affect interest rate sensitive sectors such as real estate development and construction (see Section 2.1). Banks’ capital ratios measure the capacity to absorb unexpected credit losses, in contrast to expected credit losses, which are covered by current interest income. Capital adequacy remains elevated (Chart 1.7).
CET1 capital ratios and leverage ratios. Percent9
Stricter capital requirements following the 2008 financial crisis are the primary reason for banks’ high capital ratios. A number of elements have been added to the regulatory framework and reporting requirements have become more extensive. The European Commission has announced that it will propose changes to bank regulation in 2026 (see «Proposed changes to the current capital adequacy framework»). One objective of the changes will be to simplify the regulatory framework, including capital adequacy and reporting requirements. The cumulative effect of different regulations may result in unintentional and overlapping effects, but simplification should not come at the cost of financial system resilience.
Proposed changes to the current capital adequacy framework
In March 2025, the European Commission unveiled the strategy for the EU’s Savings and Investments Union, whose purpose is to develop a more integrated and efficient financial sector.1 The measures will ensure that a larger share of savings in Europe is channelled into productive investments and that small and innovative firms gain access to sufficient capital. Simplifying and strengthening the banking sector is part of this strategy. In February 2026, the Commission launched a consultation to gather input on how the banking sector can better support financing the European economy.2 In summer 2026, this work will culminate in a report that will include proposals to streamline and enhance the effectiveness of current banking regulations.
Alongside the EU’s Savings and Investments Union strategy, the European Central Bank (ECB) created a High-Level Task Force on Simplification (HLTF) to formulate concrete recommendations for simplifying EU banking rules. The HTLF recommendations were published and endorsed by the ECB in December 2025.3 The HTLF recommends that the current system with multiple buffer requirements be replaced with two buffers: one non-releasable and one releasable that can be lowered during downturns. The task force also emphasises the importance of maintaining the existing powers and responsibilities of national authorities in the event the buffers are merged.
For market participants, it would represent a simplification if the countercyclical capital buffer and the systemic risk buffer covered the same institutions and the same parts of banks’ balance sheets across European countries, and if a requirement for automatic reciprocation were introduced, as currently applies to the countercyclical capital buffer up to 2.5%. A common process for calibrating both buffers could be somewhat simpler for the jurisdictions to manage. Under the current framework, the level of the countercyclical capital buffer is intended to reflect cyclical vulnerabilities, while the level of the systemic risk buffer is intended to reflect structural vulnerabilities. As noted in Norges Bank’s framework for the systemic risk buffer, distinguishing precisely between cyclical and structural vulnerabilities is, however, difficult.
In April, the EU Commission circulated for comment a proposal about the temporary relaxation of capital requirements for market risk to ensure a level playing field across countries. The introduction of the new market risk rules in Basel II (FRTB) has been delayed in the EU and a number of other countries.
1 See press release from the European Commission of 19 March 2025: Commission unveils Savings and Investments Union strategy to enhance financial opportunities.
2 See news item from the European Commission dated 11 February 2026: Commission launches public consultation on EU banking – Finance.
3 See press release from the ECB of 11 December 2025: Governing Council proposes simplification of EU banking rules.
Increasing scope of NBFI activity
Comprehensive banking sector regulations may have contributed to boosting the activity of non-bank financial institutions (NBFIs). Important functions in the financial system are performed by such NBFIs, which include insurance companies, asset managers and investment funds. NBFIs can also have linkages to banks and affect systemic risk (Section 4). The emergence of NBFIs subject to less comprehensive regulations than banks may, however, also contribute to risk migrating away from systemically important institutions and to NBFIs that are less important to financial stability. To reduce the risk of spill-over effects of systemic risk it is important that banks are not left guaranteeing NBFI liquidity.
On the one hand, less transparent markets and uncertainty about linkages between banks and NBFIs may support stricter capital requirements for banks. On the other hand, higher capital requirements for banks at this time could amplify the trend towards more non-bank lending, which could further reduce transparency and regulatory oversight.
AI is affecting the financial sector
Banks’ earnings and credit risk are influenced by how AI impacts customers’ financial positions and investment needs. AI usage can increase efficiency and push down labour costs. At the same time, there is uncertainty as to how the labour market will be affected and whether efficiency gains will fulfil the high expectations.
AI may furthermore change the structure of trading platforms, from pure execution to decision-making platforms. AI developments may reduce costs and improve the timeliness and quality of information but may also increase market fluctuations through more uniform behaviour.
Threats from cyberattacks may change due to AI.10 On the one hand, AI may promote more efficient mitigation of vulnerabilities and thus strengthen the defences of financial system participants, but on the other hand, AI tools may enable attackers to very swiftly identify and exploit security gaps before mitigating measures are implemented. According to the Financial Supervisory Authority of Norway’s annual risk and vulnerability analysis, Norwegian security authorities consider the risk of malicious cyber operations targeting Norwegian firms and the financial sector to be on the rise.11
Credit risk could migrate away from banks through synthetic securitisation
Securitisation makes it easier for banks to reduce risk-weighted assets and thereby meet capital adequacy requirements (see Section 4.3). Credit risk transfer can enhance diversification, which can in turn reduce systemic risk. From a financial stability perspective, it is nevertheless important that the authorities continue to monitor credit risk in banks, securitised portfolios and linkages between banks and NBFIs. Furthermore, it is important to strengthen market discipline by ensuring that banks provide the market with adequate information about their securitisations.
Norges Bank is retaining the countercyclical capital buffer rate
The countercyclical capital buffer (CCyB) rate is intended to reflect the assessment of cyclical vulnerabilities in the financial system and to mitigate the risk of banks amplifying an economic downturn. On 6 May 2026, Norges Bank’s Monetary Policy and Financial Stability Committee decided to keep the CCyB unchanged at 2.5%.
and recommends keeping the systemic risk buffer at the current level
The systemic risk buffer (SyRB) is intended to help ensure that banks hold sufficient capital to withstand downturns. The design of the SyRB varies considerably across countries (see «Considerable differences in the use of the systemic risk buffer across European countries»). The SyRB is meant to reflect the assessment of structural vulnerabilities in the financial system, ie persistent features of the financial system that change rarely or little from year to year. Norges Bank has advised the Ministry of Finance to maintain the SyRB rate of 4.5% for all exposures in Norway. There have been no material changes in the level of key structural vulnerabilities in the Norwegian financial system since the SyRB requirement was last assessed in 2024.
9 Period: 2014–2029.
Projections from 2026 for Financial Stability Report 2026 H1.
Figures for the six largest Norwegian-owned banking groups.
10 See Adrian, T., T. Gaidsoch and R. Ravikumar (2026) “Financial Stability Risks Mount as Artificial Intelligence Fuels Cyberattacks”, 7 May, IMF blog, for a discussion of this topic.
11 Financial Supervisory Authority of Norway (2026) “Risk and Vulnerability Analysis (RAV) 2026” (Norwegian only).
Key vulnerabilities in the Norwegian financial system
The economy is regularly exposed to shocks that affect both the real economy and the financial system. Promoting financial stability means ensuring sufficient financial system resilience to absorb such shocks. In this work, Norges Bank focuses on assessing systemic risk. The financial system should contribute to stable economic developments by channelling funds and offering savings products, executing payments and distributing risk efficiently. Systemic risk is the risk of disruption to the financial system’s ability to perform these functions.
The level of systemic risk depends on a number of factors. The risk of economic shocks, such as geopolitical tensions, pushes up systemic risk. Financial system vulnerabilities further increase systemic risk. Chart 1.B summarises Norges Bank’s assessments of key vulnerabilities in the Norwegian financial system. In response to financial system vulnerabilities, a number of measures have been introduced to strengthen resilience, including requirements for banks’ solvency, liquidity and credit standards.

Vulnerabilities in the Norwegian financial system
The high indebtedness of Norwegian households is a key vulnerability. This vulnerability has built up over time as debt levels rose more than household income over an extended period. In the years preceding the pandemic, debt growth slowed and kept more closely in line with income growth. In recent years, debt growth has been slower than income growth. The debt-to-income (DTI) ratio remains high, both historically and compared with other countries.
Experience from banking crises in Norway and abroad has shown that losses on CRE exposures have been an important factor behind solvency problems in the banking sector. Norwegian banks have substantial exposure to the CRE sector, and this share has remained stable in recent years.
Furthermore, banks in Norway are interconnected through interbank exposures and have common or similar securities in their liquidity reserves (see Section 4). Covered bonds account for a large part of banks’ liquidity reserves. If a number of banks need liquidity and have to sell such a large quantity of covered bonds that the value of the bonds falls, the value of covered bond holdings in the liquidity reserves of all other banks will also fall. Cross-holdings of bonds mean that banks fund other banks. If banks were to withdraw collectively as buyers of covered bonds during market stress, this could weaken their ability to obtain new covered bond funding and could more easily lead to liquidity problems spreading and becoming self-reinforcing.
Digitalisation makes the financial system more efficient but also creates vulnerability to cyberattacks. Artificial intelligence (AI) increases cyber risk by increasing attackers’ ability to swiftly and efficiently detect and exploit vulnerabilities before they are addressed. Concentration, complexity and interconnectedness may amplify the consequences of a cyberattack that then spreads rapidly and widely across the financial system. If the overall consequences become sufficiently extensive, financial stability could be threatened. With the increased severity of the current threat landscape, consideration must be given to the fact that even well-protected systems can become unavailable. Adequate contingency arrangements are important for managing such serious situations (see Financial Infrastructure Report 2025 and the forthcoming Financial Infrastructure Report 2026).
Furthermore, banks’ substantial exposures to sectors that are particularly vulnerable to climate transition are a vulnerability in the financial system. The Norwegian business sector must adapt to climate change and the use of new forms of energy. There is considerable uncertainty about the cost of such a transition, and some firms may see their earnings weaken. If many firms are adversely affected, this may result in higher bank losses. More extreme weather events can also increase insurance premiums and other housing-related costs and thereby impact household resilience (see Section 2.3).
Considerable differences in the use of the systemic risk buffer across European countries
The capital adequacy framework for banks in the EU/EEA (CRR/CRD) sets both minimum capital requirements (Pillar 1) and establishes the framework that allows national authorities to set institution-specific capital requirements (Pillar 2) and buffers.
This is a fully harmonised regulatory framework, where national authorities’ room for manoeuvre is largely confined to measures deemed necessary for financial stability. For certain buffer requirements, such as the capital conservation buffer (CCoB), the scope for national adjustments is narrow. For others, particularly the systemic risk buffer (SyRB), the directive allows for greater flexibility. The SyRB may, for example, be limited to exposures to selected sectors, such as residential or commercial real estate.4
Chart 1.C presents Common Equity Tier 1 (CET1) capital requirements relative to risk-weighted assets and actual CET1 ratios for selected banks across European countries. Norway has the highest overall CET1 requirement. The Norwegian banks in the sample are relatively close to the requirement, compared with many European banks that have substantially larger capital headroom above their respective national requirements.
CET1 capital as a share of risk-weighted assets. June 20245

SyRBs in Norway, Sweden, Denmark and Finland
The SyRB differs substantially in design in Norway, Sweden, Denmark and Finland (see Table 1.A). Norway has set a general systemic risk buffer of 4.5% on all exposures in Norway. The requirement applies to all Norwegian banks and to foreign banks with risk-weighted exposures in Norway exceeding a materiality threshold of NOK 5bn.
Table 1.A SyRB design in Norway, Sweden, Denmark and Finland
|
Norway |
Sweden |
Denmark |
Finland |
|
|---|---|---|---|---|
|
Buffer requirement rate |
4.5% |
3.0% |
7.0% |
1.0% |
|
Included exposures |
All exposures in Norway |
All exposures in Sweden and other countries |
Exposures to real estate firms in Denmark |
All exposures in Finland and other countries |
|
Included national banks and branches |
All |
The three largest banks (Handelsbanken, SEB and Swedbank) |
All |
All |
|
Materiality threshold for inclusion of foreign banks’ exposures |
Risk-weighted Norwegian exposures in excess of NOK 5bn NOK |
No materiality threshold, as foreign banks are not subject to systemic risk buffer requirements |
Risk-weighted lending in excess of EUR 200m to Danish real estate firms |
No materiality threshold, as foreign banks are not subject to systemic risk buffer requirements |
Source: Notifications sent to the ESRB
Sweden has introduced a general 3% SyRB, limited to three systemically important banks. The buffer requirement applies to both domestic and international exposures of the three systemically important banks. Since the SyRB applies only to three Swedish banks, no materiality threshold has been set for foreign banks.
Denmark has introduced a 7% sectoral SyRB on Danish real estate firm exposures that are either unsecured or with loan-to-value (LTV) ratios above 15%. The SyRB applies to all Danish banks with relevant real estate exposures and to foreign banks with such exposures exceeding a materiality threshold of EUR 200m.
Finland has introduced a 1% general SyRB for all Finnish banks applicable to both domestic and foreign exposures. As Finland has not requested reciprocation from other EU member states, no materiality threshold has been set for foreign banks.
4 As of 31 December 2025, 11 EU countries have notified the ESRB of a general systemic risk buffer, while 10 countries have introduced sectoral buffers (see ESRB webpages).
5 The chart shows capital requirements and CET1 capital ratios for selected banks. The capital requirements show the minimum CET1 capital requirement for meeting the Pillar 1 and Pillar 2 requirements and the buffer requirements: the capital conservation buffer (CCoB), systemically important institutions buffer (SII buffer), countercyclical capital buffer (CCyB) and systemic risk buffer (SyRB). CET1 capital ratios are banks’ CET1 capital as a share of risk-weighted assets.
The chart includes only reported data for a sample of banks in each country. See “Annex: Sample of banks” in the EBA’s Risk Assessment Report – November 2024 for a complete overview of banks in the sample.
Stable earnings and solid solvency among banks improve financial system resilience. Norwegian banks are still highly profitable. Profitability is expected to remain elevated in the near-term, while lower interest rates and stronger competition could dampen earnings somewhat in the long term. Changes to the capital framework have harmonised capital requirements across banks and strengthened the competitiveness of standardised approach (SA) banks in some market segments.
2.1 Profitability in Norwegian banks is expected to remain solid, but to weaken
Norwegian banks are profitable and solid. Credit losses are expected to increase somewhat in the years ahead but to remain at a moderate level. Net interest income as a share of average total assets is expected to be unchanged in the near term and to then edge down, but the level is still considered to be robust.1
Continued solid profitability among Norwegian banks
Profitable operations are banks’ first line of defence against losses. Earnings at Norwegian banks have increased since the pandemic, reflecting higher interest rates that have pushed up net interest income. Profitability remained solid through 2025, albeit somewhat weaker than in 2024 (Chart 2.1), reflecting two policy rate reductions and bank earnings in 2024 being affected by substantial revenues from ownership interests related to a merger in the insurance sector. Return on equity remains above the average for the past ten years and the banks’ own targets. In Norges Bank’s projections, return on equity declines but continues to remain above the average for the past ten-years, reaching just above 13% at end-2029.
Annualised quarterly return on equity. Percent2

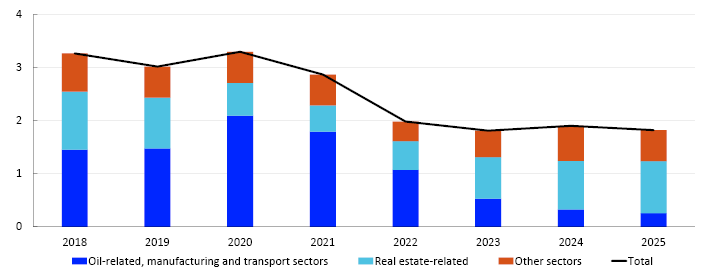
Corporate default rates are low but are rising in the real estate sector
Overall, banks recorded low default rates on corporate lending in 2025, but default rates continued to rise in the real estate sector (Chart 2.2). The rise has been most pronounced in real estate development, where higher interest rates and low construction activity have weighed on profitability and debt-servicing capacity in recent years. In Norges Bank’s Survey of Bank Lending for 2026 Q1, four out of nine banks reported a somewhat higher risk of default and breach of the terms of loan covenants in real estate development over the past six months. Real estate firms have been particularly affected by higher interest rates as they often have high ratios of debt to current earnings. Somewhat higher bank losses on exposures to this sector are expected. The war in the Middle East has added to uncertainty surrounding the economic outlook.
Defaults as a share of total Norwegian corporate exposures by sector. Percent3
Pre-tax profits increase somewhat, before edging down over the projection period
Higher policy rates normally boost banks’ net interest income. In the projections, net interest income as a share of total assets gradually declines slightly over the projection period (Chart 2.3), reflecting expectations of stronger competition and the policy rate path further ahead. Nevertheless, the net interest margin remains above the average for the past ten years further out in the projection period. Projected losses have been revised up somewhat from current levels, partly reflecting somewhat lower expected activity ahead, increased market stress and somewhat higher risk of real estate sector defaults. Losses are nevertheless expected to remain low through the projection period. Increased uncertainty surrounding economic developments also adds to uncertainty about losses ahead. Operating cost estimates have been revised down from current levels as costs in 2024 and 2025 were unusually high due to mergers. Developments in operating costs and earnings can also be affected by banks’ increased use of artificial intelligence. While this technology may reduce costs and boost efficiency, the effects are uncertain and may be offset by higher investment, stronger competition and new operational challenges and regulatory requirements.
Income statement items as a percentage of average total assets4

1 Estimates are for the macro bank, defined as the six largest Norwegian-owned banking groups: DNB Bank, SpareBank 1 Sør-Norge, Sparebanken Norge, SpareBank 1 SMN, SpareBank 1 Østlandet and SpareBank 1 Nord-Norge.
2 Period: 2010 Q1–2029 Q4.
Projections from 2026 Q1 for Financial Stability Report 2026 H1.
Figures for the six largest Norwegian-owned banking groups.
For comparability, the sample back in time has been adjusted for large mergers and acquisitions, ie figures for the merged banks are included for the period prior to a merger or acquisition.
3 Period: 2018–2025.
Non-performing loans are the stock of non-performing loans after 90 days and other defaults, as a share of total lending. Norwegian exposures only.
4 Period: 2010–2029.
Projections from 2026 for Financial Stability Report 2026 H1.
Figures for the six largest Norwegian-owned banking groups. Annualised.
For comparability, the sample back in time has been adjusted for large mergers and acquisitions, ie figures for the merged banks are included for the period prior to a merger or acquisition.
2.2 Regulatory changes result in more uniform capital requirements
Banks calculate their capital adequacy ratios based on risk-weighted assets. The largest banks calculate their risk weights using an internal ratings based approach (the IRB approach), while most smaller banks use the standardised approach. On 1 April 2025, the new European Capital Requirements Regulation (CRR III) was transposed into Norwegian legislation. The most important change for Norwegian banks was the introduction of a new standardised approach for the calculation of credit risk.
The new standardised approach is more risk-sensitive than previously and assigns particularly lower risk weight to low loan-to-value (LTV) exposures. For residential mortgages, the risk weight on exposures with low LTV ratios was reduced from 35% to 20%. Risk weights were also reduced for CRE exposures, but given that most standardised approach banks’ have a relatively smaller share of corporate exposure, the effect on total risk-weighted assets is more limited.
For IRB banks, the average risk-weight floor for residential mortgages was increased from 20% to 25% from 1 July 2025. Overall, these changes resulted in lower risk weights for low LTV residential mortgages for standardised approach banks than the average risk-weight floor for IRB banks.
New capital adequacy framework increases capital adequacy ratios in standardised approach banks
Changes to capital adequacy requirements resulted in broadly unchanged Common Equity Tier 1 (CET1) capital ratios for Norwegian banks as a whole in 2025 (Chart 2.4a). For IRB banks, a higher risk-weight floor in 2025 Q3 led to an increase in risk-weighted assets, resulting in a slight decline in CET1 ratios (Chart 2.4c). For standardised approach banks, the introduction of CRR III resulted in a substantial increase in CET1 ratios (Chart 2.4b), approximately in line with previous analyses.5 Norges Bank’s estimates indicate increases of up to 7 percentage points for some standardised approach banks. The increase reflects lower risk-weighted assets and does not in itself improve banks’ ability to absorb losses during downturns.
Chart 2.4 Substantial fall in risk-weighted assets for Norwegian standardised approach banks
Percentage change from preceding quarter in CET1 capital and risk-weighted assets. CET1 capital ratios in percent6
5 Andersen, H and J. Johnsen, (2023) “Effects of the new standardised approach and the new output floor for IRB banks”. Staff Memo 8/2023. Norges Bank.
6 Period: 2024 Q1–2025 Q4.
a) All banks is the sum of standardised approach banks and IRB banks.
b) To ensure consistent figures over time, standardised approach banks have been adjusted to only include standardised approach banks as at 2025 Q4.
c) IRB banks comprise all IRB banks except one, which is due to reporting issues related to mergers/acquisitions.
2.3 Climate stress test – can banks contribute to the green transition if they suffer large losses?
Among other things, Norges Bank’s work on financial stability includes assessing whether banks’ loss-absorbing capital is sufficient to withstand severe economic shocks. Stress tests are a key tool in this work and are used to analyse how unlikely but conceivable downturns may affect banks’ losses, capital and credit standards.
Climate risk may be a source of systemic risk and is the topic of the stress test in this Report. In the stress scenario, extreme weather events followed by an abrupt climate policy shift trigger a severe economic downturn. The climate policy shift is accompanied by a substantial rise in private sector investment needs. Ample access to credit will therefore be important for the climate transition. In addition, such a scenario would affect parts of the Norwegian business sector more severely than others and therefore make lending to sectors exposed to climate risk an additional risk factor for banks. The scenario is based on two different short-term climate scenarios developed by the Network for Greening the Financial System (NGFS).10 The scenario is simulated over a three-year horizon.
The stress scenario is not a forecast of economic developments following a pronounced downturn triggered by climate change but seeks to illustrate one of several possible economic paths with serious consequences for the Norwegian economy. The focus is on the interaction between banks’ adaptations and the economy, in particular how banks’ responses to higher losses may amplify the downturn through tighter credit standards. The stress test examines how time-varying capital requirements, such as the countercyclical capital buffer, can help banks maintain lending during such a downturn. No extraordinary fiscal or monetary policy measures are therefore assumed: automatic fiscal stabilisers function normally, and the central bank follows a simple monetary policy rule.
The stress scenario leads to financial market turbulence and a pronounced economic downturn
In the stress scenario, Europe is affected in 2027 by a series of severe climate-related weather events, including floods, droughts and wildfires, leading to extensive damage. Damage to infrastructure and production equipment leads to lower output and global supply chain disturbances. At the same time, shortages of key inputs raise firms’ costs, resulting in lower economic activity and higher inflation in Europe. While direct natural damage is less severe in Norway than elsewhere in Europe, Norway is affected by weaker external demand and higher import prices, which further dampens activity and contributes to keeping inflation elevated. Heightened uncertainty triggers a reassessment of risk, with higher risk premiums and falling asset prices.
In the scenario, the extensive weather events precipitate an abrupt shift in international climate policy. The shift triggers a reassessment of risk and a global reallocation of capital, with sizeable declines in asset prices – particularly in carbon-intensive sectors.
The abrupt climate policy shift acts like a negative supply shock internationally, amplifying the economic consequences of extreme weather events. As carbon prices rise sharply and new climate policy requirements apply, some of the current production becomes unprofitable without new investment. In addition, rapidly rising prices for eg energy and freight contribute to disruptions in value chains and higher consumer prices. For Norway as a petroleum exporter, the downturn is amplified by the fact that higher carbon prices and changing preferences lead to a fall in oil demand. Oil prices fall to around USD 35 per barrel and remain at that level in 2028 and 2029,11 well below the five-year average of USD 75. Lower export revenues and reduced activity in the petroleum sector and among suppliers contribute to a further weakening of the economy. A weaker krone partly offsets the decline in activity but also adds to inflationary pressures.12
Overall, the shocks lead to a broad downturn in the Norwegian economy. Activity declines markedly, while inflation rises somewhat (see Table 2.1). Unemployment increases to 4.6% in 2028. Together with tighter financial conditions, this contributes to a decline in property prices.
Table 2.1 Macro-economic aggregates in the stress scenario13
|
2026 |
2027 |
2028 |
2029 |
|
|---|---|---|---|---|
|
GDP mainland Norway (Annual change. Percent) |
1.4 |
-2.2 |
-4.0 |
1.1 |
|
CPI-ATE (Annual change. Percent) |
3.3 |
3.3 |
4.6 |
3.9 |
|
Corporate lending rates (Level. Percent) |
6.6 |
7.6 |
7.8 |
6.9 |
|
Registered unemployment (Level. Percent) |
2.1 |
3.5 |
4.6 |
4.1 |
|
Oil prices (Level. USD) |
6514 |
60 |
35 |
35 |
|
CRE prices (Annual change. Percent) |
2.2 |
-10.9 |
-26.7 |
-15.0 |
|
House prices (Annual change. Percent) |
4.0 |
-14.1 |
-10.1 |
-2.3 |
|
Credit (C2) to households (Annual change. Percent) |
4.7 |
0 |
-2 |
1 |
|
Credit (C2) to mainland NFCs (Annual change. Percent) |
5.4 |
-0.8 |
-4.5 |
0.5 |
|
Total credit losses (Level. Percent)15 |
0.2 |
1.9 |
2.9 |
2.0 |
|
Countercyclical capital buffer (Level. Percent) |
2.5 |
0 |
0 |
0 |
Banks incur losses from multiple sources
In the climate stress test, banks’ customers are affected through a number of channels.16 Direct channels that lead to increased losses can eg be the need to protect property against extreme weather or to adapt to new emission taxes.17 Indirect effects arise from weaker economic activity, declining property prices, higher costs and increased uncertainty. Overall, banks’ loss rates on exposures to corporate and household exposures increase substantially (Chart 2.7a).18
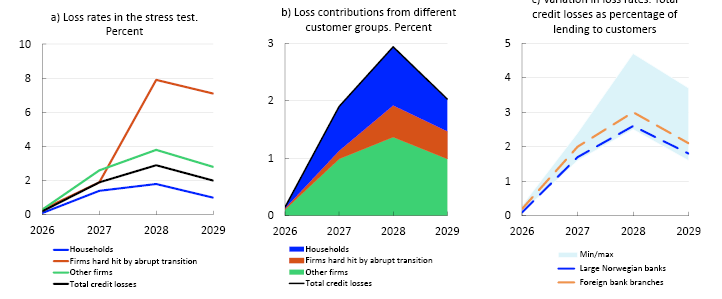
The abrupt shift in climate policy poses additional challenges for certain sectors. There is evidence that sectors with high emissions but subject to low climate-related taxes20, eg the transport, energy, processing and primary sectors, are the most exposed.21 In the stress test, nine22 such sectors are identified as particularly vulnerable, and exposures to these sectors account for around 16% of banks’ total corporate portfolio23 included in the stress test. It is assumed that loss rates in these sectors may become substantially higher than in other sectors (Chart 2.7a, red line).24
Banks’ loss rates increase markedly in 2028 for firms heavily affected by an abrupt transition (Chart 2.7a), but the largest contribution to the increase in banks’ total credit losses is related to the other firms and particularly CRE, which accounts for a substantial share of banks’ balance sheets (Chart 2.7b).
Wide variation in exposure across banks means some banks are hit harder
Most banks in the stress test have substantial corporate exposure, but the share ranges between 30% and 100% of customer lending. Banks’ exposure to sectors that are severely affected by abrupt transition range between 0% and 30% of banks’ corporate portfolios. Foreign bank branches in Norway tend to operate more specialised business models than Norwegian banks, with a higher share of loans to firms and/or sectors that may face high transition costs. As a result, the overall increase in losses is somewhat higher for branches (Chart 2.7c).
Earnings under pressure – exposure to climate-sensitive sectors increases risk
Substantial losses and falls in the value of financial instruments weaken banks’ earnings through the stress period. High levels of net interest income provide banks with a buffer against losses, but earnings are reduced somewhat by higher funding costs and weaker debt-servicing capacity among customers. Earnings are weakest among banks with low net interest income, a high share of corporate lending and substantial exposure to sectors that may face high costs related to the abrupt transition. As a result, exposure to climate-sensitive firms constitute an additional risk factor for banks, alongside other relevant risks.
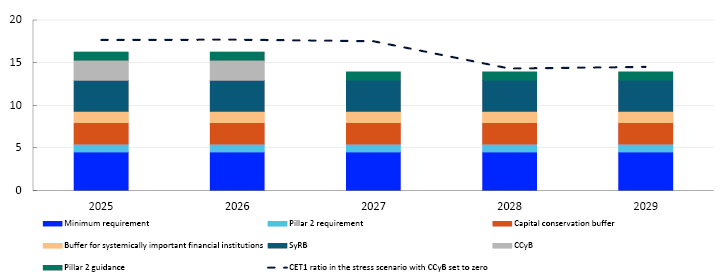
Negative earnings reduce banks’ CET1 capital, at the same time as risk weights increase due to higher credit risk and further weaken CET1 capital ratios (Chart 2.8).25 Overall, CET1 ratios are reduced substantially due to increased stress (Chart 2.9, red bar). The large Norwegian banks dampen the decline in capital adequacy by curtailing new lending and increasing lending margins, which amplifies the downturn in the Norwegian economy. The credit tightening raises CET1 ratios (Chart 2.9, light blue bar), and capital ratios therefore remain above the 13.9% requirement (Chart 2.8).
The weighted capital requirements and CET1 ratio in the stress scenario. Percent26
Capital buffers increase banks’ lending capacity
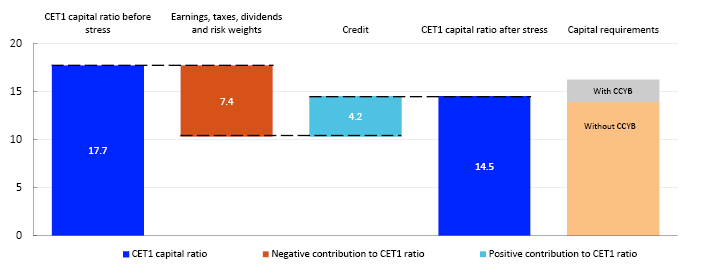
The climate stress test shows that exposures to sectors with high emissions increase the risk of losses. By emphasising climate transition in their risk analyses, banks can reduce their own risk and contribute to their financing supporting a more resilient economy ahead of severe climate events to a greater extent. The stress test also shows that capital buffers are a useful instrument for preventing banks from tightening credit standards in response to large losses and binding capital requirements. A reduction in the countercyclical capital buffer can release capital and provide scope for increased bank lending. The faster transition to zero-emission operations requires substantial investment by firms and depends on ample access to credit.
In the stress scenario, the countercyclical capital buffer requirement is lowered, which allows banks to maintain lending activity. Had the countercyclical capital buffer requirement been maintained at 2.5%, banks would have had to tighten lending considerably more to meet the buffer requirement (Charts 2.9 and 2.10).
CET1 ratio, capital requirements and contributions to change in CET1 ratio27
Cumulative credit growth in the stress period. Percent28

Banks’ capacity to maintain interest margins and customers’ capacity to service debt in the event of a downturn are uncertain. A sensitivity analysis shows that banks would need to tighten lending considerably more to remain above the capital requirement if losses were to increase by a further one third and net interest margins were simultaneously reduced by a total of 30 basis points (see sensitivity analysis 1 in Chart 2.10). Should a reduction in the countercyclical capital buffer prove insufficient, the systemic risk buffer could be reduced. A reduction of 2 percentage points would offset much of the necessary tightening of lending resulting from weaker earnings and binding capital requirements, giving banks greater scope for lending (see sensitivity analysis 1 in Chart 2.10).
Stress test results are nuanced when differences in how banks are affected are taken into account. Losses among foreign bank branches are somewhat higher overall. In the climate-triggered stress scenario, there is evidence to suggest that the banking group to which the branch belongs will also incur losses in other countries, including in the home country. This adds to uncertainty about how banking groups will react to large losses in Norway. Groups may choose to prioritise lending in their home markets and reduce lending in host countries. If groups tighten lending at their branches in Norway, as observed during the global financial crisis, the overall credit contraction could become pronounced (see sensitivity analysis 2 in Chart 2.10).29 While reduced buffer capital may enable domestic banks to absorb some customers displaced from foreign bank branches, the effect on total credit supply is uncertain.
10 Network for Greening the Financial System (NGFS) (2025), NGFS Short-Term Climate Scenarios: Technical Documentation, Version 1.0, May. The NGFS has not published figures for Norway. In addition to adapting the scenarios, Norges Bank has made assumptions about oil price developments.
11 The impact on oil prices of the attack by the United States and Israel on Iran in late February is assumed to be temporary.
12 For further discussion of the effects of climate change on the exchange rate, see Akram, F.Q. (2024) “Climate risk and the Norwegian exchange rate”. Staff Memo 14/2024. Norges Bank.
13 Figures for 2026 are included as a reference and are in line with the projections elsewhere in this Report and in Monetary Policy Report 1/2026. For corporate lending rates in 2026, lending margin remain unchanged from 2025.
14 Oil prices in 2026 denote the level observed in January 2026.
15 Total losses on lending to households and non-financial corporates in percent is the sum of lending to the sectors. For the macro bank.
Sources: Eiendomsverdi AS, Entra, Finn.no, Jones Lang LaSalle (JLL), Labour and Welfare Administration (NAV), Macrobond, Real Estate Norway, Statistics Norway, S&P Capital IQ and Norges Bank
16 For a more detailed description of how a climate-triggered downturn affects Norwegian banks, see Johansen, R.M. and H. Solheim (2026): “Fra klimautløst stress til strammere kredittpraksis i bankene” [From climate-triggered stress to tighter bank credit practices] (forthcoming, in Norwegian only). Blog post published on Bankplassen blogg on 12 May 2026 (Norwegian only). Norges Bank.
17 Approximately 11.5% of current housing values are located in areas exposed to weather and climate-related damage, particularly flooding and stormwater intrusion (see detailed discussion in Solheim, H. and B.H. Vatne (2025) “Damage caused by weather and climate change: Identifying homes in areas exposed to weather-related risks in Norway”. Staff Memo 12/2025. Norges Bank. Even with an expansion of these risk zones, direct losses related to declining housing values are likely to remain relatively small.
18 The level of credit losses in the stress test is based on a number of quantile vector autoregression (VAR) models. For a more detailed description, see Alstadheim, R., N. Maffei-Faccioli, R.M. Johansen and T.A.K. Marøy (2025) “From averages to tail effects: A VAR Quantile Regression Analysis of Credit Losses in Norway”. Staff Memo 14/2025. Norges Bank. The model has also been expanded to include property price developments. The estimates have also been cross-checked against a simple rule for loss levels in international crises, see Hardy D.C and C. Schmieder (2013) “Rules of Thumb for Bank Solvency Stress Testing”. IMF Working Paper 13/232. IMF.
19 Period: 2026–2029.
Figures for the six largest Norwegian-owned banking groups and three branches of foreign banks. Loss rates are defined as credit losses as a percentage of lending to the sector or industries. Total credit losses is the sum of lending to households and non-financial enterprises.
20 Export-oriented firms in particular currently typically pay low carbon taxes.
21 For further details on the analysis of how banks’ corporate exposure is affected by higher emission taxes, see Hjelseth, I.N., R.M. Johansen, and H. Solheim (2024) “Firms’ transition to lower greenhouse gas emissions and the risk in Norwegian banks”. Staff Memo 3/2024. Norges Bank.
22 The nine sectors comprise upstream petroleum industry (crude oil and natural gas extraction, associated services and pipeline transport), domestic sea transport, supply and other sea transport offshore services, ocean transport, air transport, metals, rubber and plastics manufacturing, non-metallic mineral product manufacturing, timber, wood and paper product manufacturing, oil refining, chemical and pharmaceutical industry, and mining and quarrying.
23 In addition to the six largest Norwegian-owned banking groups (DNB Bank, SpareBank 1 Sør-Norge, Sparebanken Norge, SpareBank 1 SMN, SpareBank 1 Østlandet and SpareBank 1 Nord-Norge), the stress test includes large branches and subsidiaries in Norway of three foreign banks (Nordea, Handelsbanken and Danske Bank). Separate capital adequacy figures are not reported for branches. Norges Bank’s capital adequacy estimates therefore exclude branches.
24 Experience from the oil price fall in 2014 showed that a number of firms encountered difficulties in servicing debt, resulting in extraordinarily high losses in the petroleum sector (see Hjelseth, I.N. (2020) “Nye tap på utlån til oljeleverandørnæringen” [New losses on exposures to the oil service industry]. Published on the Bankplassen blog on 7 May 2020 (Norwegian only). Norges Bank.
25 Risk weights are assumed to increase particularly for exposure to vulnerable sectors. Higher credit risk resulting from climate-related changes is reflected in somewhat higher average risk weights for property and sectors heavily affected by abrupt transition. The increase is based on the framework by Andersen H. and H. Winje (2017) “Average risk weights for corporate exposures: what can 30 years of loss data for the Norwegian banking sector tell us?” Staff Memo 2/2017, Norges Bank, and on sector-level average risk weights drawn from the Financial Supervisory Authority of Norway exposure database.
26 Period: 2025–2029.
The individual elements of CET1 capital requirement is presumed unchanged after 31 December 2025, with the exception of the countercyclical capital buffer rate in the stress scenario. Bank-specific requirements have been weighted together.
27 Period: 2026–2029.
The CET1 contributions are calculated based on a linear approximation. The contributions are measured in percentage point deviations from the contributions in normal times. Capital requirements excluding the countercyclical capital buffer consist of minimum requirements, Pillar 2 requirements, the capital conservation buffer, the buffer for systemically important banks, the systemic risk buffer and the capital margin requirement.
28 Period: 2027–2029.
Total cumulative deviation from trend credit growth for banks and covered bond mortgage companies. Assumed trend set at 3.5%. Calculations based on numbers for the six largest Norwegian-owned banking groups and three branches of foreign banks. Calculations show the extent to which the large banks in the aggregate must tighten lending to meet the capital requirement. The response in credit standards and lending margin to changes in capital requirements and increased losses is based on the Basel Committee on Banking Supervision (2010) “Interim Report: Assessing the Macroeconomic Impact of the Transition to Stronger Capital and Liquidity Requirements”. Technical report, Bank for International Settlements., Andersen, H., Gerdrup K., Johansen, R.M. and Krogh, T. (2019) “A macroprudential stress testing framework”. Norges Bank Staff Memo 1/2019 and adjustments so that the selected banks in the aggregate meet the capital requirement overall.
29 Foreign bank branches have historically shown more volatile lending growth than Norwegian banks. See Turtveit, L.T. (2017) “Branches of foreign banks and credit supply”. Economic Commentaries 3/2017. Norges Bank. Post-pandemic credit growth was weaker for foreign bank branches than for Norwegian banks. See Financial Supervisory Authority (2024) “Resultatrapport for finansforetak 2024” [Financial institutions performance report 2024] (in Norwegian only).
Norwegian banks are liquid and well equipped to withstand stress in funding markets. The global situation is marked by substantial geopolitical unrest, and the framework for international cooperation appears to be more unpredictable than before. This increases the risk of market stress that could spill over to the Norwegian banking sector. Norges Bank’s analyses show that, in times of severe market stress, when funding markets cease to function, banks may face liquidity challenges somewhat further out, primarily in NOK.
3.1 Norwegian banks satisfy regulatory liquidity requirements by an ample margin
The liquidity regulations require banks to maintain a liquidity reserve that can cover liquidity outflows in a stress situation, a stable funding structure and prudent liquidity management. Under the minimum Liquidity Coverate Ratio (LCR) requirement, banks must hold a liquidity portfolio that is sufficient to meet their liquidity needs for 30 days in a funding market stress scenario. The Net Stable Funding Ratio (NSFR) requires banks to fund illiquid assets with long-term or stable funding. The NSFR defines the ratio between the value of funding assumed to be stable and the value of assets and off-balance sheet exposures assumed to require stable funding, based on defined factors.1
Banks are well equipped to withstand market stress
The minimum LCR is 100% for all currencies in total. Furthermore, banks with a foreign currency funding share above 5% must also meet LCR requirements for each individual currency. The Financial Supervisory Authority of Norway sets these requirements individually for each bank. Banks meet LCR requirements in individual currencies by an ample margin (Chart 3.1). This means that they are well equipped to meet any short-term liquidity needs with liquidity reserves.
Percent2

The composition of the liquidity reserves has changed in recent years (Chart 3.2). Banks now hold less central bank reserves in foreign currency and more foreign government securities in their liquidity reserves. This is because banks, to a greater extent than previously, place liquidity in short-term repurchase agreements (repo lending) in exchange for foreign currency government securities that form part of their liquidity reserves. As the ultimate means of settlement for interbank payments, central bank reserves are the most liquid asset. Government securities are also highly liquid assets and can be pledged as collateral when borrowing central bank reserves. They are also considered to be the type of security that can be sold most easily without a significant decline in value in the event of market stress. These changes are therefore likely to have only a marginal effect on banks’ liquidity.
Value after haircut. In billions of NOK3

Funding structure has become more stable
Banks’ short-term funding is mainly in foreign currency. Since short-term funding must be refinanced frequently, it will typically need to be rolled over in periods of difficult funding conditions. Short-term foreign currency funding declined in the years following the financial crisis and around the introduction of the LCR and NSFR liquidity requirements (Chart 3.3, left panel). In recent years, funding in foreign currency with a residual maturity of between 1 and 12 months has increased slightly, while the shortest funding in foreign currency has remained around the same level.

A more stable funding structure makes banks less vulnerable to sudden funding shortfalls. The minimum NSFR requirement is 100%, and Norwegian banks reported an NSFR of 121% at end-2025. Defined here as the sum of customer deposit funding, equity and debt securities with more than 12 months’ residual maturity, the share of stable funding has increased substantially since the financial crisis (Chart 3.3, right panel), primarily reflecting an increased share of long-term debt securities and equity. Banks’ adjustments are largely due to the experience gained during the financial crisis and the international regulatory regime established in its wake.
1 For more information, see Financial Stability Report 2014 pages 18–19, and the Financial Supervisory Authority of Norway’s web pages on liquidity (the latter in Norwegian only).
2 Period: January 2017–February 2026.
Figures for the six largest Norwegian-owned banking groups. Highest consolidation level.
For banks with significant currencies other than NOK, the LCR requirement for NOK is usually 50%. A currency is considered significant if 5% or more of the bank’s debt is in that currency.
3 Period: March 2023–February 2026.
Figures for the six largest Norwegian-owned banking groups.
Highest consolidation level.
4 Period: 2008 Q1–2025 Q4.
All Norwegian banks and covered bond mortgage companies.
Right panel:
Stable funding is defined here as customer deposits, debt securities with more than 12 months’ residual maturity and equity.
Customer lending excluding reverse repos.
3.2 Banks are well equipped to withstand foreign currency liquidity stress
Norwegian banks hold foreign currency assets and obtain a large share of their market funding abroad. The liquidity and funding of the Norwegian banking sector is therefore influenced by developments in international financial markets, including the bond market, foreign exchange (FX) market and US money market.
Banks fund NOK assets with foreign currency debt
Banks borrow in foreign currency, mainly to fund lending in NOK, lending in foreign currency and liquid assets in foreign currency. Around 21% of bank assets and 32% of funding are in foreign currency (Chart 3.4). Banks therefore convert some long-term foreign currency funding to NOK in the FX swap market, which provides them with the NOK they need to fund lending in NOK at the same time as they hedge against losses on exchange rate movements.
As a percentage of the balance sheet. 31 December 20255

FX swaps enable banks to obtain funding in one currency against collateral in another. Banks borrow in NOK against foreign currency when the swap is entered into and must therefore provide NOK when the swap matures. Some FX swaps have shorter maturities than the foreign currency funding, but in normal times, these swaps are rolled over until the funding matures. If the bank chooses not to roll over the swap or cannot find a willing counterparty, the bank will receive foreign currency at maturity. This can be used to cover foreign currency debt that matures further out. As the FX swaps were initially used to fund lending in NOK, the bank will then have to obtain NOK through other means. In practice, this means that banks’ use of FX swaps carries a potential liquidity risk in NOK and not in foreign currency.
Furthermore, FX swaps require the posting of margins for the duration of the contract when the exchange rate moves. This means that exchange rate movements can impact the liquidity needs of Norwegian banks and other financial market participants. A stronger NOK results in liquidity outflows for banks and liquidity inflows for their counterparties, which in FX swaps are typically asset managers such as mutual funds and insurance companies. In the event of unrest and high exchange rate volatility, such liquidity effects could in turn have ripple effects on the financial system. For more details on how movements in the krone exchange rate affect the liquidity needs of financial system participants (see Financial Stability Report 2025 H1).
Short-term foreign currency debt is offset by liquid and short-term assets
Mismatch between the maturities of banks’ assets and liabilities is a source of liquidity risk. Although banks have considerable short-term funding in foreign currency, they also hold assets in foreign currency that are highly liquid or have short maturities. Such assets can be used to meet short-term obligations if banks fail to roll over their funding. A substantial share of these assets comprises banks’ foreign currency liquidity reserves. In addition, banks place liquidity in short-term repurchase agreements (reverse repo) and hold short-term claims on credit institutions (Chart 3.5). The large share of liquid and short-term assets indicates that banks are well equipped to withstand foreign currency liquidity stress. If banks are unable to roll over short-term wholesale funding in foreign currency, this will nevertheless lead to stress in the domestic money market.
In billions of NOK. At 31 December 20256
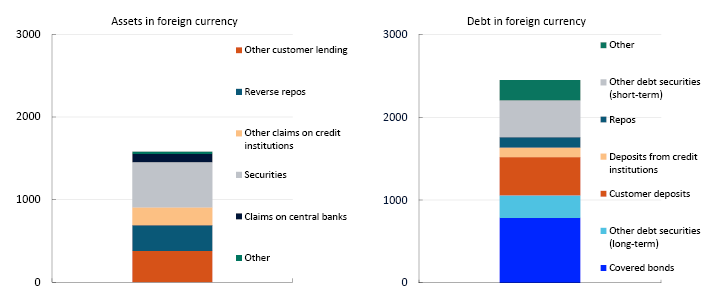
Banks also hold long-term assets in foreign currency, such as FX loans to Norwegian firms. During periods of stress, the focus of banks’ corporate customers will in particular be whether their bank can meet necessary financing needs and offer other banking services. In order to maintain customer relationships, banks will likely seek to offer the services their customers demand. In the event of shortfalls in banks’ foreign currency funding, they must obtain corresponding funding in NOK and exchange the funding in the FX swap market. Should banks nevertheless be unable to obtain sufficient foreign currency funding, they may be forced to reduce exposures or terminate individual customer relationships, eg by selling loans to other institutions or failing to roll over maturing loans. This may impact banks’ reputations and future earnings and reduce Norwegian firms’ access to credit.
5 All Norwegian banks and covered bond mortgage companies.
6 All Norwegian banks and covered bond mortgage companies.
Equity not included.
Other debt securities comprise debt securities except covered bonds. Other debt securities (short-term) are defined as debt securities with up to 12 months’ residual maturity. Other debt securities (long-term) are defined as debt securities with more than 12 months’ residual maturity.
3.3 Market stress impacts banks differently in NOK and foreign currency
It is important that banks are resilient to shocks to avoid liquidity problems, also in individual currencies. The liquidity stress testing framework is applied to examine the effects of different conditions that can impact banks’ liquidity and funding in NOK and foreign currency, respectively. Two sets of assumptions have been defined about stress in funding markets and deposit funding (see «Sensitivity analysis assumptions»). According to the market stress assumptions, banks’ funding markets cease to function with some deposit runs, in particular by larger firms. The loss of confidence assumptions combine banks’ funding markets ceasing to function with severe deposit runs, by both households and firms.
Sensitivity analysis assumptions
Table 3.1 shows two different sets of assumptions used by Norges Bank in the bank sensitivity analyses. Both cases assume a sharp fall in the value of liquidity reserves and no lending growth. In the analyses of the macro bank’s (the six largest Norwegian-owned banks) liquidity position under stress by currency, results are shown both with and without the assumption that FX swaps are rolled over.
The analyses are illustrative, and the model is partial in the sense that the situation of banks does not have a feedback effect on the behaviour of other market participants. No adjustments or actions by the central bank or other authorities are assumed.
Net liquidity position is defined as liquidity reserves after a fall in value adjusted for inflows and outflows based on banks’ contractual maturities and assumptions about these maturities. Underlying data is from the maturity ladder in the CRR reporting as at 31 December 2025.
Table 3.1 Sensitivity analysis assumptions
|
0–30 days |
1–3 months |
4–6 months |
|
|---|---|---|---|
|
Percentages specify the share of contractual payments that will not be refinanced |
|||
|
Market stress |
|||
|
Repos and interbank deposits |
100 % |
100 % |
100 % |
|
Covered bonds |
100 % |
100 % |
100 % |
|
Other short-term papers and bonds |
100 % |
100 % |
100 % |
|
Deposits from households and SMEs |
0 % |
0 % |
0 % |
|
Operational deposits |
0 % |
0 % |
0 % |
|
Other deposits |
5 % |
5 % |
10 % |
|
Loss of confidence |
|||
|
Repos and interbank deposits |
100 % |
100 % |
100 % |
|
Covered bonds |
100 % |
100 % |
100 % |
|
Other short-term papers and bonds |
100 % |
100 % |
100 % |
|
Deposits from households and SMEs |
20–35 % |
5 % |
5 % |
|
Operational deposits |
25 % |
10 % |
10 % |
|
Other deposits |
35–40 % |
15 % |
7 % |
|
Percentages specify fall in value |
|||
|
Liquidity reserves |
|||
|
Central bank reserves |
0 % |
||
|
Government securities etc. (Level 1) |
5% |
||
|
Covered bonds (Level 1) |
10 % |
||
|
Other |
15–50 % |
||
Even though banks are unable to obtain foreign currency funding in periods of market stress, FX swaps provide foreign currency liquidity
If banks’ funding markets are assumed to cease to function (market stress), banks’ foreign currency liquidity situation will deteriorate faster than in terms of NOK (Chart 3.6). This is due to banks holding relatively more short-term market funding in foreign currency than in NOK. Liquidity outflows between two and six months are mainly driven by banks having substantial short-term unsecured debt in foreign currency that matures in this period.
Market stress. Macro bank. Net liquidity position in billions of NOK7
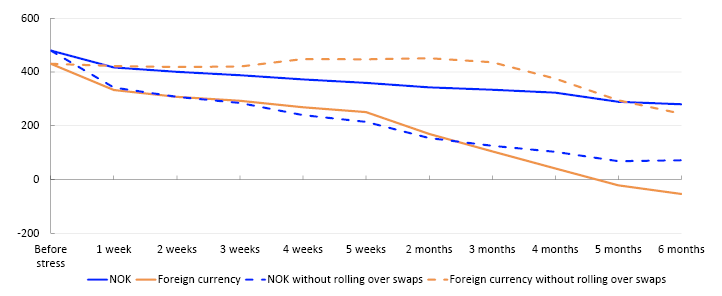
Banks hold large positions in the FX swap market, and assumptions about the rollover of FX swaps will therefore have a significant impact on the stress test results. If a bank does not roll over the swaps, they will mature. This will result in FX liquidity inflows and liquidity outflows in NOK, and the net liquidity position changes considerably (see shift to broken lines in Chart 3.6). Given this assumption, the macro bank will need NOK liquidity before it needs FX liquidity. Even though the liquidity position defined herein remains positive, banks will likely face liquidity problems in NOK as banks require a certain level of liquid assets for regulatory purposes. They also have to maintain their function in the payment system and in other settlements and activities. The analysis illustrates the overall situation for banks, but there will be variations across banks, and individual banks may face substantial difficulties and others may be in a better position.
Severe deposit stress results in large liquidity outflows in NOK
If we assume that the macro bank is impacted by a severe run on deposits at the same time as funding markets cease to function (loss of confidence), liquidity outflow will be much larger in NOK than in foreign currency. In the analysis, individual banks’ outflows resulting from deposit runs are aggregated, without making assumptions about where customers move their deposits. Foreign-currency customer deposits will disappear from the Norwegian banking sector if customers transfer funds to other banks abroad. On the other hand, NOK customer deposits will to a large extent remain in the Norwegian banking sector as competition for these deposits from foreign banks will be limited. NOK deposits can nevertheless be moved to other groups of banks, such as Norwegian branches of foreign banks or small banks. The analysis therefore overestimates the overall effect of deposit stress on the macro bank, but it can illustrate the effect on an average individual bank. The impact on individual banks may also be more severe, depending on their business models.
The macro bank’s net liquidity position is weakened more rapidly in NOK than in foreign currency (Chart 3.7). Deposits amount to around 50% of debt in NOK but only to about 20% of debt in foreign currency, and liquidity outflows in NOK are therefore larger in this scenario. In line with the results in Chart 3.6, the assumption that FX swaps are not rolled over will result in liquidity outflows in NOK and FX inflows, thereby increasing the need for liquidity in NOK (see broken lines in Chart 3.7). The results of the stress testing framework therefore show that banks need liquidity in NOK sooner than their need for FX liquidity. This is the case both if funding markets cease to function and in the event of a run on deposits.
Loss of confidence. Macro bank. Net liquidity position in billions of NOK8

It is first and foremost the responsibility of banks to manage their liquidity risk, and this is underpinned in Norges Bank’s liquidity policy (see «Central bank certificates strengthen attainment of liquidity policy objectives»). Banks must adjust their balance sheets to manage substantial risk without receiving emergency liquidity assistance from the central bank. The analyses in this Report assume no explicit measures by Norges Bank or other authorities. The results show that the macro bank is well equipped to withstand funding shortfalls, and liquidity needs will likely arise in NOK before foreign currency. As the lender of last resort, Norges Bank can provide extraordinary liquidity to the banking system as a whole or to individual banks and thereby help prevent financial problems from spreading and escalating into major crises.
7 Based on reporting as at 31 Dec. 2025
Net liquidity position shows aggregated residual liquidity reserve following sales/pledging and a fall in value, based on assumptions in table 3.1. For broken lines, all FX swaps are assumed to mature without being rolled over at contract maturity.
8 Based on reporting as at 31 Dec. 2025
Net liquidity position shows aggregated residual liquidity reserve following sales/pledging and a fall in value, based on assumptions in table 3.1. For broken lines, all FX swaps are assumed to mature without being rolled over at contract maturity.
3.4 Large and small banks are affected differently by market stress and deposit stress
Funding structures and business models differ between different groups of banks and affect how banks are impacted by various forms of liquidity stress. Norges Bank’s analyses illustrate how different groups of banks are affected in different ways by various forms of liquidity stress.
The impact of market stress is more pronounced for large banks
Banks with a substantial share of market funding will be affected to a greater extent by financial market stress than banks with a large share of deposit funding. With the assumption that funding markets cease to function (market stress), large banks9 will be most affected (Chart 3.8, left panel), as these banks typically have a higher share of market funding than small banks that have more deposit funding.
All groups of banks are severely affected by large deposit runs
Banks with a high share of deposit funding can be severely affected by a deposit run. Around half of Norwegian bank deposits are guaranteed and are normally considered a stable source of funding for banks, providing bank customers with solid insurance against deposit loss. If confidence in a bank is lost, deposits may nevertheless be rapidly withdrawn. Norwegian retail and wholesale customers often have accounts at more than one bank, and opening an account at another bank is easy. Experience from the banking turmoil in 2023 shows that increased digitalisation can contribute to faster deposit outflows than in the past.10 Although deposits in the Norwegian banking sector as a whole are not expected to fall sharply in a deposit run scenario, shifts in deposits between different groups of banks may be considerable.
The Bank’s analyses indicate that, compared with market stress, a severe run on deposits results in a greater need for liquidity for all groups of banks. If a severe run on deposits is assumed while funding markets cease to function (loss of confidence), small and medium-sized banks reach a negative net liquidity position before large banks do (Chart 3.8, right panel). This is because small and medium-sized banks typically have a larger share of deposit funding than large banks. The results illustrate that for all groups of banks, regardless of size, a substantial need for liquidity could arise if a large share of deposits is lost.
Net liquidity position as a percentage of initial liquidity reserves11
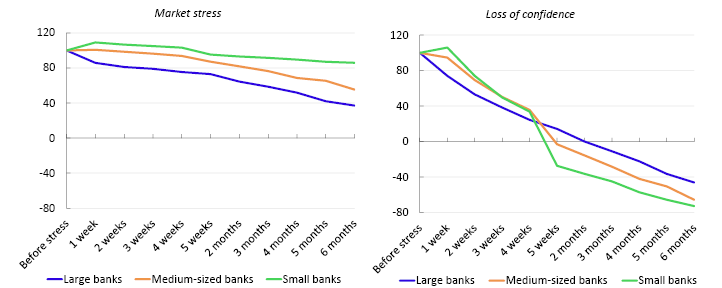
It is beneficial for society in general that banks can transform short-term household savings into long-term loans to households and firms. Given the nature of banks’ business models and the role they play in the financial system, banks will assume liquidity risk. Banks reduce liquidity risk through sound risk management and diversification. Among other things, they receive deposits from many different depositor groups and obtain market funding with different maturities from both Norwegian and international markets. Obtaining funding from multiple markets may also provide access to cheaper funding. In addition, banks hold liquidity reserves to meet maturities and manage periods of market stress. Banks’ liquidity requirements set a minimum standard to dampen liquidity risk. The results of analyses covered in this section suggest that Norwegian banks are well equipped to withstand funding market stress.
9 Large banks are those included in the macro bank, medium-sized banks are those with total assets exceeding NOK 10bn and small banks are those with less than NOK 10bn in total assets.
10 See eg FSB (2024) “Depositor Behaviour and Interest Rate and Liquidity Risks in the Financial System. Lessons from the March 2023 banking turmoil”.
11 Based on reporting as at 31 Dec. 2025
Net liquidity position shows aggregated residual liquidity reserve following sales/pledging and a fall in value in percent of the banking group’s original liquidity reserve, based on assumptions in Table 3.1.
Large banks are defined as the six largest Norwegian-owned banking groups (the macro bank), medium-sized banks are those with total assets exceeding NOK 10bn and small banks are those with total assets of less than NOK 10bn.
Central bank certificates strengthen attainment of liquidity policy objectives
Structural liquidity has increased markedly in recent years. This has resulted in Norges Bank assuming more of the liquidity risk in the financial system. In order to strengthen attainment of the liquidity policy objective that financial risk should be borne by private market participants as far as possible, Norges Bank has chosen to issue central bank certificates.1
Consequences of high structural liquidity
Structural liquidity is the level of banks’ deposits in Norges Bank prior to market operations and is primarily determined by transactions in and out of the government’s account with Norges Bank. When private agents pay direct and indirect taxes to the government, or when the government issues government securities, deposits are transferred from the banks’ accounts with the central bank to the government’s account with the central bank. This results in lower structural liquidity. Conversely, when the government transfers money to the money-holding sector2, for example wages, benefits and other transfers, and when government securities mature, deposits are transferred from the government’s account with the central bank to the banks’ accounts with the central bank. This results in higher structural liquidity.
Norges Bank uses a quota system in its liquidity management. The quota system consists of two elements. The first is that Norges Bank ensures that the total supply of central bank reserves, banks’ sight deposits in the central bank, is kept at a certain level by either supplying liquidity through F-loans against collateral or by withdrawing liquidity through F-deposits (time deposits). The second is that banks are remunerated at the policy rate on a certain quantity of central bank reserves. Central bank reserves in excess of the quota are remunerated at a lower interest rate. The quota system thereby incentivises banks to redistribute central bank reserves between themselves in the money market and to manage their liquidity risk. This promotes financial stability by strengthening banks’ ability to manage liquidity shocks without being supplied with extraordinary liquidity from Norges Bank.
With the marked increase in structural liquidity in recent years, the quota system no longer sufficiently incentivises banks to actively manage their liquidity. Structural liquidity was at low levels for a long period. Since 2022, structural liquidity has increased markedly and is now just over NOK 150bn (Chart 3.A). The main reason for the increase is the fact that the government has borrowed less than its borrowing requirement.3 When structural liquidity exceeds NOK 40bn, Norges Bank will offer F-deposits. However, banks have shown little willingness to bid for long-term F-deposits and central bank reserves have been withdrawn using short-term F-deposits. During liquidity shocks, banks adapt by adjusting the bid volume in Norges Bank’s auctions. Norges Bank therefore ends up replacing the market in banks’ very short-term liquidity management. Activity in the interbank overnight market has also fallen clearly in pace with higher structural liquidity (Chart 3.A).
Structural liquidity and volume in NOWA. In billions of NOK4

As banks have strengthened their liquidity by increasing short-term F-deposits in Norges Bank, they also have less need to hedge against liquidity shocks by tying up their funding in market funding or time deposits.5 This pulls in the direction of lower money market premiums because banks’ willingness to pay for more long-term funding declines. Nibor is the most commonly used money market rate in NOK. When banks quote Nibor, they normally assume the interest rate they can fund themselves in USD and the cost of exchanging USD into NOK in FX swaps. Nibor can be decomposed into an expected policy rate and a risk premium, and the risk premium will partly depend on the scarcity premium on NOK against USD in FX swaps.6 This scarcity premium has fallen clearly across maturities (Chart 3.B). The scarcity premium in the first half of 2025 was the same regardless of maturity, whereas previously there was a maturity premium. Following the announcement of the certificate programme in autumn 2025, the maturity premium increased somewhat.
NOK/USD scarcity premium in the FX swap market. Percentage points7

High structural liquidity also contributes to higher deposits in banks by the money-holding sector. The money-holding sector may want to move their money into securities or other investments to achieve better returns, which will also push down premiums on other money market investments.
Lower money market premiums imply that depositors and other investors receive little additional return from tying up their money over time. The result may be that banks and other financial system participants rely more on short-term funding.
High structural liquidity may therefore, over time, make the financial system more vulnerable to liquidity shocks despite banks initially becoming more liquid. This is a result of both a weakening of banks’ ability to redistribute liquidity and handle liquidity shocks, as Norges Bank gradually takes over the market’s role in managing short-term liquidity shocks, and as banks and other financial system participants shift towards more short-term funding.
Grounds for choice of central bank certificates
Norges Bank has decided to issue 1 and 3-month central bank certificates to withdraw some of the surplus liquidity. The Bank will continue to manage short-term liquidity fluctuations with F-loans and F-deposits. The first central bank certificate auction was held on 5 May. Norges Bank will offer a total volume outstanding of up to NOK 79bn in 2026.
Given that the volume of available central bank reserves is declining, the need to withdraw surplus liquidity through F-deposits will be reduced. This means that the extent to which banks can draw on liquidity in Norges Bank will be reduced, and banks will have to use the market to a greater extent to manage liquidity risk. As central bank certificates are considered liquid assets under the liquidity regulations, banks’ LCR will not be significantly affected if they buy certificates corresponding to the F-deposits they lose.8 At times, there will also be a need for F-loans to supply liquidity. Such loans will therefore remain a normal part of liquidity management for Norges Bank and banks. It is important to Norges Bank’s contingency preparedness that banks are both able and willing to participate in operations to supply liquidity.
Central bank certificates will also be available for investment in the money-holding sector. This sector will then have an alternative to bank deposits and other money market investments. Banks must therefore offer terms that can compete with those of central bank certificates if they wish to keep the deposits.
Through the channels mentioned above, the issuance of central bank certificates helps strengthen the market’s role in pricing liquidity when structural liquidity is high. This strengthens the attainment of liquidity policy objective and promotes financial stability.
1 For a further description of why Norges Bank chose to issue central bank certificates, see Norges Bank (2025) “Consultation – Issuance of central bank certificates”. 10 October 2025.
2 The money-holding sector comprises households, non-financial corporates, local government administration and financial institutions other than banks and mortgage companies.
3 The government primarily borrows to finance net lending from government lending schemes through the Norwegian State Educational Loan Fund, the Norwegian State Housing Bank, the Norwegian Public Service Pension Fund residential mortgage programme, Innovation Norway and Export Finance Norway.
4 Period: 1 February 2022–6 April 2026.
The chart shows the development as a two-month centered moving average, calculated based on daily data from 4 January 2022 to 6 May 2026.
5 In mechanistic terms, higher structural liquidity makes banks more liquid. On banks’ balance sheets, the increase in short-term F-deposits on the asset side is offset by customer deposits on the liability side. F-deposits with short maturities can be included when calculating banks’ compliance with the liquidity coverage ratio (LCR). Customer deposits normally have an outflow rate of less than 100% in the LCR regulations. Overall, this strengthens banks’ LCR.
6 For a closer description of the scarcity premium, see Hagen, M. and K. Stiansen (2023) “Does structural liquidity have a greater impact on the Nibor premium than earlier?” Staff Memo 14/2023. Norges Bank
7 Period: 7 January 2022–6 May 2026.
One-week moving average.
8 Central bank certificate purchases increase banks’ liquid assets (numerator), while lower volumes of F-deposits increase net outflows (denominator). If LCR equals 100%, the percentage increase in liquid assets and net outflows (denominator) will be equal and LCR will remain unchanged.
The term non-bank financial institutions (NBFIs) or intermediaries includes not only traditional asset managers, such as insurance, pension funds and various other funds, but also hedge funds and other special purpose vehicles (SPVs) – eg for securitisation. Some NBFIs and banks are becoming increasingly interconnected. Increasing interaction between banks and lightly regulated NBFIs may be a source of financial system vulnerability. The Norwegian financial system is dominated by banks and traditional asset managers, but to comprehensively assess risk in the financial system, the authorities must monitor NBFI developments and have sufficient access to information about banks’ NBFI exposure.
4.1 The financial system is becoming more interconnected and complex
In recent years, both in Norway and in many other countries, total assets held by NBFIs have increased more than total assets held by banks.1 These institutions play an important role in the financial system by managing risk and channelling savings into loans, but their significance varies substantially across countries. Norway mainly has traditional asset managers and a financial system dominated by banks with very limited direct lending from NBFIs to Norwegian non-financial corporates (see box on page 18 in Financial Stability Report 2025 H2).
Both traditional and new varieties of NBFIs can assume, transform or transfer risk from the banking sector to other market participants. The risk can thereby be transferred to participants that are better equipped or are more willing to bear such risk, which can strengthen competition and dampen financing costs (Chart 4.1).
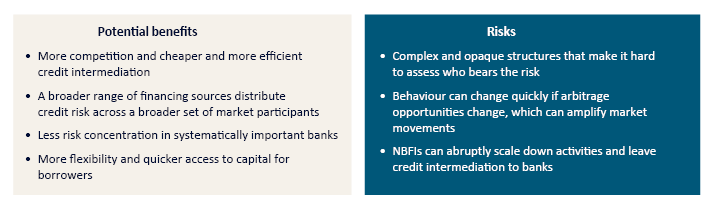
While NBFIs contribute to efficient and cheaper financing, they can exploit regulatory differences by establishing bespoke organisational structures with limited transparency. Such structures may entail opaque risk exposures and high loan-to-value (LTV) ratios. Trading strategies can change abruptly if market conditions change, and this can in turn amplify market movements and have a broad impact.
An increase in complex activities, combined with incomplete information, may make it more difficult for market participants to exert effective market discipline. This makes it more demanding to gain an overview of banks’ exposures, which may include exposures to losses, funding sources and liquidity, as well as off-balance sheet exposures. If NBFIs abruptly scale down their activities eg by reducing their supply of financing or credit insurance, financial stability will depend on banks’ capacity to take over lending and provide risk mitigation to creditworthy customers, at the same time as banks themselves must have access to stable funding.
Highly leveraged hedge funds is a growing ownership category in the Norwegian covered bond market. This market is important, both for bank liquidity and residential mortgage financing in Norway. Furthermore, if synthetic securitisation becomes more widespread or if the importance of private credit increases, credit risk in the Norwegian financial system will migrate away from banks. This section examines these trends in more detail.
1 See Financial Stability Board (2025) “Global Monitoring Report on Nonbank Financial Intermediation, 2025”.
4.2 Foreign hedge funds have become more important in the Norwegian covered bond market
Banks own each other’s bond debt
Banking groups issue both unsecured and secured bonds. Covered bonds are a specialised form of secured bonds. In addition to being an important source of funding, covered bonds amount to around half of banks’ liquidity reserves (Chart 4.2). The composition of liquidity reserves in NOK has been relatively stable, and the vulnerability inherent in the fact that one bank’s funding is another bank’s liquidity reserve remains (see «Key vulnerabilities in the Norwegian financial system»). Fire sales of covered bonds may be triggered if many banks experience liquidity difficulties simultaneously. This may make it more difficult for banks to obtain new funding in the covered bond market, which in turn may amplify liquidity and funding problems.
Liquidity reserve by asset type in NOK. Value after haircut2

NBFIs are an important investor category for bank funding
Although there are signs that banks are reducing their covered bond holdings, they remain the largest investor category (Chart 4.3). Another major investor category is Norwegian NBFIs, which predominantly consist of asset managers, with an ownership share of about 15%. NBFIs also hold just over half of banking groups’ unsecured bonds. Asset managers can, like other investors, be forced to conduct fire sales of securities under severe market stress, which may lead to a further fall in securities prices and amplify market stress. In 2020, during the pandemic, sales took place as a result of substantial variation margin requirements in foreign exchange (FX) swaps.
Investors in the Norwegian covered bond market. Percentage3

Norwegian asset managers’ holdings have declined in recent years, both in the covered bond market and in the market for unsecured bank bonds. This development is not necessarily due to reduced interconnectedness between banks and NBFIs, but partly due to some Norwegian mutual funds having moved their operations abroad. The funds have therefore been reclassified as foreign funds, although they still operate in the Norwegian market.
Increased ownership by foreign alternative investment funds (AIFs, hedge funds) has also contributed to the strong growth in the share of covered bonds issued in NOK held by foreign entities. With an increasing share of foreign owners, the investor base becomes less sensitive to events particular to Norway but also more exposed to international market stress. Norwegian markets will then become more interconnected with developments in international financial markets. Foreign hedge funds now own more than 20% of covered bonds (Chart 4.4), and the foreign sector’s share of some covered bond mortgage companies’ issuances is considerably higher (Chart 4.5).
Hedge funds’ share of outstanding covered bonds issued in NOK. Percent4
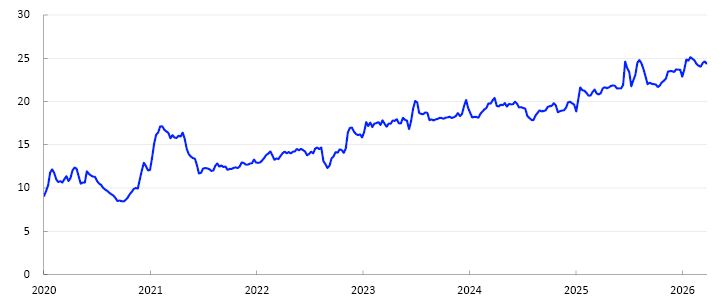
As at 31 March 2026 in NOK. Percent5

Hedge funds finance covered bond purchases through repurchase agreements (repos) from Nordic banks. Repos enable these funds to be highly leveraged and may make them vulnerable to market stress. In addition, hedge funds’ financing is short-term, meaning that refinancing problems can arise quickly. Concentration risk is also considerable as a small number of large foreign hedge funds account for a substantial share of activity (see Financial Stability Report 2025 H1, page 17).
If hedge funds have to reduce risk and conduct fire sales of covered bonds, the result could be large fluctuations in the covered bond market and other parts of the Norwegian bond market. This may impact the funding conditions of Norwegian banks and other issuers. Market stress caused by fire sales may make it more difficult for banks to obtain new funding in the covered bond market. Covered bonds form part of Norwegian banks’ liquidity reserves and are used as collateral in secured transactions. A depreciation of the market value of covered bonds will also reduce the collateral value of the liquidity reserves, which may then amplify liquidity and market stress (see Section 3).
There are several factors limiting the risk of large-scale fire sales of covered bonds. A number of hedge funds have redemption limitations that can reduce the risk of large withdrawals by unit holders in stress periods. Experience shows that the largest funds have also acted as long-term investors and did not, for example, contribute to sell-offs during the pandemic. Banks have hedged against default and repo loss as the agreements are collateralised by covered bonds, in addition to a haircut on the loan amount. Hedge funds must also post margin over the term of the repos when covered bond prices change, limiting the credit risk banks are exposed to when financing hedge funds. However, banks and investors must take into account that large price fluctuations and refinancing difficulties can arise if a large share of covered bonds issued in NOK have to change hands quickly in a situation with market stress and fire sales. Banks need to maintain a funding structure that takes into account that funding markets can cease to function for a period.
Market participants are themselves responsible for helping to ensure that the Norwegian covered bond market can withstand shocks. For example, banks can influence the investor base in their issuances to ensure sufficient diversification.
2 Period: January 2017–December 2025.
Figures for all Norwegian banks.
Highest consolidation level.
3 Period: 2015–2025.
Ownership composition for bonds issued by mortgage companies. Nominal value, holdings.
4 Period: 1 January 2020–31 March 2026.
Outstanding covered bonds in NOK are adjusted for banks’ own holdings.
The raw data for the table are daily data but are shown in the chart as the weekly average. Observations have been converted to average per week.
5 The share of Norwegian covered bonds in NOK used in repos between reporting dealers in Norges Bank’s money market data (RPD) and the foreign sector.
Outstanding covered bonds in NOK are adjusted for banks’ own holdings.
4.3 Insurance against credit losses can be provided through synthetic securitisation
Lower risk of credit losses results in lower capital requirements
The EU’s Securitisation Regulation with amended capital requirement rules came into force in summer 2025 and allows banks, under specified rules, to transfer loan portfolio credit risk to external investors (see «Key terms in the banking regulation relating to risk transfer»).6 Lower credit risk provides banks with regulatory capital relief. Banks can, for example, use the capital that is freed up to fund new lending. External investors are willing to assume the risk of losses on banks’ loan portfolios if payments from banks are sufficiently high.
Regulatory amendments have contributed to more secure securitisations today than they were during the 2008 financial crisis.7 Compared with the financial crisis, there are now higher capital requirements for securitisations, ownership rules to ensure a closer alignment of banks’ and investors’ interests and increased standardisation and information to supervisory authorities and investors.
Key terms in the banking regulation relating to risk transfer
SRT – Significant Risk Transfer
Under the Capital Requirements Regulation, the bank shall not be subject to regulatory capital requirements for the credit risk in a portfolio if significant credit risk associated with the underlying exposures has been transferred to third parties. Such significant transfer of credit risk takes place through securitisation of loan portfolios, either as traditional or synthetic securitisation.
The supervisory authorities assess each individual securitisation. In order for securitisation to be approved as a significant transfer of risk, the risk reduction in the bank must be greater than the regulatory capital relief, and the external investors’ share of the tranches must exceed the minimum limits specified in the regulations.
Traditional securitisation
In traditional securitisation, the loan portfolio is transferred from the bank to a Securitisation Special Purpose Entity (SSPE). The SSPE finances the purchase of the loan portfolio by issuing debt securities divided into tranches to absorb losses in the event of default in the order of their seniority.
Synthetic securitisation
In synthetic securitisation, the loan portfolio remains on the bank’s balance sheet, but the risk of credit losses is transferred to a third party (investor). Synthetic securitisation is comparable to an insurance policy where credit losses are covered by the investors. The bank pays a premium for investors to assume this credit risk. The investors absorb losses in accordance with the seniority of the tranches they have chosen.
Tranche
In securitisation, tranche refers to the underlying portfolio and indicates the tranche’s order of priority and share of total losses it will absorb.
Scope of risk transfer is increasing in Europe
The scope of synthetic securitisation has increased in the EU in recent years (Chart 4.6) and is more widely used in the EU than in other regions, including the US.
Underlying loan portfolios. In billions of EUR8

The portfolios that have been securitised in the EU are mainly corporate loans (60%), around half of which are loans to small and medium-sized enterprises (SMEs) (Chart 4.7), followed by residential mortgages (13%), commercial real estate (CRE) loans (12%) and consumer credit (7%).
The largest investors are private credit funds, other investment funds, insurance firms and pension funds (Chart 4.8).
Cumulative, 2017 to 2024 H1. Percentage shares

Percentage9
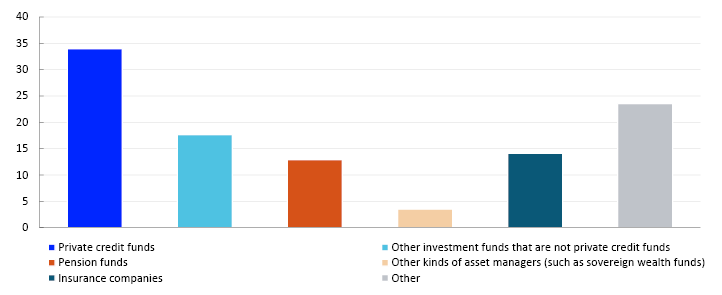
What is the potential for synthetic securitisation?
The amount of regulatory capital freed up by securitisation depends on several factors, such as the risk of the underlying portfolio, whether the securitisation can be classified as simple, transparent and standardised (STS) and which tranches the bank holds once the securitisation is completed. The first tranche to absorb credit losses (the junior tranche) has a risk weight of 12.5, The mezzanine tranche has a somewhat lower risk weight, but normally higher than the risk weight of the loans on the bank’s balance sheet. The senior tranche has the lowest risk weight, often considerably lower than the risk weight of the loans on a bank’s balance sheet. The bank must pay a higher premium on the tranches with the highest risk of losses. A risk weight of 12.5 indicates that the amount must be fully financed with equity. If the investor is not a financial institution subject to capital requirements, such as a fund, there is no capital requirement for holding the junior tranche.
Analyses performed by the IMF show that synthetic securitisation provides regulatory capital relief of 50–80% of what the requirement would be without such securitisation.10 For example, securitisation of residential mortgage portfolios in the amount of NOK 100bn would halve the regulatory capital requirement from NOK 3.75bn to NOK 1.88bn if the bank had a CET1 capital requirement of 15%.11
What are the financial stability consequences of synthetic securitisation?
Banks are required to hold capital to cover unexpected losses. Losses can arise as a result of a number of types of risk, such as credit risk, market risk and operational risk. When banks’ credit risk is reduced by being transferred to external investors, credit risk is diversified away from banks. Such a risk transfer is facilitated in the capital adequacy framework. In this connection, it is important to note that banks’ SRT transactions must meet the quantitative rule, ie that risk reduction must exceed regulatory capital relief.12
To safeguard against systemic risk, a floor has been set for average risk weights in IRB banks of 0.25 for residential mortgages and 0.35 for commercial real estate mortgages in Norway. Under synthetic securitisation, banks can achieve significantly lower risk weights than these floors. In isolation, this does not increase systemic risk. The purpose of risk weight floors is to ensure banks’ loss-absorbing capacity, and securitisation transfers risk away from banks.
If banks organise their operations to ensure that a share of total lending remains securitised at all times, capital adequacy could fall sharply if situations arise where the opportunity to continue to securitise loans is reduced or lost. This could happen if financial market stress makes investors unwilling to insure against credit risk. Another scenario in which capital adequacy could fall sharply is if investors default and total credit risk is transferred back to the bank.
It is important that the authorities know the identity of holders of risky tranches in securitisations and if there is any interconnectedness between these investors and banks. It is unfortunate if banks finance investors’ tranche purchases or if investors expect to obtain loans from banks in the event of liquidity problems. It is also important that financial markets have an overview of banks’ actual credit risk and their exposure to these investors. Such information facilitates the correct pricing of bank equity and debt. During the financial crisis, uncertainty surrounding risk in banks’ securitisations resulted in a widespread decline in bank valuations.
To ensure financial stability, it is important that the authorities continue to monitor credit risk in banks and the securitised portfolios and the linkages between banks and NBFIs that are typically investors in securitisations. Furthermore, it is important to ensure market discipline through banks providing the market with accurate information about their securitisations.
6 The Securitisation Regulation (EU 2017/2042) and the revised capital requirements of the Capital Requirements Regulation for securitisations (EU 2017/2041) came into force in Norway on 1 August 2025.
7 The G20 countries have spearheaded the work to amend the Securitisation regulations. For an evaluation of this work, see Financial Stability Board (2025) “Evaluation of the Effects of the G20 Financial Regulatory Reforms on Securitisation”, 22 January. The reforms have been implemented over several years. See Box 2 in the aforementioned report for a discussion of the role played by securitisation in the financial crisis. The regulatory amendments are also described in more detail in Cortes, F., G. Fernandez Dionis, Y. Li, S. L. Ramirez and X. Zhang (2025) “Recycling Risk: Synthetic Risk Transfers”, IMF Working Papers 25/200.
8 Period: 2016–2024.
Activity in the EU is almost exclusively concentrated in the euro area countries. Other regions include Latin America, Asia, supranational regions (same region) and unknown. The data do not include US agency CRTs.
Source: International Association of Credit Portfolio Managers (IACPM), Global SRT Bank Survey 2016–2024, iacpm.org, reproduced with permission from IACPM.
9 The percentages are calculated by EBA and based on banks’ reported investor participation in past and recent transactions.
10 See page 15 in Cortes, F., G. Fernandez Dionis, Y. Li, S. L. Ramirez and X. Zhang (2025) “Recycling Risk: Synthetic Risk Transfers”, IMF Working Papers 25/200.
11 A simplified calculation sets the capital requirement without securitisation here at NOK 3.75bn with a risk weight of 0.25 (100x0.25x0.15).
12 This test is called a “commensurateness test”, see eg page 22 of F. Gonzalez and C. Morar Triandafil (2023), The European significant risk transfer securitisation market, ESRB Occasional Paper Series No 23.
4.4 Private credit growing internationally but still modest in Norway
The private credit market has grown markedly internationally
Private credit can be defined as all lending provided by non-banks. Here, the term private credit is limited to corporate lending directly provided by credit funds.13
According to estimates from BIS, global volumes of outstanding direct and asset-based lending from credit funds have increased from around USD 90bn in 2010 to around USD 1250bn in 2024 (Chart 4.9).14 Funds domiciled in the US are by far the largest provider of this type of credit, but lending from private credit funds has also increased in Europe in recent years. Norway is in the process of implementing European regulation that permits such lending on a far greater scale than is currently the case.
In billions of USD15

Several factors have contributed to the emergence of private credit funds. Lower interest rates globally over several years and stricter banking sector regulation following the financial crisis are emphasised as important structural drivers.16 The growth in private credit has continued in spite of higher interest rates in many countries after 2022, partly reflecting firms’ willingness to pay for more flexible, and in many cases maybe more easily available, financing compared with traditional bank loans and public credit markets. Around 70% of borrowers in the private credit market – measured as the number of firms – are owned by or have received financing facilitated through private equity funds, underlining the close linkages between private credit and private equity.17
Investors in credit funds are mainly pension funds, insurance companies and state investment funds. These market participants can accept long lock-in periods. Up until the pandemic, funds were organised as either exchange-traded funds or closed-end funds, entailing limited liquidity risk. Since the pandemic, there has been a shift towards so-called semi-liquid fund structures, in which individual investors make up a larger share of the investor base. These structures provide investors with the opportunity to redeem some of their investment in stipulated periods, even though the investment is placed in illiquid assets.
Since the second half of 2025, there have been periods of turbulence in the private credit market. Low transparency and higher default rates by some borrowers led to a number of investors starting to pull out of the market. Several semi-liquid funds have reported liquidity problems and introduced redemption limitations. In the international private credit market, this has on the whole contributed to uncertainty about valuation, liquidity and risk concentration. Although private credit operates outside the traditional banking system, banks may have indirect exposure through credit lines and other financing facilities to private credit funds.18 According to the IMF19, bank lending to NBFIs has increased considerably in recent years, and banks may be exposed to losses if private credit borrowers default.20 This dependency could result in private credit market stress spilling over to the traditional banking system.
The IMF has pointed out that private credit is a growing, but so far limited, international financial stability vulnerability, partly because the most problematic structures, such as semi-liquid funds aimed at private investors, still account for a moderate share of the market.
Limited but increasing activity in Norway
Private credit in Norway has so far been limited, and mapping the market is difficult as there is no systematic reporting. There is a scarcity of Norwegian providers, and Norwegian firms mostly receive such financing from foreign credit providers, in particular providers based in the UK and the US.
Private credit funds in Norway are structured as alternative investment funds (AIFs). Current regulations limit the opportunity for direct lending from private credit funds, but an upcoming amendment to the Alternative Investment Fund Managers Directive (AIFM 2.0) will introduce new rules to expand the opportunity to provide loans through AIFs (see Financial Stability Report 2025 H2 for further details). The introduction of AIFMD 2.0 may therefore help open the market to more Norwegian and European participants.
Data from the LSEG (London Stock Exchange Group), supplemented by information provided in meetings with market participants, enable partial mapping of the current situation. Norges Bank’s findings show that around 35 private credit transactions were carried out in Norway in the period 2017–2025, most of them after 2022 (Chart 4.10). According to available data, total private credit from foreign providers to Norwegian companies amounted to just under NOK 20bn in 2025. It is important to emphasise that this figure shows new loans issued in 2025 and not the total outstanding volume. International figures often shown in charts and statistics generally refer to total volumes and are therefore not directly comparable to Norwegian figures.
In billions of NOK21

As seen internationally, many private credit borrowers in Norway are owned by private equity funds. In addition, there is a clear tendency for a number of the loans to be issued in connection with major acquisitions.
In such transactions, which often involve substantial loan volumes, firms have traditionally sought financing through syndicated bank loans, partly combined with bond financing.22 However, private credit enables borrowers to access substantial capital without public disclosure, which may be an important motivation for preferring private credit over bond financing. When private credit replaces bank and bond financing in major acquisitions, credit risk shifts to market participants outside the traditional banking system.
Private credit does not currently pose a threat to financial stability in Norway
A broader range of financing sources may strengthen stability in the Norwegian financial system by distributing credit risk across a broader set of market participants. Increased competition between lenders may improve market efficiency and innovation, and reduce operating costs, but at the same time, more private credit may entail vulnerabilities. Private credit funds do not have access to central bank lending facilities23, and the structures are often complex, with limited transparency, making it difficult to gain an overview of total lending volumes and assess channels for the materialisation of risk.
Banks may be directly or indirectly exposed to several different private credit providers. On the whole, the scale of private credit is very modest in Norway.24 The exposure of the Norwegian banking sector to such structures also appears to be very limited. Nevertheless, data availability issues limit the opportunity to accurately monitor funds’ domestic and cross-border exposures, emphasising the need for improved reporting in this area.
13 The European regulations define such funds as Alternative Investment Funds (AIFs), while other terms are used for US funds and other funds outside the EEA. In Norway, such funds are regulated by the AIF Act. The Norwegian definition is close to the definition used in work by the Bank for International Settlements (BIS).
14 Avalos, F., S. Doerr and G. Pinter (2025) “The global drivers of private credit”. BIS Quarterly Review, March, pp 13–30.
15 Period: 2010–2024.
16 See eg International Monetary Fund (2024) “The Rise and Risks of Private Credit”. Chapter 2 of the Global Financial Stability Report. IMF, April 2024.
17 International Monetary Fund (2024) “The Rise and Risks of Private Credit”. Chapter 2 of the Global Financial Stability Report. IMF, April 2024.
18 International Monetary Fund (2024) “The Rise and Risks of Private Credit”. Chapter 2 of the Global Financial Stability Report. IMF, April 2024.
19 International Monetary Fund (2025) Global Financial Stability Report: Shifting Ground beneath the Calm. IMF, October 2025.
20 Fillat, J., M. Landoni, J. Levin and J. C. Wang (2025) “Could the Growth of Private Credit Pose a Risk to Financial System Stability?” Current Policy Perspectives 25-8. Federal Reserve Bank of Boston.
21 Period: 2017–2025.
22 Aramonte, S. and F. Avalos (2021) “Private markets: a primer”. Box in BIS Quarterly Review, December.
23 International Monetary Fund (2024) “The Rise and Risks of Private Credit”. Chapter 2 of the Global Financial Stability Report. IMF, April 2024. See also International Monetary Fund (2023) “Nonbank Financial Intermediaries: Vulnerabilities amid Tighter Financial Conditions”. Chapter 2 of the Global Financial Stability Report. IMF, April 2023, about the role of central banks as non-banks’ lender of last resort.
24 For more information on private credit in Norway, see Iden, A.E., T.F. Tho and I.L. Tobiassen (2026) “Private credit in Norway”. Staff Memo 4/2026. Norges Bank.
Annex
Important regulations and measures
Table 1 Important regulations and measures in Norway’s financial system
|
Category |
Instrument |
First introduced |
Current level |
|---|---|---|---|
|
Deposit guarantee scheme |
Guarantee of retail and commercial deposits in Norwegian banks1 |
1996 |
NOK 2m per depositor per bank2 |
|
Credit standards requirements for mortgages and other secured loans3 |
Tolerate higher interest rate (stress test) on total debt |
20154 |
A 7% interest rate or a 3-percentage point interest rate increase, whichever is higher |
|
Maximum loan-to-value (LTV) ratio |
20154 |
90%. Additional collateral is permitted |
|
|
Principal repayment requirement |
20154 |
2.5% a year with LTV above 60% or as a 30-year amortising loan |
|
|
Maximum debt-to-income (DTI) ratio |
2017 |
5 times gross income |
|
|
Flexibility quota5 |
2015 |
10% for loans secured on dwellings (8% in Oslo). |
|
|
Credit standards requirements for consumer credit6 |
Tolerate higher interest rate (stress test) |
20194 |
A 7% interest rate or a 3-percentage point interest rate increase, whichever is higher |
|
Principal repayment requirement |
20194 |
Monthly principal repayment, maximum term 5 years |
|
|
Maximum debt-to-income (DTI) ratio |
20194 |
5 times gross income |
|
|
Flexibility quota5 |
2019 |
5% |
|
|
Risk-based capital requirements7 (share of risk-weighted assets8) |
Pillar 1 Minimum CET1 requirement |
2013 |
4.5% |
|
Pillar 1 Minimum Tier 1 requirement |
19919 |
6% |
|
|
Pillar 1 Minimum regulatory capital |
1991 |
8% |
|
|
Pillar 1 Combined buffer requirements: |
|||
|
Capital conservation buffer |
2013 |
2.5% |
|
|
Systemic risk buffer |
2013 |
4.5% |
|
|
Buffer for systemically important financial institutions (SIFIs) |
2015 |
1% for Kommunalbanken AS, Nordea Eiendomskreditt AS, Sparebanken Norge (from 31 March 2027) and SpareBank 1 Sør-Norge ASA, and 2% for DNB Bank ASA |
|
|
Countercyclical capital buffer |
2015 |
2.5% |
|
|
Pillar 2 requirements |
2007 |
Varies across banks |
|
|
Risk weighting for risk-based capital requirements |
Floor for average risk weights for residential mortgages |
2020 |
25% |
|
Floor for average risk weights for CRE mortgages |
2020 |
35% |
|
|
Leverage-based capital requirements7 (share of exposure measure) |
Leverage ratio |
2017 |
3% minimum requirement |
|
Liquidity requirements |
Liquidity Coverage Ratio (LCR) |
201510 |
100% |
|
LCR in individual currencies (Pillar 2 requirements) |
2017 |
Varies across banks |
|
|
Net Stable Funding Ratio (NSFR) |
2022 |
100% |
|
|
Minimum requirement for own funds and eligible liabilities (MREL)11 |
Loss absorption amount |
2019 |
Minimum requirement for regulatory capital + Pillar 2 requirements + combined buffer requirements12 |
|
Amount necessary for recapitalisation13 |
2019 |
Minimum requirement for regulatory capital + Pillar 2 requirements + combined buffer requirements excluding countercyclical capital buffer requirement |
|
|
Total MREL |
2022 |
Total MREL is described on page 116 of Norway’s Financial System 2025 |
|
|
Subordinated MREL |
2022 |
Subordinated MREL is described on page 117 of Norway’s Financial System 2025 |
|
|
Testing of financial sector cyber resilience |
TIBER-NO14 |
2022 |
Guidance for threat-based testing of financial sector cyber resilience. |
1 For deposits in Norwegian banks’ foreign branches, a limit of EUR 100 000 applies.
2 Additional amounts deposited following a particular life event, such as a home sale or insurance payout, are also covered in full up to 12 months. The guarantee does not cover deposits from credit or financial institutions or from public authorities.
3 From 1 July 2023, loans secured on collateral other than a dwelling, such as car and boat loans, will be covered by the regulation’s general DTI and debt-servicing capacity requirements.
4 Prior to being laid down in a regulation, the requirements were issued as guidelines, for residential mortgage loans in 2010 and for consumer credit in 2017.
5 Up to a certain percentage of the total value of new mortgage loans/consumer credit granted by banks each quarter may be loans in breach of one or more of the requirements. A separate flexibility quota for Oslo was introduced in 2017. A separate flexibility quota for loans secured on collateral other than housing was introduced in 2023.
6 Exemptions for equity release mortgages with LTV ratios below 90%, for credit cards with credit limits below NOK 30 000 and for loan refinancing as long as the value of the refinanced loan (and new loan costs) does not exceed the value of the existing loan (and previous loan costs).
7 See explanation of capital requirements in Norway’s Financial System 2025, Appendix 2.
8 A number of regulations have been introduced for banks’ calculation of risk weights, especially for residential mortgage loans.
9 In 2013, the minimum requirement increased from 4% to 6% when CRR/CRD IV were implemented in the Norwegian rules.
10 Applied to systemically important financial institutions from 2015 but was phased in for other firms in the course of 2017.
11 Liabilities eligible for MREL must be lower in priority than senior debt. However, before 1 January 2024, ordinary senior bonds issued before 1 January 2020 may also be used to satisfy MREL.
12 The loss absorption amount requirement is the larger of the leverage-based Tier 1 capital requirements and total risk-based capital requirement (minimum requirement, Pillar 2 requirements and buffer requirements). In Norway, the risk-based requirement is the more binding.
13 Applies only to banks subject to resolution and not liquidation under public administration.
14 TIBER-NO is the Norwegian implementation of TIBER-EU, which applies in the EU.
Sources: Finanstilsynet (Financial Supervisory Authority of Norway), Ministry of Finance, Norwegian Banks’ Guarantee Fund and Norges Bank.