Monetary policy assessment
The upswing in the Norwegian economy has continued. Since the September 2021 Monetary Policy Report, activity has risen further, and unemployment has fallen. Increased infection rates and extensive containment measures are expected to dampen activity in the near term. When infection rates subside further out and containment measures are eased, the economic upswing will likely continue. Rising wage growth and higher imported goods inflation are expected to push up underlying inflation ahead. The objective of stabilising underlying inflation around the target somewhat further out suggests that the policy rate should be raised towards a more normal level.
Norges Bank’s Monetary Policy and Financial Stability Committee decided to raise the policy rate from 0.25% to 0.5% at its meeting on 15 December. Based on the Committee’s current assessment of the outlook and balance of risks, the policy rate will most likely be raised further in March.
Increased spread of coronavirus dampens the global upswing
Economic activity among Norway’s trading partners has continued to rise. In 2021 Q3, GDP growth for trading partners overall was a little higher than projected in the September Report, and economic activity is now higher than pre-pandemic levels. Through autumn, the number of Covid cases has increased rapidly in Europe, and Covid restrictions have been tightened. At the same time, the Omicron variant is creating considerable uncertainty about the evolution of the pandemic. Against this background, economic growth among trading partners is expected to slow in the near term.
The rapid rise in demand and delays in the production and distribution of goods have resulted in long delivery times, a surge in freight rates and substantial price rises for some goods and services. Together with high energy prices, this has weighed on economic growth among trading partners and has fuelled a sharp rise in headline consumer price inflation in many countries. Inflation expectations have increased, and there are prospects that underlying inflation among trading partners will turn out higher than projected in the September Report.
Chart A Higher infection rates in many countries1 New cases per 100 000 inhabitants. Seven-day moving average 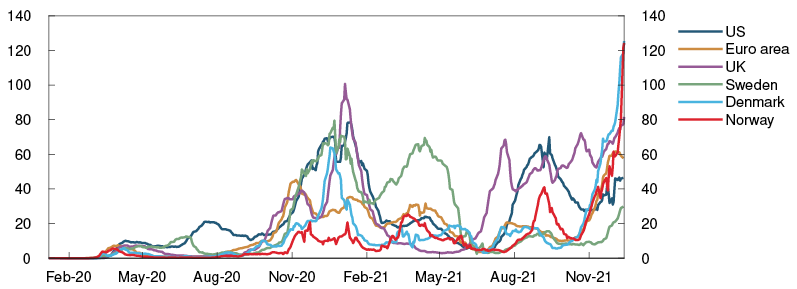
Prospects for higher inflation have contributed to lifting policy rate expectations among Norway’s main trading partners. Forward rates now indicate expectations that policy rates for a number of trading partners will be raised during 2022. Long-term government bond yields are little changed.
Gas prices have continued to rise, while oil prices are little changed since the September Report. Recently, higher infection rates and uncertainty about the new virus variant have led to financial market volatility. The krone has weakened and is now weaker than projected in September.
After the policy rate was raised to 0.25% in September, most banks have raised residential mortgage rates. Forward money market rates have edged lower since September but still indicate expectations of a further rise in the policy rate.
Chart B Expectations of a faster policy rate rise among trading partners2 Policy rates and estimated forward rates in selected countries. Percent 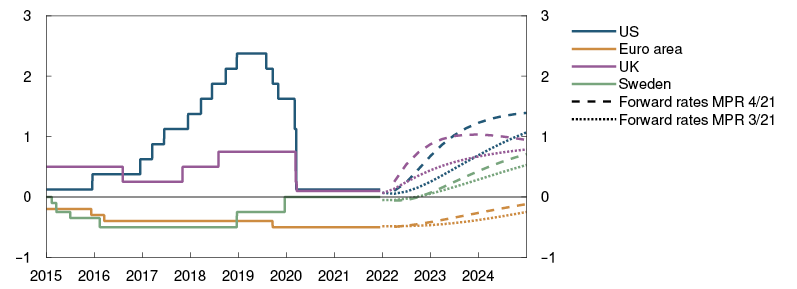
Increased infection rates and containment measures dampen activity in the Norwegian economy
The easing of Covid restrictions through the year has led to a marked upswing in the Norwegian economy, and activity is higher than prior to the pandemic. Mainland GDP has risen further through autumn and has been broadly as projected in the September Report. The upswing has been strongest in the service sector, which was severely affected by previous Covid restrictions.
In recent weeks, infection rates in Norway have reached a new peak since the onset of the pandemic. Covid-related hospitalisations have also risen and are now higher than in spring 2020. Extensive containment measures have been reintroduced to help limit virus transmission. The Government has also announced that a large portion of the population will receive a third vaccine dose in the coming months, which could reduce the need for protracted containment measures. The projections in this Report assume that infection rates will subside further out and that the containment measures will be gradually unwound through winter. However, it cannot be ruled out that the measures will apply for a longer period or that tighter measures will be required.
In November, Regional Network contacts reported a sharp rise in capacity utilisation and production constraints due to labour shortages and global supply chain disruptions. Together with higher infection rates and containment measures, this is will dampen economic activity in the near term, while there are prospects for a continued upturn thereafter. Household purchases of goods and services have rebounded over the past six months and have been higher than expected. Owing to limited spending options, households have accumulated substantial savings during the pandemic. This should provide room for continued solid growth in private consumption when infection rates subside further out and containment measures are eased. Service sectors are expected to account for much of the economic upswing in spring 2022.
Chart C Activity has risen further3 GDP for mainland Norway. Seasonally adjusted. Index. February 2020 = 100 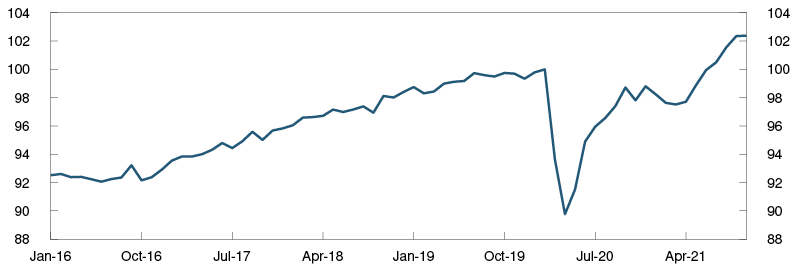
The labour market has continued to improve in pace with the increase in economic activity. Employment has risen more than projected in the September Report, and the number of job vacancies is at a high level. Seasonally adjusted registered unemployment has fallen a little more than expected and was 2.3% in November. The number of long-term unemployed has fallen. In the past week, the tightening of containment measures has led to new furlough notices, and unemployment will likely edge up in the near term.
The central government budget bill calls for somewhat lower petroleum revenue spending in 2022 than projected in the September Report. Since the budget was presented, the Government has announced support for households’ electricity bills. Fiscal policy support measures have also been reintroduced in connection with the tightening of containment measures, which will curb the economic impact of increased infection rates and pandemic-related restrictions.
Housing market activity remains high, but house price inflation has moderated. Through autumn, house price inflation and household credit growth have been broadly as expected. Housing investment has been lower than expected, which likely reflects a marked rise in construction costs.
Chart D Unemployment has fallen further4 Registered fully unemployed as a share of the labour force. Seasonally adjusted. Percent 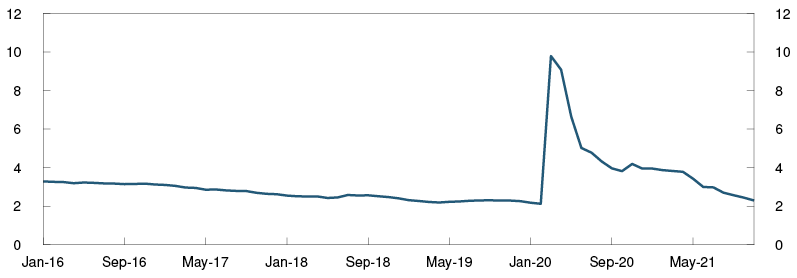
Expectations of higher wage and price inflation
Higher energy prices have led to a sharp rise in the overall consumer price index (CPI). Twelve-month CPI inflation was 5.1% in November, higher than projected in the September Report. Futures prices for electricity and fuel indicate that the 12-month rise in energy prices will moderate after the turn of the year and that CPI inflation may be somewhat lower into 2022.
Underlying inflation, as measured by the consumer price index adjusted for tax changes and excluding energy products (CPI-ATE), has declined since summer 2020. The rise in prices for both imported goods and domestically produced goods and services has slowed. In November, the 12-month rise in the CPI-ATE was 1.3%, a little higher than projected in the September Report. Other indicators of underlying inflation are slightly higher than the rate of increase in the CPI-ATE. Inflation expectations have also risen in Norway, especially at the one- to two-year horizon. In the period ahead, higher global prices and the surge in freight rates will likely push up imported inflation.
Current wage statistics indicate that wage growth has been broadly as expected, but high labour demand has likely pushed up wage growth a little towards the end of the year. Wage growth is therefore expected to be somewhat higher in 2021 than projected in the September Report. Wage expectations for 2022 have risen since September.
Chart E High consumer price inflation, but underlying inflation is low5 CPI and CPI-ATE. Twelve-month change. Percent 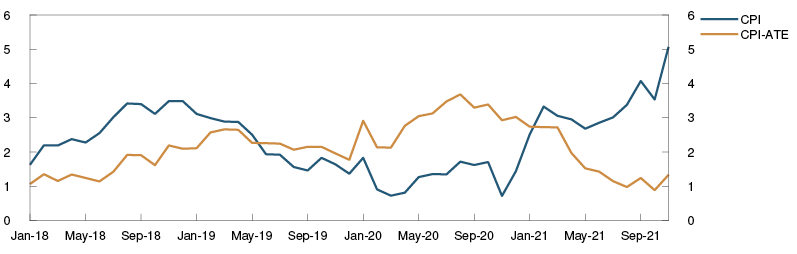
Gradual rate rise
The operational target of monetary policy is annual consumer price inflation of close to 2% over time. Inflation targeting shall be forward-looking and flexible so that it can contribute to high and stable output and employment and to countering the build-up of financial imbalances.
The upswing in the Norwegian economy has continued. Unemployment has fallen further, and capacity utilisation is estimated to be above a normal level. Increased infection rates and extensive containment measures are expected to dampen activity in the near term. When infection rates subside further out and containment measures are eased, the economic upswing will likely continue. Higher electricity prices have resulted in elevated CPI inflation, but underlying inflation is lower than tcapahe inflation target. Rising wage growth and higher imported inflation are expected to push up underlying inflation ahead.
Monetary policy is expansionary. In the Committee’s assessment, the objective of stabilising inflation around the target somewhat further out suggests that the policy rate should be raised towards a more normal level. A gradual normalisation of the policy rate is consistent with continued high employment. Higher interest rates will also help to counter a build-up of financial imbalances.
The policy rate forecast is little changed and indicates a rise in the policy rate to around 1.75% in the course of the coming years. With such a path for the policy rate, there are prospects that underlying inflation will move close to the target in 2022. Capacity utilisation is projected to decline in the near term, but to be above a normal level in the coming years.
Chart F Gradual rise in policy rate helps to achieve the objectives of monetary policy6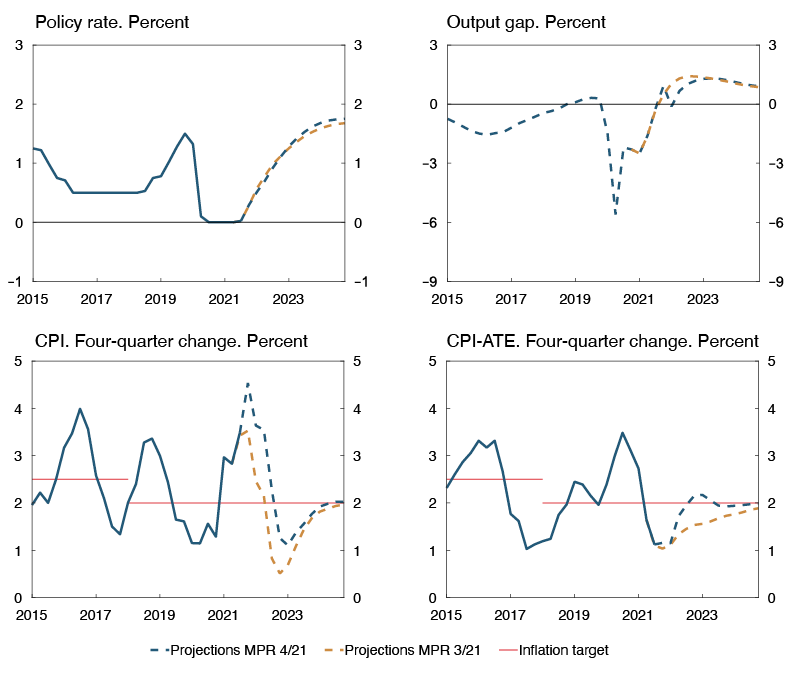
In its discussion of the balance of risks, the Committee was concerned with the potential economic effects of the pandemic and containment measures in the period ahead. If there is a need for more stringent and protracted containment measures that pull down economic activity through spring next year, further rate hikes may be postponed. The Committee was also concerned with a potentially higher-than-projected rise in domestic wages and prices due to capacity constraints and persistent global price pressures. If there are prospects of persistently high inflation, the policy rate may be raised more quickly.
The Committee decided unanimously to raise the policy rate to 0.5%. Based on the Committee’s current assessment of the outlook and balance of risks, the policy rate will most likely be raised further in March.
Øystein Olsen
Ida Wolden Bache
Øystein Børsum
Ingvild Almås
Jeanette Fjære-Lindkjenn
15 December 2021
1 Period: 7 January 2020 – 14 December 2021. Latest observation for US, euro area, and Sweden is 13 December 2021.
2 Period: 1 January 2015 – 31 December 2024. Daily data through 14 December 2021. Quarterly data from 2021 Q4 for MPR 3/21 and 2022 Q1 for MPR 4/21. Forward rates at 17 September 2021 for MPR 3/21 and 14 December 2021 for MPR 4/21. ECB’s deposit facility rate for the euro area.
3 Period: January 2016 – October 2021.
4 Period: January 2016 – November 2021.
5 Period: January 2018 – November 2021. CPI-ATE: CPI adjusted for tax changes and excluding energy products.
6 Period: 2015 Q1 – 2024 Q4. Projections from 2021 Q3 for MPR 3/21 and 2021 Q4 for MPR 4/21 for the policy rate, CPI and CPI-ATE. The output gap measures the percentage deviation between mainland GDP and estimated potential mainland GDP. CPI-ATE: CPI adjusted for tax changes and excluding energy products.
Assessment of the countercyclical capital buffer requirement
At its meeting on 15 December, Norges Bank’s Monetary Policy and Financial Stability Committee decided to increase the countercyclical capital buffer rate to 2.0%, effective from 31 December 2022. Based on the Committee’s current assessment of economic developments and the prospects for bank losses and lending capacity, the buffer rate will be raised to 2.5% in the first half of 2022.
Norges Bank sets the countercyclical capital buffer rate four times a year. The decision and assessment are presented in this Report. In its work on setting the buffer rate, Norges Bank exchanges relevant information and assessments with Finanstilsynet (Financial Supervisory Authority of Norway). Norges Bank’s framework for the countercyclical capital buffer is described in Norges Bank Papers 4/2019.
The objective of the countercyclical capital buffer is to bolster banks’ resilience and mitigate the amplifying effects of bank lending during downturns. Banks should build and hold a countercyclical buffer when financial imbalances are building up or have built up. In the event of an economic downturn that causes or could cause higher credit losses and a marked reduction in access to credit, the buffer rate should be lowered with a view to increasing banks’ lending capacity.
The countercyclical capital buffer rate was reduced from 2.5% to 1.0% in March 2020, in response to the Covid outbreak and pandemic-related restrictions that led to a sharp fall in activity in the Norwegian economy. In June 2021 and on the advice of Norges Bank, the Ministry of Finance decided to raise the buffer rate again to 1.5%, effective from 30 June 2022.
The upswing in the Norwegian economy has continued. Higher infection rates and extensive containment measures are expected to weigh on activity in the near term. When infection rates subside further out and containment measures are eased, the economic upswing will likely continue.
Creditworthy businesses and households appear to have ample access to credit. Banks have the capital and liquidity to maintain credit supply.
Norwegian banks are profitable. Banks’ credit losses increased in 2020 Q1 but have since declined appreciably. So far in 2021, overall losses have amounted to approximately 0.1% of total lending. Losses have been curbed by impairment reversals.
Losses ahead are expected to remain close to the average for the past 20 years. Extensive containment measures increase the uncertainty about the loss projections somewhat. A relatively small share of banks’ exposures is to industries that have been most directly affected by containment measures, limiting banks’ risk of losses. If there is a need for more protracted containment measures that can pull down economic activity, bank losses may rise.
Norwegian banks are well equipped to meet a higher countercyclical capital buffer rate while maintaining credit supply. The stress test in Financial Stability Report 2021 shows that banks’ loss-absorbing capacity is fundamentally sound, partly owing to the ample margin by which banks now satisfy capital requirements. A higher countercyclical capital buffer rate will contribute to maintaining banks’ loss-absorbing capacity.
Prior to the reduction in March 2020, the countercyclical capital buffer rate had been set at 2.5% against the background of a build-up of financial imbalances over a long period. Before the outbreak of the pandemic, the Committee judged that imbalances were no longer building up. Property price inflation had been moderate for several years, and household debt-to-income ratios had levelled off. During the pandemic, residential and commercial property prices have increased substantially, and household credit growth has accelerated. Over the past six months, property price inflation has been more moderate, partly owing to expectations of higher lending rates. It is the Committee’s assessment that the consideration of financial imbalances suggests a higher buffer rate.
At its meeting on 15 December, Norges Bank’s Monetary Policy and Financial Stability Committee unanimously decided to raise the countercyclical capital buffer rate to 2.0%, effective from 31 December 2022. Based on the Committee’s current assessment of economic developments and the prospects for bank losses and lending capacity, the buffer rate will be raised to 2.5% in the first half of 2022, taking effect one year later.
Øystein Olsen
Ida Wolden Bache
Øystein Børsum
Ingvild Almås
Jeanette Fjære-Lindkjenn
15 December 2021
1 The global economy
The rise in economic activity among Norway’s trading partners continued through summer. Low infection rates in many European countries contributed to strong growth in 2021 Q3, and aggregate trading partner GDP was above the pre-Covid level. In autumn, infection rates increased to record-high levels in several European countries and stricter containment measures were introduced. In addition, the new virus variant, Omicron, is generating considerable uncertainty. Together with long delivery times and sharply rising prices for many goods, this is expected to curb GDP growth in the coming quarters. Headline inflation has increased markedly in many countries, and the projection for underlying inflation in 2022 has been revised up considerably. Oil prices are approximately the same as in September, but gas prices have risen markedly. Market rates imply expectations of higher policy rates abroad in 2022.
High goods demand presents supply challenges
Low infection rates in many European countries in summer contributed to sustaining the recovery in Q3. Activity increased by about 2% in the euro area and Sweden between Q2 and Q3. Aggregate trading partner GDP growth in Q3 was slightly higher than projected in the September Report, and the level of activity was above the pre-Covid level (Chart 1.1).
Chart 1.1 GDP higher than pre-pandemic levels during 2021 Q31 GDP for trading partners. Index. 2019 Q4 = 100 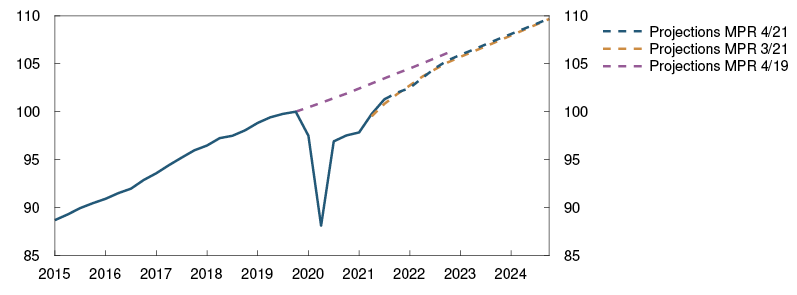
In recent weeks, infection rates have increased to record-high levels in the euro area and Denmark. UK infection rates have remained high since September. Stricter containment measures were introduced in several European countries in autumn. The health system in Germany is under pressure owing to the rise in new cases, and Covid-related hospital admissions have also risen in Denmark in recent weeks. The share of the population that has received two vaccine doses has only shown a slight rise in most countries since September. Many countries have now started to administer booster doses to some population groups (see “New virus variant contributes to heightened uncertainty about the outlook for the pandemic”).
In the US, GDP growth in Q3 was lower than projected in the September Report but the level of activity is already about 1.5% higher than its pre-Covid level. Fear of infection and containment measures have contributed to considerably lower household services consumption than implied by the pre-Covid trend (Chart 1.2). Together with financial support measures for households during the pandemic, this has contributed to strong growth in goods demand. High demand for electronic goods, for example, has contributed to a global semiconductor shortage, which is impeding car production in a number of countries. In addition, there are disruptions in the distribution of goods. At US ports and inland transport terminals, there are substantial labour shortages and ships have to queue up for days before their goods can be unloaded. Effects of these pandemic-related conditions are spilling over to other countries. Delivery times have increased considerably in many countries, and prices have risen sharply. It is assumed that, in combination with high energy prices, this will dampen growth in the US and Europe in the coming quarters.
Chart 1.2 High goods consumption in the US2 Private consumption. Constant 2012 prices. In billions of USD 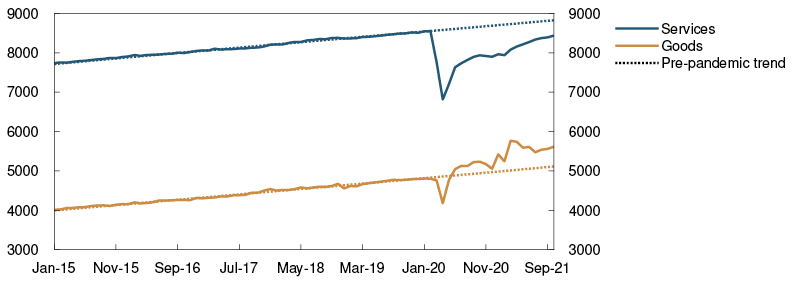
The Omicron variant is contributing to considerable uncertainty about the path of the pandemic ahead and the need for containment measures. Omicron appears to be far more transmissible than the Delta variant, but for the time being its ability to cause severe disease and the degree of protection afforded by today’s vaccines are unclear. In this Report, it is assumed that containment measures will be stricter than in the September Report and that trading partner GDP growth will be dampened in winter as a result of the spread of the Omicron variant.
Expansionary monetary and fiscal policies over the past couple of years are still having a positive impact on activity in most countries. It is assumed that both monetary and fiscal policy will be tightened further out in the projection period. Trading partner GDP growth is projected to be 5.5% in 2021 and 3.7% in 2022 (Annex Table 1). The growth projection for 2022 has been revised down from the September Report. Capacity utilisation among Norway’s trading partners overall is projected to be lower than normal in 2021, before rising to a slightly higher-than-normal level in 2022 and to the end of the projection period. Trading partner imports are projected to increase by slightly more than 7.5% in 2021 and slightly more than 6.5% in 2022.
High consumer price inflation
Higher prices for energy (see “Record-high gas and electricity prices but little change in oil prices”), raw materials and electronic components and a sharp rise in freight rates have contributed to a marked rise in inflation among Norway’s main trading partners. The 12-month rise in the headline consumer price index (CPI) moved up to close to 7% in the US and close to 5% in the euro area in autumn (Chart 1.3). The rise in energy prices made up half of the 12-month rise in the euro area. Underlying consumer price inflation is at over 2.5% in the euro area and close to 5% in the US. In recent months, underlying inflation in the US, euro area and UK has been higher than projected in September.
Chart 1.3 High consumer price inflation3 Consumer prices. Twelve-month change. Percent 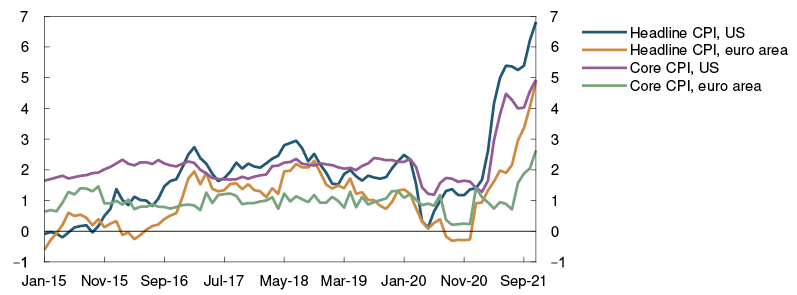
Increased producer and raw materials prices and high freight rates are likely to push up inflation also in 2022 (see “Impact of global supply chain bottlenecks on prices and activity in Norway”). Market-implied inflation expectations have risen since the September Report and indicate expectations of high inflation in 2022. Long-term inflation expectations appear to be relatively firmly anchored around the inflation targets in both the US and euro area. Underlying consumer price inflation in the US is projected to be 4.5% in 2022, before gradually slowing towards 2.5%. Inflation is projected to rise between 2021 and 2022 in the euro area, Sweden and the UK. In the euro area, underlying inflation will likely remain somewhat below the inflation target of 2%. The projection for Norway’s trading partners overall in 2022 has been revised up considerably from the September Report.
Producer prices for consumer goods imported to Norway (IPK), in foreign currency terms, have risen more than expected, with a particularly sharp rise in food prices in recent months. The projection for 2022 has been revised up considerably from the September Report (Annex Table 1). Owing to factors such as the fall in prices for clothing and footwear and for audio-visual equipment in China, inflation as measured by the IPK is far lower than overall producer price inflation in major advanced economies (Chart 1.4).
Chart 1.4 Low producer price inflation for consumer goods in China4 Producer prices. Twelve-month change. Percent 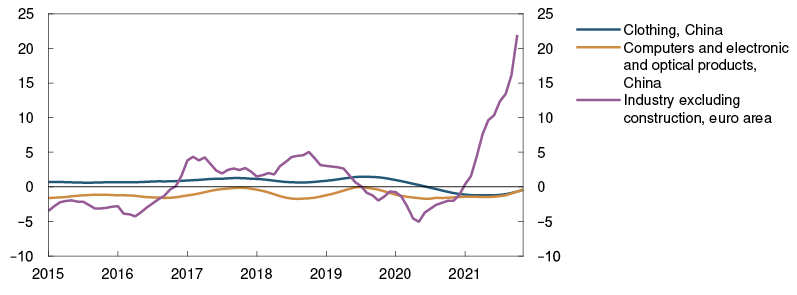
Higher policy rate expectations abroad
Prospects for higher inflation in the coming year have pulled up policy rate expectations among Norway’s main trading partners since the September Report. Market rates imply expectations that policy rates will be raised in the year ahead. Policy rate expectations have risen particularly sharply in the US and UK. The Bank of England has signalled that Bank Rate will soon be raised, and market participants expect the rate to rise in 2022 Q1. The US Federal Reserve has slowed the pace of its asset purchases somewhat and will gradually reduce those purchases further over the months ahead. The US policy rate is expected to increase in 2022 Q2.
Long-term government bond yields are little changed since September, while corporate bond risk premiums have edged up in recent weeks. Equity markets fell markedly after news of the Omicron variant emerged but have since rebounded. Equity indices among Norway’s closest trading partners are higher than at the time of the September Report.
Uncertainty about the economic consequences of the pandemic
There is considerable uncertainty about the global economic outlook. Developments will depend on factors such as vaccination coverage and vaccine efficacy, both over time and for new virus variants. Pandemic-related supply chain disruptions within both the production and distribution of goods are closely linked to infection rates and containment measures. The case is likely the same for demand conditions, particularly as to how far demand will shift from goods back to services. The scale and duration of these pandemic-related conditions on both the supply side and the demand side and the consequences for growth and global inflation are highly uncertain. There is for example a risk that inflation will remain high for longer than currently envisaged at the same time as higher infection rates and stricter-than-assumed containment measures dampen activity.
1 Period: 2015 Q1 – 2024 Q4. Projections from 2019 Q4 for MPR 4/19, 2021 Q3 for MPR 3/21 and 2021 Q4 for MPR 4/21. Export weights. MPR 4/19, 25 trading partners, MPR 3/21 and MPR 4/21 13 trading partners.
2 Period: January 2015 – October 2021.
3 Period: January 2015 – November 2021. Core CPI is consumer prices without energy and food for the US and without energy, food, tobacco and alcohol for the euro area.
4 Period: January 2015 – November 2021. Latest observation for the euro area is October 2021.
Record-high gas and electricity prices but little change in oil prices
Energy prices may show wide variations ahead, driven by the spread of Covid, winter weather, OPEC+1 oil production and Russian gas exports. Climate change and energy policies will also have an important bearing on, for example, emissions allowance prices, the scaling-down of coal and nuclear power and the scaling-up of renewable energy. Below follows a description of developments in oil, gas and energy prices since the September Report and what futures prices – on which our projections are based – indicate about developments ahead.
After rising to over USD 80 per barrel, oil prices fell markedly at end-November after news emerged of the new virus variant, Omicron. Oil prices are now around USD 75, little changed since the September Report (Chart 1.A). At the beginning of December, OPEC+ decided to further increase production from January 2022, which is in accordance with the plan to gradually reverse the production cuts introduced in 2020. In addition to this production increase, the US and several other countries have announced large-scale releases from strategic oil reserves. Oil prices remain elevated, partly because record-high gas prices are leading to higher oil demand in some countries. Furthermore, little progress has been made in the negotiations between the US and Iran on the nuclear agreement, which probably means that more oil exports from Iran will be postponed.
Chart 1.A Gas prices have risen, while oil prices remain little changed2 USD/barrel 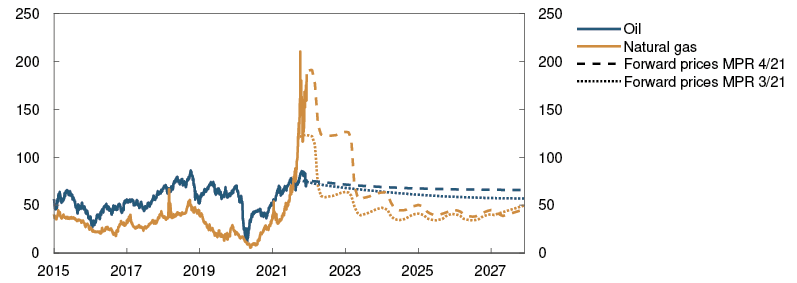
Oil futures prices indicate a further moderate price fall (Chart 1.A). After the marked recovery since the second half of 2020, growth in global oil consumption may slow ahead, particularly if Covid infection rates rise. At the same time, non-OPEC+ oil production may pick up in the period ahead. However, futures prices somewhat further ahead are higher than assumed in the September Report. This may reflect that, owing to reduced investment in new production capacity, oil demand growth may outpace growth in supply.
European gas prices are record-high and are expected to remain high through winter (Chart 1.A). In barrel of oil equivalents (BOE), gas prices in mid-December were around USD 180 per BOE, which is considerably higher than in the September Report. Gas inventories in Europe are low and gas consumption in the power sector and for heating increases in winter. At the same time, uncertainty persists about European gas imports from Russia, particularly owing to the controversy over the new gas pipeline between Russia and Germany. In addition, prices for European liquefied natural gas (LNG) imports have risen as a result of higher demand in Asia.
European gas futures prices indicate a marked fall closer to summer 2022, which may reflect the possibility that gas imports from Russia will increase and that gas consumption is lower in summer. Futures prices indicate nonetheless that European gas prices may be higher than assumed in the September Report and that gas prices will also be higher than in recent years. Gas production in Europe will be further reduced ahead, while coal and nuclear power are scaled down at a faster pace than renewables such as wind and solar power are scaled up. Europe will then be more dependent on gas imports while expected demand for gas in other regions remains high.
An estimated price for Norwegian petroleum exports – a weighted average of oil prices and European gas prices – is now at the peak levels prevailing in the period 2011–2013. Prospects for higher prices and increased production ahead imply that export value and tax revenues from the petroleum sector may be markedly higher in the years ahead than in previous years.
The average electricity price in Norway has continued to rise and reached a record high in mid-December (Chart 1.B). Prices in Central and North Norway have also risen but are still lower than prices in southern Norway. Electricity prices in Norway are high because of a cold start to the winter and high electricity consumption, periods of limited wind power generation and continued low reservoir levels. The high prices in Norway also reflect high prices in the Netherlands, Germany and the UK.3
Chart 1.B Electricity prices in northern Norway have also risen, but are lower than in southern Norway4 Øre/kWh 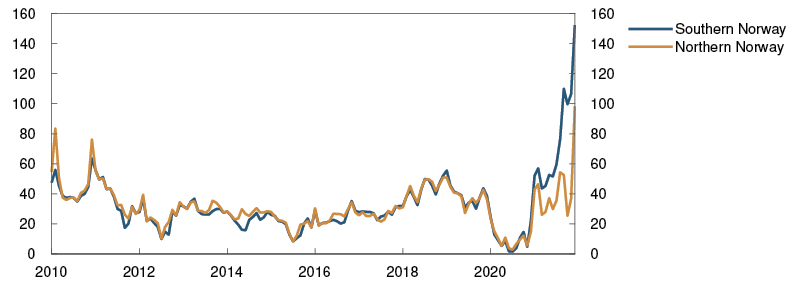
Electricity prices on the continent and in the UK reached new record highs in mid-December (Chart 1.C), primarily reflecting the increase in gas prices and a further increase in EU emissions allowance prices (EU ETS) (Chart 1.D). In addition, periods of cold weather and a lack of wind have increased electricity consumption and limited wind power generation.
Chart 1.C Electricity prices have risen5 Øre/kWh 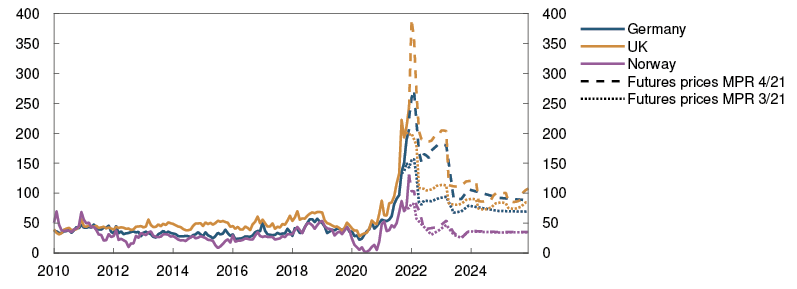
Chart 1.D Emissions allowance prices have increased further6 Euro/tonne 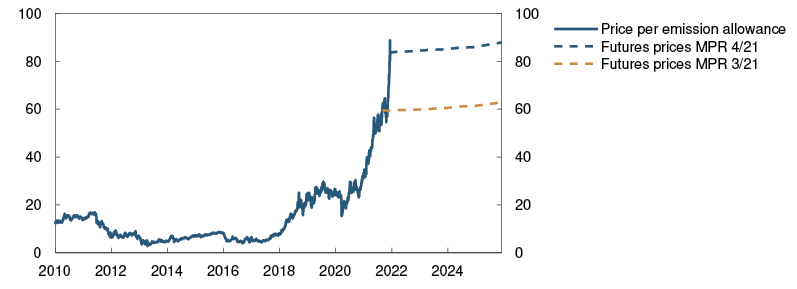
Futures prices for Nordic electricity indicate that electricity prices in Norway may remain high through winter and higher than assumed in the September Report.7 With rising electricity consumption through winter, Norway may have to import electricity from the continent at high prices in order to maintain electricity exports from Norway to the UK, where electricity prices are even higher. However, futures prices indicate that electricity prices in Norway will fall markedly closer to summer 2022 in line with the usual seasonal pattern and more normal reservoir levels. Futures prices for European electricity are also falling markedly, primarily reflecting the fall in gas futures prices (see above).
Futures prices indicate that Norwegian electricity prices could fall back to a historical average in 2023 (Chart 1.B). On the continent and in the UK, futures prices indicate higher prices ahead than previously, reflecting in particular the rise in futures prices for gas and emissions allowances.
1 OPEC+ comprises 13 OPEC countries and 10 non-OPEC countries. Saudi Arabia and Russia (the latter representing the non-OPEC countries) are key parties to the agreement. Three OPEC countries are exempt from production limitations.
2 Period: 1. januar 2015 – 31. December 2027. Futures prices from 17 September 2021 for MPR 3/21 and 10 December 2021 for MPR 4/21. Brent Blend. Weighted average of prices for natural gass in the Netherlands and Great Britain.
3 Subsea electricity cables have been installed between Norway and Germany, the Netherlands and the UK. Electricity prices between these countries could vary depending on grid and cable transmission capacity, as is the case between regions in Norway and the Nordic region. In Germany, the Netherlands and the UK, electricity prices are often determined by the costs of gas- and coal-fired power production, and more so when wind power generation is low. Prices for emissions allowances are included in the costs of gas- and coal-fired power plants. For developments in electricity prices, see box “Record-high gas and electricity prices” on page 41 of the September Report and Winje, P. (2021) Kraftprisene har skutt i været – vil prisene fremover bli høyere enn vi er vant til? [Electricity prices have soared – will prices ahead be higher than we are used to?]. Blog post on the Bankplassen blog, 29 September 2021 (in Norwegian only).
4 Period: January 2010 – December 2021. The price for December 2021 is the average price so far this month. The electricity price for southern Norway is an average of the electricity prices in the regions of East Norway, South Norway and West Norway, while the electricity price for northern Norway is an average of the electricity prices in the regions of North Norway and Central Norway.
5 Period: January 2010 – December 2025. Futures prices from 17 September 2021 for MPR 3/21 and 10 December 2021 for MPR 4/21. The price for Norway is an average of the prices for the regions of East Norway, South Norway, West Norway, Central Norway, and North Norway.
6 Periode:1 January 2010 – 31 December 2025. Price per emission allowance in the EU Emissions Trading System. Futures prices at 17 September 2021 for MPR 3/21 and 10 December 2021 for MPR 4/21.
7 We use Nordic electricity futures prices in our projections for Norwegian electricity prices. There are financial contracts for the different price areas in Norway known as Electricity Price Area Differentials (EPADs). Combined with Nordic electricity futures prices, these EPADs may suggest an average electricity price for Norway that is higher than indicated by Nordic electricity futures prices alone. Turnover in the EPAD market is however limited.
2 Financial conditions
After the policy rate hike in September, banks have raised their residential mortgage rates from historically low levels. The money market premium has edged up slightly in recent months but is now likely to be lower ahead than anticipated earlier. A higher policy rate is expected to lead to higher lending rates in the years ahead.
The krone exchange rate has depreciated on the back of increased infection rates and the spread of the new virus variant. The krone is now weaker than projected but is expected to strengthen ahead.
2.1 Interest rates
Higher residential mortgage rates
When the policy rate was raised from 0% in September, the average residential mortgage rate had stayed close to 1.8% for a longer period (Chart 2.1).
Chart 2.1 Prospects for higher lending rates1 Percent 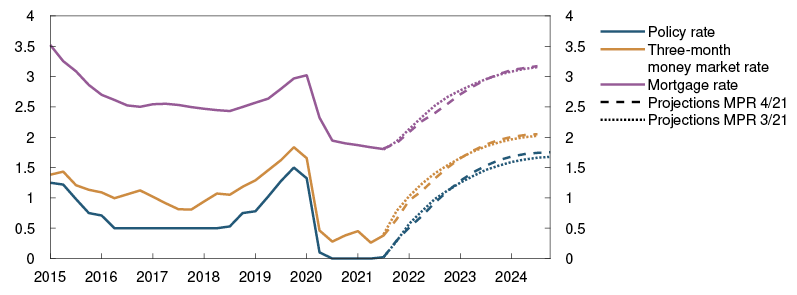
At the end of October, the average rate was still close to 1.8%, as projected in the September 2021 Monetary Policy Report. Shortly after the policy rate hike, the largest banks announced their intention to increase mortgage rates by up to 0.25 percentage point. For existing loans, a six-week notification requirement applies, and the interest rate increases took effect from November.
Residential mortgage rates are expected to increase ahead, but somewhat less than the rise in the policy rate. The lending margin, ie the difference between the lending rate and money market rate, is assumed to fall back towards pre-pandemic levels. The lending margin increased in 2020 when mortgage rates fell less than the policy rate. In 2024, the average residential mortgage rate is projected at 3.1%, little changed on the projection in the September Report.
Lower projected money market premium
The three-month money market rate, Nibor, has increased since the September Report. Nibor reflects market-implied policy rate expectations over the next three months plus a risk premium, often referred to as the money market premium.
Since the previous Report, Nibor has increased as the expected rate hike in December has drawn closer in time. At the same time, the money market premium has increased by around 0.1 percentage point to almost 0.35 percentage point and is now around the level projected earlier (Chart 2.2).
Chart 2.2 Lower projections for the money market premium2 Percentage points 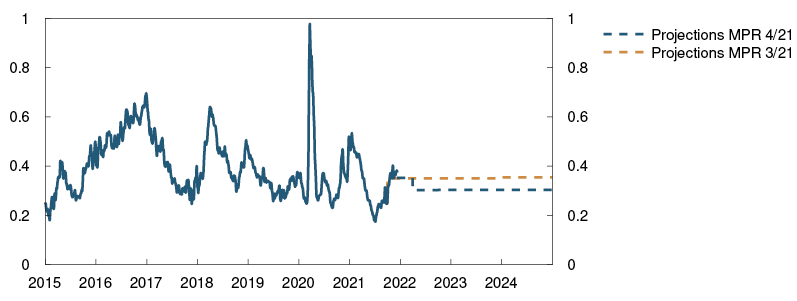
The money market premium is projected to remain around today’s level, drifting down to 0.3 percentage point towards summer as a result of higher structural liquidity3. According to the central government budget for 2022, the government is planning to reverse NOK 70bn from its account in Norges Bank to the Government Pension Fund Global (GPFG) in the course of 2022 (see “Reversal of NOK 70bn from the government’s account with Norges Bank”). The reversal will result in an increase in structural liquidity, which in isolation increases the supply of NOK and thereby reduces the money market premium.
Interest rate expectations have varied fairly widely since September but were broadly unchanged on 10 December, the cut-off date for this Report, compared with the September Report and lower than the policy rate forecast in this Report (Chart 4.5). Overall, long-term interest rates have shown little change since September (Chart 2.3). Movements in Norwegian money and bond markets have largely followed international developments, but the reaction to the new virus variant has been stronger in Norway than abroad. Developments in global equity markets have been mixed, but the Oslo Børs benchmark index has advanced since September.
Chart 2.3 Long-term interest rates are little changed4 Yields on 10-year government bonds in selected countries. Percent 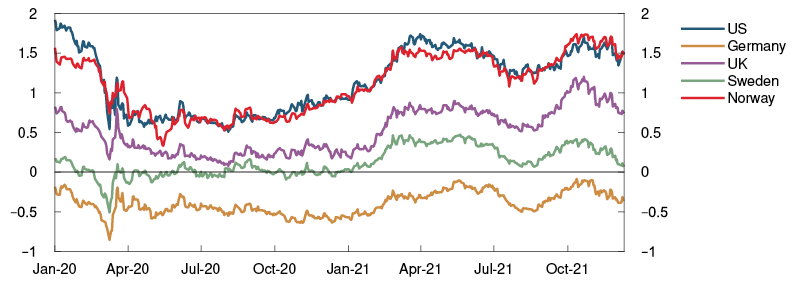
Reversal of NOK 70bn from the government’s account with Norges Bank
According to the central government budget for 2022, the government is planning a reversal of NOK 70bn from its account with Norges Bank to the Government Pension Fund Global (GPFG) in the course of next year.1 The reversal does not entail changes in government spending, but only in expenditure financing. In practice, the reversal involves a withdrawal of NOK 70bn from the government’s cash holdings so that a smaller share of the non-oil deficit is covered by revenues from petroleum activities and transfers from the GPFG. The reversal will be spread evenly over the year and recognised when the Ministry of Finance decides on the monthly transfers to or from the GPFG. Depending on changes in cash flows, the reversal will entail either a reduced need for transfers from the GPFG or larger transfers to the GPFG but will in either case reduce by NOK 70bn the need to exchange foreign currency for NOK in 2022. The foreign exchange transactions, which are carried out by Norges Bank on behalf of the government, entail a withdrawal of the liquidity supplied to the banking system through government spending over the budget. As the transactions are smaller than implied by public spending, the result will be a gradual increase in structural liquidity in the banking system in 2022 to a level that is NOK 70bn higher than it would have been otherwise.
1 For further information, see section 8.4 in the central government budget for 2022.
Higher corporate interest rates
The interest rate on banks’ corporate loans is normally linked to the three-month money market rate and has increased on the back of the rate hike in September. The same is the case for corporate bond yields. Bond risk premiums have increased a little since September but are still low.
1 Period: 2015 Q1 – 2024 Q3 (money market rate and mortgage rate) / 2024 Q4 (policy rate). Projections from 2021 Q3 for MPR 3/21 and 2021 Q4 for MPR 4/21. The mortgage rate is the average interest rate on outstanding mortgage loans to households from the sample of banks and credit institutions included in Statistics Norway’s monthly interest rate statistics.
2 Period: 1 January 2015 – 31 December 2024. Five-day moving average. Latest observation on 10 December 2021. Projections from 2021 Q3 for MPR 3/21 and 2021 Q4 for MPR 4/21. Premium in the Norwegian money market rate is the difference between the three-month money market rate and expected policy rate.
3 For further details, see box on Structural Liquidity on page 20 in Monetary Policy Report 2/21.
4 Period: 1 January 2020 – 10 December 2021.
2.2 Krone exchange rate
Krone exchange rate has weakened since the September Report
The krone exchange rate, as measured by the import-weighted exchange rate index I-44, appreciated in the period following the publication of the September Report, at the same time as oil and gas prices jumped up. Increased infection rates and uncertainty about the new virus variant has since led to a weaker krone. The krone is now weaker than in September and weaker than the September projection, but the average for Q4 appears to be somewhat stronger than projected.
The krone is projected to hover around today’s level in the near term and to appreciate thereafter (Chart 2.4). The projected appreciation of the krone is based on the assumption that pandemic-related uncertainty will subside further out. A gradual widening of the interest rate differential between Norway and its main trading partners pulls in the same direction. The differential against main trading partners has narrowed, reflecting higher interest rate expectations internationally, and the krone projections are now slightly weaker than in the September Report.
Chart 2.4 Stronger krone ahead5 Import-weighted exchange rate index (I-44). Difference between three-month money market rate in Norway and among trading partners. Percentage points 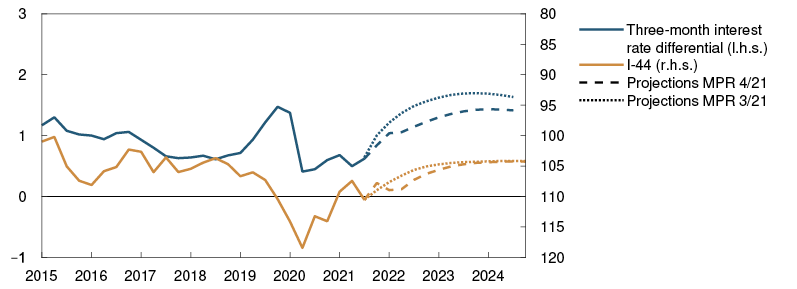
The future path of the krone exchange rate remains highly uncertain. Uncertainty about the future evolution of the pandemic can have a strong impact on international financial markets and on the krone exchange rate. If the consequences of the new virus variant are less pronounced than feared, the uncertainty may recede, and the krone could appreciate. On the other hand, should the effects of the new virus variant prove more pronounced and persistent than assumed, the krone may remain weaker than projected.
5 Period: 2015 Q1 – 2024 Q4. Oil price: USD per barrel Brent Blend. Oil price projections are based on futures prices at 17 September 2021 for MPR 3/21 and at 10 December 2021 for MPR 4/21. Projections from 2021 Q3 for MPR 3/21 and 2021 Q4 for MPR 4/21 for I-44. A rising index value for I-44 indicates a depreciating krone. The right-hand scale is inverted.
3 The Norwegian economy
The upswing in the Norwegian economy has continued. Activity rose markedly in 2021 Q3, and unemployment fell further. Higher infection rates and extensive containment measures are expected to dampen activity in the near term. When infection rates subside further out and containment measures are eased, the upswing will likely continue and unemployment will edge down.
High energy prices have contributed to a pronounced rise in inflation. Excluding changes in energy prices and indirect taxes, inflation is lower than the inflation target of 2%. Rising wage growth and higher imported goods inflation will likely push up underlying inflation ahead. Inflation is projected to be close to 2% at the end of 2024.
3.1 Economic developments
Higher infection rates and stricter containment measures restrain growth
Since the onset of the pandemic in spring 2020, activity in the Norwegian economy and the number of unemployed have fluctuated in step with changes in infection rates and the degree of containment measures. In April 2021, the authorities started a gradual reopening of society, with a stepwise easing of restrictions, and at the end of September, most of the restrictions were lifted. The reopening of society led to a marked upswing in the Norwegian economy, and mainland GDP rose by 2.6% in 2021 Q3 (Chart 3.1). In October, economic activity was broadly unchanged.
Chart 3.1 Marked rise in activity1 GDP for mainland Norway. Seasonally adjusted. Index. 2018 Q4 = 100 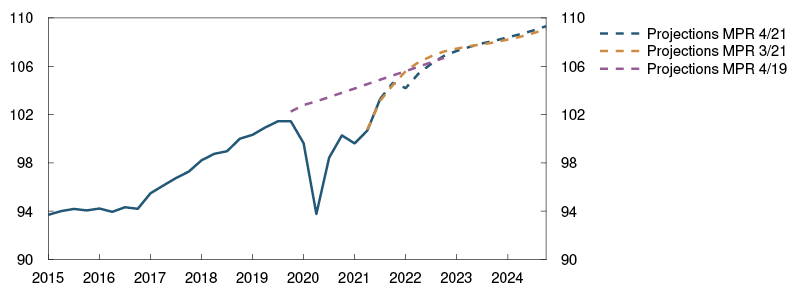
Infection rates have recently risen again, and the number of hospitalisations has increased. The spread of the Omicron variant is adding to the uncertainty about the further evolution of the pandemic. Extensive national and local containment measures have been reintroduced, which will likely result in a fall in activity in 2022 Q1 and lead to a rise in unemployment in December and January. See “New virus variant contributes to heightened uncertainty about the outlook for the pandemic” for a discussion of assumptions about the evolution of the pandemic ahead.
Higher infection rates and the reintroduction of containment measures are expected to affect household services in particular such as culture, entertainment, accommodation and food services. After making a substantial recovery in autumn, activity in these sectors is projected to fall markedly in December and January. The projections in this Report assume that containment measures will be gradually unwound through 2022 Q1. Growth is expected to pick up again through spring, primarily driven by the segments now affected by strict containment measures.
In November, a number of enterprises in Norges Bank’s Regional Network reported a sharp rise in capacity utilisation and production constraints due to labour shortages and disruptions to global supply chains. This is also expected to dampen growth in the coming months (see “Impact of global supply chain bottlenecks on prices and activity in Norway” for a further discussion).
Annual growth in mainland GDP is projected at 4.1% in 2021 and 3.5% in 2022. Growth is expected to gradually slow further out in the projection period (Chart 3.2). The projection for household consumption in 2022 has been revised down, reducing its contribution to growth compared with previous projections. Nevertheless, an upswing in household consumption from spring 2022 is the main driver of GDP growth in the projections. Increased exports also lift activity in the coming years. Investment growth picks up both in mainland firms and the petroleum industry in 2023 and 2024.
Chart 3.2 Household consumption boosts growth ahead2 GDP for mainland Norway. Percent. Contribution to annual growth. Percentage points 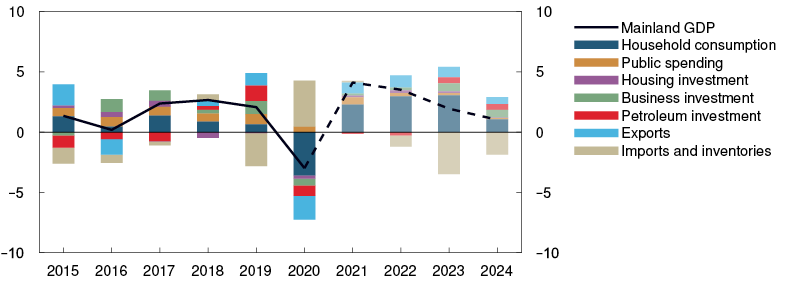
The economic outlook is uncertain. If infection rates and hospitalisations continue to rise, containment measures may be more extensive and in place longer than assumed. In that case, economic developments may prove weaker than projected. A number of Regional Network contacts also report labour shortages and delivery delays (see “Impact of global supply chain bottlenecks on prices and activity in Norway”). If global supply chain problems and labour shortages also persist for longer than projected, activity may turn out lower. On the other hand, growth may prove to be stronger if households spend more of their savings than indicated by the projections.
Temporary fall in consumption
The pandemic has limited household consumption opportunities to a large degree. Infection rates and containment measures have primarily affected spending on services, such as restaurant dining, cultural events and foreign travel. As a result, households have saved more than usual. At the same time, households have spent less on services and foreign travel and more on goods than before the pandemic. As society gradually reopened, household consumption increased substantially. After solid growth in 2021 Q2, the recovery continued through summer, and household consumption rose by 6% in 2021 Q3. In October, domestic demand was clearly higher than before the pandemic, while household spending abroad was still 60% lower than pre-pandemic levels (Chart 3.3).
Chart 3.3 Continued low consumption abroad3 Private consumption for households and non-profit organisations. Index. February 2020 = 100 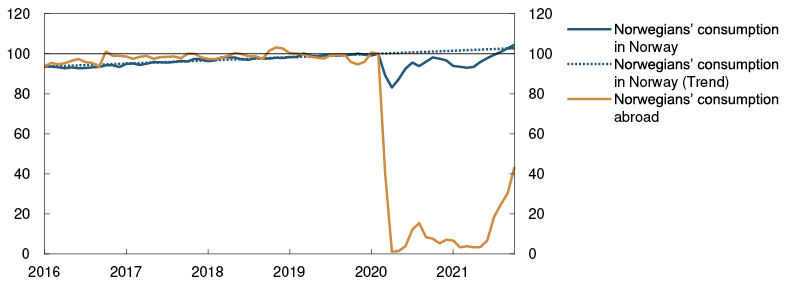
Card transaction data for a large share of the population indicate that the level of goods and services consumption remained high in November but has edged down in December. In the coming months, higher infection rates and the reintroduction of containment measures are expected to result in a fall in services consumption. Spending on accommodation and food services in particular, as well as cultural and leisure services, is expected to fall. Higher infection rates and the reintroduction of some travel restrictions will likely also contribute to a fall in Norwegian citizens’ consumption abroad in winter, after having risen markedly in autumn. Limited consumption opportunities and more time spent at home will likely contribute to a pick-up in goods consumption. Overall household consumption is projected to fall sharply in 2022 Q1.
Most of the measures are expected to be unwound towards the end of 2022 Q1, with a pick-up in services consumption through spring. Services consumption was higher than its pre-pandemic level in October and is expected to return to that level towards summer 2022. A relaxation of travel restrictions and a renewed decline in infection rates abroad are likely to boost household spending abroad through 2022. As Covid restrictions are lifted and spending on services and foreign travel picks up, the shift towards goods purchases is expected to reverse and goods consumption to decline.
Electricity prices have risen markedly in autumn, and there are prospects that they will remain high until spring 2022 (see “Record-high gas and electricity prices but little change in oil prices”). The price increase pulls down real disposable income in 2021 and at the beginning of 2022, even though the Government’s electricity support scheme reduces some of the effect of high electricity prices on real disposable income. Prospects for higher interest expenses and reduced central government transfers dampen income growth in the years ahead. Real household disposable income is nonetheless expected to rise on the back of higher wage income. Overall, higher real disposable income and high saving through the pandemic point to higher consumption ahead. Consumption increases by about 6% in 2022, before gradually falling back later in the projection period.
Chart 3.4 Prospects for strong consumption growth in the coming years4 Annual growth. Percent 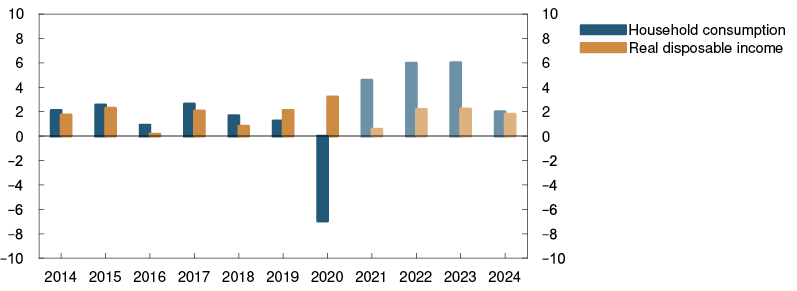
High construction costs dampen housing investment
Housing investment fell in 2021 Q3 and was substantially lower than projected in the September 2021 Monetary Policy Report. The weakness in investment likely reflects a marked rise in residential construction costs through 2021 (see “Impact of global supply chain bottlenecks on prices and activity in Norway”). International timber prices have recently fallen, and construction costs in Norway are also expected to fall back to more normal levels in the course of 2022. Many construction projects have been postponed, probably due to high construction costs, but are expected to be carried out in 2022. Housing investment is projected to rise in the coming years.
After a marked rise through 2020, house price inflation has been more subdued over the past six months and is projected to be moderate ahead. See Section 5 for a further discussion of housing market developments.
Higher business investment
Mainland business investment fell markedly in 2020 but recovered somewhat towards the end of the year and through spring. In 2021 Q3, investment fell again, but according to revised national accounts figures, the level of investment is nevertheless higher than projected in the September Report.
In November, Regional Network contacts planned to increase investment over the next 12 months (Chart 3.5). In line with Statistics Norway’s investment intentions survey, manufacturing investment is projected to show a marked rise in 2022, while power sector investment is projected to decline. Growth is likely being restrained to some extent by high prices for investment goods owing to disruptions to global supply chains. Overall, growth in business investment is projected at 2.2% in 2022.
Chart 3.5 Regional Network contacts plan to increase business investment5 Expected change in investment in the next 12 months. Percent 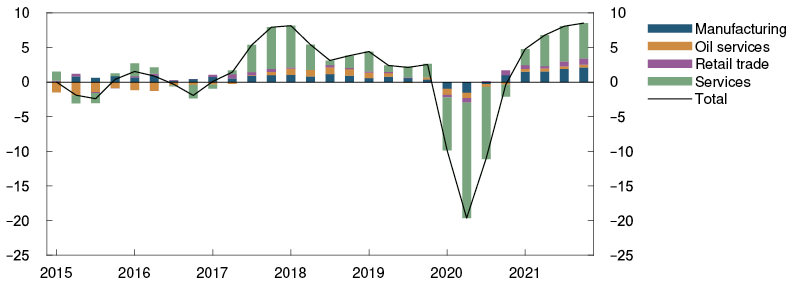
Investment growth is expected to pick up in the years ahead. The projections reflect expectations of solid growth in services investment and higher investment in batteries, hydrogen and carbon capture and storage. Higher capacity utilisation in the Norwegian economy and improved business profitability also indicate continued growth in business investment.
The coronavirus outbreak, lower oil and gas prices and heightened uncertainty contributed to a fall in petroleum investment in 2020. The decline was cushioned by the temporary tax changes for oil companies, which were adopted in June 2020. Investment is projected to fall further in 2021 and 2022 (Chart 3.6), despite tax changes favouring higher investment and the marked rise in oil and gas prices since mid-2020. The projections reflect the completion of a number of large projects in the period 2020-2022, at the same time as oil companies have launched relatively few development projects over the past two years.
Chart 3.6 Petroleum investment falls in 20226 Petroleum investment. Constant 2021 prices. In billions of NOK 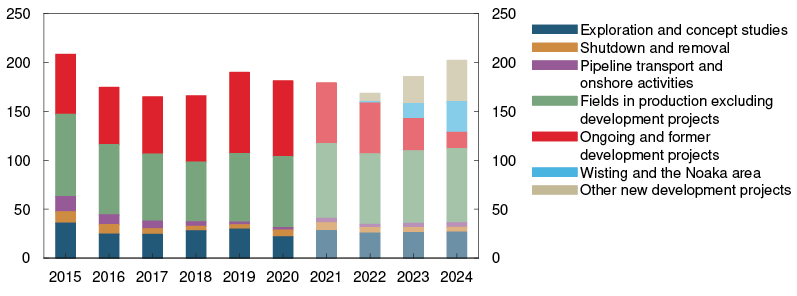
The temporary tax changes give oil companies strong incentives to start development projects before 2023. Oil companies have announced that they will launch a number of development projects in the latter half of 2022. Against this background, petroleum investment is projected to increase markedly in 2023 and 2024.
Higher exports in 2022
Mainland exports increased markedly in 2021 Q3, partly owing to solid growth in fish exports and foreign tourism in Norway. In the near term, rising infection rates and the reintroduction of containment measures both in Norway and globally will weigh on exports on the back of reduced travel and lower demand among trading partners. Increasing activity among trading partners is expected to contribute to a recovery in exports through 2022. An increase in the number of foreign tourists in Norway is also projected to lift exports from summer 2022. A stronger krone through the projection period pulls in the opposite direction.
Like exports, imports have been affected by changes in travel activity during the pandemic. However, in autumn, Norwegian citizens’ purchases abroad picked up markedly. Higher infection rates and containment measures will probably have a renewed dampening effect on imports in 2022 Q1, followed by a recovery further out in pace with a rise in domestic demand and travel activity.
Reintroduction of fiscal support measures
Through the pandemic, extensive fiscal policy measures have been used to mitigate the economic fallout of the coronavirus outbreak and measures to contain it. Many of the support measures were scheduled to be phased out in the course of 2021. In connection with the introduction of containment measures in December, a number of fiscal support measures have been reintroduced. For example, the compensation scheme for businesses has been reinstated, with some adjustments. The temporary arrangements for unemployed and furloughed workers have been extended, and work is in progress on a wage support scheme for businesses. Local governments will also be compensated for loss of revenue and increased expenses relating to the pandemic. The economic support measures will help to sustain household income and improve business profitability, in order to help enable employment to pick up again when the containment measures are eased further out.
Together with the Government’s electricity support scheme for households, the pandemic-related measures will result in a higher structural non-oil deficit than proposed in the draft central government budget for 2022. The deficit is assumed to decline from 11.6% of trend GDP in 2021 to 10.3% in 2022. The projection for the structural non-oil deficit for 2022 has therefore been revised up compared with the September Report.
It is assumed that the support measures are phased out in 2023 and the deficit reduced to 9.6% of trend GDP in 2024. Fiscal policy is assumed to turn neutral and the deficit to remain stable as a share of trend GDP (Chart 3.7), entailing low growth in public demand.
Chart 3.7 Lower growth in public demand7 Public demand. Annual growth. Structural non-oil budgjet deficit. Share of trend GDP. Percent 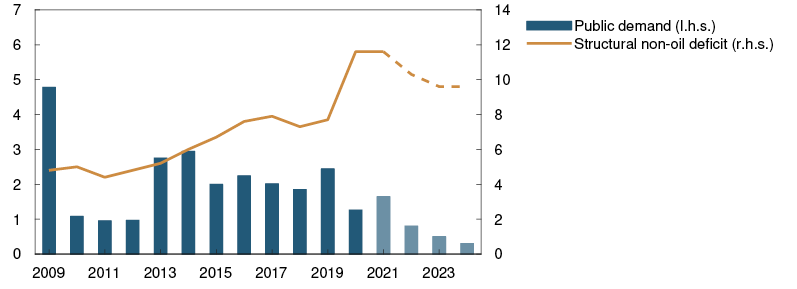
Slightly higher unemployment in the near term
The number of employed continued to rise in 2021 Q3 and returned to the level prevailing at the end of 2019 (Chart 3.8). At the same time, unemployment has continued to decline in autumn. Labour market developments have been stronger than expected in the September Report.
Chart 3.8 Employment has picked up markedly8 In thousands 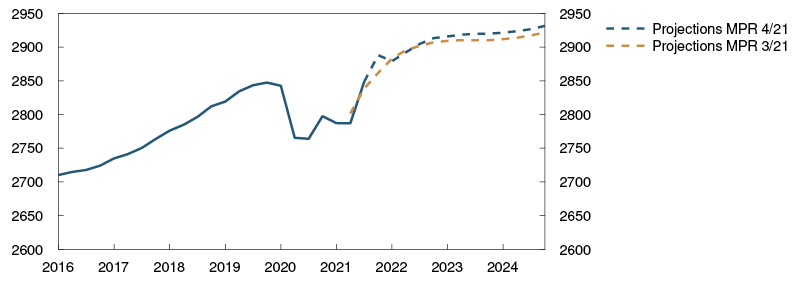
At end-November 2021, 65 000 persons were registered as fully unemployed, an estimated 2.3% of the labour force adjusted for normal seasonal variations. There were thus as many unemployed workers in November than before the pandemic (Chart 3.9). The normal unemployment rate was below its pre-pandemic level, while the number of furloughed workers was still higher. In pace with the recent decline in unemployment, the number of long-term unemployed has also decreased. However, the number is still high, and close to a third have been seeking work since the lockdown in 2020.
Chart 3.9 Unemployment has fallen9 Fully furloughed. In thousands. Change from February 2020 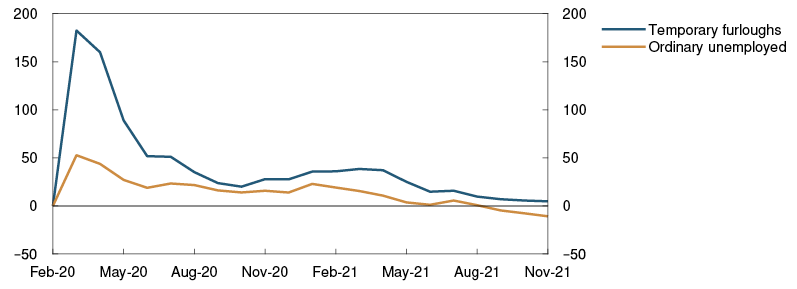
In recent months, employment has risen more than unemployment has fallen, as more people who had been outside the labour market have found work.
The reintroduction of containment measures is likely to contribute to a rise in unemployment in the coming months. So far in December, the number of furlough notices has risen considerably, and during the second week of December, 5 500 furlough notices were sent out. The rise in unemployment is expected mainly to affect sectors directly impacted by containment measures, tourism, transport and other service occupations in particular. The Government’s announced wage support scheme for firms affected by the containment measures may curb the rise in unemployment somewhat. Overall seasonally adjusted unemployment is projected to peak at around 3% in January (Chart 3.10).
Chart 3.10 Higher unemployment through winter10 Registered unemployed as a share of the labour force. Seasonally adjusted. Percent 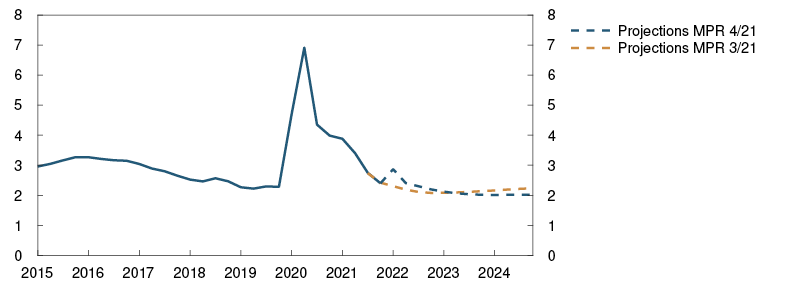
As economic activity picks up again through 2022, unemployment is also expected to drift down. In the course of 2023, unemployment is projected to fall to 2% and remain at around that level to the end of the projection period.
Higher infection rates and containment measures will likely contribute to a slight decline in employment at the beginning of 2022. Owing to higher activity through spring, employment is then expected to rise again to a little above its pre-pandemic level in the course of 2022 and projected to stabilise at a high level thereafter. The number of workers on short-term contracts is expected to remain low at the beginning of 2022, but the number is assumed to rise gradually thereafter before reaching its pre-pandemic level at the end of 2023.
Increased mismatch between labour supply and labour demand
In November, Regional Network contacts reported plans for continued strong growth in employment in the coming months. The share of enterprises reporting labour shortages rose substantially and has reached the highest level since before the financial crisis in 2008. Vacancy statistics from the Norwegian Labour and Welfare Administration (NAV) and Statistics Norway’s job vacancy survey confirm the impression that labour demand in autumn has been very high (Chart 3.11).
Chart 3.11 High number of job vacancies11 Job vacancies as a share of all jobs. Seasonally adjusted. Percent 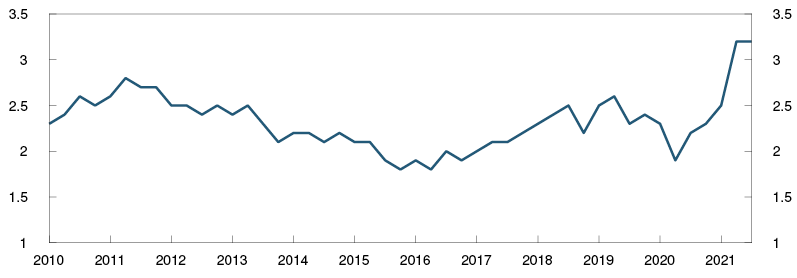
Labour demand has also been high when viewed against the number of unemployed. This indicates that the mismatch between labour supply and labour demand has increased through the pandemic.12 This probably reflects a number of extraordinary conditions that have limited the supply of foreign labour and the large numbers made redundant during the pandemic who have long been outside the labour market. The share of furloughed workers is also higher than in normal times. Furloughed workers are likely to be less active job seekers than ordinary unemployed as they expect to be able to return to their previous workplace.
An increasing mismatch between labour supply and labour demand indicates that the labour market is less efficient than earlier. This means that wage pressures may arise at higher levels of unemployment than before the pandemic. The extraordinary conditions that make the labour market less efficient than normal are expected to persist through much of 2022. Fewer furloughed workers and long-term unemployed and an improved supply of foreign labour will contribute to a gradual normalisation of the labour market further out.
The unemployment rate consistent with normal capacity utilisation, ie the unemployment rate consistent with constant wage inflation, is projected to drift down from the current level of around 2½% to about 2¼% at the end of the projection period, ie the same rate as before the pandemic.
Severe downturns have previously been followed by persistently lower labour force participation, most recently after the fall in oil prices in 2014. Norges Bank has previously assumed that the pandemic has led to a slight decrease in the long-term level of the labour force. In light of the rapid fall in unemployment in autumn, together with the strong labour market recovery in recent months, the pandemic is no longer assumed to lead to such lasting effects. This means that potential employment is now projected to be slightly higher than previously. Potential employment is projected to return to its pre-pandemic level towards the end of the projection period.
Since the Covid outbreak, there have been considerable changes in the labour market, and a number of extraordinary conditions have made it difficult to distinguish between permanent shifts in the labour market and changes in capacity utilisation. See “Capacity utilisation above a normal level” for a further discussion of the Bank’s assessment of capacity utilisation. It cannot be ruled out that an increasing mismatch between labour supply and labour demand may reflect more long-lasting changes in the labour market. The pandemic may have changed both labour supply and labour demand, so that recruiting foreign labour will be a challenge for an extended period or that changes in the structure of the business sector will be more permanent. If so, unemployment may become entrenched at a higher level than assumed. On the other hand, high labour demand may indicate that economic activity will rapidly normalise. In that case, unemployment may decline further than projected.
1 Period: 2015 Q1 – 2024 Q4. Projections from 2019 Q4 for MPR 4/19, 2021 Q3 for MPR 3/21 and 2021 Q4 for MPR 4/21.
2 Period: 2015 – 2024. Projections from 2021. Petroleum investment includes investment in foreign shipping.
3 Period: January 2016 – October 2021. Trend estimated based on data from January 2016 to February 2020.
4 Period: 2014 – 2024. Projections from 2020 – 2023. Includes non-profit organisations. Household real disposable income excluding dividends.
5 Period: 2015 Q1 – 2021 Q4. Expectations of private sector enterprises in the Regional Network survey.
6 Period: 2015 – 2024. Projections for 2021 – 2024. Data for 2015–2020 from Statistics Norway’s investment surey and deflated by the consumer price index for petrolium investment in the national accounts. The price index is projected to rise by 1% in 2020 to 2021 and by 2% in 2022.
7 Period: 2009–2024. Projections for 2021–2024.
8 Periode 2016 Q1 – 2024 Q4. Employment projections from 2021 Q4 for MPR 4/21 and from 2021 Q3 for MPR 3/21.
9 Period: February 2020 – November 2021.
10 Period: 2015 Q1 – 2024 Q4. Projections from 2021 Q3 for MPR 3/21 and 2021 Q4 for MPR 4/21.
11 Period: 2010 Q1 – 2021 Q3
12 See page 38 of Monetary Policy Report 3/21 “Increased mismatch between labour supply and labour demand”.
Capacity utilisation above a normal level
Capacity utilisation in the Norwegian economy has risen over the past six months. Unemployment has fallen and employment has risen, GDP growth has been high and in November, the enterprises in Norges Bank’s Regional Network reported growing labour supply challenges. The Bank’s assessment is that capacity utilisation in 2021 Q4 is at a higher-than-normal level and that the output gap is just below 1% (Chart F in Monetary policy assessment).
The projections for capacity utilisation in the second half of 2021 are a little higher than in the September Report. This reflects signs that the labour market has been somewhat tighter than expected and our current projection of higher GDP growth this year. At the same time, the projection for potential output has been revised up owing to high growth in employment among resident workers. This implies that we no longer assume that long-term potential employment has been negatively impacted by the pandemic (see “Increased mismatch between labour supply and labour demand” for a further discussion).
Regional Network contacts have reported a substantial rise in capacity utilisation in recent quarters and indicated in November that capacity utilisation is higher than we project. In 2021 Q4, 55% of contacts reported that they would have some or considerable problems meeting an increase in demand (Chart 3.A). This indicator is now at the same level as in spring 2008. Many of the contacts reported that labour shortages are a production constraint.
Chart 3.A Regional Network contacts indicate higher capacity utilisation1 Capacity utilisation and labour shortages according to the Regional Network. Percent 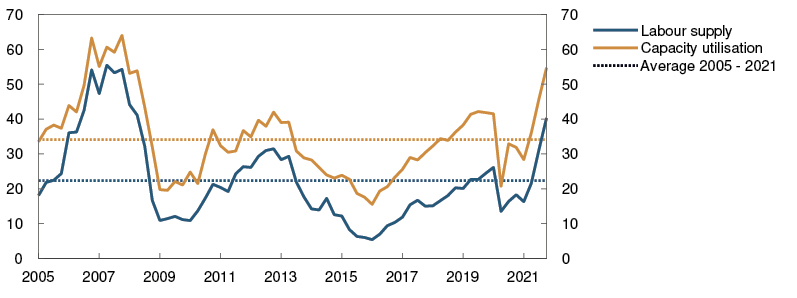
In spring 2008, the output gap was close to 3%. Other indicators of capacity utilisation do not currently point to such high capacity utilisation. Unemployment is now close to what is estimated to be a normal level, and the employment rate is broadly at the same level as at the beginning of the pandemic. Some of the capacity problems are due to difficulties obtaining intermediate goods. Such production bottlenecks can, in the near term, affect both output and price and wage inflation but do not affect our assessments of long-run potential employment or potential output. These supply problems are assumed to be temporary.
The Bank’s modelling system for estimating the output gap takes account of developments in GDP, unemployment, wage growth and domestic price rises (Chart 3.B). The estimates cover the period to Q3. The modelling system also shows a considerable rise in capacity utilisation in recent quarters but indicates somewhat lower capacity utilisation than the network indicators.
Chart 3.B Models show increase in the output gap2 Output gap. Percent 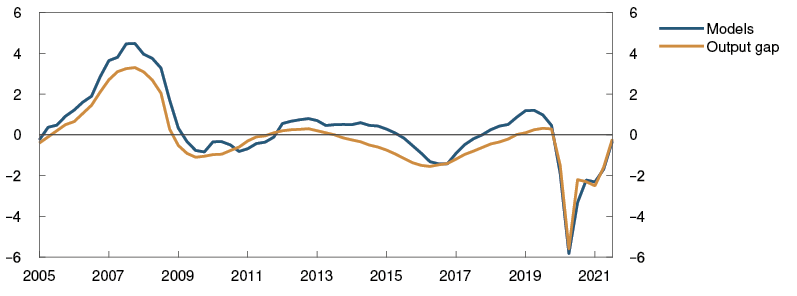
Capacity utilisation is projected to fall temporarily in 2022 Q1 to a more normal level. This reflects the decline in GDP due to increased inflection rates and stringent containment measures. It is not obvious whether such a decline in GDP would lead to a decline in capacity utilisation or whether potential output would fall correspondingly. In our judgement, the rise in unemployment and fall in employment anticipated at the beginning of 2022 implies a less tight labour market and thus a decline in capacity utilisation.
Further ahead, activity is expected to pick up and capacity utilisation to rise. The output gap is projected at around 1¼% in the first half of 2023. The output gap then declines to just below 1% at the end of the projection horizon. Annual growth in potential output of around 1¼% is assumed in the years ahead, reflecting employment growth of ½% and productivity growth of ¾% (Chart 3.C).
Chart 3.C Potential growth3 Contributions from employment and productivity 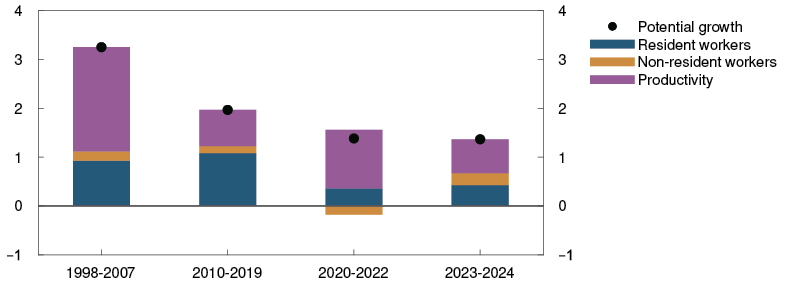
1 Period: 2005 Q1 – 2021 Q4. Share of Regional Network contacts reporting difficulty meeting growth in demand. Share of contacts reporting that shortage of labour as a constraint on production. Only enterprises reporting full capacity utilisation were asked about labour supply, but the series shows the share of all the contacts in the survey. The local government and hospital sector is omitted from the capacity utilisation series, but is, however, included in the labour force series.
2 Period: 2005 Q1 – 2021 Q3. The output gap is measured as the percentage difference between mainland GDP and estimated potential mainland GDP. The model-based calculations of the output gap include data on GDP, employment, unemployment, wage growth, inflation, house prices and credit. For a more detailed description of the models, see Working Paper 7/2020.
3 Period: 1998–2024.
3.2 Costs and prices
Wage growth on the rise
Wage growth is projected to be 3.1% in 2021, slightly higher than in the September Report. Quarterly wage statistics indicate that wage growth has been broadly as expected, but high labour demand has likely pushed up wage growth towards the end of 2021. Wage expectations, as measured by Norges Bank’s Expectations Survey and Regional Network surveys have risen slightly since the September Report and are close to the Bank’s projection (Chart 3.12). The norm for this year’s wage settlement was 2.7%.
Chart 3.12 Higher wage expectations in 202213 Annual wage growth. Percent 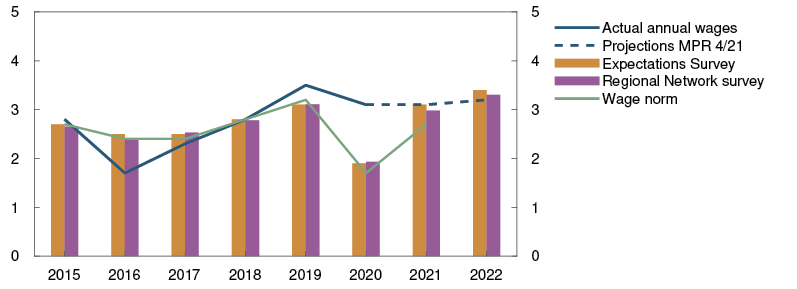
Wage expectations for 2022 have also increased since the September Report. In November, the social partners overall expected wage growth of 3.4%, 0.3 percentage point higher than in the previous Expectations Survey. Higher wage expectations may partly reflect growing labour shortages. In November, Regional Network contacts expected wage growth of 3.3% in 2022. The higher infection rates and reintroduction of containment measures in December weigh on activity and suggest that wage growth may turn out lower than these expectations indicate. As infection rates subside through 2022, more low-wage employees are expected to return to work. This may pull down the average wage level (see “Compositional effects on wage growth”). Higher prices for electricity and imported intermediate goods will likely reduce business profitability in the near term, which may restrain wage growth. The increase in electricity prices may contribute to somewhat higher wage demands from workers in the wage negotiations, even though the Government’s electricity support scheme will compensate for the increase to some extent. Wage growth is projected at 3.2% in 2022.
Experience shows that high petroleum prices improve business profitability, which may contribute to higher wage growth a little further out. Capacity utilisation above a normal level pulls in the same direction. Wage growth is expected to increase to 3.6% in 2023, before edging lower in 2024 (Chart 3.13). Slightly lower wage growth in 2024 reflects a modest decline in capacity utilisation expected in 2023 and 2024.
Chart 3.13 Slightly higher wage growth14 Wages. Annual growth. Percent 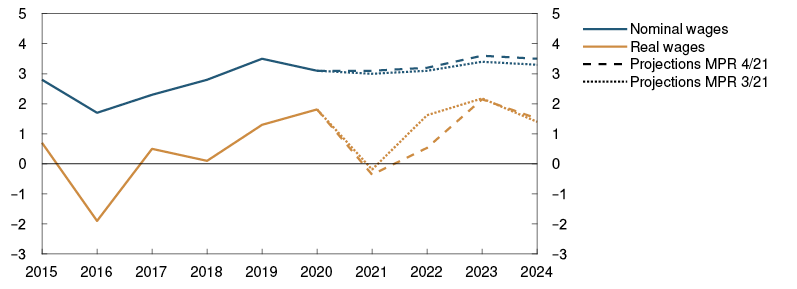
Compositional effects on wage growth
Many of those who lost their jobs on account of the coronavirus outbreak in 2020 earned lower-than-average wages. The result was a higher average wage level. Owing to such compositional effects, overall measured wage growth between 2019 and 2020 turned out higher than the rise in pay of individual employees who were in work all year. As a rising number of those who lost their jobs return to work, the converse occurs. A greater number of low-wage employees in work is expected to push down the average wage level in 2022, but prospects for higher unemployment suggest that this effect may be less pronounced than assumed in the September Report. It is uncertain how large compositional effects will be.
Higher underlying inflation in 2022
The 12-month rise in the consumer price index adjusted for tax changes and excluding energy products (CPI-ATE) has slowed gradually from about 3.5% in summer 2020 to around 1% in recent months (Chart 3.14). Through the pandemic, developments in underlying inflation have been largely driven by variations in imported goods inflation owing to considerable movements in the krone exchange rate. The krone appreciation over the past year has contributed to lower imported goods inflation, but a slower rise in prices for domestically produced goods and services has also contributed to the decline in underlying inflation.
Chart 3.14 Low CPI-ATE inflation15 CPI and indicators of underlying inflation. Twelve-month change. Percent 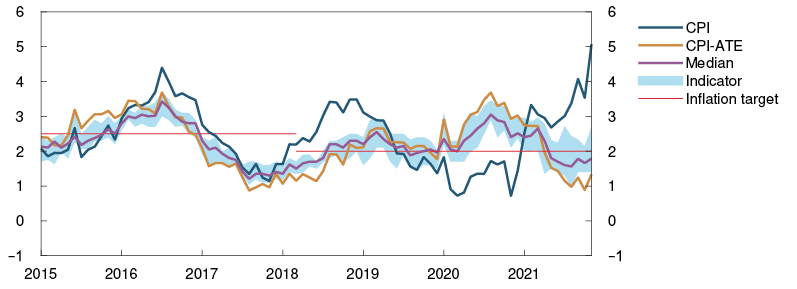
The 12-month rise in CPI-ATE inflation was 1.3% in November. This was higher than in October and slightly higher than projected in the September Report. The rise in prices for domestically produced goods and services was higher in November after falling gradually since summer 2020. The rise in prices for imported goods was also higher in November and has fluctuated between a little above 0% and 1% in recent months. Overall CPI-ATE inflation has been a little higher than projected. In recent months, the 12-month rise in other indicators of underlying inflation has remained higher than CPI-ATE inflation and averaged 2.0% in November.
Changes in taxes and substantial energy price volatility have caused developments in the consumer price index (CPI) and the CPI-ATE to diverge widely through the pandemic. Higher energy prices have led to a marked rise in CPI inflation since winter 2020. In November, the rise in energy prices accelerated again, and 12-month CPI inflation rose to 5.1%. CPI inflation was higher than projected in the September Report. Futures prices indicate that 12-month energy price inflation will slow after year-end, which will dampen CPI inflation in 2022.
The 12-month rise in the CPI-ATE is expected to remain just above 1% in the near term. Higher freight rates (see “Impact of global supply chain bottlenecks on prices and activity in Norway”) and higher inflationary pressures on imported goods will likely lift inflation in 2022. Higher intermediate goods prices pull in the same direction. CPI-ATE inflation is projected to pick up through spring 2022 and be just above 2% at the start of 2023. CPI-ATE inflation is projected to decline through 2023, on the back of expected falling freight rates and slowing imported inflation. Through the projection period, increasing wage growth and higher capacity utilisation push up domestic inflation (Chart 3.15), which in isolation pulls up CPI-ATE inflation over the entire projection horizon. On the other hand, prospects for a gradually stronger krone will pull down inflation. At the end of 2024, underlying inflation is projected to be 2.0%.
Chart 3.15 Prospects for higher inflation16 Domestically produced goods and services and imported goods in the CPI-ATE. Four-quarter change. Percent 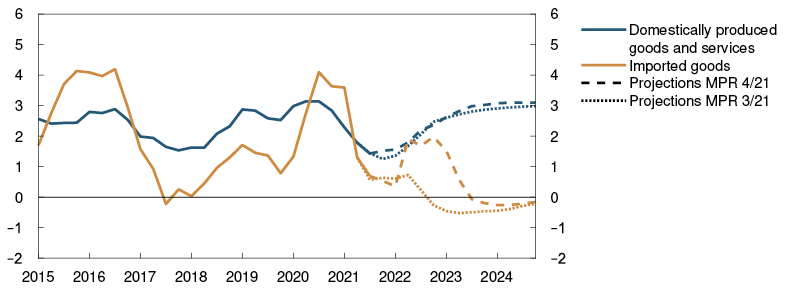
Inflation expectations one and two years ahead, as measured by Norges Bank’s Expectations Survey, have increased recently. The survey indicates inflation expectations in the area of 3% to 4% one year ahead. Business leaders’ expectations are the highest. In the longer term, inflation expectations have been more stable and lie somewhat above 2% overall.
Real wage growth picks up
Real wage growth was fairly high in 2020, while a slight decline in real wages is estimated in 2021. This partly reflects compositional effects, which has led to considerable fluctuations in measured nominal wage growth in 2020 and 2021, and the wide swings in energy prices in those two years. Average annual real wage growth is expected to be about 1½% in the next three years.
Considerable uncertainty surrounding price and wage inflation
Several factors point to higher price and wage inflation, but there is uncertainty about how much prices and wages will rise and how long it will take for price and wage inflation to subside again. Some trading partners, such as the US and the UK, have experienced a considerable rise in inflation over the past year (Chart 1.3). There has been an unprecedented rise in prices for a number of goods and services, such as electronic components and freight. There is considerable uncertainty about global inflation drivers and their impact on inflation abroad that is already high. This in turn also entails higher-than-normal uncertainty about the inflation projections for Norway. Inflationary pressures may persist longer than projected, and the effect on domestic inflation may be stronger and more rapid than assumed. On the other hand, inflationary pressures may subside faster than assumed, with a weaker pass-through to prices. In that case, inflation will likely turn out lower than projected.
It is also uncertain to what extent higher prices will impact wage growth ahead. It is possible that higher inflation will have a more pronounced impact on wage growth than has been the case in the past 20 to 30 years. If so, this may trigger a wage-price spiral. Owing to large changes in the labour market and extraordinary pandemic-related conditions, it is difficult to project the level of capacity utilisation. Uncertainty surrounding the level of capacity utilisation also adds to the uncertainty about wage growth ahead.
Extraordinary conditions related to measuring prices
Through the pandemic, Statistics Norway has had to estimate the rise in prices for some services because containment measures have limited the availability of these services. After the reopening of society, there has again been a basis for measuring the real prices of all main groups in the price index from September 2021.
As an economic support measure, the lowest rate of value added tax (VAT) on goods and services was temporarily reduced from 12% to 6% from 1 April 2020. This lower VAT rate was discontinued from 1 October 2021. It is assumed that owing to the changed VAT rate, businesses have increased their prices, but by less than the increase in VAT. Since the entire VAT increase is subtracted when calculating the tax-adjusted price level, the VAT increase will in isolation pull down CPI-ATE inflation in our projections.
Under the Government’s electricity support scheme for households, consumers will pay a lower price for some of their electricity consumption in December 2021 and the first three months of 2022. It is unclear how Statistics Norway will take the scheme into account when calculating CPI inflation. Norges Bank has not adjusted its projections for the electricity support scheme but has taken into account that it will push up household disposable income.
13 Period: 2015 –2022. Annual wages: Actual wage growth from Statistics Norway. Norges Bank’s projections for 2021 and 2022. Norges Bank’s Expectations Survey: Social partners’ wage growth expectations for the current year as measured by Norges Bank’s Expectations Survey in Q4 each year. Expectations for 2022 in 2021 Q4. Regional Network survey: Expected annual wage growth for 2021 as reported in Q4 each year.
14 Period: 2015–2024. Projections from 2021. Real wages: Nominal annual wage growth less CPI inflation.
15 Period: January 2015 – November 2021. CPI-ATE: CPI adjusted for tax changes and excluding energy products. Median: Median value of 12-month change for other indicators of underlying inflation (CPIM, CPIXE, 20 percent trimmed mean, weighted median, CPI-XV and CPI common). Indicators: Highest and lowest 12-month change for other indicators of underlying inflation.
16 Period: 2015 Q1 – 2024 Q4. Projections from 2021 Q3 in MPR 3/21 and 2021 Q4 in MPR 4/21. CPI-ATE: CPI adjusted for tax changes and excluding energy products.
New virus variant contributes to heightened uncertainty about the outlook for the pandemic
A new flare-up of the Delta variant has pushed up global infection rates in recent months after a somewhat slower rise in September. Infection rates have also increased markedly in Norway and are now at record-high levels. In addition, uncertainty about the evolution of the pandemic has increased substantially as a result of the spread of the new Omicron variant. A high and still rising vaccination rate is in isolation easing the disease burden, but increasing transmission has nevertheless led to a rise in Covid-related hospital admissions. Owing to mounting pressure on the health system and uncertainty about Omicron, the Government has reintroduced a range of national containment measures in recent weeks.
High infection rates increase the disease burden
Infection rates in Norway have shown a clearly rising tendency since the beginning of October. Hospital admission rates have also risen, although less than the experience of previous waves would imply. The increase in new cases has been particularly marked in the youngest age groups. In the oldest age group (aged 80 and above), infection rates have fallen slightly in recent weeks. Possible explanations for the decrease are a higher degree of self-regulation and that most people in this age group have received a booster vaccine dose.
In the September Report, it was assumed that a seasonal rise in infection rates could occur in autumn, but the rise over the past few months has been far stronger than envisaged. It is expected that infection rates will continue to edge up ahead, but that booster vaccine doses and tighter Covid restrictions will result in a gradual decline in new cases in the new year. Owing to the emergence of the Omicron variant, uncertainty about the evolution of the pandemic is particularly high, with regard to both the prospects for transmission and the disease burden. Preliminary data suggest that Omicron is more transmissible than the Delta variant and that it could soon become the dominant variant in Norway.
Transmission has also picked up again internationally over the past month. Transmission rates are highest in Europe but have also risen in the US and several Asian countries and are in some cases at their highest since the pandemic began. Information about the global spread of the new Omicron variant is currently limited. However, several countries with solid data on virus variants, such as Denmark and the UK, have registered a sharp increase in the number of Omicron cases in recent weeks. As in Norway, Covid-related hospital admissions have generally risen less than during previous infection waves, but many countries are reporting that their health services are under heavy strain, not only because of Covid but also other virus infections.
Booster dose will be offered to all adults
After a marked rise in vaccination rates through September, the trend in the fully vaccinated share of the population in Norway has levelled off. Developments have been broadly as envisaged in the September Report. So far, close to 80% of the Norwegian population have received at least one vaccine dose, and around 72% are so far fully vaccinated.1 The fully vaccinated share is highest in the oldest age groups, and among those over 65 years of age, 97% are fully vaccinated. In the 18-44 age group, around 80% are fully vaccinated. This share is assumed to increase somewhat ahead.
Several studies suggest that protection against severe illness and death is very high up to six months after the second vaccine dose. The effect seems to wane thereafter. However, there are also clear indications that a booster dose restores vaccine protection. It is assumed that everyone over the age of 45 will be offered a third dose by mid-January 2022 and that everyone in the 18-44 age group will receive the same offer by Easter, in line with the health authorities’ revised plans. This will contribute to maintaining a high level of effective protection against severe illness.
There are nevertheless indications that existing vaccines provide less protection against infection and transmission of the new variant. Given that Omicron becomes the dominant variant, effective protection against transmission in the population will then be somewhat reduced. The level of protection against severe illness is expected to remain relatively high.
Since the September Report, vaccination programmes in many trading partner countries have been expanded. The rise in vaccination rates among Norway’s advanced economy trading partners is assumed to continue in the period to summer 2022. Vaccination rates in emerging economies have picked up somewhat. At the same time, fears of new virus variants have increased the pressure to share vaccine patents globally, which could improve access to vaccines ahead. Full vaccine coverage in all emerging economies is nevertheless only expected to be achieved in a few years, broadly as assumed in the September Report.
New national measures
At the end of September, the authorities removed all remaining social distancing measures and “normal everyday life with increased preparedness” was resumed. As a result of local outbreaks in the wake of reopening, some municipalities introduced moderate measures. In view of accelerating transmission of the Delta variant in many parts of the country and concerns about Omicron’s transmission potential, the Government has introduced a range of national containment measures in recent weeks, including a ban on the serving of alcohol, increased working from home, restrictions on attendance at private gatherings and public events, face covering requirements and the reintroduction of the one-metre rule.
With the introduction of new national measures and prospects for higher transmission rates in the near term, restrictions ahead will likely be considerably stricter than assumed in September. This contributes to a downward adjustment of the activity level over the next six months. It is assumed that already introduced measures and booster doses for an increasing share of the adult population will gradually curb the rise in infections and give room for a gradual reversal of the national measures in 2022 Q1. Further measures may nevertheless be needed in the near term.
As a result of the rise in new cases through autumn, several of Norway’s trading partners have introduced new containment measures on a somewhat larger scale than assumed in September. The ongoing rise in infection rates and the spread of the new Omicron variant are expected to lead to a higher level of measures ahead than assumed in the September Report.
Considerable uncertainty in the near term
With the spread of Omicron, uncertainty has increased in the near term about the evolution of the pandemic, particularly in terms of Omicron’s transmissibility and ability to cause severe illness and to what extent existing vaccines will continue to provide protection against the new variant. Increased uncertainty has to some extent been included in the projections in this Report, but there is still a risk that developments will be even weaker than currently assumed, particularly in the near term.
On the other hand, progress has been made in the medical treatment of Covid, which could markedly reduce the disease burden in the slightly longer term and thereby improve the ability to manage new waves of infection without restrictions.
1 Fully vaccinated people are those who have i) received two vaccine doses or ii) have had Covid-19 and received one vaccine dose, in whichever order.
Impact of global supply chain bottlenecks on prices and activity in Norway
High demand and bottlenecks in global supply chains have in the past year led to a sharp rise in freight rates and prices for raw materials and other internationally traded goods. This will likely pull up inflation in Norway ahead. Global supply chain problems are also having an impact on activity in some segments of the economy.
External price impulses have increased markedly
Prices for many internationally traded goods and services have risen markedly since summer 2020. Container freight rates in particular are now far above historical levels (Chart 3.D). These price increases, combined with increased capacity utilisation and accelerating wage growth, have led to high core inflation for several of Norway’s trading partners (Chart 3.D). Core inflation in Norway, as measured by the CPI-ATE (CPI adjusted for tax changes and excluding energy products), slowed through the first half of 2021 and has been around 1% since July. This reflects low wage growth and the krone’s substantial appreciation since spring 2020. The factors that have driven up global inflation are also expected to push up inflation in Norway in the coming year.
Chart 3.D Higher inflation among a number of Norway’s trading partners and high freight rates1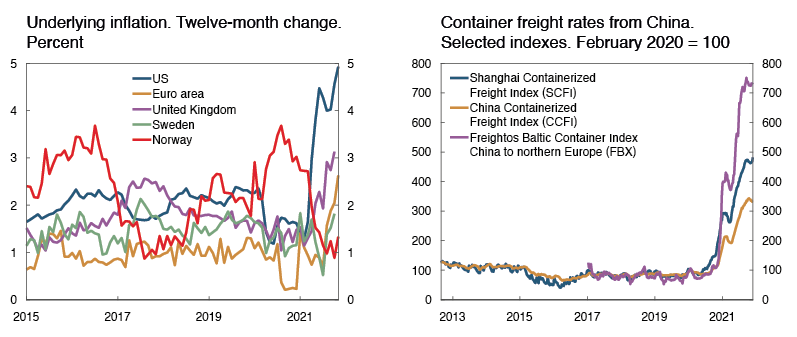
Prices for imported consumer goods are an important factor driving consumer price inflation. Consumer prices in Norway will also be influenced by international freight rates and prices for raw materials and other intermediate goods. Norges Bank has constructed an indicator for international prices for consumer goods imported to Norway (the IPK indicator). This indicator measures developments in international producer prices for imported consumer goods in foreign currency terms. The IPK is expected to rise by 2.0% in 2021 and 2.3% in 2022. This is higher than projected in the September Report and considerably higher than the average rise in the IPK so far in the 2000s, which is around 0.3%. This contributes to higher projections for consumer price inflation than in the September Report.
A large share of the goods imported to Norway is transported by ship from Asia. High goods demand during the pandemic has led to unusually high demand for container freight in international freight markets. Together with Covid-related lockdowns and container shortages in Asia, this has led to overloaded ports and soaring prices for container freight from Asia to Western countries. The price increase has been amplified by reduced air freight capacity owing to low travel activity and fewer flights than normal during the pandemic. This is probably part of the reason why a number of the Bank’s Regional Network contacts report a substantial rise in freight costs and that they plan to raise prices ahead as a result.
Increased price impulses will push up inflation in Norway
Transportation costs have normally made up a small share of goods import costs, and fluctuations in freight rates appear to have had little impact on consumer prices. Freight costs for the transportation of goods to Norway have therefore up to now not been included in the Bank’s calculation of the IPK indicator. However, the recent rise in freight rates is so substantial that it has considerably increased goods import costs and may thereby have a material effect on inflation ahead.
In order to assess the impact of higher freight rates on consumer prices in Norway, the IPK has been expanded to include the cost of transporting goods to Norway. One difficulty of calculating the IPK including freight costs is the lack of information about the freight cost percentage of imported goods prices. Based on information from the industry, the Bank’s own empirical analyses and studies from other countries, international transport costs in normal times are estimated to account for 2% of the cost of importing goods to Norway.
Projecting the IPK including freight costs also requires a freight rate forecast. There is no open marketplace for container freight futures prices that such projections could be based on. Both market analysts and large shipping companies have, however, communicated that freight rates will likely remain higher than normal for at least 12 months ahead. Reasons include that it takes time to build new container ships and that the logistics challenges at ports – in the US in particular – will likely not be resolved until goods demand slows. A normalisation of global goods demand is expected ahead as services consumption picks up. At the same time, there are signs that some supply-side problems are being reduced, for example through better utilisation of US port capacity. It is therefore assumed that freight rates have now peaked and will fall gradually through 2022, normalising in 2023. Higher infection rates and new containment measures as a result of the Omicron variant may, however, delay the shift of consumption from goods to services and lead to new lockdowns. There is therefore a risk that Covid may exacerbate the supply-side problems in freight markets, which in turn may lead to a further rise in prices, and it may take longer than currently projected for freight rates to normalise.
The rise in freight rates in 2021 pushes up the rise in the IPK by about 5 percentage points in 2021 (Chart 3.E). It will likely take some time for the rise in freight rates to pass through to consumer prices, and the maximum effect on 12-month CPI-ATE inflation is projected to be 0.3 percentage point at the end of 2022. The delay in the pass-through is both because some freight rates are contract rates fixed for a specific time period, often a year, and because firms will likely pass on the rise in prices to consumers over time. Towards the end of the projection period, normalising freight rates and a less pronounced rise in foreign producer prices will contribute to lower inflation. The overall effect on consumer prices of the rise in freight rates is, however, highly uncertain and the Bank’s inflation projections are more uncertain than usual as a result.
Chart 3.E Higher freight rates lift inflation in 20222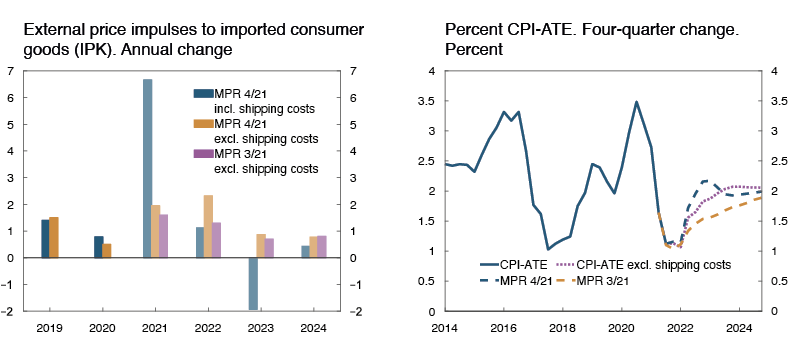
Activity dampened by supply chain problems and higher investment costs
Activity in the economy is also being affected by supply chain problems and the sharp increase in prices for some goods and services. Many firms have reported to the Regional Network that activity is being dampened by shortages of intermediate goods and/or similar problems among customers.
Manufacturing output in Norway and abroad has been constrained by shortages of some intermediate goods in recent quarters. Activity in the European car industry in particular has fallen markedly as semiconductor production has not been high enough to meet demand. Lower demand from car manufacturers abroad and intermediate goods shortages have in turn led to lower output in the Norwegian car parts industry. Global supply chain problems have also curbed output in other manufacturing segments. Norway’s manufacturing output is expected to be limited by intermediate goods shortages and corresponding production constraints among customers for a period ahead.
Investment is being affected by the sharp rise in prices for internationally traded goods. Residential construction costs have risen markedly as a result of the increase in lumber, metal and cement prices over the past year, reducing profitability for planned housing projects and leading to postponement for some projects. This has in turn contributed to broadly unchanged construction activity over the past year despite strong economic growth. Higher costs have also likely led to lower business sector investment. Of the firms in the manufacturing sector, 10% now report to Statistics Norway’s business sentiment survey that investment is being held back by high prices for investment goods, twice the pre-Covid number. High investment costs are assumed to dampen business sector investment somewhat over the coming year.
Owing to supply chain problems, goods shortages have affected many retail firms. Some report to the Regional Network that this has had a substantial impact on sales. Others report that sales have not been materially affected since customers have largely shifted demand to product alternatives that are not affected by delivery problems. For some firms, sales may also have increased as a result of goods shortages among competitors. Overall, delivery problems in the retail industry are expected to have a limited effect on household consumption and overall activity in the Norwegian economy.
Even though several firms in the Regional Network report that output is being constrained by intermediate goods shortages, network contacts generally report expectations of solid growth ahead. This is likely both because demand in many industries is high and because the supply of intermediate goods is expected to improve in the coming year.
1 Period: January 2015 – November 2021 for consumer prices. September 2011 – December 2021 for SCFI and CCFI. January 2017 – December 2021 for FBX. Underlying inflation is CPI excluding food and energy for USA and excluding food, energy, tobacco and alchohol for Euro Area and the UK. Excluding energy for Sweden. SCFI is a weighted average on spot rates for shipping of containers by ship from Shanghai to different destinations. CCFI is a weighted average of spot and contract rates for shipping of containers by ship from China to different destinations. FBX reflects spot rates for shipping of containers by ship from China to northern Europe.
2 Period: 2019 – 2024 for IPK and 2014 Q1 – 2024 and 2014 Q1 – 2024 Q4 for CPI-ATE. Projections from 2021 Q3 for MPR 3/21 and Q3 2021 for MPR 3/21. IPK including shipping costs is based on the development in the subindex CCFI, China to Europe. CCFI reflects to a larger extent prices on existing contracts for container freight than indexes only based on spotrates, such as SCFI and FBX.
4 Monetary policy analysis
The policy rate was raised from 0.25% to 0.50% at the Committee meeting on 15 December. The Committee expects that another rate hike will most likely take place in March. The policy rate forecast indicates a further rate rise to around 1.75% over the coming years.
The forecast implies broadly the same monetary policy stance as in the September 2021 Monetary Policy Report. Prospects for higher price and wage inflation ahead than envisaged earlier suggest a slightly faster rate rise than in the September Report, while weaker growth prospects in the near term pull in the opposite direction.
The forecasts are uncertain. If the outlook or the Bank’s assessment of economic relationships changes, the policy rate forecast will also be adjusted.
4.1 Objectives and recent developments
Low and stable inflation
The primary objective of monetary policy is low and stable inflation. The operational target is annual consumer price inflation of 2%. Between the introduction of the inflation target in 2001 and March 2018, the target was 2.5%. Annual consumer price inflation has averaged 2% since 2001 (Chart 4.1).
Chart 4.1 Average inflation close to target1 Consumer price index (CPI). Four-quarter change. Percent 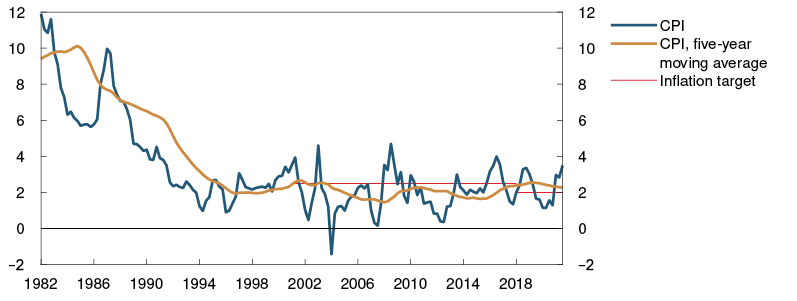
Inflation targeting shall be forward-looking and flexible so that it can contribute to high and stable output and employment and to countering the build-up of financial imbalances. The monetary policy strategy is discussed further in “Norges Bank’s monetary policy strategy”.
Somewhat less expansionary monetary policy
In September, the policy rate was raised to 0.25% after having stood at 0% since spring 2020. The low policy rate has resulted in a very low money market rate, both in nominal and real terms (Chart 4.2).
Chart 4.2 Low real interest rate2 Three-month money market rate and real interest rates. Percent 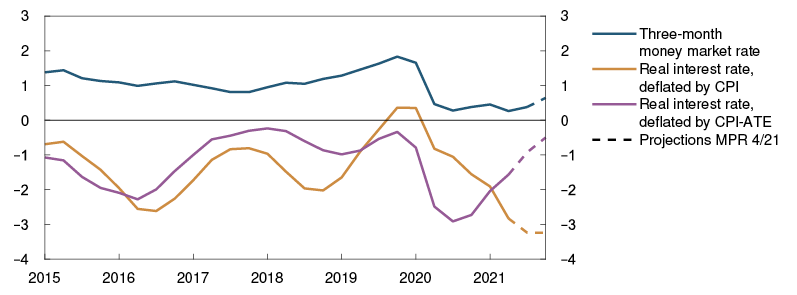
To assess the degree of monetary accommodation, the interest rate level is compared with what is estimated to be a neutral level. The neutral rate of interest is the rate that is consistent with balanced developments in the economy in the medium term, and the monetary policy stance is assumed to be expansionary as long as the rate is below its neutral level. Both nominal and real interest rates have implications for the tightness of monetary policy. With inflation expectations anchored close to the inflation target, the neutral level of the policy rate is estimated at close to 1.7%. The neutral real money market rate, ie the money market rate adjusted for inflation, is estimated at close to 0% (see box in Monetary Policy Report 2/21).
The money market rate has moved up over the past six months. This implies that monetary policy is somewhat less expansionary than previously. Developments in the real interest rate adjusted for CPI-ATE inflation also suggest that monetary policy has become less expansionary over the past year. The money market rate adjusted for CPI inflation reflects the rapid rise in energy prices. The real interest rate adjusted for CPI inflation has recently fallen but is expected to rise in the period ahead.
4.2 New information and new assessments
Model-based interpretation of new information
To shed light on how new information influences the economic outlook, new information and assessments are incorporated into the modelling system, while conditioning on the policy rate path in the September Report. In the years ahead, the money market premium is expected to be lower than earlier. This means that the money market rate in the exercise conditioned on an unchanged policy rate path is lower than in September. In this exercise, the main focus is on the outlook for capacity utilisation and inflation, two of various considerations to which the Committee gives weight in the conduct of monetary policy.
Capacity utilisation is projected to fall in the near term and turn out lower than in the September Report, as higher infection rates and tighter Covid restrictions are projected to curb economic activity in the near term. When infection rates subside further out and containment measures are eased, the economic upswing is expected to continue. The output gap projection conditioned on an unchanged policy rate path will be broadly as projected in September in 2023 and 2024 (Chart 4.3).
Chart 4.3 Outlook for lower capacity utilisation in the next year3 Estimated output gap. Conditioned on new information concerning economic developments and the policy rate forecast in MPR 3/21. Percent 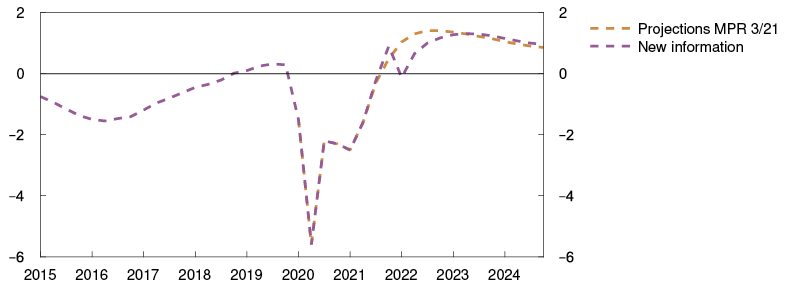
Underlying inflation measured by the CPI-ATE has slowed since autumn 2020 but has been slightly higher than projected in the September Report. Higher global inflation and elevated freight rates suggest an increase in imported inflation ahead. Owing to labour shortages in some industries and increased wage expectations, the wage growth projections for 2021 and 2022 have been revised up. Conditioned on an unchanged policy rate path, the inflation projections have been revised up compared with the projections in the September Report (Chart 4.4).
Chart 4.4 Prospects for higher inflation4 CPI-ATE. Projections conditioned on new information concerning economic developments and the policy rate forecast in MPR 3/21. Four-quarter change. Percent 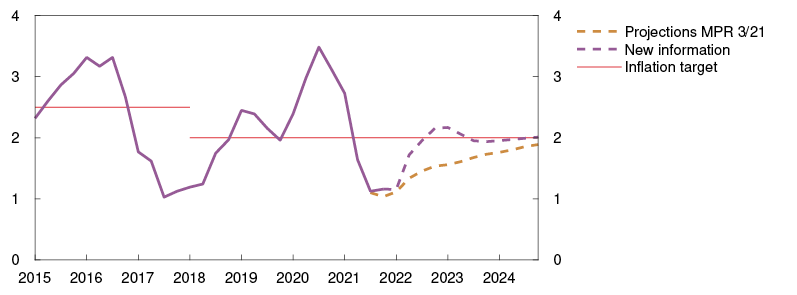
The model exercise provides mixed signals about how the rate path should potentially be adjusted. On the one hand, prospects for higher inflation than projected earlier may suggest reduced need for an expansionary monetary policy to bring inflation close to 2%. On the other hand, lower capacity utilisation in the near term may suggest that the policy rate path should be normalised more gradually than indicated by the policy rate path in the September Report.
A simple rule implies a higher rate path than in September
A simple estimated rule based on Norges Bank’s previous policy rate setting summarises the historical pattern of monetary policy reaction. By using the change in the capacity utilisation and inflation projections we can see how the rate path has previously reacted to news (see “Simple interest rate rule as a cross-check of monetary policy”).
In this Report, the simple rule implies a slightly higher rate path in the near term than what the rule implied with the projections from the September Report (Chart 4.A). The upward revision of the inflation projections thus matters more for the policy rate under the simple rule than lower capacity utilisation in the near term. The simple rule does not take into account that some of the rise in inflation in 2022 is due to a temporary jump in freight rates, which is reversed further out. In such a situation, the historical response pattern could exaggerate the effect on the policy rate. On the other hand, the rule does not take into account that the decline in capacity utilisation is also expected to be temporary.
Forward rates indicate a slightly lower policy rate path
Forward money market and bond rates can provide an indication of expectations of future policy rate changes. Changes in market rates can indicate how market participants interpret new information and how they believe Norges Bank will respond. Even though forward rates can be volatile, as they have been recently, they can function as a cross-check of whether monetary policy is in line with Norges Bank’s previous forward guidance and response pattern.
In the wake of the news regarding the Omicron variant, policy rate expectations fell, after having risen earlier in autumn. Overall, estimated forward rates throughout the projection period are little changed since September (Chart 4.5). Market rates indicate a more gradual policy rate rise than indicated by the Bank’s forecasts, and the gap is wider than in the September Report. A possible reason that forward rates track below the forecasts is that the market expects weaker economic developments in the years ahead, or that a greater downside risk is being priced in than assumed. Developments in forward rates since September up to 10 December indicate that the market interprets the sum of new information as fairly neutral for the policy rate outlook.
Chart 4.5 Small changes in policy rate expectations5 Percent 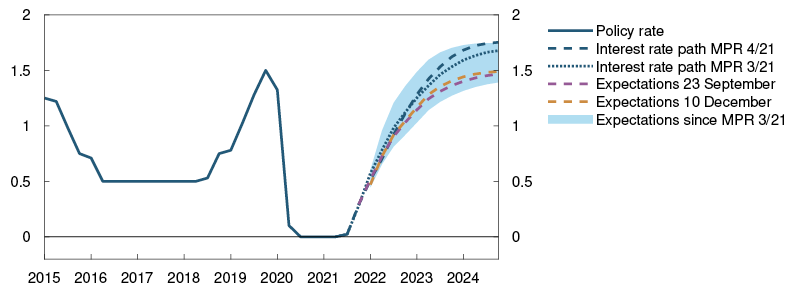
Policy rate to rise further
At the Committee meeting on 15 December, the policy rate was raised from 0.25% to 0.5%. Moreover, the Committee expects that the policy rate will most likely be raised further in March. In line with the Committee’s assessment, the policy rate path implies a further rise in the coming years. Towards the end of 2024, the policy rate is projected at around 1.75% (Chart 4.6). The path is little changed since the September Report.
Chart 4.6 Towards a neutral monetary policy6 Percent 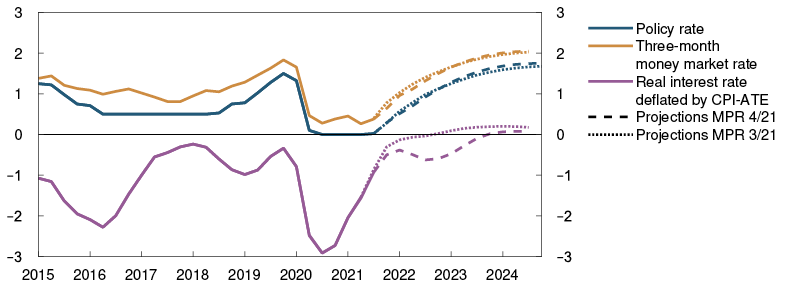
The policy rate path is the Bank’s forecast of the policy rate for the coming years and expresses the Committee’s trade-off between monetary policy objectives. If the economic outlook, the balance of risks or the assessment of the functioning of the economy change, the policy rate may prove to be different from the one indicated by the policy rate path.
Both nominal and real interest rates have implications for how monetary policy affects the Norwegian economy. The forecasts for the policy rate and the nominal money market rate imply that monetary policy will be less expansionary, and eventually neutral, in the course of the projection period. The projected path of the real interest rate suggests that monetary policy will be approximately neutral towards the end of the projection period.
The real money market rate in the coming quarters is lower than in the September Report, owing to higher projected inflation. Further out in the projection period, the real interest rate is little changed. Increased external price impulses and higher wage inflation in 2021 and 2022 will push up underlying inflation, indicating that a gradual rise in the policy rate is now appropriate. Capacity utilisation is projected to be lower in the coming year than in September, but the decline is expected to be temporary. With prospects for a positive output gap and inflation remaining close to the target, the need for expansionary monetary policy will fade out over the projection horizon.
Monetary policy shall contribute to countering the build-up of financial imbalances. When the policy rate rises to prevent inflation from becoming too high, it also helps to dampen house price inflation and credit growth (see further discussion of financial imbalances in Section 5).
3 Period: 2015 Q1 – 2024 Q4. The output gap measures the percentage deviation between mainland GDP and projected potential mainland GDP.
4 Period: 2015 Q1 – 2024 Q4. Projections from 2021 Q4. CPI-ATE: CPI adjusted for tax changes and excluding energy products.
5 Period: 2015 Q1 – 2024 Q4. Projections from 2021 Q3 for MPR 4/21 and 10 December. Projection from 2021 Q2 for MPR 3/21 and 23 September. Expectations since MPR 3/21 show highest and lowest policy rate expectations in the period between 23 September and 10 December.
6 Period: 2015 Q1 – 2024 Q4. Projections from 2021 Q3 for MPR 3/21 and 2021 Q4 for MPR 4/21 for the real interest rate calculated with the CPI-ATE. Projections from 2021 Q3 for MPR 3/21 and 2021 Q4 for MPR 4/21 for the policy rate.
4.3 Decomposition of changes in the rate path
The decomposition shown in Chart 4.7 illustrates the main drivers behind the change in the rate path from the September Report. The bars show contributions to changes in the rate path based on our main model NEMO, and the broken black line shows the sum of the bars. The solid line shows the actual change in the rate path.
Chart 4.7 Higher price and wage inflation pulls up the rate path7 Cumulative contribution. Percentage points 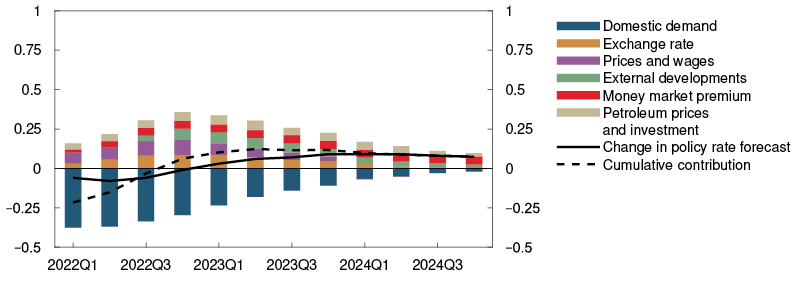
Activity in the Norwegian economy has recently been broadly as projected. But higher infection rates and a tightening of containment measures will dampen growthin the near term. Capacity utilisation is projected to be lower at the beginning of next year than projected in September, and will remain somewhat lower throughout 2022. This is primarily because Covid restrictions contribute to weaker growth in consumption than expected earlier. Overall, domestic demand pulls down the rate path (dark blue bars).
Underlying inflation has been slightly higher than projected in the September Report. Nevertheless, other information indicates that inflation ahead will turn out higher than projected earlier. There are prospects that external price pressures may be stronger than assumed earlier. Wage growth is also projected to hold up in 2022, despite lower capacity utilisation. Overall, prices and wages pull up the rate path throughout the projection period (purple bars). Today’s high freight rates are expected to have a temporary effect on inflation, and thus with little impact on the rate path and the wider economy.
Oil and gas futures prices are higher than in the September Report, which in isolation contributes to higher activity in petroleum-related industries. Petroleum prices and investment therefore pull up the rate path (beige bars).
The krone exchange rate is weaker than projected in the September Report. The interest rate differential against trading partners has narrowed a little since September, contributing to a weaker krone. On the other hand, petroleum prices have risen, which has had the opposite effect. In the modelling system, the exchange rate is weaker than implied by developments in driving forces. A weaker krone contributes in isolation to higher imported inflation and stronger net exports. This pulls up the rate path a little (orange bars).
Higher inflation prospects among of Norway’s trading partners have led to a rise in policy rate expectations. On the other hand, economic growth is expected to be a little lower in the near term than projected in the September Report. On balance, factors relating to external developments pull up the rate path a little (green bars).
The money market premium is projected to be lower than in the September Report. A permanently lower premium is expected to pass fully through to other market rates further out, pulling up the policy rate correspondingly (red bars).
Overall, factors that push up inflation suggest a higher policy rate path throughout the projection period. However, in the next six months, tighter containment measures will weigh on economic activity. The model-based analysis therefore implies a lower rate path in the near term, but a higher rate path from the end of 2022.
The policy rate forecast reflects the Committee’s monetary policy trade-offs, and the rate path has been revised less than suggested by the model analysis. In its overall assessment of the monetary stance, the Committee also takes into account other considerations that are not fully represented in the model analysis. According to the Committee’s assessment, the aim of stabilising inflation around the target in the medium term implies an increase in the policy rate to a more normal level. A gradual normalisation of the policy rate is consistent with continued high employment. Higher interest rates will also help mitigate a build-up of financial imbalances.
Simple interest rate rule as a cross-check of monetary policy
A simple estimated rule based on Norges Bank’s previous policy rate setting can provide information about the historical pattern of monetary policy reaction and function as a cross-check of the policy rate level and near-term forecasts. The interest rate rule estimated is given by:
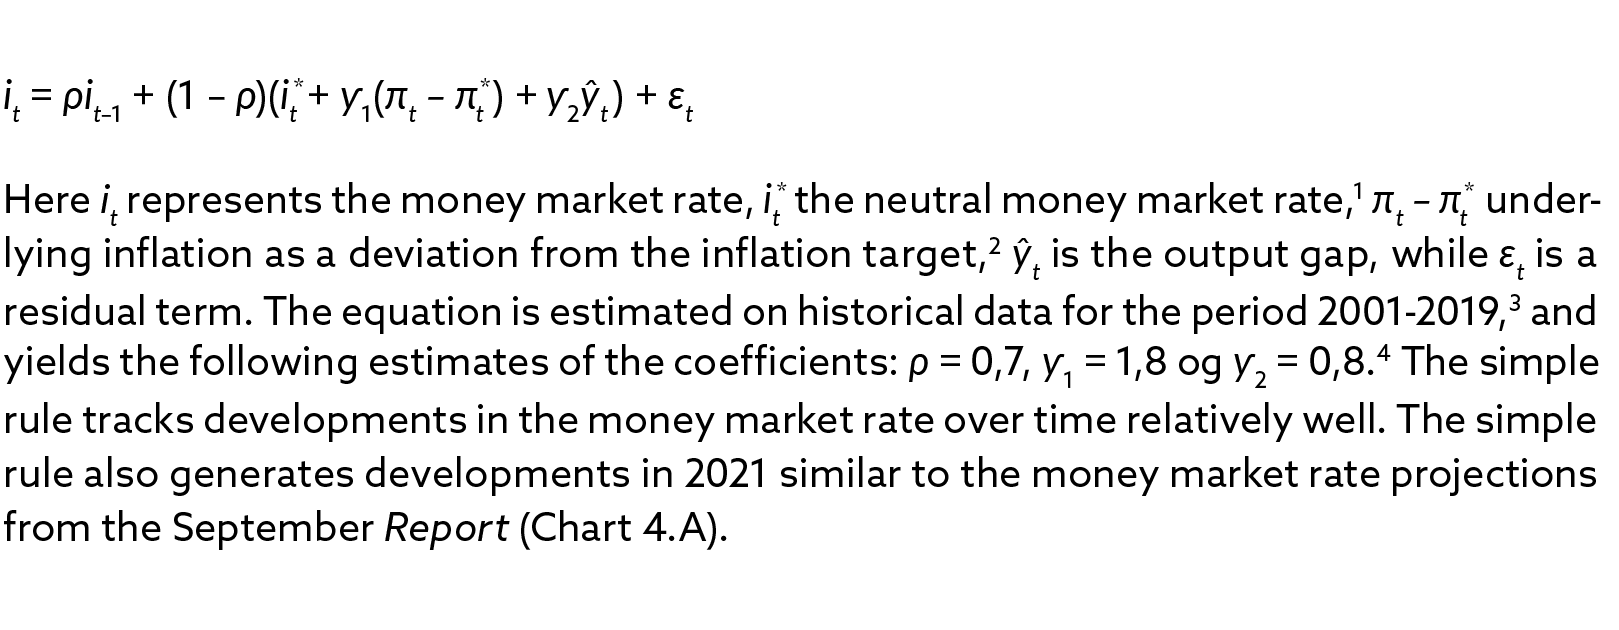
Chart 4.A Simple rule indicates an upward revision of the policy rate path1 Percent 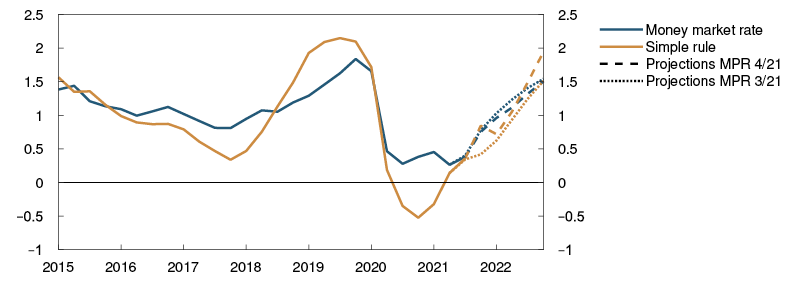
The simple rule can be useful for summarising the Bank’s response over time to new information on inflation and capacity utilisation, but it also has some weaknesses. For example, the rule overlooks other factors that are given weight in the conduct of monetary policy, such as the effect of very low interest rates and the risk of a build-up of financial imbalances. In addition, there is some inconsistency in the use of the simple rule as a cross-check of the policy rate path further out, since following a different rate path would also have resulted in different developments in inflation and capacity utilisation.
1 Period: 2015 Q1 – 2022 Q4. Projections from 2021 Q4 for MPR 4/21 and 2021 Q3 for MPR 3/21.
7 Period: 2022 Q1 – 2024 Q4. Projections. The contributions are based on model estimates, but there is no mechanistic link between news and changes in the bars. The effects of news feed through with a lag and the interaction between economic variables may result in a reversal of the effects over time. In addition, projections for the near term may entail different signs at different times. The effect on the rate path is therefore shown most clearly by the cumulative contribution.
Norges Bank’s monetary policy strategy
The Bank’s monetary policy strategy describes the Committee’s interpretation of the monetary policy mandate and provides a framework for the Committee’s assessment of how monetary policy will respond to different shocks. The strategy is summarised below, and the full text is published on Norges Bank’s website.
The operational target of monetary policy is annual consumer price inflation of close to 2% over time. Inflation targeting shall be forward-looking and flexible so that it can contribute to high and stable output and employment and to counteracting the build-up of financial imbalances.
Low and stable inflation
When setting the policy rate, Norges Bank aims to stabilise inflation, as measured by the annual rise in the consumer price index (CPI), around the 2% target. Provided there is confidence in low and stable inflation, variations in inflation around the target are not likely to engender any significant economic costs. How quickly the Bank seeks to return inflation to target will depend on the shocks that have occurred and whether there are conflicts between achieving the target and other monetary policy considerations. In interest rate setting the Bank gives weight to avoiding large and persistent deviations from the inflation target, whether above or below the target.
High and stable output and employment
Monetary policy can contribute to stabilising output and employment around the highest level that is consistent with price stability over time.
The economic costs of cyclical fluctuations are asymmetrical. High unemployment involves direct costs for both society and those unable to find employment. Very low unemployment, on the other hand, does not involve any direct costs, but only indirect costs potentially in the form of excessively high wage and price inflation. The Bank will therefore not aim to quickly close a positive output gap as long as there are prospects that inflation will remain within a range close to 2% and there are no signs of financial imbalances accumulating.
By preventing downturns from becoming deep and protracted, monetary policy can contribute to keeping unemployment from becoming entrenched at a high level so that the average level of employment over time is as high as possible.
Mitigating the build-up of financial imbalances
If there are signs that financial imbalances are building up, the consideration of maintaining high and stable output and employment may, in some situations, suggest keeping the policy rate somewhat higher than otherwise. This can to some extent mitigate the risk of a severe downturn further out. Nevertheless, the regulation and supervision of financial institutions are the most important tools for cushioning shocks to the financial system.
Response pattern
The policy rate influences inflation and the real economy with a lag, and the effects are uncertain. To reduce the risk of monetary policy contributing to economic instability, Norges Bank will normally respond less forcefully to shocks than if there had not been uncertainty about the transmission of monetary policy. Furthermore, the policy rate is normally changed gradually to make monetary policy more predictable and to reduce the risk of undesirable financial market volatility and unexpected reactions of households and firms. In situations where the risk of particularly adverse outcomes is pronounced, or if there is no longer confidence that inflation will remain low and stable, it may be appropriate to react more forcefully than normal in interest rate setting.
5 Decision basis for the countercyclical capital buffer
At its meeting on 15 December, Norges Bank’s Monetary Policy and Financial Stability Committee decided to increase the countercyclical capital buffer rate to 2.0%, effective from 31 December 2022. Based on the Committee’s current assessment of economic developments and the prospects for bank losses and lending capacity, the buffer rate will be raised to 2.5% in the first half of 2022, taking effect one year later.
Creditworthy businesses and households appear to have ample access to credit. Norwegian banks are profitable, their credit losses are low and they are well equipped to meet a higher countercyclical capital buffer rate while maintaining credit supply.
Losses ahead are expected to lie close to the average for the past 20 years. Extensive containment measures increase the uncertainty about the loss projections somewhat. A relative small share of banks’ exposures is to industries that have been most directly affected by containment measures. This limits banks’ risk of losses. If there is a need for more protracted containment measures that can pull down economic activity, bank losses may rise.
Prior to the reduction in March 2020, the countercyclical capital buffer rate had been set at 2.5% against the background of a build-up of financial imbalances over a long period. During the pandemic, residential and commercial property prices have increased substantially, and household credit growth has accelerated. Over the past six months, property price inflation has been more moderate. The consideration of financial imbalances suggests a higher buffer rate.
5.1 Access to credit
Banks have sufficient capacity to meet credit demand. The banks included in Norges Bank’s Survey of Bank Lending reported unchanged credit standards for households and businesses in 2021 Q3, and no changes are expected ahead.
Issuance volumes in the corporate bond market have been high over the past year. In recent weeks, risk premiums for most industries have risen slightly but are still low. Overall, creditworthy businesses and households appear to have ample access to credit.
5.2 Financial imbalances
Moderate price developments in the housing market
House prices have increased more than income through the pandemic (Chart 5.1). The rapid rise in prices during the pandemic has increased housing market vulnerabilities. This rapid rise reflects low residential mortgage rates and homebuyers’ preference for spending a higher share of income on housing, in part because remote working has increased and consumption opportunities have otherwise been limited. Over the past six months, house price inflation has been more moderate, and price developments in autumn were as projected (Chart 5.2). The decline in house price inflation probably reflects expectations of higher lending rates and a normalisation of household consumption patterns in pace with the reopening of society. In Norway, the decline has been most pronounced in Oslo, where in November, the 12-month rise was the lowest of the large Norwegian cities.
Chart 5.1 House prices have risen faster than income through the pandemic1
Index. 1998 Q4 = 100 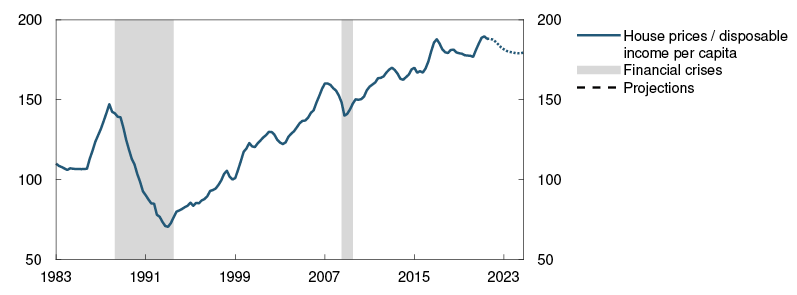
Chart 5.2 House price inflation has slowed over the past six months2
Percent 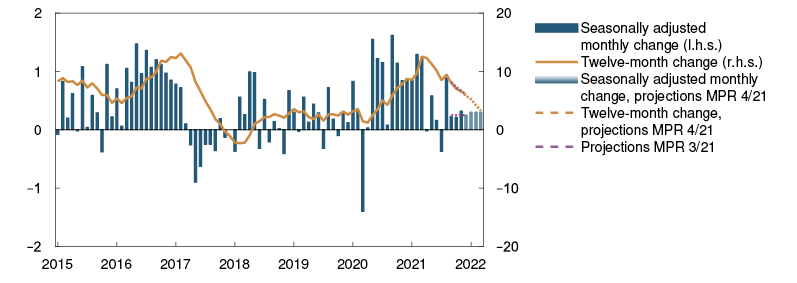
House price inflation has been high in many countries during the pandemic (Chart 5.3). Over the past six months, house price inflation has moderated in Scandinavia, while in other countries such as the US and the Netherlands, the rise in prices remains high.
Chart 5.3 House prises have risen in many countries3
Twelve-month change 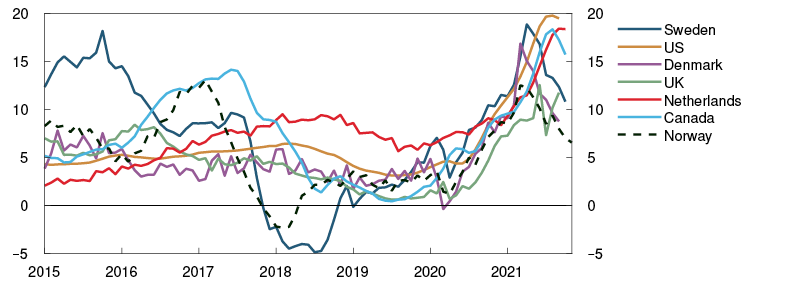
Turnover in the market for existing homes remains high (Chart 5.4). The stock of unsold existing homes has been at a low level since autumn 2020. In the market for new homes, sales picked up briskly in autumn 2020 and remained high until summer 2021 (Chart 5.5). Sales of detached houses and small dwellings (terraced and semi-detached houses) have recently fallen to historically low levels, while sales of flats have remained high. Overall activity in the market for new homes recently fell somewhat but remains at a high level. The low turnover of new houses reflects a substantial rise through 2021 in timber prices, which are an important factor input in homebuilding, see “Impact of global supply chain bottlenecks on prices and activity in Norway”. The sharp rise in construction costs has contributed to reducing housing investment and housing starts, although this effect is expected to be temporary (see further discussion in Section 3).
Chart 5.4 High activity in the market for existing homes4
Thousands of existing homes 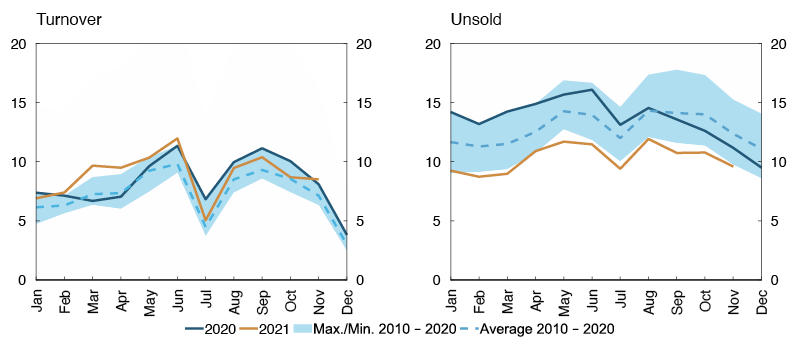
Turnover. Hundreds of new homes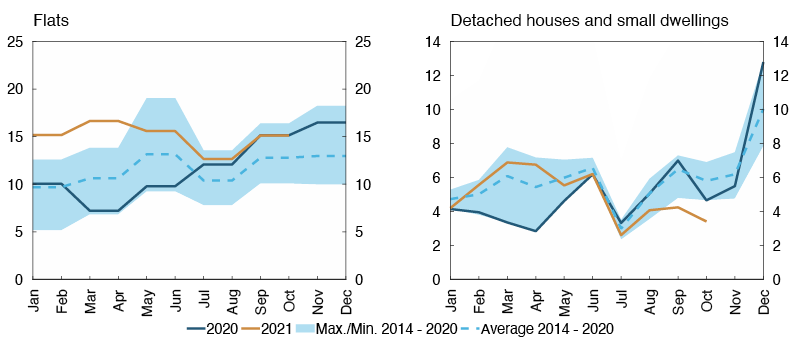
Moderate house price inflation is expected ahead (Chart 5.6). Higher lending rates and increased residential construction will dampen house price inflation. High housing market activity, few unsold homes and prospects for higher disposable income are holding up house price inflation. The projections for 2022 have been revised up somewhat from the September 2020 Monetary Policy Report, owing in part to the reintroduction of containment measures, prospects for lower residential construction and somewhat lower lending rates than projected earlier.
Chart 5.6 Moderate house price inflation ahead6
House prices. Four-quarter change. Percent 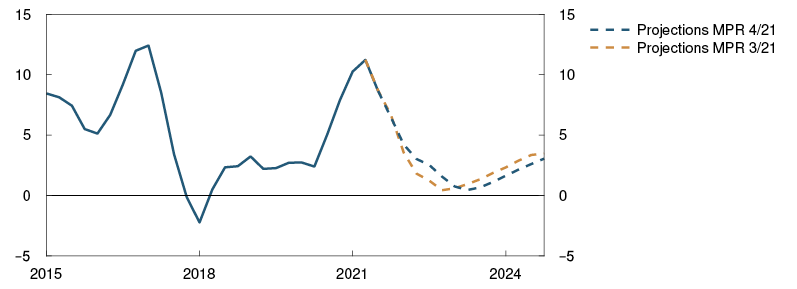
Household sector vulnerabilities
High household debt and high house price inflation through the pandemic are key household sector vulnerabilities (see discussion in Financial Stability Report 2021). Household debt is dominated by residential mortgage loans, and debt developments are closely associated with house price developments. Sharp and abrupt falls in house prices can therefore markedly reduce housing wealth for many.
Periods of persistently high house price inflation and credit growth increase household sector vulnerabilities. If house prices rise faster than incomes, households become more vulnerable to income loss and higher interest rates. Without financial buffers in such a situation, households may need to tighten consumption. Such a tightening may contribute to amplifying a downturn in the Norwegian economy. This may reduce firms’ earnings and debt servicing capacity and in turn result in higher losses on banks’ corporate exposures.
Household credit growth is decelerating
Household credit growth accelerated between spring 2020 and summer 2021, driven by high activity and price inflation in the housing market. However, credit growth has levelled off and fallen back somewhat through summer and autumn. This slowing indicates that the effect of high activity and price rises in the housing market on credit growth has faded away. Looking ahead, household credit growth is expected to decline further, in parallel with continued moderate house price inflation and higher lending rates (Chart 5.7).
Chart 5.7 Lower credit growth ahead7
Credit. Four-quarter change. Percent 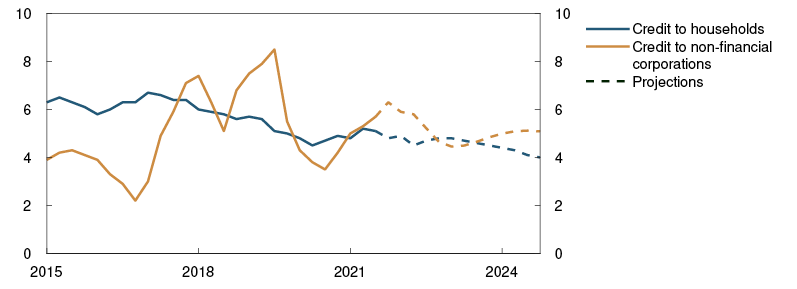
Household debt-to-income (DTI) ratios are at high levels after rising over a long period (Chart 5.8). Overall, DTI ratios have edged up somewhat through 2020 and 2021. Finanstilsynet’s (Financial Supervisory Authority of Norway) residential mortgage lending survey shows that the share of new mortgage loans with a DTI above five fell considerably following the introduction of the regulation on requirements for new residential mortgage loans in 2017 (Chart 5.9).8 At the same time, the share of new mortgage loans with a DTI close to five has increased markedly in recent years. The Bank’s projections for credit and income growth imply that household leverage will be fairly flat in 2022, before rising again somewhat from 2023 (Chart 5.8). Furthermore, with higher lending rates ahead, interest expenses will increase relative to household income. On the other hand, high saving during the pandemic has boosted households’ financial buffers, which makes them better equipped to face higher interest expenses (see also discussion in Section 3).
Chart 5.8 Household leverage expected to increase somewhat9
Percent
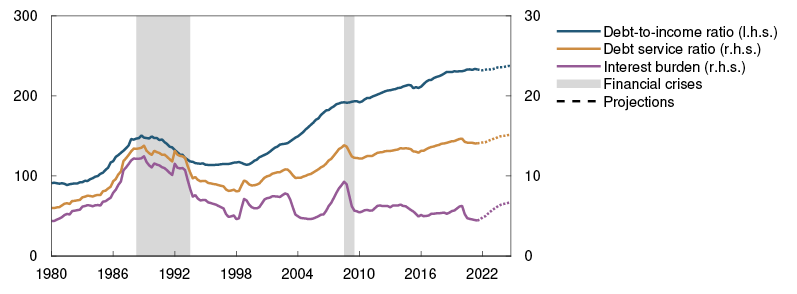
Sources: Statistics Norway and Norges Bank
Chart 5.9 Increasing debt-to-income ratios for new mortgage loans10
New mortgage loans by DTI ratio as percent of total loan volume 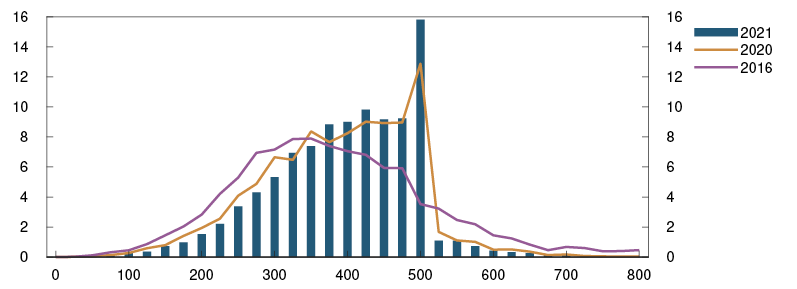
Growth in corporate credit from domestic sources has risen steadily since autumn 2020 (Chart 5.7) and has recently been stronger than projected. Low bond market premiums have contributed to high bond issuance over the past year, and bond issuance has been an important driver of the increase in credit growth. Commercial real estate (CRE) loans have contributed in particular to the sharp rise in bond issuance.
Developments in business investment are a key driver of corporate credit growth, which is expected to slow through 2022 (Chart 5.7). In pace with an increase in investment associated with the climate and energy transition (see Section 3), growth is expected to pick up again in the period to 2024.
Prospects for moderate commercial property price inflation
Commercial property selling prices are estimated as rental prices divided by a yield. Selling prices have risen markedly through the pandemic (Chart 5.10). At the beginning of the pandemic, selling prices fell as a result of reduced rents. However, the fall was more than reversed in the latter half of 2020 owing to a substantial fall in the yield. Rents and selling prices rose in 2021 Q2 and remained unchanged in autumn.
Chart 5.10 Moderate commercial property price inflation11
Selling prices for commercial property. In thousands of NOK per square metre 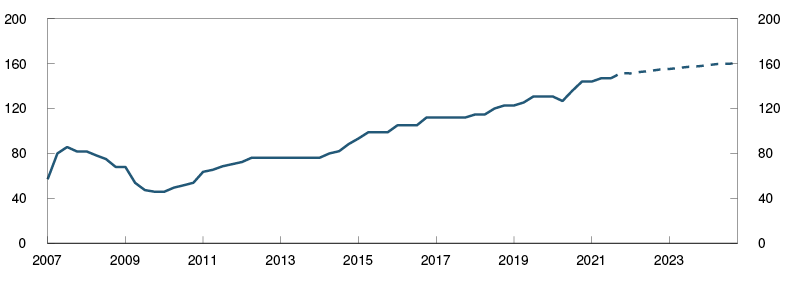
The yield, which depends on the risk-free interest rate and a risk premium, has remained at a record-low level since 2020 Q4. The risk premium, measured as the yield less the five-year swap rate, has been close to its pre-pandemic level over the past six months (Chart 5.11). The yield is low in Oslo compared with other European cities. Market participants point to various reasons for the low risk premium in Oslo, including the fact that Norwegian investors have substantial capital to invest.
Chart 5.11 Risk premium is low in Oslo12
Yield less five-year swap rate. Percentage points 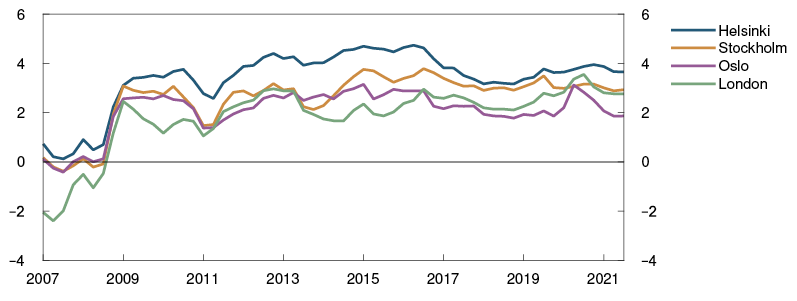
CRE companies have become more solid since before the financial crisis (Chart 5.12). Equity ratios fell slightly in 2020, yet remain at a historically high level. Owing to higher equity ratios, CRE companies are better able to weather a fall in prices than they were in previous financial crises. The increase in equity largely reflects the fact that the rapid rise in share prices in recent years has not been matched by a corresponding increase in borrowing. In Norges Bank’s Survey of Bank Lending 2021 Q3, banks reported unchanged or somewhat lower loan-to-value (LTV) ratios for new CRE loans over the past six months, compared with before the pandemic year 2020 . In isolation, this suggests that the equity ratios of CRE companies will rise in 2021. Banks’ CRE losses are expected to be low ahead.
A fall in selling prices could reduce CRE companies’ equity and increase banks’ losses. In Financial Stability Report 2021, low yields are considered a key source of cyclical vulnerability. A simple sensitivity exercise shows how a 15% fall in prices driven by a higher yield affects corporate equity ratios.13 In the sensitivity exercise, the equity ratios of a significant share of companies are reduced considerably (Chart 5.12). Companies with low equity ratios are the most affected by the fall in prices. The effect of a substantial fall in commercial property selling prices on bank losses will partly depend on the duration of the fall. A recent analysis conducted by Norges Bank14 shows that in the event of a persistent decline in property prices of just over 30%, driven by both a higher yield and lower rents, banks’ CRE losses could become about 25 times higher than normal for a couple of years following the fall in value.15
Chart 5.12 A fall in prices can reduce equity ratios16
Share of firms’ debt under each equity threshold. Percent 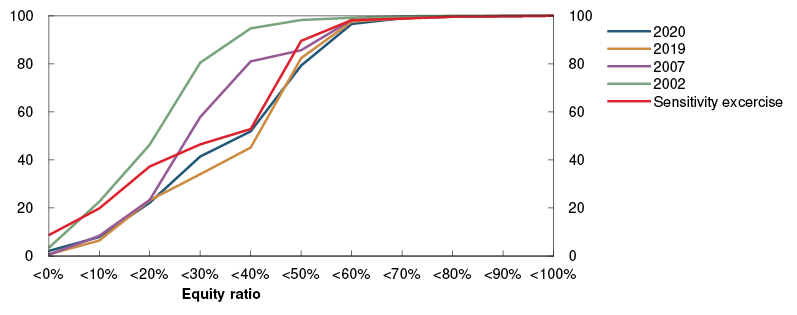
In line with continued economic growth, a moderate rise in commercial property prices is expected ahead. (Chart 5.10). Potential structural changes within different CRE segments are a source of uncertainty as to future price developments. In the office segment, which is especially important for financial stability no signs have yet been observed that structural changes will lead to a marked reduction in demand for office space.
New price statistics for prime office space
Norges Bank has recently changed its provider of price statistics for prime office space from CBRE to Jones Lang LaSalle (JLL) (see box in Financial Stability Report 2021). The new statistics cover a broader set of office premises, which entails lower rents and estimated selling prices. JLL’s and CBRE’s statistics both show a substantial increase in estimated real selling prices for prime real estate over an extended period. Moreover, JLL’s price statistics show a pronounced, albeit somewhat weaker, rise in prices than the CBRE statistics through the pandemic. The Bank’s assessment of CRE sector vulnerabilities is unchanged in the light of the new price statistics.
CRE sector vulnerabilities
Banks’ high CRE exposures and low yields are key financial system vulnerabilities (see discussion in Financial Stability Report 2021). Within the CRE market, the office segment is especially important for financial stability since banks’ exposure to this segment is substantial. A relatively large share of the stock of office buildings is in Oslo, and selling prices for prime office space in Oslo are therefore an important indicator of CRE sector vulnerabilities.
1 Period: 1983 Q1 – 2024 Q4. Projections from 2021 Q4. Disposable income is income after taxes and interest payments.
2 Period: January 2015 – March 2022. Projections for September 2021 – December 2021 for MPR 3/21 and December 2021 – March 2022 for MPR 4/21.
3 Period: January 2015 – November 2021. Figures up to and including September 2021 for the US, UK and Denmark, and up to and including October 2021 for Sweden, Canada and the Netherlands. Denmark is only for detached houses. Canada is a weighted average of 11 metro areas in Canada.
4 Period: January 2010 – November 2021.
5 Flats are from ECON Nye boliger and only include projects with more than 15 units. These statistic are issued for two-month periods. Detached houses and small dwellings are from the Norwegian Home Builders’ Association.
6 Period: 2015 Q1 – 2024 Q4. Projections from 2021 Q3 for MPR 3/21 and 2021 Q4 for MPR 4/21.
7 Period: 2015 Q1 – 2024 Q4. Projections from 2021 Q4. Non-financial corporations in mainland Norway.
8 The lending regulation includes a maximum DTI ratio requirement of five times gross income.
9 Period: 1980 Q1 – 2024 Q4. Projections from 2021 Q4. Debt-to-income ratio is loan debt as a percentage of disposable income. Disposable income is income after taxes and interest payments. Debt service ratio is interest and estimated principal payments as a percentage of after-tax income. Interest burden is interest payments as a percentage of after-tax income.
10 Sample of new repayment mortgages from the 30 largest banks in 2016, 2020 and 2021.
11 Period: 2007 Q1 – 2024 Q4. Projections from 2021 Q4. Prime office space in Oslo.
12 Period: 2007 Q1 – 2021 Q3. Prime office space.
13 For prime real estate, the fall in prices implies a 60 basis point increase in the yield. Properties are assumed to be carried at fair value, which means that book equity is reduced by the entire price fall.
14 See Hjelseth, I.N., H. Solheim and B.H. Vatne (2021) “Varig prisfall på næringseiendom kan gi store tap i bankene” [Persistent decline in CRE prices can lead to large bank losses]. Blog post published on the Bankplassen blog, 29 November 2021. Norges Bank (in Norwegian only).
15 The analysis suggests that the effect of a fall in prices on equity is dampened if companies carry properties at historical cost instead of at market value.
16 CRE groups with debt.
5.3 Banks
Profitability is the most important factor for banks’ loss-absorbing capacity. Return on equity for the largest Norwegian banks increased marginally to just above 11% in 2021 Q3 (Chart 5.13). Low credit losses have recently boosted banks’ profitability. Net interest income, which is banks’ most important income source, remains low compared with pre-pandemic levels. Higher interest rates are expected to lead to higher net interest income ahead.
Chart 5.13 Banks are profitable17
Return on equity. Annualised. Percent 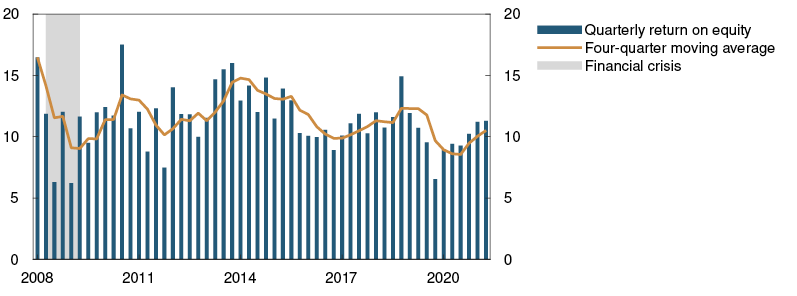
Banks’ credit losses have been low so far in 2021 (Chart 5.14). Banks’ total credit losses were just below 0.1% of gross lending in 2021 Q3, which is approximately half of the average for the past 20 years. Overall, large banks continued to make net impairment reversals in Q3, reflecting better-than-expected economic developments.
Chart 5.14 Credit losses are low18
Credit losses as a share of lending. Annualised. Percent 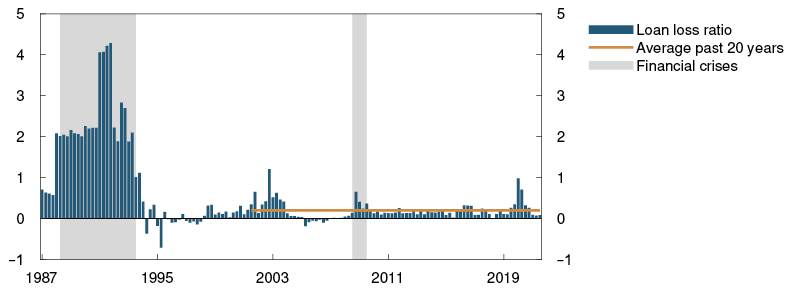
Somewhat higher losses are expected ahead, primarily owing to reduced impairment reversals and credit losses remaining close to the average for the past 20 years. Extensive containment measures increase the uncertainty about the loss projections somewhat. A relatively small share of banks’ exposures is to industries that have been most directly affected by containment measures. This limits banks’ risk of losses. If there is a need for more protracted containment measures that can pull down economic activity, bank losses may rise.
Norwegian banks are solvent. For the largest banks, Common Equity Tier 1 (CET1) capital ratios rose somewhat in 2021 Q3, and a majority of banks increased their margins over their capital measures thanks to solid earnings (Chart 5.15). Banks that reduced their margins experienced high lending growth.
Chart 5.15 Banks are well equipped to meet a higher buffer requirement19
Largest Norwegian-owned banking groups. Percent 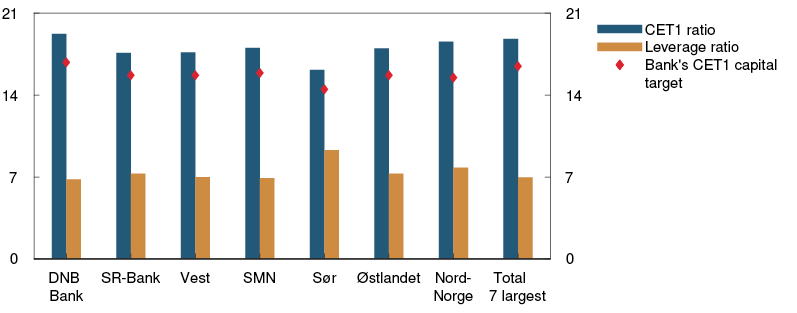
With a higher countercyclical capital buffer, banks are better equipped for future shocks. The stress test in Financial Stability Report 2021 shows that banks’ loss-absorbing capacity is fundamentally sound, partly owing to the ample margin by which banks now satisfy capital requirements. A higher countercyclical capital buffer rate will contribute to maintaining banks’ loss-absorbing capacity.
The CET1 ratio of the large Norwegian banks overall is expected to fall gradually towards approximately 17% in the coming years, which is equivalent to a capital margin above total capital requirements of 1% with a countercyclical buffer rate of 2.5% (see the baseline scenario in the stress test). Extraordinary dividend restrictions were lifted at the end of 2021 Q3, and banks are expected to retain a smaller share of profits than during the pandemic. This will pull down capital ratios. New requirements20 for internal ratings-based (IRB) models entail a tightening of risk weight calculation, which will reduce banks’ capital ratios. On the other hand, the EU Capital Requirements Regulation II (CRR II) will reduce risk-weighted exposures to SMEs and infrastructure projects. Banks are well equipped to meet a higher countercyclical capital buffer rate while maintaining credit supply.
17 Period: 2008 Q2 – 2021 Q3. Largest Norwegian-owned banking groups.
18 Period: 1987 Q1 – 2021 Q3. All banks and mortage companies in Norway.
19 At 2021 Q3. Total seven largest banks is a weighted average of the seven banks shown in the chart. Capital targets are defined here as regulatory requirements at 30 June 2022 with a 1 percentage point margin above the capital requirements.
20 See Finanstilsynet’s Circular of 9 June 2021 “Krav til IRB-modeller i banker, kredittforetak og finansieringsforetak” [Requirements for IRB-models for banks, mortgage companies and finance companies] (in Norwegian only).
Annex
Detailed tables of projections
Table 1 International projections
|
Change from projections in |
Weights1 Percent |
Percentage change from previous year |
||||
|
2020 |
2021 |
2022 |
2023 |
2024 |
||
|
GDP |
||||||
|
US |
10 |
-3.4 (0) |
5.6 (-0.1) |
3.3 (-0.6) |
2.3 (0.6) |
1.5 (0.1) |
|
Euro area |
35 |
-6.5 (0) |
5.2 (0.1) |
3.9 (0) |
2.2 (0.2) |
1.5 (-0.2) |
|
UK |
11 |
-9.7 (0.1) |
6.8 (0.5) |
4.7 (-1) |
2.5 (0.3) |
1.2 (0) |
|
Sweden |
13 |
-3.1 (-0.2) |
4.6 (0.9) |
2.8 (-0.3) |
2.1 (0) |
1.7 (0) |
|
China |
7 |
2.3 (0) |
7.8 (-0.3) |
4.8 (-0.6) |
5.3 (-0.2) |
5.2 (-0.2) |
|
13 trading partners1 |
100 |
-4.5 (0) |
5.5 (0.3) |
3.7 (-0.3) |
2.7 (0.2) |
2 (-0.1) |
|
5 trading partners2 |
-4.9 (0) |
5.7 (0.2) |
3.9 (-0.3) |
2.6 (0.2) |
1.9 (-0.1) |
|
|
Prices |
||||||
|
Underlying inflation3 |
1.1 (0) |
2 (0.1) |
2.5 (0.5) |
1.9 (0.1) |
1.9 (0.1) |
|
|
Wage growth4 |
0.6 (-0.1) |
3.2 (0) |
3.1 (0.3) |
2.9 (0.1) |
2.7 (0) |
|
|
Prices for consumer goods imported to Norway5 |
0.5 (0) |
2 (0.4) |
2.3 (1) |
0.9 (0.2) |
0.8 (0) |
|
1 The aggregate includes: Euro area, China, UK, Sweden, US, Brazil, Denmark, India, Poland, South Korea, Singapore, Thailand and Turkey. Export weights.
2 The aggregate includes: China, Euro area, Sweden, UK and US. Export weights.
3 The aggregate for underlying inflation includes: Euro area, Sweden, UK and US. Import weights.
4 Projections for compensation per employee in the total economy. The aggregate includes: Euro area, Sweden, UK and US. Import weights.
5 In foreign currency terms. Including compositional effects.
Sources: IMF, Refinitiv Datastream and Norges Bank
Table 2a Consumer prices. Twelve-month change. Percent
|
2021 |
2022 |
||||||
|
Sep |
Oct |
Nov |
Dec |
Jan |
Feb |
Mar |
|
|
Consumer price index (CPI) |
|||||||
|
Actual |
4.1 |
3.5 |
5.1 |
||||
|
Projections MPR 3/21 |
3.9 |
3.3 |
3.9 |
3.4 |
|||
|
Projections MPR 4/21 |
5.0 |
3.6 |
3.5 |
3.7 |
|||
|
CPI-ATE |
|||||||
|
Actual |
1.2 |
0.9 |
1.3 |
||||
|
Projections MPR 3/21 |
1.2 |
0.9 |
1.1 |
1.1 |
|||
|
Projections MPR 4/21 |
1.3 |
1.0 |
1.2 |
1.2 |
|||
|
Imported consumer goods in the CPI-ATE |
|||||||
|
Actual |
0.9 |
0.3 |
0.8 |
||||
|
Projections MPR 3/21 |
0.5 |
0.3 |
1.0 |
0.6 |
|||
|
Projections MPR 4/21 |
0.5 |
0.2 |
0.3 |
0.6 |
|||
|
Domestically produced goods and services in the CPI-ATE |
|||||||
|
Actual |
1.4 |
1.2 |
1.7 |
||||
|
Projections MPR 3/21 |
1.5 |
1.2 |
1.3 |
1.3 |
|||
|
Projections MPR 4/21 |
1.6 |
1.5 |
1.6 |
1.6 |
|||
Sources: Statistics Norway and Norges Bank
Table 2b GDP for mainland Norway. Quarterly change. Seasonally adjusted. Percent
|
2021 |
2022 |
||||||
|
Q2 |
Q3 |
Q4 |
Q1 |
||||
|
Actual |
1.1 |
2.6 |
|||||
|
Projections MPR 3/21 |
2.3 |
1.3 |
|||||
|
Projections MPR 4/21 |
1.3 |
-0.4 |
|||||
Sources: Quarterly National Accounts from Statistics Norway and Norges Bank
Table 2c GDP for mainland Norway. Monthly change. Seasonally adjusted. Percent
|
2021 |
2022 |
||||||
|
Sep |
Oct |
Nov |
Dec |
Jan |
Feb |
Mar |
|
|
Actual |
0.8 |
0.0 |
|||||
|
Projections MPR 3/21 |
0.6 |
0.3 |
0.3 |
0.2 |
|||
|
Projections MPR 4/21 |
0.6 |
0.0 |
-1.0 |
0.1 |
0.7 |
||
Sources: Statistics Norway and Norges Bank
Table 2d Registered unemployment (rate). Percent of labour force.
Seasonally adjusted
|
2021 |
2022 |
||||||
|
Sep |
Oct |
Nov |
Dec |
Jan |
Feb |
Mar |
|
|
Actual |
2.6 |
2.4 |
2.3 |
||||
|
Projections MPR 3/21 |
2.6 |
2.5 |
2.4 |
2.4 |
|||
|
Projections MPR 4/21 |
2.5 |
3.0 |
2.9 |
2.7 |
|||
Sources: Norwegian Labour and Welfare Administration (NAV) and Norges Bank
Table 3 Projections for main economic aggregates
|
Change from projections in |
Percentage change from previous year (unless otherwise stated) |
|||||
|
In billions |
Projections |
|||||
|
2020 |
2021 |
2022 |
2023 |
2024 |
||
|
Prices and wages |
||||||
|
CPI |
1.3 |
3.5 (0.3) |
2.7 (1.2) |
1.5 (0.3) |
2.0 (0.1) |
|
|
CPI-ATE |
3.0 |
1.7 (0.1) |
1.7 (0.3) |
2.0 (0.4) |
2.0 (0.2) |
|
|
Annual wages |
3.1 |
3.1 (0.1) |
3.2 (0.1) |
3.6 (0.2) |
3.5 (0.2) |
|
|
Real economy1 |
||||||
|
Gross domestic product (GDP) |
3402 |
-1.3 |
4.2 (1.2) |
4.3 (0.5) |
2.5 (1.2) |
1.3 (0.4) |
|
GDP, mainland Norway |
3035 |
-3.0 |
4.1 (0.2) |
3.5 (-1.0) |
2.0 (0.8) |
1.0 (0.2) |
|
Output gap, mainland Norway (level) |
-2.9 |
-0.8 (0.2) |
0.7 (-0.6) |
1.3 (0.0) |
1.0 (0.1) |
|
|
Employment, persons, QNA |
-1.5 |
1.3 (0.6) |
2.5 (-0.1) |
0.7 (0.2) |
0.3 (0.1) |
|
|
Registered unemployment (rate, level) |
5.0 |
3.1 (0.0) |
2.4 (0.2) |
2.1 (0.0) |
2.0 (-0.2) |
|
|
Demand1 |
||||||
|
Mainland demand |
3124 |
-3.8 |
3.1 (0.1) |
3.6 (-2.2) |
4.0 (1.4) |
0.6 (0.1) |
|
– Household consumption |
1497 |
-7.0 |
4.6 (1.0) |
6.0 (-3.6) |
6.0 (2.4) |
2.0 (0.5) |
|
– Business investment |
313 |
-5.0 |
1.4 (0.3) |
2.2 (-1.6) |
6.3 (0.0) |
5.9 (-0.3) |
|
– Housing investment |
191 |
-4.0 |
2.3 (-2.8) |
3.5 (0.2) |
2.4 (1.5) |
0.7 (-0.3) |
|
– Public demand |
1122 |
1.3 |
1.6 (-0.8) |
0.8 (-0.7) |
0.5 (0.3) |
0.3 (-0.2) |
|
Petroleum investment |
181 |
-4.1 |
-1.0 (1.0) |
-6.0 (2.0) |
10.0 (0.0) |
9.0 (0.0) |
|
Mainland exports |
640 |
-8.7 |
4.3 (0.1) |
4.8 (-1.9) |
4.0 (0.5) |
2.6 (0.1) |
|
Imports |
1127 |
-12.1 |
1.3 (0.7) |
5.8 (-4.4) |
8.6 (2.4) |
4.6 (-0.2) |
|
House prices and debt |
||||||
|
House prices |
4.5 |
9.1 (-0.1) |
2.8 (1.1) |
0.7 (-0.5) |
2.4 (-0.6) |
|
|
Household credit (C2) |
4.9 |
4.8 (0.0) |
4.9 (0.1) |
4.6 (0.1) |
4.1 (0.0) |
|
|
Interest rate, exchange rate and oil price |
||||||
|
Policy rate (level) |
0.4 |
0.1 (0.0) |
0.8 (-0.1) |
1.5 (0.1) |
1.7 (0.1) |
|
|
Import-weighted exchange rate (I-44) (level) |
115.0 |
108.8 (-0.2) |
107.8 (1.6) |
105.0 (0.5) |
104.3 (0.1) |
|
|
Money market rates, trading partners (level) |
0.0 |
-0.2 (0.0) |
0.1 (0.2) |
0.4 (0.3) |
0.6 (0.2) |
|
|
Oil price, Brent Blend. USD per barrel |
41.8 |
70.6 (1.2) |
73.1 (2.3) |
70.0 (3.8) |
68.1 (5.5) |
|
|
Household income and saving1 |
||||||
|
Real disposable income excl. dividend income |
3.2 |
0.6 (0.3) |
2.2 (-0.6) |
2.2 (0.4) |
1.8 (0.4) |
|
|
Saving ratio excl. dividend income (rate, level) |
12.5 |
8.7 (-0.6) |
5.6 (2.0) |
2.4 (0.2) |
2.5 (0.2) |
|
|
Fiscal policy |
||||||
|
Structural non-oil deficit as a percentage of GPFG2 |
3.6 |
3.5(-0.2) |
2.8(-0.1) |
2.6(-0.3) |
2.6(-0.3) |
|
|
Structural non-oil deficit as a percentage of trend GDP |
11.6 |
11.6 |
10.3 |
9.6 |
9.6 |
|
1 All figures are working-day adjusted.
2 Government Pension Fund Global measured at the beginning of the year.
Sources: Eiendomsverdi, Finn.no, Ministry of Finance, Norwegian Labour and Welfare Administration (NAV), Real Estate Norway, Refinitiv Datastream, Statistics Norway and Norges Bank