
Norges Bank's Monetary Policy and Financial Stability Committee decided unanimously to keep the policy rate unchanged at 4.25% at its meeting on 17 June. There is uncertainty about future economic developments, but the Committee’s current assessment of the outlook implies that it will likely be necessary to raise the policy rate further at one of the forthcoming monetary policy meetings.
The Monetary Policy Statement provides the background for the monetary policy decision taken by the Monetary Policy and Financial Stability Committee on 17 June 2026 and the Committee’s assessment of the monetary policy outlook. A summary of the deliberations leading to the monetary policy decision is published at the same time as the monetary policy decision at norges-bank.no.
Norges Bank is tasked with keeping inflation low and stable. The operational target is inflation of close to 2% over time. We are also mandated to help keep employment as high as possible and to promote economic stability.
Inflation has been above target for several years. Capacity utilisation in the Norwegian economy appears to be close to a normal level but is drifting down. The previous policy rate forecast from March indicated an increase in the policy rate to between 4¼ and 4½% by the end of 2026, and the rate was raised to 4.25% in May. Since March, the Committee has noted the following:
- The conflict in the Middle East is still creating uncertainty about developments in oil and other commodity prices. Since March, oil and gas spot and futures prices have fallen. Prices for various other commodities, such as aluminium and copper, have edged up. External price impulses to imported goods appear to be slightly stronger than projected in the March Report. The krone exchange rate is broadly in line with that assumed in March, while market-implied policy rate expectations have fallen a little both internationally and in Norway.
- In Norway, price inflation has been broadly as projected, and it appears that wage growth this year will be broadly in line with the March projection. According to Norges Bank's Expectations Survey and Regional Network, wage growth expectations for 2027 are somewhat higher than in March.
- Mainland economic growth has been slightly weaker than projected. Registered unemployment has been stable in recent months, while LFS data show a rise in unemployment. Regional Network contacts report that it has become easier to recruit. At the same time, the number of job vacancies has risen somewhat in recent months, and employment has increased further. Regional Network contacts expect activity growth to pick up a little again over summer. Overall, new information indicates that capacity utilisation in the Norwegian economy is close to a normal level but is drifting down. Capacity utilisation appears to be broadly at the level projected in March.
The Committee does not want to restrict the economy more than needed. At the same time, the Committee is concerned that inflation is still too high. The rapid rise in business costs in recent years will contribute to keeping inflation elevated ahead. High inflation over time can lead households and firms to begin planning for persistently high inflation. Inflation may then become stickier and harder to bring down again. The Committee judges that a restrictive monetary policy stance is necessary. A somewhat tighter monetary policy stance will likely be needed to return inflation to target within a reasonable time horizon.
The Committee decided to keep the policy rate unchanged at 4.25%. The policy rate forecast is a little higher than in March and is just above 4.5% at the end of the year.

With a policy rate in line with the forecast, inflation is projected to decline from 2027 and reach 2.0% in 2029. The economy is expected to cool, and registered unemployment is projected to edge a little higher to slightly above pre-pandemic levels.
There is substantial uncertainty about the economic outlook. In recent days, news has come in that the United States and Iran have agreed on a memorandum of understanding that provides for the opening of the Strait of Hormuz. If energy markets normalise quickly, external price pressures may prove weaker than currently assumed. The attendant effects on inflation in Norway will also depend on developments in the krone exchange rate.
The future policy rate path will depend on how the economy evolves. The Committee will be particularly attentive to signs of inflation remaining elevated for longer than projected. A higher policy rate than currently envisaged may then be required. On the other hand, capacity utilisation is drifting down, and unemployment is expected to edge somewhat higher ahead. If labour market conditions become weaker than projected or inflation pressures ease faster, the policy rate may become lower than currently envisaged.
Ida Wolden Bache
Pål Longva
Øystein Børsum
Hilde C. Bjørnland
Steinar Holden
17 June 2026
- 1 The output gap measures the percentage deviation between mainland GDP and estimated potential mainland GDP. CPI-ATE: the CPI adjusted for tax changes and excluding energy products. The forecasts from Monetary Policy Report 2/2026 extend to 2030 Q1, while the forecasts from Monetary Policy Report 1/2026 extend to 2029 Q4.
1. Overall picture
This section presents the overall picture of the Norwegian economy and discusses Norges Bank’s assessment of economic developments, with particular weight on the current economic situation, the near-term outlook, the policy rate decision and forecast and finally the economic outlook in the light of interest rate developments. In the box at the end of this section, key uncertainty and risk factors are described that may result in different economic developments than projected in this Report.
Inflation is still above target and has remained around 3% since end-2024. Unemployment has risen from the low levels following the pandemic, but registered unemployment has changed little over the past year. The employment rate has fallen somewhat from a high level. After the outbreak of the war in the Middle East and the closure of the Strait of Hormuz, energy and commodity prices increased. This has raised uncertainty about the inflation and growth outlook for both the international and Norwegian economy. The policy rate forecast implies a policy rate of just above 4.5% at the end of this year. Inflation is projected to be 2% in 2029 and registered unemployment to rise somewhat.
Higher energy prices drive up inflation and weaken global economic growth
Throughout 2025, economic activity among Norway’s main trading partners remained firm, despite trade policy uncertainty. Inflation had come down considerably and approached the 2% inflation target in a number of countries. This year, the war in the Middle East and the closure of the Strait of Hormuz at the end of February have given rise to new shocks. Oil and gas prices rose sharply in the beginning of the war. Prices for other key commodities also increased. Since March, when projections were last made, oil and gas prices have fallen but remain higher than before the outbreak of the war. Various other commodity prices have increased further. The United States and Iran now appear closer to reaching a negotiated agreement.
The closure of the Strait of Hormuz has given rise to new shocks. Oil and gas prices rose sharply in the beginning of the war.
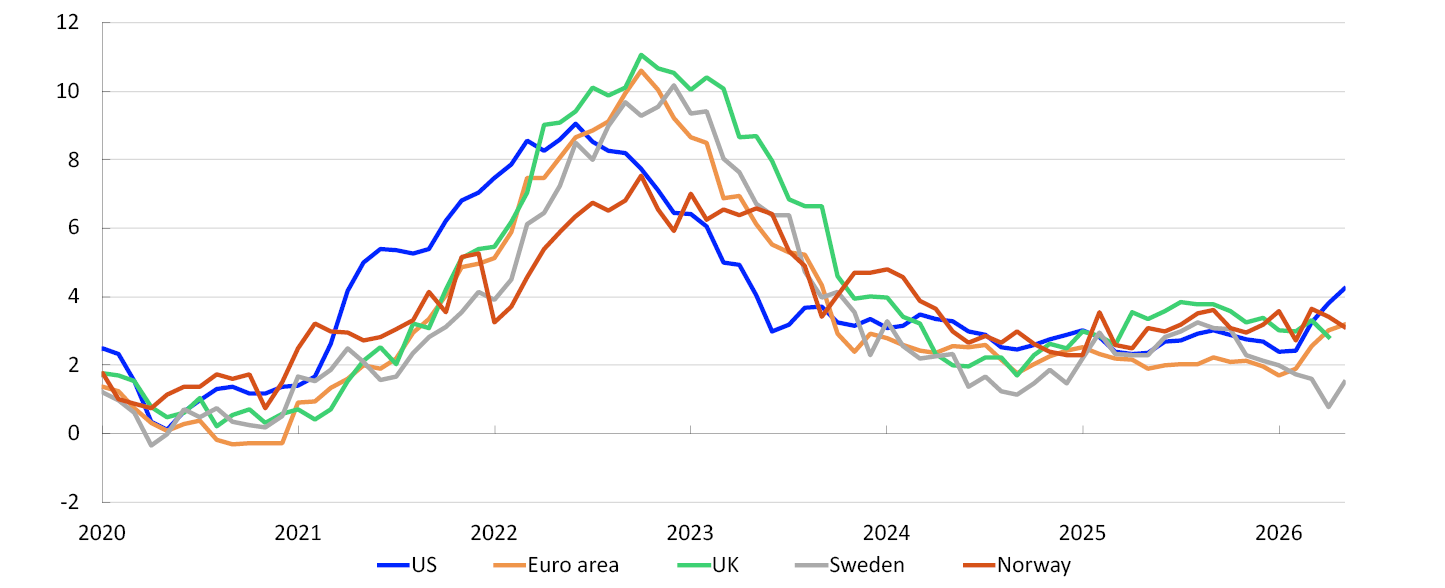
Higher energy prices have led to increased consumer price inflation among a number of Norway’s trading partners (Chart 1.1). The European Central Bank recently raised interest rates, and market-implied rates indicate expectations of higher policy rates also among other central banks in the course of this year.
CPI. Twelve-month change. Percent1
The jump in energy prices is dampening global economic activity. On the other hand, increased defence spending and investment related to AI and infrastructure are pushing up growth. Overall, growth among trading partners is expected to slow in 2026 and 2027 compared with 2025.
Inflation in Norway is still above target
In Norway, inflation declined markedly through 2023 and 2024 but has since changed little and is still above the 2% target. Excluding energy prices, which can fluctuate widely from one month to the next, inflation has been around 3% since the end of 2024. In May, the 12-month rise in the consumer price index (CPI) was 3.1%. CPI inflation adjusted for tax changes and excluding energy products (CPI-ATE) was 3.4%. Inflation has been broadly as expected.
Excluding energy prices, inflation has been around 3% since the end of 2024.
Domestically produced goods and services inflation is still higher than before the pandemic, driven by the rapid rise in business costs. In 2026, wage growth is expected to decline to 4.5%, close to the wage norm set in the manufacturing wage settlement. Increased prices for energy and other commodity prices could push up costs in some business sectors.
Imported goods inflation moderated rapidly from the high levels following the pandemic and Russia's invasion of Ukraine, while imported goods inflation has increased in recent months (Chart 1.2). The rise in prices for energy, other commodities and freight rates could lead to slightly higher imported price inflation ahead. The krone exchange rate has appreciated since the beginning of this year. A stronger krone offsets some of the increase in price impulses and, in isolation, dampens domestic inflation.
CPI-ATE. Four-quarter change. Percent2

Overall inflation is expected to remain above 3% in the months ahead.
Slower economic growth this year
Mainland economic growth picked up in 2025 after several years of weak growth. The improvement was especially evident in the most interest rate sensitive segments of the economy. Increased household purchasing power led to stronger growth in consumption. Housing investment increased slightly, albeit from a low level, while business investment also picked up.
Economic growth is likely to be somewhat lower than in 2025.
Since the end of 2025 and into 2026, mainland economic growth has slowed again and been somewhat weaker than projected in March. Norges Bank’s Regional Network contacts expect growth to be lower in 2026 Q2 than they expected earlier this year but to pick up slightly in Q3.
A number of projects launched in response to the petroleum tax package have reached or are nearing completion, and petroleum investment is expected to fall in 2026. At the same time, export growth is expected to weaken and consumption growth to slow somewhat.
Mainland economic growth is likely to be somewhat lower than in 2025, and mainland GDP is projected to rise by 0.9%. This is somewhat less than projected in the March Report.
Slightly weaker labour market
Unemployment has risen from the low levels following the pandemic, but registered unemployment has shown little change over the past year. In May, 2.1% of the labour force was registered as fully unemployed by the Norwegian Labour and Welfare Administration (Nav), adjusted for normal seasonal variations. This is a little higher than projected in the March Report. The Labour Force Survey (LFS) indicates that unemployment has risen somewhat more over time. While the largest portion of the increase in LFS unemployment previously reflected an increase in the number of young job seekers, there is now clearer evidence of an increase among older age groups.
Employment showed a noticeable increase in the years following the pandemic, and the employment rate rose to a high level. The employment rate has declined slightly in recent years (Chart 1.3). Capacity utilisation in the economy is assessed to have remained close to a normal level since summer 2024, but to have fallen slightly in recent quarters.
Employment to population ratio. Aged 15–74. Percent3

Capacity utilisation in the economy is assessed to have fallen slightly.
A somewhat tighter monetary policy stance will likely be needed
In discussing the monetary policy stance, the Monetary Policy and Financial Stability Committee placed emphasis on avoiding a stance that could restrict the economy more than needed. At the same time, the Committee is concerned that inflation is still too high. The rapid rise in business costs in recent years will contribute to keeping inflation elevated ahead. High inflation over time can lead households and firms to begin planning for persistently high inflation. Inflation may then become stickier and harder to bring down again.
The Committee judges that a restrictive monetary policy stance is necessary. At the monetary policy meeting in June, the Committee decided to keep the policy rate unchanged at 4.25%. A somewhat tighter monetary policy stance will likely be needed to return inflation to target within a reasonable time horizon.
The policy rate forecast is a little higher than in March and is just above 4.5% at the end of 2026.
Prospects for lower inflation further out
With a policy rate in line with the forecast, inflation is expected to decline in 2027 and reach 2.0% in 2029 (Chart 1.4). The economy is expected to cool, and registered unemployment is projected to edge a little higher to slightly above pre-pandemic levels.
CPI-ATE. Four-quarter change. Registered unemployment. Percent4
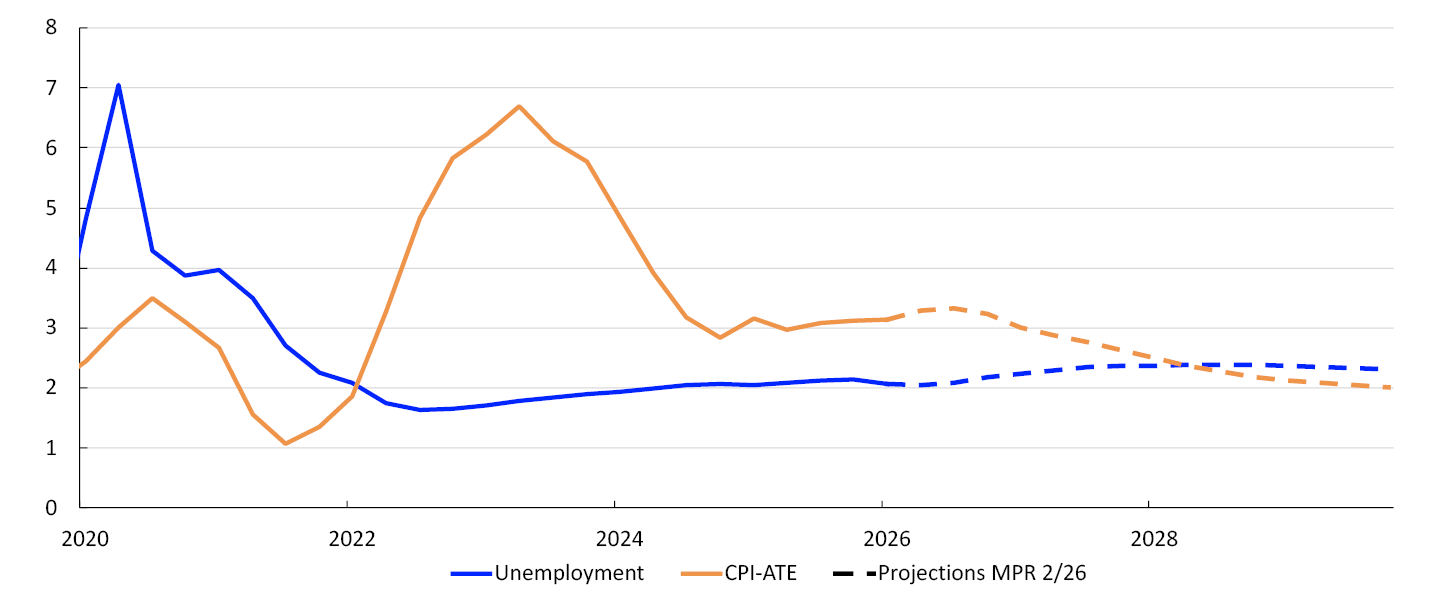
Inflation is expected to decline in 2027 and reach 2% in 2029.
There are prospects that wages will rise faster than prices ahead and that household purchasing power will continue to strengthen in the coming years, also when factoring in higher interest expenses. This will likely contribute to a further increase in private consumption. Housing investment is also expected to strengthen in the coming years, albeit from a very weak level. If the economy evolves as projected in this Report, the average residential mortgage rate is expected to be about 4.7% in 2029.
Employment is projected to edge higher in the years ahead. The employment rate is expected to edge lower in the coming years, before rising slightly towards the end of the projection period.
- 1 Figures for Sweden are CPIF (Consumer price index with a fixed interest rate).
- 2 CPI-ATE: the CPI adjusted for tax changes and excluding energy products.
- 3 Employment is the number of employed workers according to the quarterly national accounts (QNA) less non-resident workers (from the statistics on the number of jobs and wages).
- 4 CPI-ATE: the CPI adjusted for tax changes and excluding energy products.
Uncertainty and risk
The war in the Middle East has led to elevated uncertainty about future movements in oil and commodity prices. The projections are based on futures prices, which indicate that oil and gas prices will decline in the period ahead but remain somewhat higher than before the war in the Middle East erupted. After the forecasting process was completed, information has come in that the United States and Iran have agreed on a memorandum of understanding that provides for the opening of the Strait of Hormuz. Both oil spot and futures prices have edged down further.
Developments in prices for oil and other commodities will largely depend on when shipping traffic through the Strait of Hormuz returns to normal and how long it will take for the countries in the region to resume production and exports. The consequences of reduced supply of key commodities could linger for some time after the conflict comes to an end. There is therefore a risk that energy and commodity prices could rise further or remain elevated longer than implied by market prices.
Inflation in Norway could then also become higher than currently projected. Higher prices for energy and other commodities will increase cost pressures and drive up inflation for both domestically produced goods and imported intermediate and consumer goods. On the other hand, a rapid normalisation of the supply of energy and commodities may lead to a more pronounced fall in prices than futures prices now indicate. This could pull down consumer price inflation.
Movements in the krone exchange rate after the outbreak of the war in February can partly be viewed in the context of oil price developments. A rapid decrease in oil prices could lead to a weaker krone. On the other hand, continued oil supply constraints could lead to higher prices and a stronger krone. Movements in the krone may thereby curb the impact of oil prices on consumer price inflation in Norway.
After picking up in 2025, productivity growth has again declined. The decline is assumed to be temporary. If productivity growth remains lower than currently envisaged, this will in isolation raise business costs more than projected and could push up domestically produced goods and services inflation. On the other hand, productivity growth may pick up faster than projected, for example thanks to increased AI use. Higher-than-projected productivity growth could pull down inflation in the near term.
There is uncertainty associated with the degree of slack in the economy. New labour market data point in slightly different directions. Regional Network contacts report that it is easier to recruit, and LFS unemployment has risen more than registered unemployment. If there is more spare capacity in the economy than assumed, wage and price inflation may also be lower ahead than projected in this Report. On the other hand, there is a large number of advertised vacancies. If labour shortages prove greater than assumed, it may take longer for wage and price inflation to decline.
Inflation is still above target and has changed little over the past year and a half. Two- and five-year ahead inflation expectations have decreased quite a bit since peaking in 2023 but have not fallen further over the past year (Chart 1.A). Long-term inflation expectations of economists and the social partners are close to pre-pandemic levels, while expectations of households and business leaders remain elevated. Elevated inflation expectations over time could make it more difficult to bring inflation back to target.
Twelve-month change. Percent1

- 1 In 2023 Q1, households and business leaders were asked for the first time about expected inflation 5 years ahead. The observation for households for 2025 Q1 is omitted due to a different set of questions in the survey for 2025 Q1.
2. Assumptions and projections
This section presents the key assumptions and projections underlying the policy rate decision and the monetary policy analysis. It also describes how new data, analyses and assessments have influenced the projections since the previous Report. The projection period in this Report is between 2026 Q2 and 2029 Q4. The underlying data is available in an independent dataset that is published separately.
International economy
Growth among Norway’s trading partners remained elevated through 2025 despite international political tensions and substantial tariff increases on exports to the US. At the same time, consumer price inflation approached the 2% targets in a number of countries. Since the end of February, the war in the Middle East and the closure of the Strait of Hormuz have led to large disruptions to production and maritime transport of oil and gas. Spot and futures energy prices have increased substantially after the outbreak of the war. Since the March 2026 Monetary Policy Report, energy prices have fallen, but they are still higher than before the outbreak of the war (see “Energy and other commodity prices”). The production of and trade in other commodities and energy-related products that are key inputs in eg agriculture and manufacturing are also affected. Following negotiations, the US and Iran have moved towards an agreement, but the conflict continues to cloud the economic outlook.
The conflict in the Middle East has also had an impact on financial market developments. Short-term market inflation expectations have fallen since the March Report, in pace with lower oil prices. The European Central Bank has raised its key interest rates by 0.25 percentage point and is expected to raise the rates somewhat further in the course of 2026. Market pricing indicates that policy rates will also be raised in the US, the UK and Sweden (Chart 2.1). Long-term interest rates are little changed. Global equity indices have risen since the March Report, driven in particular by technology equities. Credit premiums have fallen somewhat in the same period.
Policy rates and estimated forward rates. Percent1

Annual change. Percent2
Overall economic growth is expected to be lower in 2026 and 2027 than in 2025, before edging up again thereafter (Chart 2.2). The growth projection for trading partners overall is broadly in line with the March Report. The projections are based on the following:
- The negative effects of higher tariffs have been limited. A global tariff of 10% was imposed by the US after the US Supreme Court ruled in February that the tariffs imposed under the Emergency Economic Powers Act (IEEPA) are unlawful. This tariff expires in July 2026, but US authorities have introduced a new replacement tariff. It is assumed that new tariffs will be imposed, contributing to an average level that is approximately the same as in the March Report.
- With the war in the Middle East and the closure of the Strait of Hormuz, the global economy has been exposed to a substantial negative supply-side shock. Prices for energy and a range of other commodities and energy-related products have risen, which reduces households’ real income and pushes up business costs. Based on spot and futures prices on 12 June, the war is projected to dampen economic activity among Norway’s trading partners in both 2026 and 2027 (see also “Norway’s trading partners are likely better able to cope with higher oil prices than before”).
- In the euro area and in the UK, which are both dependent on oil and gas imports, higher energy prices are projected to dampen growth in 2026 and 2027. Higher growth is expected thereafter towards the end of the projection period. In the euro area, expansionary fiscal policy related to both defence and infrastructure investment is lifting growth. In the UK, higher private consumption and investment will likely lift growth in the medium term.
- In Sweden, higher energy prices will also restrain growth in the near term, but domestic demand is expected to support economic growth at close to 2% in the coming years. Public expenditure related to both defence and infrastructure investment push up growth in Norges Bank’s projections.
- In the US, AI investment and expansionary fiscal policy are expected to lift growth through the projection period. At the same time, household consumption will likely be dampened by high energy prices in the coming year. Growth is projected to remain at around 2% throughout the projection period.
- In China, growth is projected to be slightly lower in 2026 than in 2025. Low housing investment and weak growth in household consumption are likely to dampen domestic demand. High oil prices are curbing consumption, but widespread public price controls and substantial Chinese oil reserves are limiting the effects. The rapid growth of Chinese high-tech goods exports to non-US countries is expected to continue. A shrinking labour force and persistently weak growth in private consumption will likely weigh down on growth further out in the projection period.
Consumer price inflation among Norway’s main trading partners slowed substantially in the course of 2024 and 2025 and approached the 2% inflation targets in a number of jurisdictions before the war in the Middle East broke out. In recent months, consumer price inflation has risen rapidly owing to higher prices for energy products such as petrol, diesel and gas. Overall, consumer price inflation, as measured by the CPI, is projected to rise by about 1 percentage point in both the euro area and the US between 2025 and 2026. Consumer price inflation in the euro area and the US is expected to approach the inflation targets in the course of 2027. Underlying inflation for Norway’s trading partners overall is also projected to approach 2% in 2027. The projections for underlying inflation are slightly higher than in the March Report. The projections are based on the following:
- Consumer price inflation will likely remain elevated in the coming months due to high energy prices. Further ahead, energy prices in the CPI are expected to decline in pace with lower futures prices.
- Higher energy prices and supply chain disruptions will likely push up costs related to the production and distribution of other goods and services and result in underlying consumer price inflation among most of Norway’s industrialised trading partners remaining above inflation targets in 2026.
- Since 2023, wage growth among Norway’s trading partners has declined from 5% to slightly below 4% in 2025. Overall annual wage growth is projected to approach 3% towards the end of the projection period.
Energy and other commodity prices
Oil prices and European gas prices rose sharply following the outbreak of the war in the Persian Gulf and the closure of the Strait of Hormuz in late February. Since the March 2026 Monetary Policy Report, these prices have eased, partly owing to prospects of a peace agreement, and both spot and futures prices are lower than assumed. Nevertheless, they are still higher than before the outbreak of the war (Chart 2.A).
Daily figures. Futures prices to end-2029
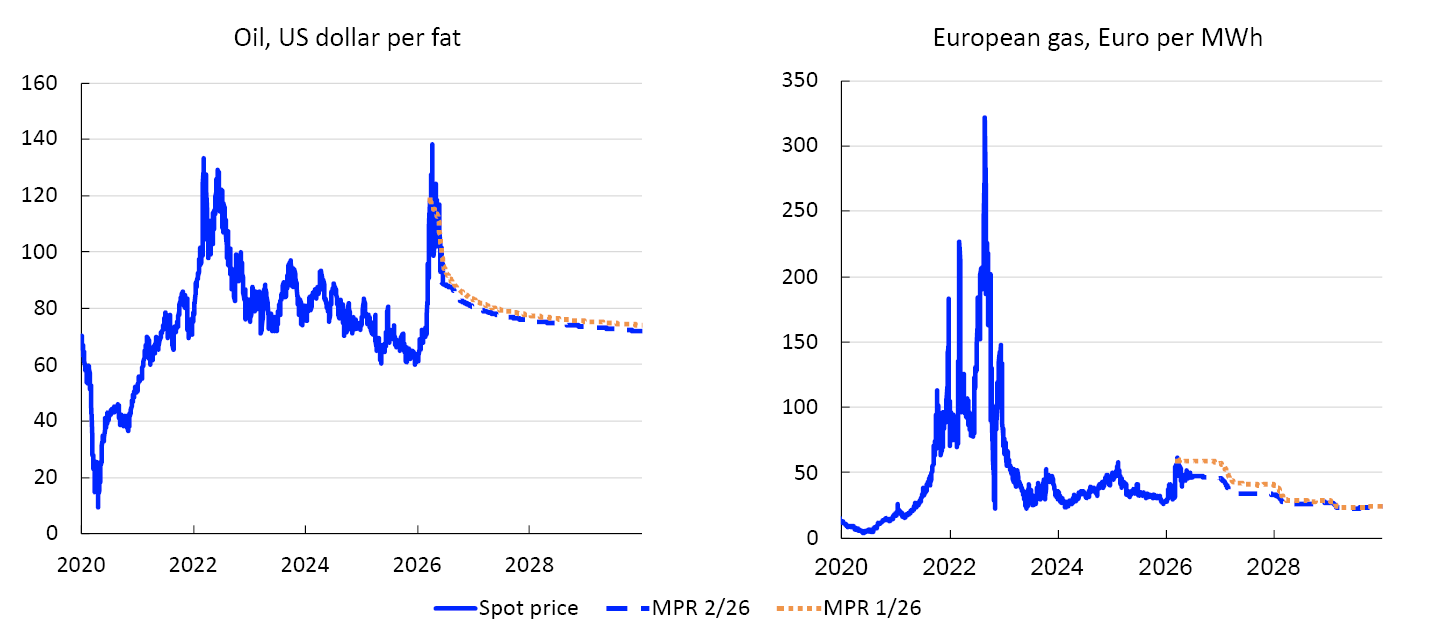
Oil and gas price developments will to a large extent depend on when the Strait of Hormuz opens for normal traffic and how long it will take for the countries in the region to resume production and exports. Oil futures prices, which form the basis for Norges Bank’s projections, indicate that this could happen relatively quickly, even if average prices remain higher over time than indicated by these prices prior to the outbreak of the war. Gas futures prices indicate that gas prices will remain elevated through 2026 but that an increased supply of LNG, in particular from the US, will bring prices down over time.
Electricity prices on the Continent for 2026 and 2027 have fallen somewhat since the March 2026 Monetary Policy Report (Table 2.A). Lower prices for European gas and coal have partly been offset by higher emissions allowance prices (EU ETS). Electricity prices also fluctuate considerably in the summer half of the year as a result of variations in solar and wind power generation. Electricity prices in Norway still closely mirror developments on the Continent owing to electricity imports and expectations of low hydropower reservoir levels following little snow in winter 2025–2026.
Table 2.A Energy and other commodity prices
|
Percentage change from projections in Monetary Policy Report 1/2026 in parentheses |
Average price (2010–2019) |
Average price (2020–2024) |
Realised prices and futures prices1 |
||||
|---|---|---|---|---|---|---|---|
|
2025 |
2026 |
2027 |
2028 |
2029 |
|||
|
Oil, USD/barrel |
80 |
75 |
69 |
90 (-2) |
79 (-3) |
75 (-2) |
73 (-3) |
|
Dutch gas, EUR/MWh |
20 |
51 |
36 |
45 (-17) |
37 (-19) |
28 (-11) |
24 (-3) |
|
Coal, EUR/tonne |
66 |
128 |
88 |
101 (-8) |
104 (-10) |
101 (-9) |
101 (-9) |
|
Carbon allowance prices, EUR/tonne |
10 |
61 |
74 |
76 (9) |
79 (14) |
82 (14) |
84 (12) |
|
German electricity, EUR/MWh |
42 |
107 |
89 |
102 (-5) |
95 (-5) |
81 (2) |
74 (5) |
|
Nordic electricity, Øre/kWh |
32 |
64 |
48 |
74 (14) |
55 (-7) |
48 (0) |
48 (0) |
|
Electricity in southern Norway, Øre/kWh |
31 |
87 |
73 |
101 (0) |
72 (10) |
60 (5) |
59 (5) |
|
Electricity in northern Norway and central Norway, Øre/kWh |
32 |
33 |
21 |
63 (15) |
42 (10) |
40 (4) |
41 (1) |
|
Aluminium, USD/tonne |
1945 |
2321 |
2629 |
3466 (9) |
3351 (11) |
3189 (10) |
3148 (11) |
|
Copper, USD/tonne |
6762 |
8430 |
9926 |
13391 (10) |
13664 (13) |
13623 (12) |
13608 (11) |
|
Steel, USD/tonne |
461 |
617 |
555 |
585 (1) |
589 (2) |
n.a. |
n.a. |
|
Wheat, USD/tonne |
210 |
248 |
197 |
216 (0) |
237 (-1) |
250 (3) |
n.a. |
|
Maize, USD/tonne |
183 |
206 |
173 |
172 (-5) |
182 (-7) |
187 (-3) |
187 (-2) |
Both spot and futures prices for metals have risen since the March Report. The rise may reflect the fact that the Strait of Hormuz has been closed, which has reduced exports of aluminium and inputs for the production of copper and other metals from countries in the Persian Gulf. At the same time, demand for metals is being sustained by high investment activity related to artificial intelligence, higher defence spending, electrification and renewable energy development.
Agricultural product prices are little changed since March. Although higher energy and fertiliser prices can push up food prices over time, the pass-through effects will likely be gradual. At the same time, energy and fertiliser prices have fallen following the sharp increase in March and early April but are still higher than upon publication of the March Report. On the other hand, high crop yields and the upward revision of projections for US maize stocks have contributed to lower maize prices since March.
Norges Bank’s indicator for price impulses to imported intermediate goods that firms use in their production (IPI) has risen after the outbreak of the conflict in the Middle East. The Bank’s projections indicate that price impulses will increase further over the coming quarters and decline thereafter further out in the projection period. See discussion in Inflation.
- 1 Futures prices at 12 June 2026.
Sources: LSEG Datastream, Macrobond and Norges Bank
The krone exchange rate
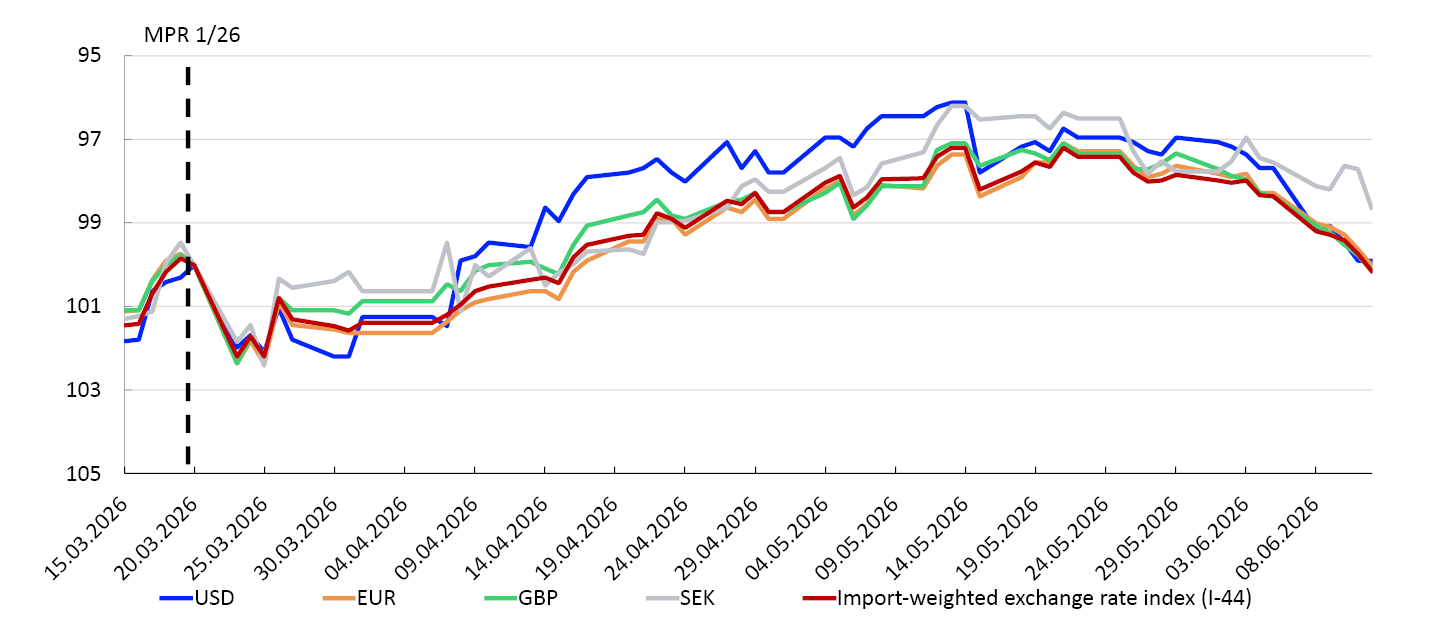
The krone exchange rate, as measured by the import-weighted exchange rate index I-44, changed little upon publication of the March 2026 Monetary Policy Report. Movements in the exchange rate were also small following the policy rate meeting in May.
The krone is little changed against the currencies of Norway’s main trading partners since the March Report (Chart 2.B). This reflects that oil prices have fallen, while the near-term market-implied interest rate differential against other countries has increased a little compared with March (Chart 2.C). The krone exchange rate as measured by I-44 is now broadly as projected in the March Report.
Index. 20 March 2026= 1001
Policy rate differential against Norway’s main trading partners. Percent2

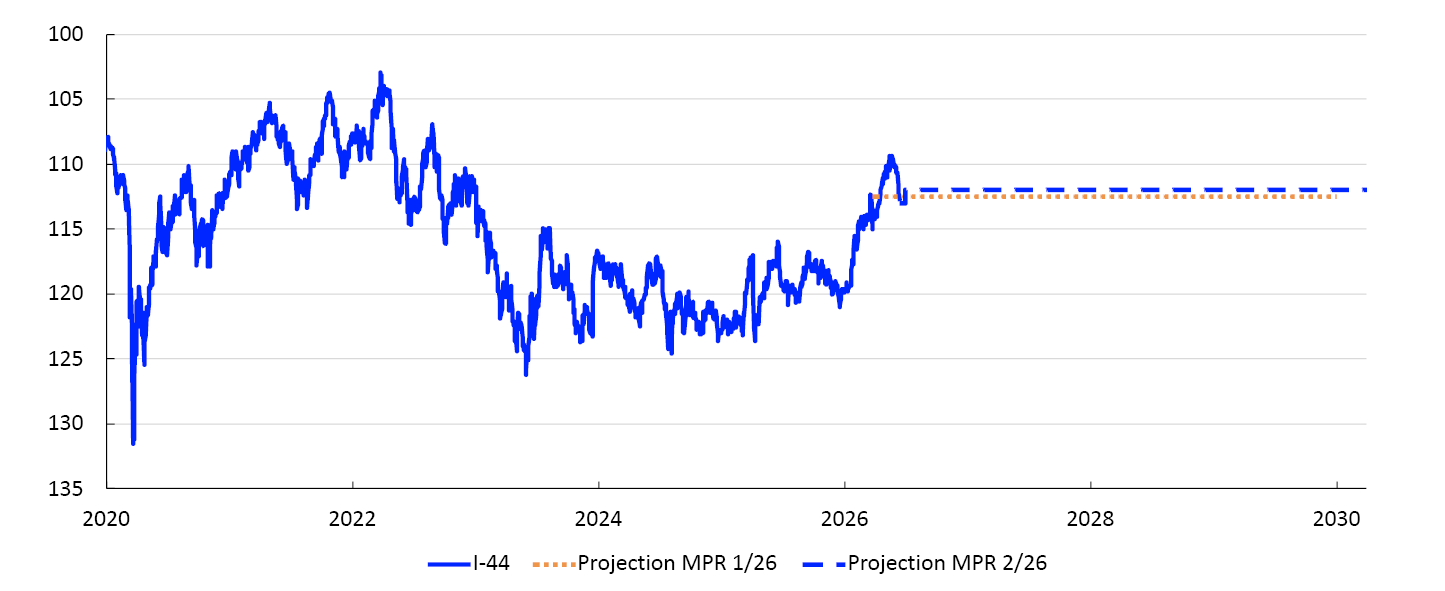
In this Report, the krone is assumed to appreciate slightly upon publication of the policy rate decision and the Monetary Policy Report (Chart 2.D). This must be viewed in light of the policy rate path being slightly higher than the market-implied policy rate in the near term. Thereafter, the krone exchange rate is assumed to remain unchanged to the end of the projection period.
Import-weighted exchange rate index. I-443
There is substantial uncertainty regarding developments in the krone exchange rate. Chart 2.E illustrates uncertainty based on options prices in the foreign exchange market.4 These prices are used to calculate an implied probability distribution of the krone exchange rate at a given point in time. The chart shows such a distribution of EUR/NOK three months ahead, expressed as a deviation from forward prices – ie the exchange rate agreed in the forward market. By this measure, uncertainty about movements in the krone exchange rate is little changed since the March Report. The probability of a krone exchange rate that is 5% stronger or weaker than the forward rate three months ahead is broadly in line with the March Report.
3 months ahead. Percentage deviation from the forward rate5

- 1 For all currencies in the chart, the exchange rate is against NOK. 20 March 2026 = 100. A lower value means that NOK has appreciated against the foreign currency.
- 2 Policy rates abroad are trade-weighted averages of the policy rates of the Bank of England, Sveriges Riksbank, the Federal Reserve and the European Central Bank.
- 3 A lower value means that NOK has appreciated against the import-weighted index I-44. The NOK exchange rate projection is based on the level of the exchange rate at 12 June.
- 4 See Opheim, V. Ø and J. Tendal (2026) “Exchange rate probability distributions derived from option prices”. Staff Memo 2/2026. Norges Bank.
- 5 Market-implied probability distributions for the krone exchange rate three months ahead, measured against euro. Deviation from futures prices. Positive values on the horizontal scale indicate a weaker krone. The distributions are estimated based on the pricing of options in the FX market. The data are not annualised.
Norwegian mainland GDP
After a few years of weak developments in the mainland economy, growth picked up in 2025. Higher household income resulted in solid consumption growth. Petroleum investment and export growth remained high, while public sector demand growth was moderate.
Constant 2023 prices. In billions of NOK
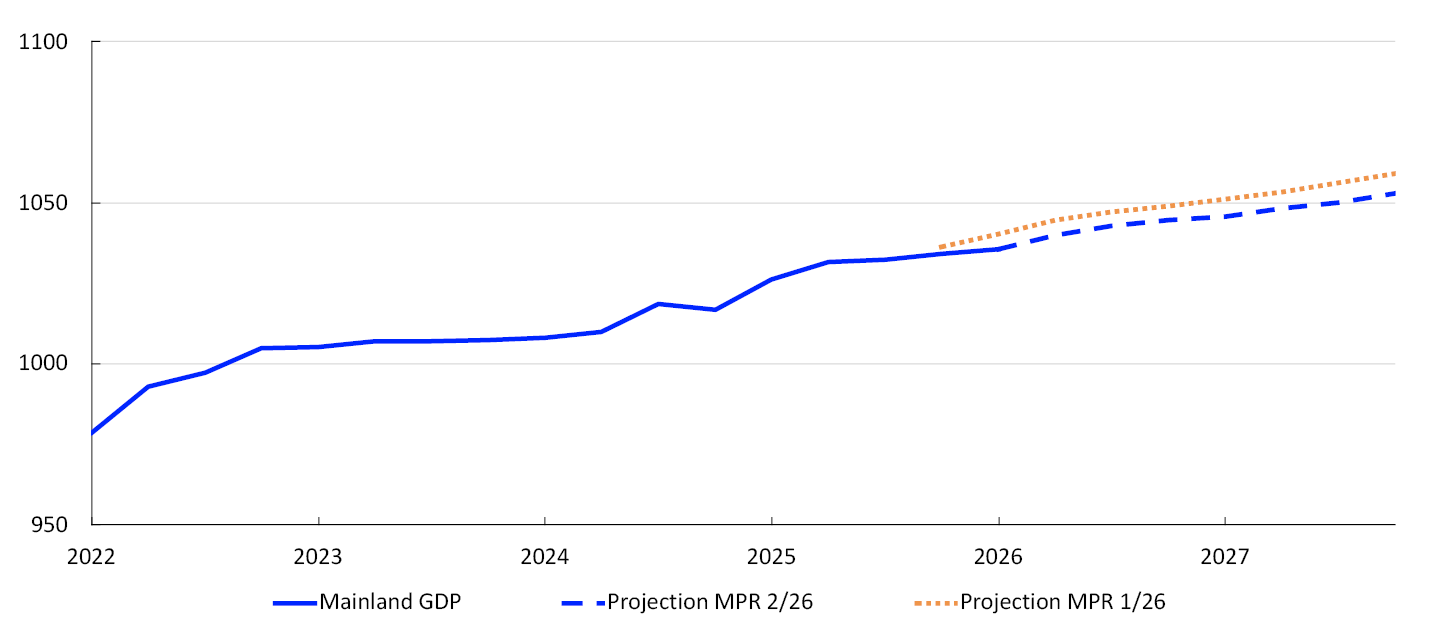
In 2026 Q1, mainland GDP rose by 0.2%, somewhat less than projected. Growth was pulled down by certain temporary factors such as lower electricity generation and a decline in retail trade following tax changes for electric vehicles. In addition, the revision of 2025 Q4 figures contributed to a lower GDP level than projected in the March 2026 Monetary Policy Report (Chart 2.3). Moderate growth is expected in the coming quarters, broadly as projected in the March Report. The projections are based on the following:
- The conflict in the Middle East still contributes to uncertainty surrounding economic developments. The projections are based on energy and commodity futures prices (see “Energy and other commodity prices”).
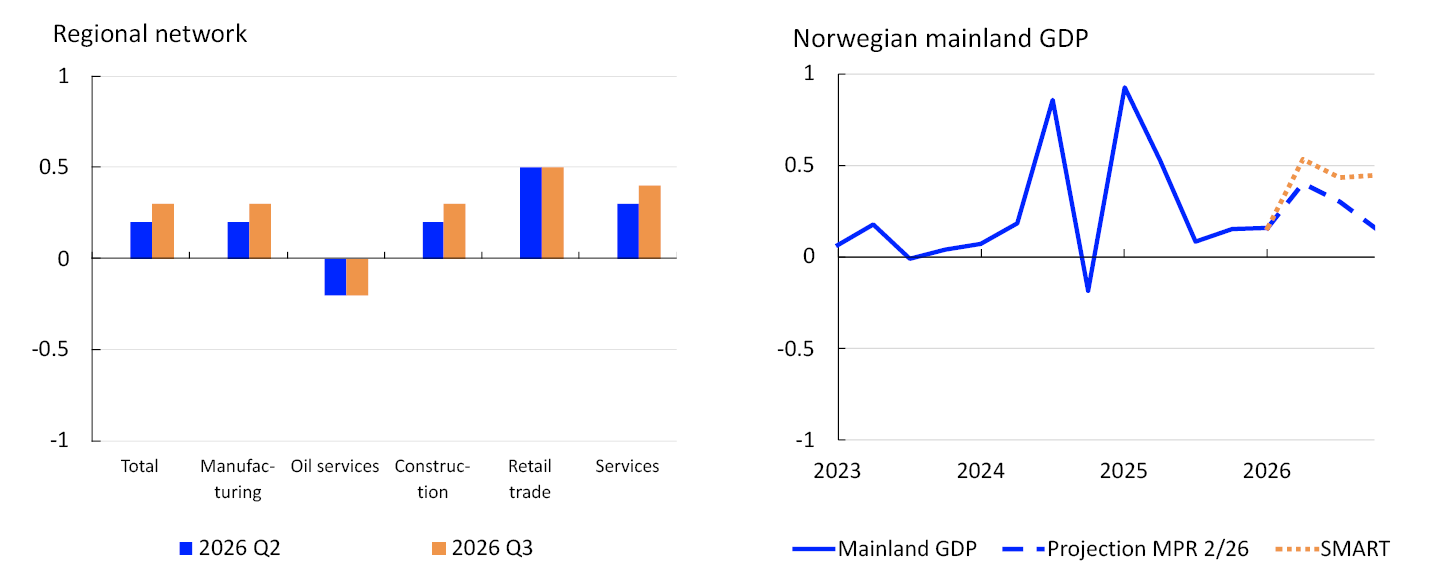
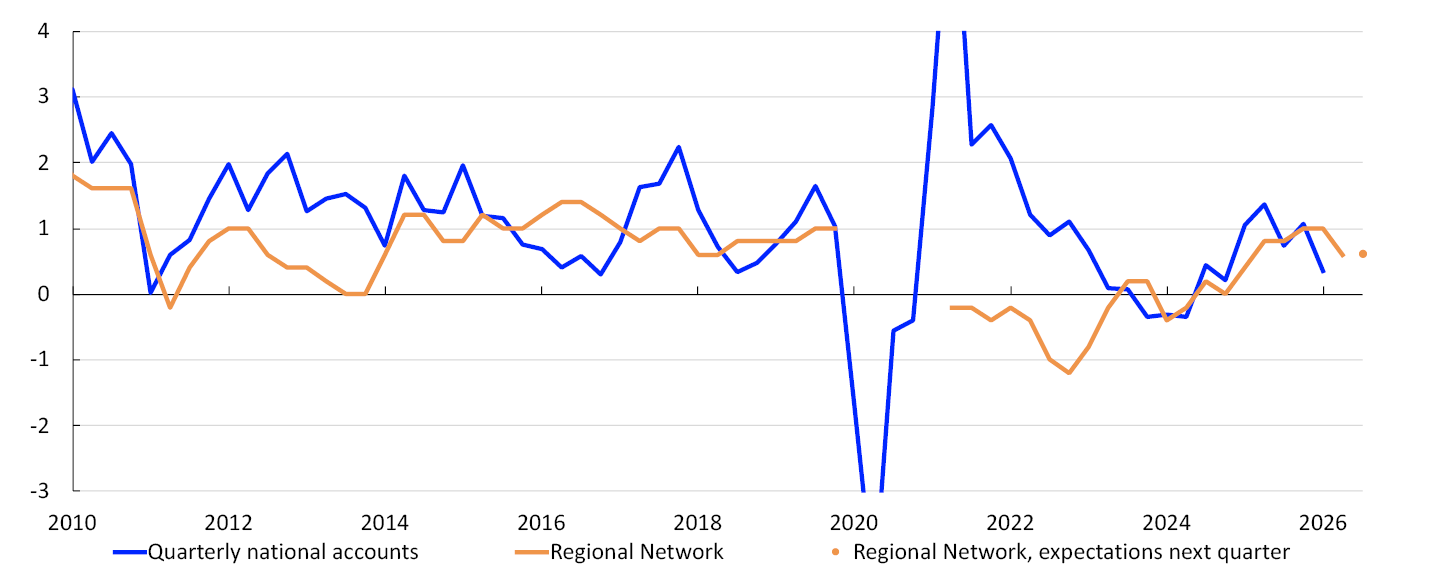
- Compared with the previous survey, Regional Network contacts expect slightly lower growth in Q2 but expect growth to pick up again somewhat in Q3 (Chart 2.4, left panel). Compared with the March survey, many contacts point out that demand is being dampened by prospects for higher interest rates and stronger cost growth. At the same time, a number of contacts point out that energy supply development, data centre buildout and increased defence investment are improving prospects.
- According to Norges Bank’s System for Model Analysis in Real Time (SMART), which weights forecasts from a broad set of models, mainland GDP growth will pick up in the coming quarters (Chart 2.4, right panel).
Expected output. Quarterly change. Percent1
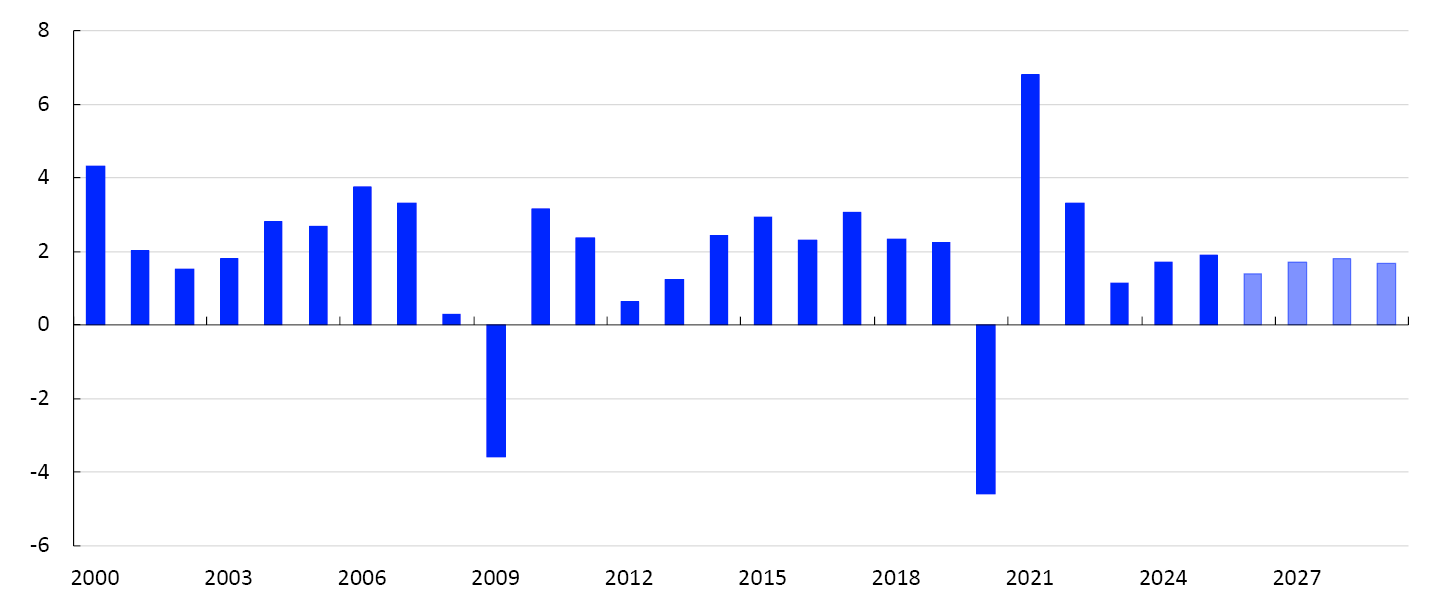
Mainland GDP growth is projected to slow from 1.7% in 2025 to 0.9% in 2026 and then to 0.8% in 2027, before picking up again slightly in 2028 and 2029 (Chart 2.5). The projections for 2026 – 2028 have been revised down since the March Report.
Annual change. Contribution to annual change. Percentage points2
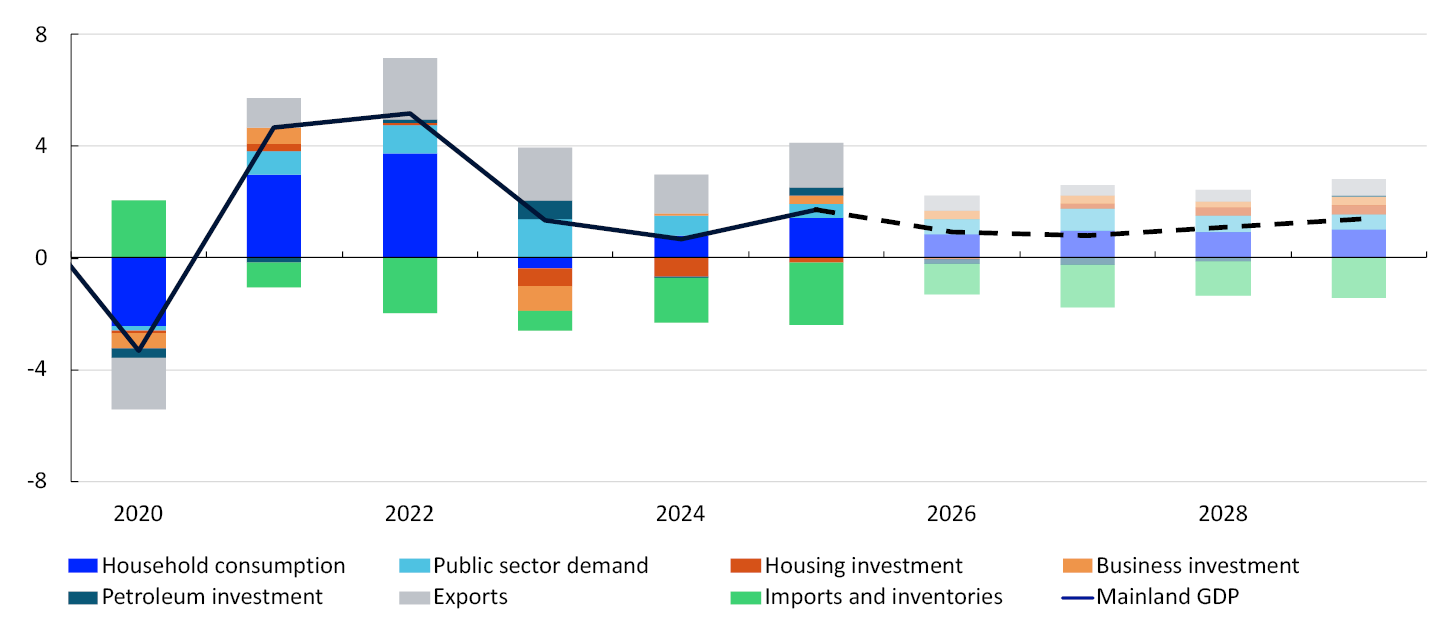
Household consumption growth will likely be moderate in 2026 before annual growth likely picks up from 2027. Housing investment is projected to pick up from 2027 and growth in business investment to remain elevated ahead. Growth in public sector demand is expected to increase in 2027, before gradually drifting down. Export growth will likely decline ahead. Petroleum sector investment is projected to decline as ongoing development projects reach completion. For detailed projections and changes from the March Report, see Annex Tables 2 and 3.
- 1 Regional Network survey 2/26. The SMART modelling system for short-term forecasting is based on historical relationships. It weights empirical models based on previous forecasting properties.
- 2 The data for petroleum investment in this chart include investment in international shipping. Public demand = public consumption + public investment.
Households
In 2023, higher interest rates and high inflation reduced household purchasing power and contributed to a fall in consumption. In 2024, household real disposable income rose markedly, and consumption picked up but less than income. Together with higher pension saving, this led to an increase in the saving ratio. The strong income growth continued in 2025. At the same time, consumption increased markedly, resulting in little change in the saving ratio compared with 2024.
Constant 2023 prices. In billions of NOK
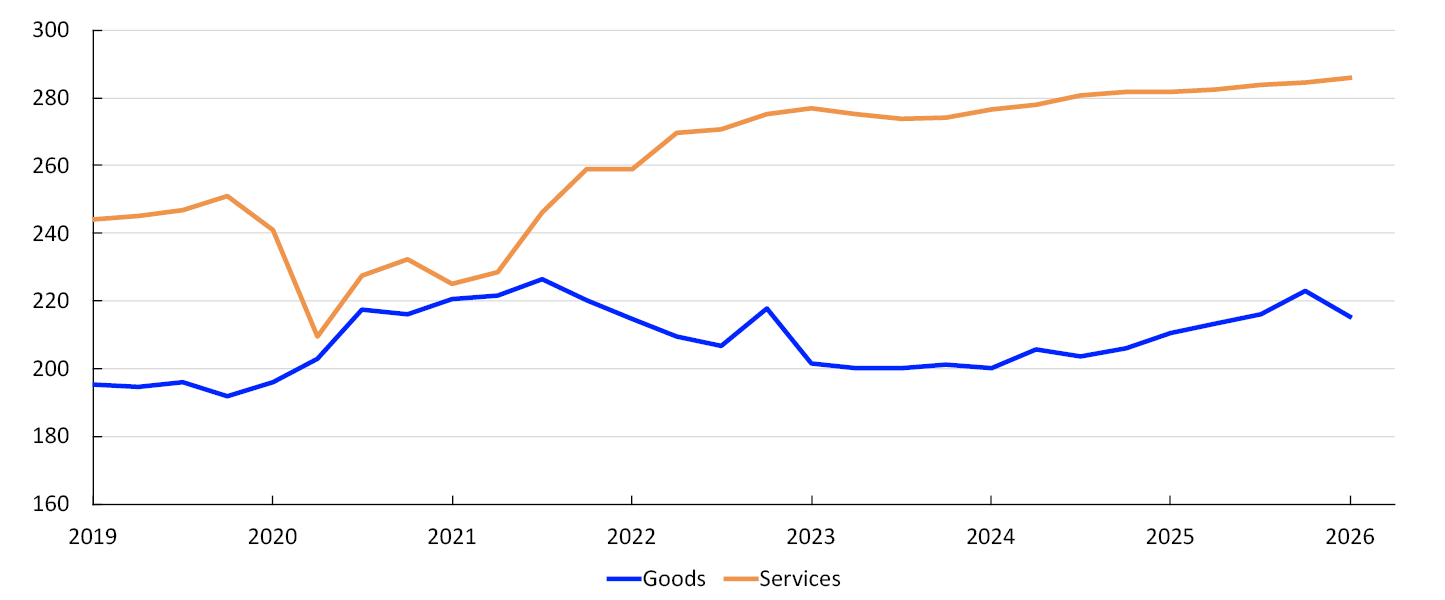
Services consumption continued to grow in 2026 Q1. The decline in car purchases contributed to a marked fall in goods consumption (Chart 2.6). Overall consumption fell more than projected in the March Report. Consumption growth is expected to pick up in the coming quarters, but weak developments in Q1 pull down annual growth from 2.7% in 2025 to 1.6% in 2026. Further out in the projection period, consumption growth is expected to pick up slightly. The projections are based on the following:
- Following marked fluctuations around the turn of the year, household car purchase figures have returned to around the average of the months preceding the announcement of the tax changes. Retail trade increased slightly between March and April.
- Regional Network retail trade and services contacts expect minor changes in household demand growth in the coming quarters. Higher interest rates are dampening sales of consumer durables somewhat.
- Household real disposable income growth is projected to slow from 3.3% in 2025 to 2.3% in 2026 and to 1.4% in 2027. Declining wage and employment growth and higher net interest expenses are contributing to the decline. Lower income growth will likely dampen consumption growth somewhat, but households are also projected to adjust saving in order to smooth fluctuations in income growth.
- Pension saving is assumed to remain elevated ahead and consumption to increase on average less than household real disposable income in the coming years.
- Households are highly indebted, and in the period to 2024, the interest burden increased before falling slightly through 2025 (Chart 2.7). Higher interest rates are likely to contribute to a slight increase in households’ interest burden in 2027. Debt levels are expected to rise broadly in pace with household income, resulting in minor changes in debt-to-income ratios ahead.
Percent3
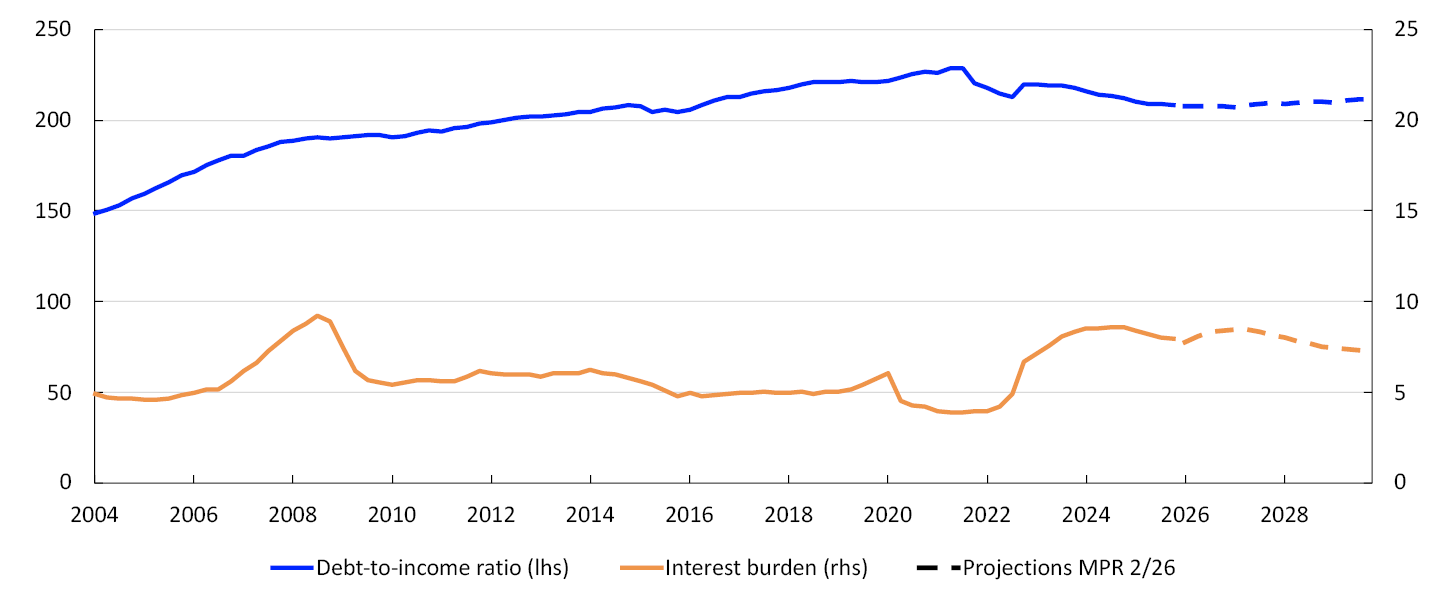
- 3 Debt-to-income ratio is debt as a share of disposable income. Disposable income is after-tax income less interest expenses. Interest burden is interest payments as a percentage of after-tax income.
Housing market
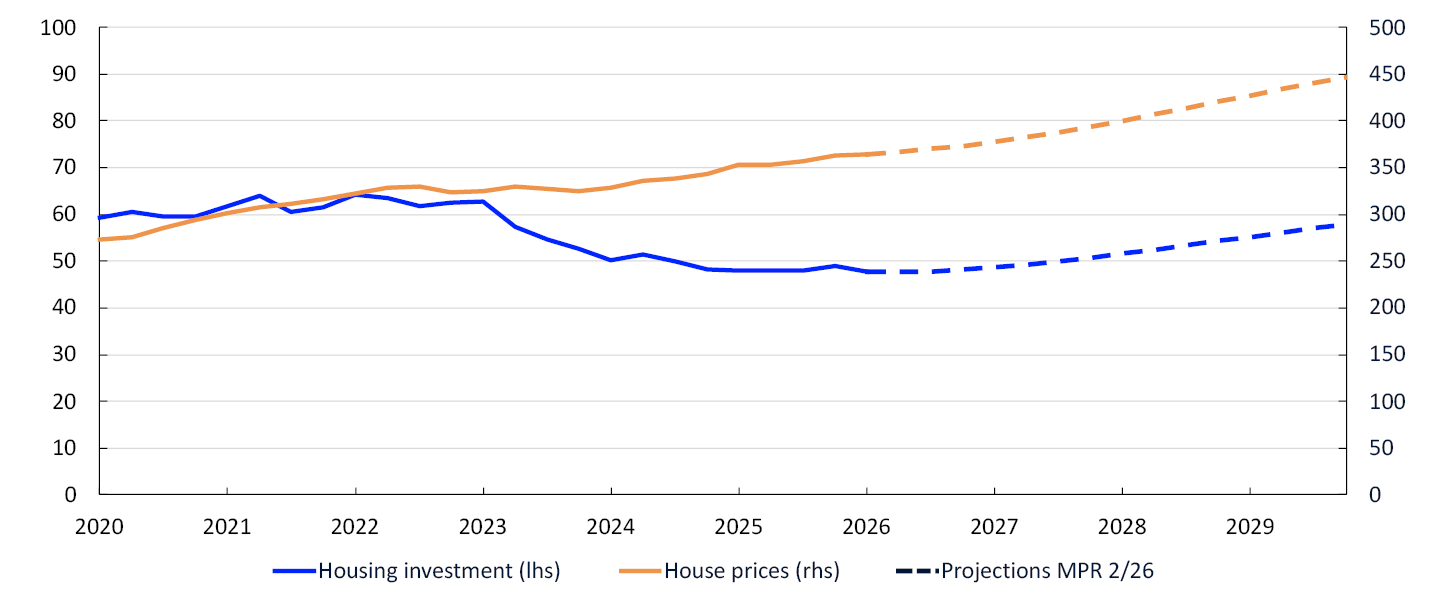
Housing investment fell by around 25% between the beginning of 2022 and autumn 2025, partly reflecting a marked increase in material costs and higher interest rates. Following solid growth in 2025 Q4, housing investment declined in 2026 Q1. Developments were weaker than projected, and housing investment is now expected to decline slightly in 2026 compared with 2025. Annual housing investment growth is projected to pick up further out in the projection period. At the end of 2029, the level is expected to be lower than at the beginning of 2022 (Chart 2.8). The projections are based on the following:
Constant 2023 prices. In billions of NOK (investment). Index. January 2003 = 100 (prices)
- Activity among many Regional Network construction contacts is low. Contacts point out that the expected pickup in residential construction is continually being postponed as a result of higher interest rates and expectations of a further rise in construction costs.
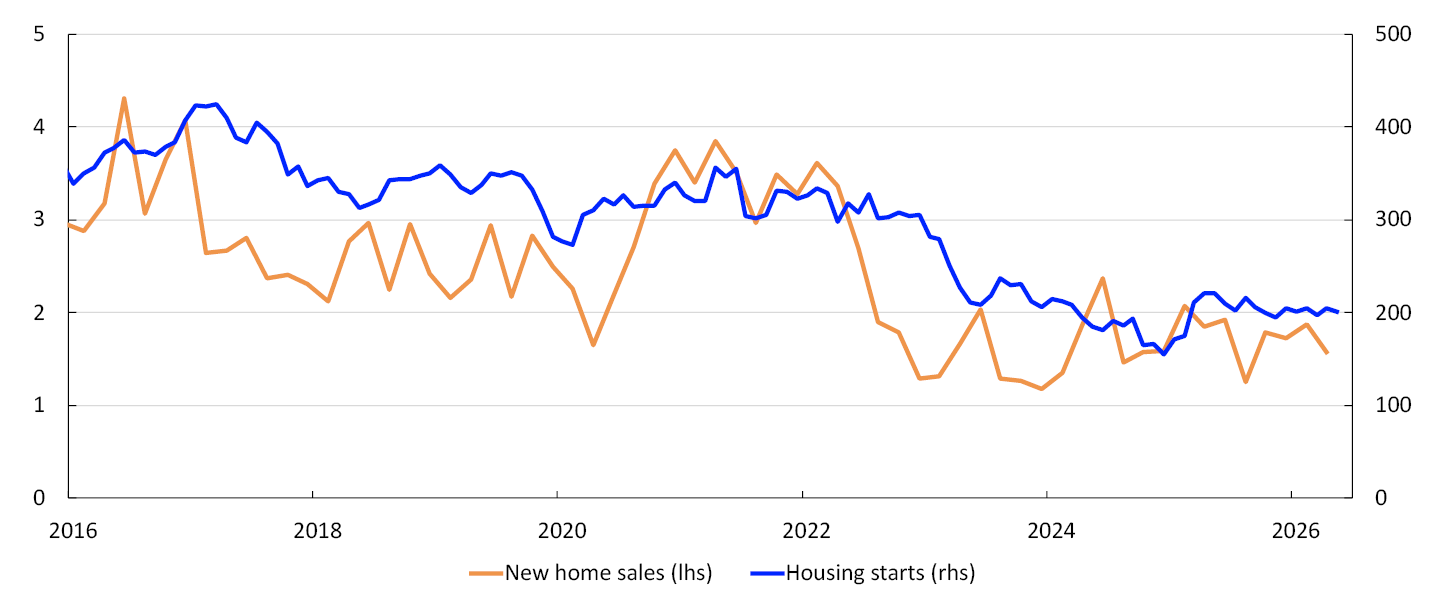
- Figures for housing starts and new home sales indicate that housing investment will change little in the near term (Chart 2.9). Continued high prices for new homes relative to existing homes indicate that new home sales will remain weak also in the period ahead.
Sales in units (thousands). Housing starts in thousands of square metres, 3-month moving average
- Over time, increased household purchasing power is expected to lead to somewhat higher demand for both new and existing homes.
- Further out in the projection period, lower interest rates and a rise in house prices will likely improve profitability in construction and lead to an increase in new builds.
Regulatory easing of equity requirements for house purchases and lower interest rates likely contributed to a pickup in existing home prices in 2025. In recent months, the rise in prices for existing homes has been slightly weaker than projected in March. Higher house prices are expected ahead, but annual growth in 2026 will likely be lower than in 2025. From 2027, the annual rise in prices for existing homes is expected to pick up. The projections are based on the following:
- The increase in household income and high employment will likely boost housing demand in the coming years.
- A low supply of new homes suggests higher house prices.
- Over time, lower interest rates will pull in the direction of higher house prices.
Firms
Mainland business investment was sluggish between 2022 and 2024, reflecting the rise in interest rates and other costs. In 2025, investment growth picked up, and moderate business investment growth is expected ahead (Chart 2.10). Annual growth for 2026 has been revised down from the March Report. The projections are based on the following:
Constant 2023 prices. In billions of NOK4
- Regional Network contacts point out that technology investment is boosting investment across sectors. In addition, high energy prices incentivise investment in energy efficiency, particularly among manufacturers. At the same time, global turbulence, cost growth and higher interest rates are prompting some contacts to postpone or halt investment projects.
- Services contacts plan to increase investment in 2026, but their plans have been revised down from the previous survey.
- According to the investment intentions survey from Statistics Norway, investment in manufacturing and mining and quarrying will remain broadly unchanged between 2025 and 2026.
- The survey indicates that energy supply investment will increase markedly between 2025 and 2026, in line with the projections in the March Report. The strong increase is driven in particular by investment related to power grid upgrades. Information from grid companies indicates that power grid investment will continue to increase in the coming years.
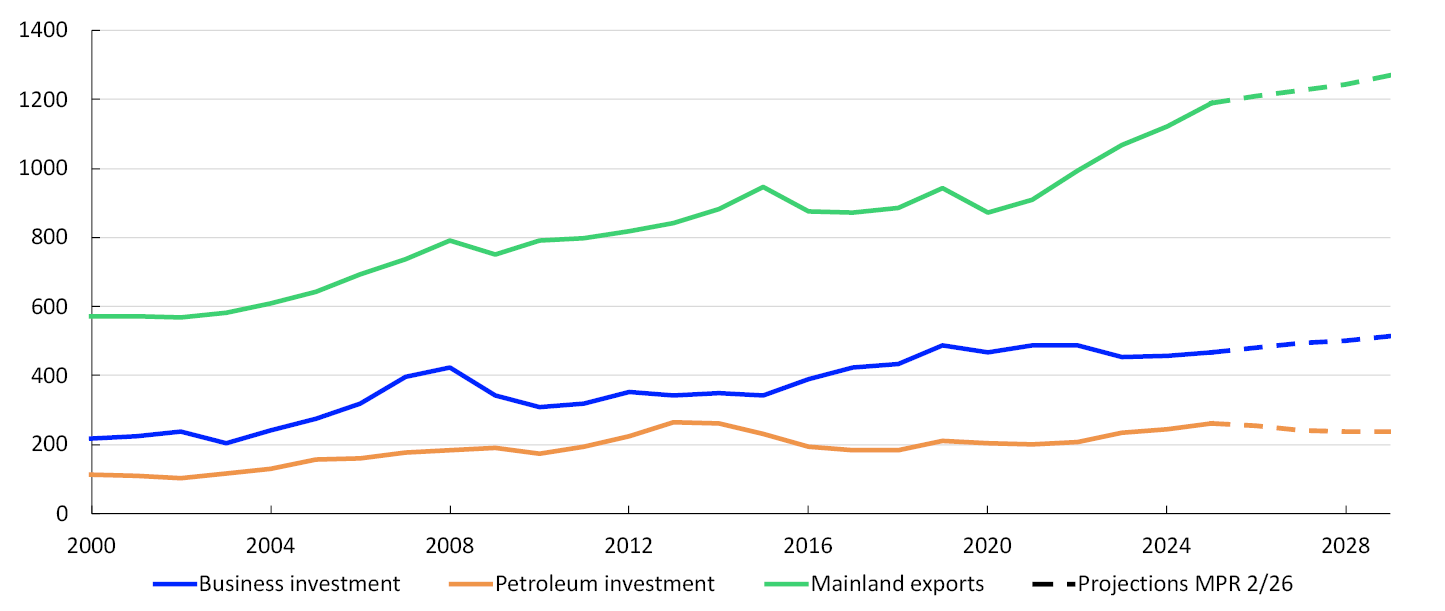
Petroleum sector investment has risen sharply over the past three years, reflecting the launch of a number of development projects in 2022 in response to the petroleum tax package and high oil and gas prices. Petroleum investment is projected to decline in the period between 2026 and 2028. The projections are based on the following:
- Investment in ongoing development projects is expected to fall by around NOK 100bn between 2025 and 2028 as projects reach completion.
- Oil companies have announced a host of new development projects ahead. This will generate substantial investment, but not enough to compensate for the decline in ongoing development projects in the period to 2028. However, the new projects are expected to increase petroleum investment somewhat in 2029.
- The investment intentions survey indicates that petroleum investment will fall somewhat more in 2026 and 2027 than projected in the March Report.
- The closure of the Strait of Hormuz has led to a rise in oil and gas prices. The price increases are expected to curb the decline in petroleum investment ahead.
Mainland exports have expanded markedly since 2021. The krone depreciation in the period to summer 2023, increased tourism and higher investment in oil, gas and green technology abroad have contributed to the expansion. In addition, aquaculture exports were very high in 2025.
Export growth is expected to decline in these sectors ahead, and mainland exports are projected to grow moderately from 2026 to the end of the projection period. The projections are based on the following:
- Export-oriented Regional Network contacts expect production to increase somewhat in the period to autumn. For example, higher global defence spending will likely boost growth for a number of export firms.
- The krone exchange rate strengthened quite a bit in the first months of 2026 but weakened again in June (see “The krone exchange rate”). Looking ahead, the exchange rate is assumed to be broadly as assumed in the March Report.
- Trading partner GDP growth will likely decline from 2025 to 2026 but is expected to increase slightly thereafter.
- Global petroleum investment is likely to weaken ahead compared with the period between 2021 and 2025.
- 4 Goods and services exports from mainland Norway.
Fiscal policy
Growth in public sector demand has declined over the past two years. Public investment fell through much of 2025 and in 2026 Q1. Looking ahead, growth in public sector demand is assumed to be higher than growth in mainland GDP (Chart 2.11). Overall, projections for public demand growth for the years 2026–2029 are slightly lower than in the March Report. The projections are based on the following:
Annual change. Percent5

- Growth in public sector demand through 2026 is assumed to be in line with the proposed Revised National Budget (RNB) and the budget compromise.
- The structural non-oil budget deficit as a share of the Government Pension Fund Global (GPFG) is assumed to be in line with the proposed RNB for 2026 and the budget compromise. As a share of the GPFG, the deficit is estimated at 2.7% in 2026.
- Support to Ukraine accounts for some of the growth in government spending in 2026 but is expected to have little effect on domestic demand.
- Defence spending is expected to boost public sector demand through the projection period. Developments are assumed to be in line with the long-term plan for the Norwegian defence sector adopted in 2024 and revised in 2026.
According to the estimates from the Ministry of Finance, the fiscal stance, as set out in the proposed RNB for 2026, will have a broadly neutral effect on the level of activity in 2026.
- 5 Public demand = public consumption + public investment.
Labour market and the output gap
Capacity utilisation, or the output gap, is a measure of the difference between actual output in the mainland economy and potential output. The output gap and potential output cannot be observed and must therefore be estimated. In the near term, the output gap is estimated based on different indicators and models, with particular weight given to labour market developments. The potential output estimate follows from the output gap and GDP estimates. In the longer term, the potential output estimate is based on estimated trend productivity and Norges Bank’s assessment of the highest sustainable level of employment consistent with stable wage and price inflation (trend employment, N*).
Output is assessed to have been close to potential over the past few years but to have declined slightly since 2025. The output gap is now likely slightly below zero. Overall, the output gap estimate for 2026 is little changed from the March 2026 Monetary Policy Report (Chart 2.12). The projections are based on the following:
Percent1
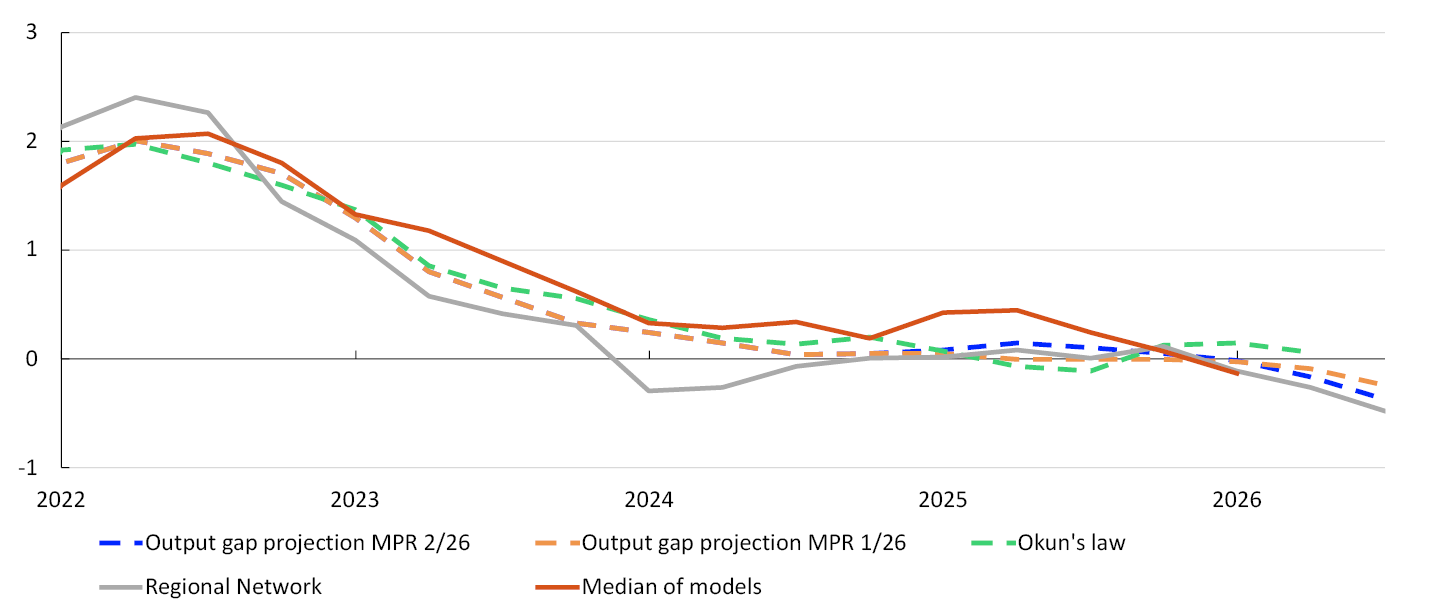
- Adjusted for normal seasonal variations, registered unemployment has been stable at 2.1% so far in 2026. This is slightly higher than projected in the March Report, but close to the level seen as consistent with output at potential. Gross unemployment, which includes job seekers on labour market programmes, increased slightly from April to May.
- According to the Labour Force Survey (LFS), unemployment was stable at 4.6% through 2025 H2. However, unemployment has increased so far in 2026, and trend LFS unemployment has gradually been revised up. The increase in 2026 has mainly been driven by an increase in unemployment among those over 24 years of age. The increase in LFS unemployment indicates a looser labour market and, in isolation, pulls the output gap down compared with the March Report.
- Employment rose further in 2026 Q1, as projected in the March Report. The employment rate is now assessed to be close to a normal level. Regional Network contacts expect employment growth to slow slightly in Q2 and Q3, in line with the projections in the March Report.
- The share of contacts reporting capacity constraints and labour shortages has declined since the end of 2025, indicating that the output gap is somewhat below zero and declining slightly faster than projected in the March Report.
- Both the stock of vacancies and the inflow of new vacancies increased somewhat in 2026 Q1, indicating slightly higher demand for labour and, in isolation, a higher output gap compared with the March Report.
- Norges Bank’s modelling system for capacity utilisation incorporates variables such as mainland GDP, employment, unemployment, wage growth and inflation. The models indicate that capacity utilisation declined through 2025 and was somewhat below a normal level in Q1. This is slightly lower than assumed in the March Report (Chart 2.12).
- The models indicate that capacity utilisation was slightly higher in 2025 than assumed in the March Report, and the output gap estimate for the whole of 2025 has therefore been revised up slightly.
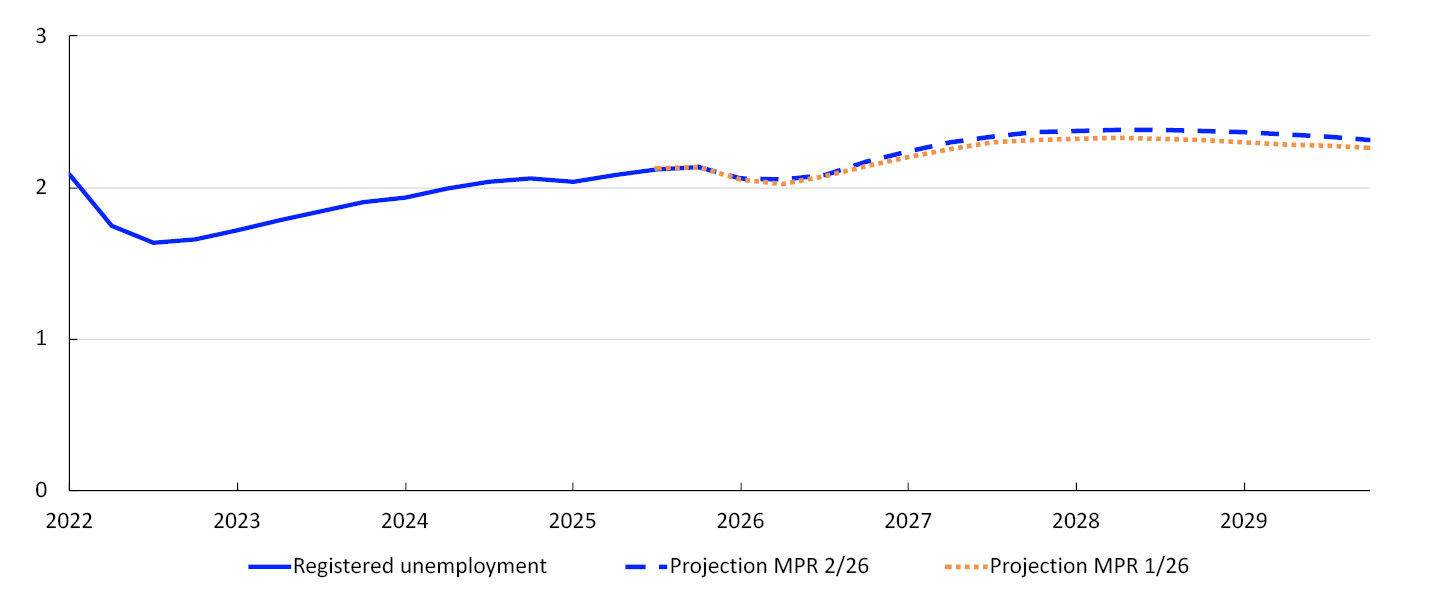
Overall, the labour market has been broadly in line with expectations. The output gap is projected to bottom out in 2028, at a level that is slightly lower than projected in March. The output gap is negative throughout the projection period. Looking ahead, the employment rate is expected to decline slightly and remain at a lower level than Norges Bank’s assessment of trend employment. Registered unemployment is projected to rise to 2.4%, slightly higher than projected in the March Report (Chart 2.13).
Percent2
Potential output
The growth potential of the Norwegian economy, measured as potential output growth, has gradually declined over the past 20 years (Table 2.1). In the years after the pandemic, however, the decline has stalled as a result of higher trend employment growth (N*). This increase is partly due to the large inflow of Ukrainian refugees to Norway. In addition, more job seekers in the oldest and youngest cohorts have found employment (see Monetary Policy Report 3/2025 for more details).
Table 2.1 Output and potential output3
|
Change from projections in Monetary Policy Report 1/2026 in parentheses |
Percentage change from previous year |
||||||
|---|---|---|---|---|---|---|---|
|
2006–2015 |
2016–2025 |
2025 |
2026 |
2027 |
2028 |
2029 |
|
|
GDP, mainland Norway |
2.8 |
1.9 |
1.7 (-0.1) |
0.9 (-0.5) |
0.8 (-0.1) |
1.1 (-0.1) |
1.4 (0) |
|
Potential output |
2.9 |
1.8 |
1.8 (-0.1) |
1.3 (-0.3) |
1.5 (0) |
1.2 (-0.1) |
1.2 (0) |
|
N* |
1.5 |
0.9 |
1 (-0.1) |
0.9 (0) |
0.7 (-0.1) |
0.6 (0) |
0.5 (-0.1) |
|
Trend productivity |
1.3 |
0.8 |
0.8 (0) |
0.4 (-0.3) |
0.8 (0.1) |
0.7 (0) |
0.7 (0) |
Potential output is projected to grow by 1.3% in 2026, and the projection has been revised down somewhat from the March Report. The assessment of potential output for 2026 is based on the following:
- Productivity growth picked up in the first half of 2025 but has since declined and was close to zero in 2026 Q1, lower than projected in the March Report. Norges Bank’s assessment is that the decline in productivity growth is mainly due to temporary fluctuations in mainland GDP and therefore does not reflect lower capacity utilisation. As a result, trend productivity growth is assessed to be temporarily lower in 2026, which dampens potential output in 2026.
- Productivity growth is expected to pick up over the course of 2026, broadly in line with the expectations of Regional Network contacts (Chart 2.14).
Percent4
- The trend employment assessment is little changed since the March Report.
Potential output growth is expected to rise again somewhat between 2026 and 2027 before gradually declining to 1.2% at the end of the projection period. The assessment of potential output ahead is based on the following:
- Trend productivity growth is expected to pick up to 0.8% in 2027 and rise by around 0.7% through the remainder of the projection period.
- Looking ahead, trend employment growth is expected to gradually decline partly owing to prospects for slower population growth. The projections are based on Statistics Norway’s population projections.
- Trend employment will also be affected by developments in the number of temporary foreign workers. In the coming years, the inflow of temporary foreign workers is expected to increase in pace with employment growth in the wider economy.
- 1 Regional Network is a direct estimate of the output gap based on the average of the capacity utilisation indicators in the Regional Network and the historical correlation with Norges Bank’s output gap estimate where the Regional Network indicator leads by one quarter. “Okun’s law” is based on an estimated deviation from the trend in registered unemployment as a percentage of the labour force.
- 2 Registered unemployed as share of the labour force. Seasonally adjusted.
- 3 The contributions from the growth in N* and trend productivity do not necessarily sum exactly to the annual change in potential output due to rounding.
- 4 Annualised quarterly changes. Productivity growth in the Regional Network is calculated as contacts’ expected output growth less expected employment growth. A two-quarter moving average is calculated. Observations from the Regional Network for 2020 have been removed due to scaling difficulties during the pandemic. Productivity growth in the quarterly national accounts is given as mainland GDP per employed person. A four-quarter moving average is then calculated.
Wage growth
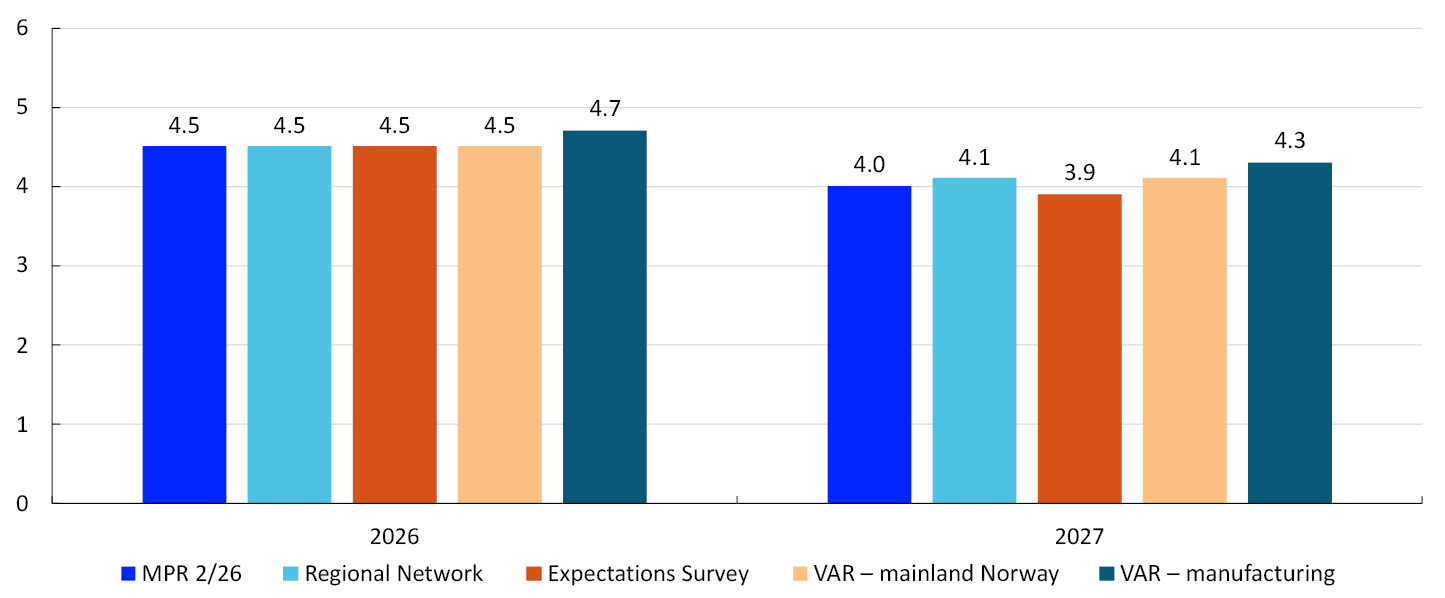
Wage growth rose substantially in the wake of the pandemic, owing to high inflation, a tight labour market and high profitability in some business sectors. Wage growth was 4.9% in 2025 and is expected to slow to 4.5% in 2026. The projection for 2026 is unchanged from the March Report. The projections for 2026 are based on the following:
- In the 2026 wage negotiations, the wage norm for manufacturing was set at 4.4%.
- The output gap is estimated to fall through 2026, pulling in the direction of wage growth moderating from 2025 to 2026.
- Regional Network contacts and the social partners in Norges Bank’s Expectations Survey expect wage growth in 2026 to slow to 4.5% (Chart 2.15). Since Q1, wage growth expectations for 2026 have been revised up in both Norges Bank’s Regional Network and the Expectations Survey.
- The average monthly wage increased by 4.4% between 2025 Q1 and 2026 Q1. This development indicates that wage growth has slowed somewhat recently, but the figures vary substantially from quarter to quarter.
- For 2026, Norges Bank’s empirical wage models indicate overall annual wage growth of between 4.5% and 4.7%. The model estimates are broadly unchanged from the March Report.
Wage growth is projected to slow further to 4.0% in 2027, slightly higher than projected in the March Report. The projection for 2027 is based on the following:
- The Bank’s projections indicate a slight increase in unemployment in 2027 and that the output gap will decline somewhat through the year, suggesting a further slowing of wage growth.
- According to Regional Network contacts and the social partners in Norges Bank’s Expectations Survey, wage growth in 2027 is expected to be 4.1% and 3.9%, respectively, a slight upward revision compared with Q1 (Chart 2.15).
- For 2027, Norges Bank’s empirical models indicate overall annual wage growth of between 4.1% and 4.3% (Chart 2.15).
Annual change. Percent5
Further out in the projection period, wage growth declines further, reflecting a looser labour market and lower inflation.
The overall wage share in the business sector has been slightly above a historical average (Chart 2.16). At the same time, the wage share in manufacturing has been markedly lower than its historical average. Information from the national accounts indicates lower in recent years manufacturing profitability in 2026 Q1. The wage share in manufacturing is projected to increase somewhat in 2026. Further out in the projection period, the wage shares in both mainland Norway and manufacturing will be close to their historical averages, but the projections are surrounded by uncertainty.
Percent6

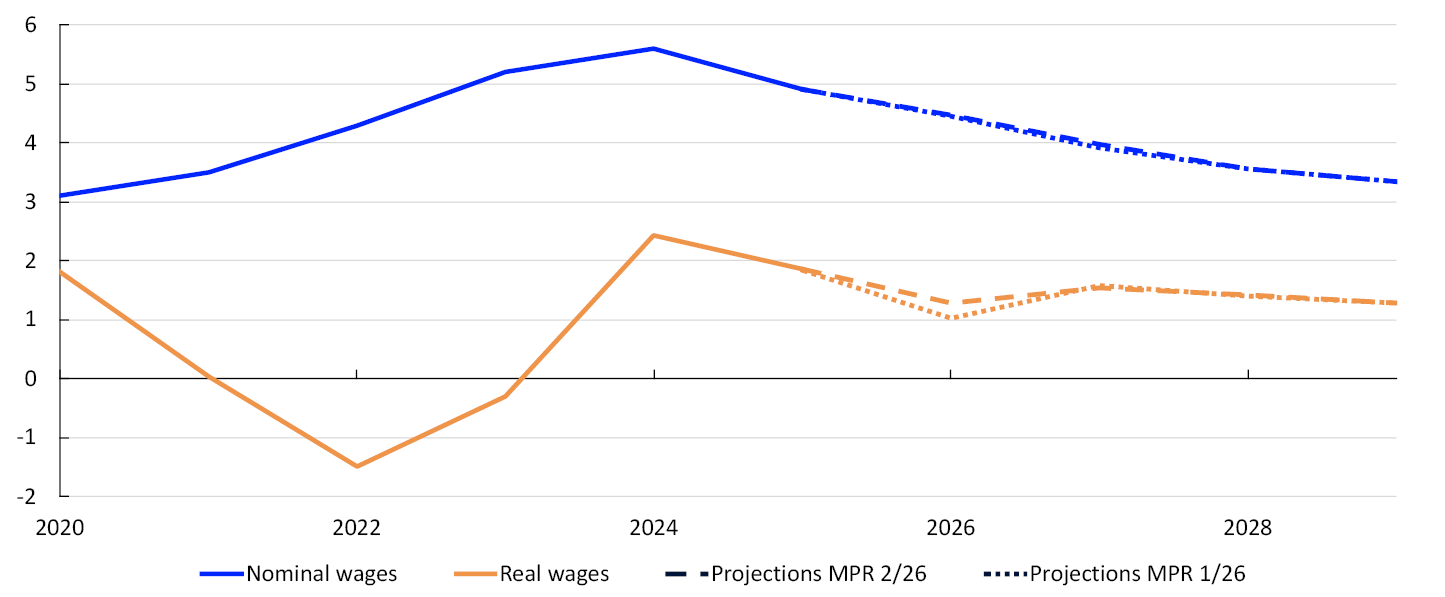
In the projections, real wage growth declines slightly in 2026, broadly in line with the March Report (Chart 2.17). The projections also imply that real wages, as measured by the CPI, grow faster than productivity through the projection period. This must be viewed in the context of Norges Bank’s estimates of firms’ product prices rising more than consumer prices.
Percent7
- 5 Expectations Survey: Social partners’ annual wage growth expectations. Regional Network: Expected wage growth in own enterprise. The VAR models are conditioned on projections for 2026 and 2027.
- 6 The wage share for mainland firms is the share for mainland Norway excluding public administration and housing services. The wage share for both mainland firms and manufacturing is adjusted for the self-employed.
- 7 Real wage growth: Nominal annual wage growth adjusted for CPI inflation.
Inflation
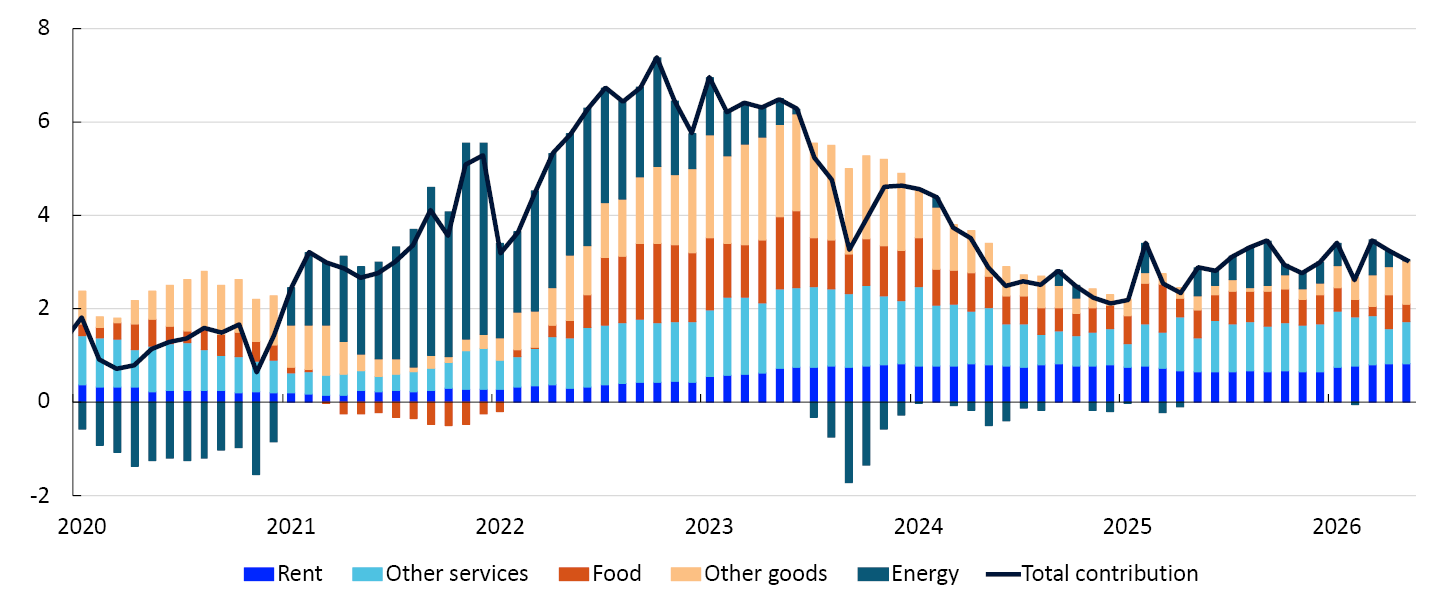
The 12-month rise in the consumer price index (CPI) peaked at 7.5% in 2022. Inflation fell markedly through 2023 and 2024 but the decline has since stalled. The rapid rise in prices for rents and other services has kept inflation elevated over time. Recently, the contribution from food prices has declined, while the rise in prices on other goods has increased (Chart 2.18). At the beginning of the year, prices rose more than expected, but developments in recent months have been broadly as projected in the March 2026 Monetary Policy Report. The 12-month rise in the CPI in May was 3.1%, while the rise in the CPI adjusted for tax changes and excluding energy products (CPI-ATE) was 3.4%.
CPI subcomponents. Contribution to 12-month change. Percent1
Core inflation
Core inflation, as measured by the CPI-ATE and other indicators, has been close to or above 3% for some time (Chart 2.19). If rents are disregarded, inflation is now slightly lower but still above 3%. Daycare prices have been reduced markedly in recent years. If daycare prices and the prices of other goods and services over which the authorities exert strong influence are excluded, inflation is higher.
12-month change. Percen2
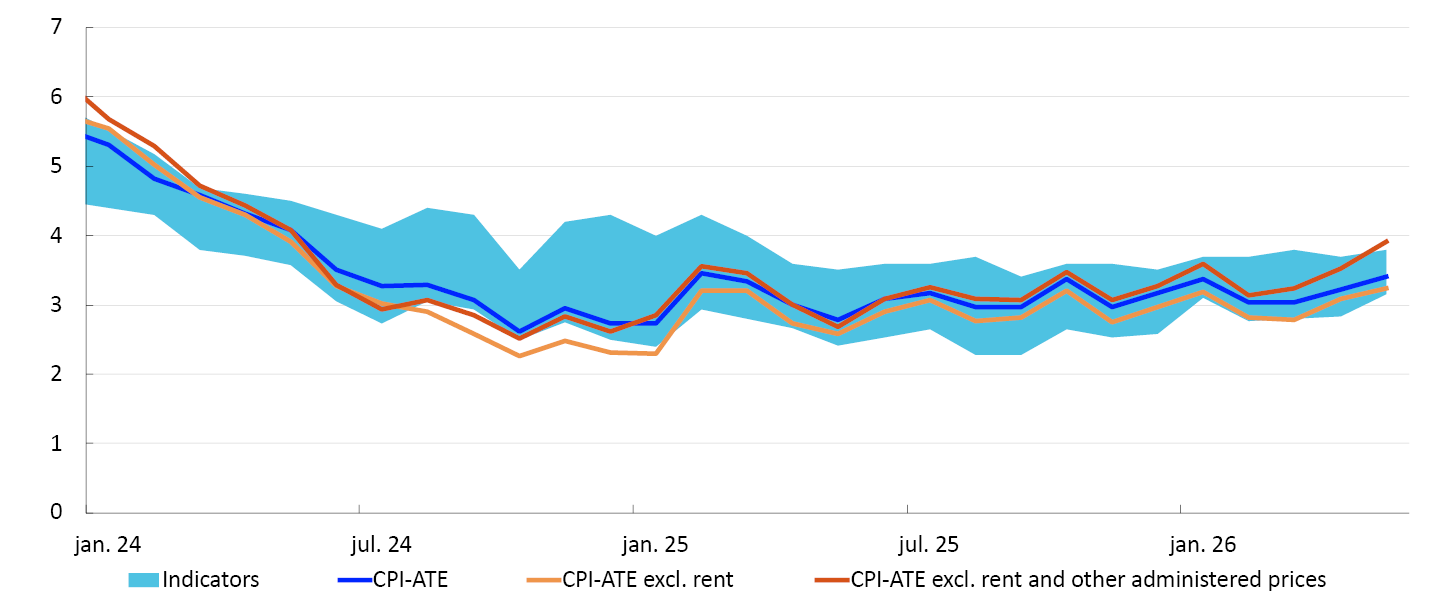
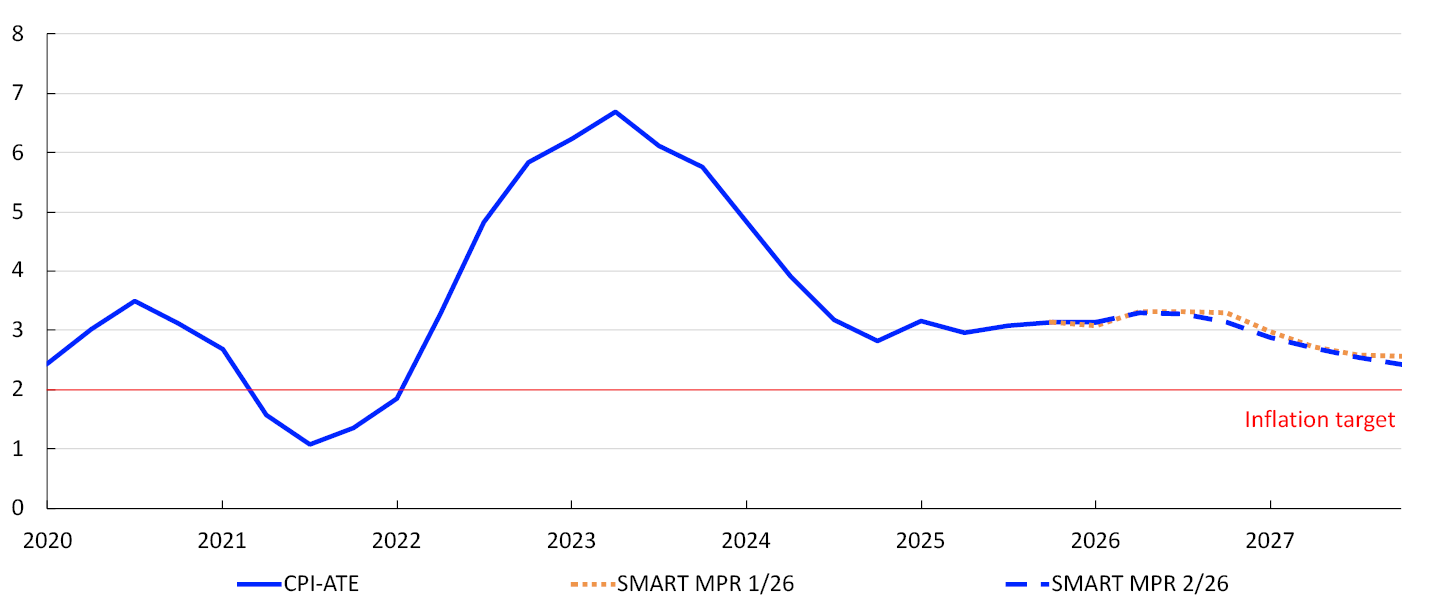
In recent months, inflation has increased somewhat, as expected in the March Report. The four-quarter rise in the CPI-ATE is expected to remain above 3% in 2026 before gradually declining towards 2% in 2029. The projections are little changed since March. The projections are based on the following:
- According to Norges Bank’s forecasting system SMART, which weights forecasts from a broad set of models, changes in core inflation will be minor in the coming quarters. The SMART forecasts are approximately unchanged from the March Report (Chart 2.20). Norges Bank's forecasts for the coming quarters are closely aligned with the SMART forecasts.
CPI-ATE. Four-quarter change. Percent3
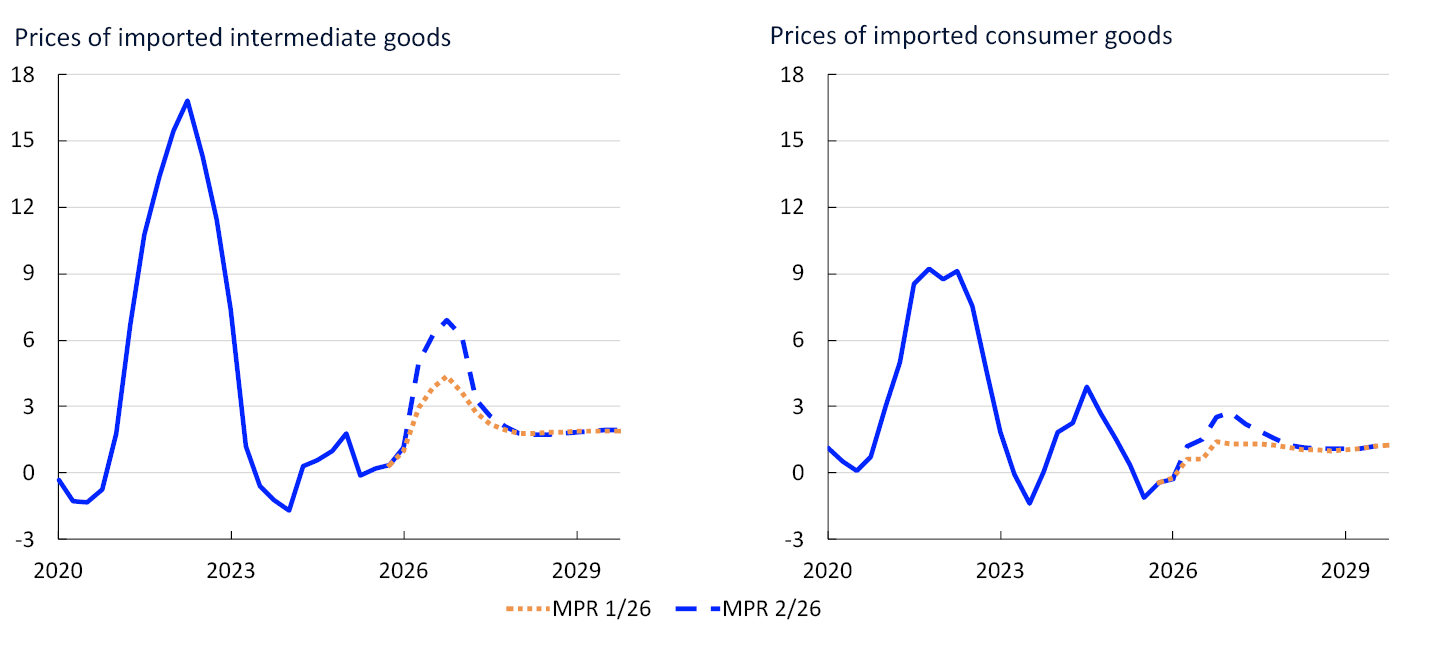
- Due to the closure of the Strait of Hormuz, spot and forward prices for oil and a number of other commodities have jumped up substantially and freight rates have risen. This will likely push up inflation for both imported and domestically produced goods and services with a high energy or commodity component. Norges Bank's indicators of imported intermediate and consumer goods have risen slightly in recent months. External price pressures are expected to increase further in the months ahead, before gradually normalising in line with developments in forward prices for oil and other commodities (Chart 2.21). The projections for the indicators and freight rates have been revised up slightly ahead compared with the March Report.
Four-quarter change. Percent4
- Wage growth has been high in recent years compared with productivity growth. This has resulted in a rapid rise in business costs and has contributed to keeping inflation elevated (Chart 2.22). In 2026, wage growth is expected to slow somewhat, to 4.5%, before continuing to decline in 2027. Compared with the March Report, projected wage growth has been revised up a little for in 2027, while projected productivity growth has been revised down slightly for 2026.
Contribution to four-quarter change in the CPI-ATE. Percentage points5
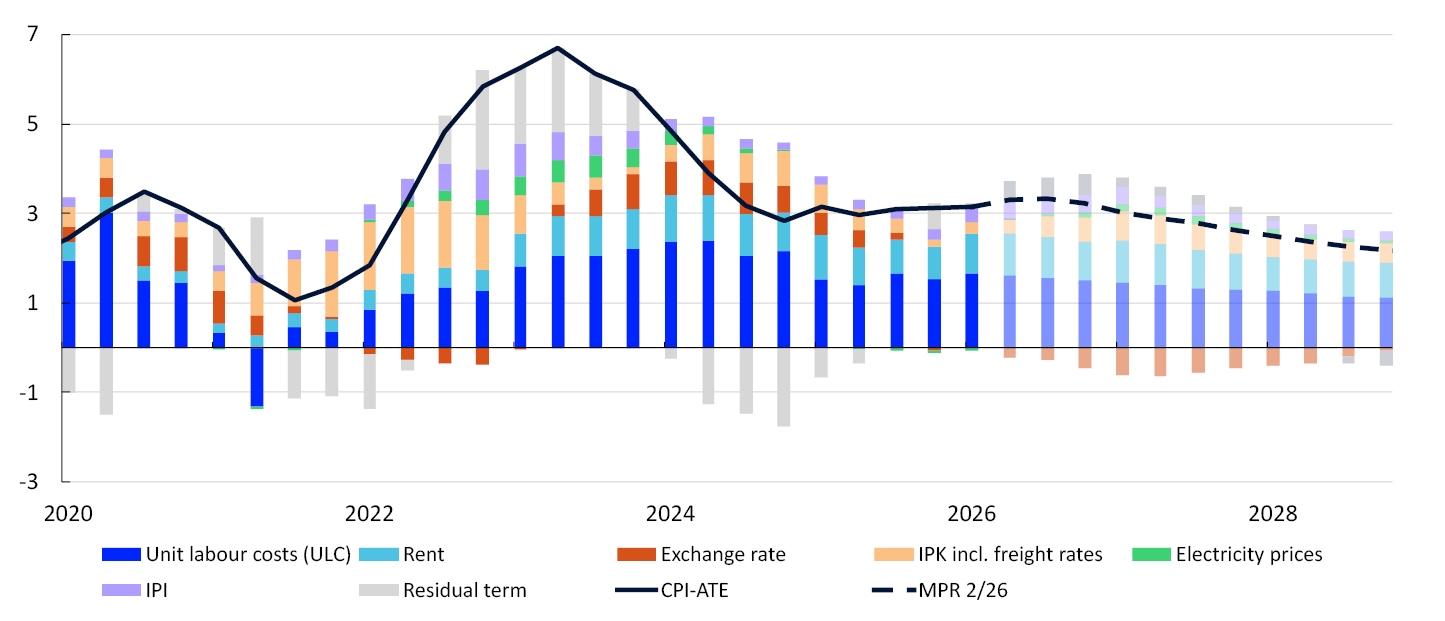
- Rent inflation has increased somewhat over the past year. Several factors may have contributed. Residential construction has declined, while growth in the number of rental homes has been weak. Consumer price inflation has been high, and many rental contracts are adjusted in pace with CPI inflation, albeit with a lag. In addition, higher interest rates in the wake of the pandemic have contributed to higher financing costs for landlords and have likely placed upward pressure on housing rents. In the projections, rent inflation will continue to outpace core inflation in the coming years. In the longer term, however, there is reason to believe that rent inflation will move down owing to the decline in overall inflation.
- The krone exchange rate has appreciated since the start of 2026, which dampens imported consumer and intermediate goods inflation in the projections (Chart 2.22). In recent weeks, the krone has depreciated slightly and, as measured by the import-weighted exchange rate index I-44, is now broadly as projected in the March Report (see “The krone exchange rate”).
- Capacity utilisation is projected to decline somewhat in the coming years and contribute to lower price and wage inflation. Compared with the March Report, the projections for capacity utilisation are little changed in 2026.
Consumer price inflation
Annual CPI inflation is expected to increase from 3.0% in 2025 to 3.2% in 2026 and decline thereafter through the projection period. The projections for CPI inflation are little changed from the March Report. The projections are based on the following:
- There are prospects that higher underlying inflation will lift overall inflation in 2026. In the coming years, core inflation is expected to gradually decline towards 2%.
- Electricity prices have been high in 2026 as a result of a cold winter, high gas prices in Europe and low hydropower reservoir levels in South Norway. The fixed electricity price scheme "Norgespris" has shielded a majority of households in South Norway, but this has not been the case to the same extent in Central and Northern Norway.
- Following the outbreak of the war in the Middle East, fuel prices increased substantially, but lower fuel taxes have since dampened the effect on prices at the pump. Norges Bank's projections are based on taxes returning to their original levels in September and petrol and diesel prices moving in line with forward prices. There is substantial uncertainty concerning the duration of the war and its implications for energy markets (see “Energy and other commodity prices”).
- 1 Contributions estimated based on the CPI by consumption categories (group level). In the statistics, some differences occur between the sum of the components and overall inflation.
- 2 CPI-ATE excluding rent and other administrated prices is presented as CPI-ATE-XADM in Statistics Norway’s StatBank source table 14706. CPI-ATE excluding rent is derived from the supply sectors to CPI-ATE in Table 14702. The indicators show the band of indicators CPIM, CPIXE, 20% trimmed mean, CPI-common and weighted median. See Husabø, E. (2017) “œIndicators of underlying inflation in Norway”. Staff Memo 13/2017, Norges Bank, for a more detailed review of the indicators.
- 3 The SMART modelling system for short-term forecasting is based on historical relationships. It weights empirical models based on previous forecasting properties.
- 4 IPI: International price impulses to imported intermediate goods, see Brubakk, L., K. Matsen, K. Mjølnerød, Ø. Robstad og E. Werenskiold (2024) “Charting the upstream: An indicator for imported input goods prices”. Staff Memo 5/2024. Norges Bank. IPK: Prices for consumer goods imported to Norway (including freight rates), see Røstøen, J. Ø. (2004) “External Price Impulses to Imported Consumer Goods”. Economic Bulletin 25 (3). Norges Bank.
- 5 Isolated individual contributions from various cost components in the CPI-ATE. The residual refers to the difference between the sum of the individual contributions and the CPI-ATE. ULC: Unit Labour Cost. IPK: Prices for consumer goods imported to Norway. IPI: International price impulses to imported intermediate goods.
3. Monetary policy analysis
This section describes the monetary policy analysis presented to Norges Bank’s Monetary Policy and Financial Stability Committee, forming part of the basis for the policy rate decision. The policy rate forecast is explained in Monetary Policy Statement.
Model implications of new information
New information
The forecasts and the monetary policy analysis are based on the macroeconomic model NEMO and other economic models, as well as analyses of the current economic situation and assumptions regarding key driving forces. For 2026 Q2 and Q3, NEMO is conditioned on projections based on the information and analyses presented in Section 2. Beyond the first two quarters, the model is conditioned on various exogenous driving forces, including market prices for oil and gas, global economic developments, petroleum investment and public demand. After conditioning on historical data, short-term forecasts and exogenous driving forces, NEMO provides forecasts for the remainder of the forecast horizon. The forecasts are cross-checked against other models.
Projections with new information conditioned on the policy rate path from Monetary Policy Report 1/2026. Percent1
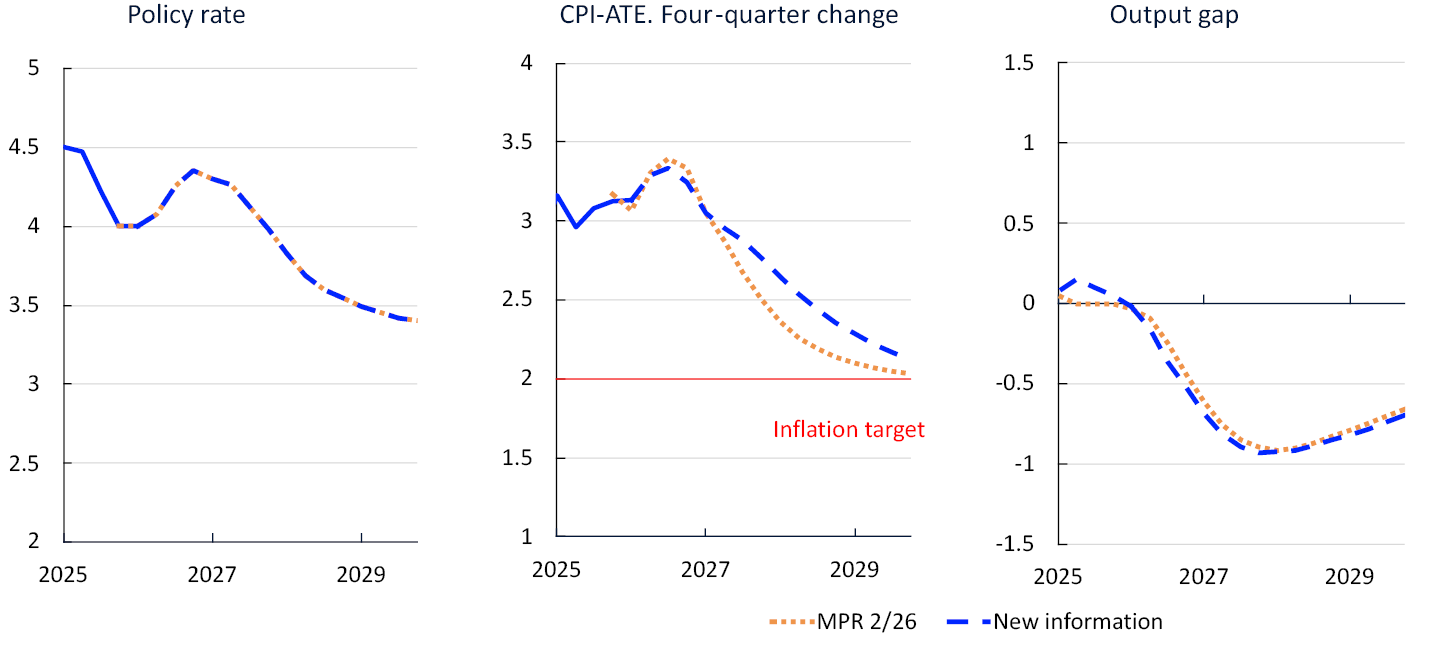
To summarise how new information and new assessments of the economic situation have affected the forecasts since the March 2026 Monetary Policy Report, Chart 3.1 presents forecasts of the output gap and underlying inflation (consumer price index adjusted for tax changes and excluding energy products (CPI-ATE)) given the same policy rate path as in March. Key premises for this analysis are:
- The rise in the CPI-ATE has been broadly as projected in the March Report. The near-term inflation projections ahead are also little changed.
- The output gap projection is little changed in the near term.
- The wage projection for 2027 is slightly higher than in the March Report.
- External price pressures appear to be slightly stronger than assumed in the March Report.
- The krone exchange rate is broadly as projected in the March Report. Near-term market policy rate expectations are higher than the rate path from the March Report. In the exercise with an unchanged policy rate path, the exchange rate assumed in the projection period is thus slightly weaker compared with the current rate.
This exercise shows that with an unchanged policy rate path, the projections for inflation are slightly higher than projected in the March Report. The output gap is about the same as in March.
The model’s policy rate path
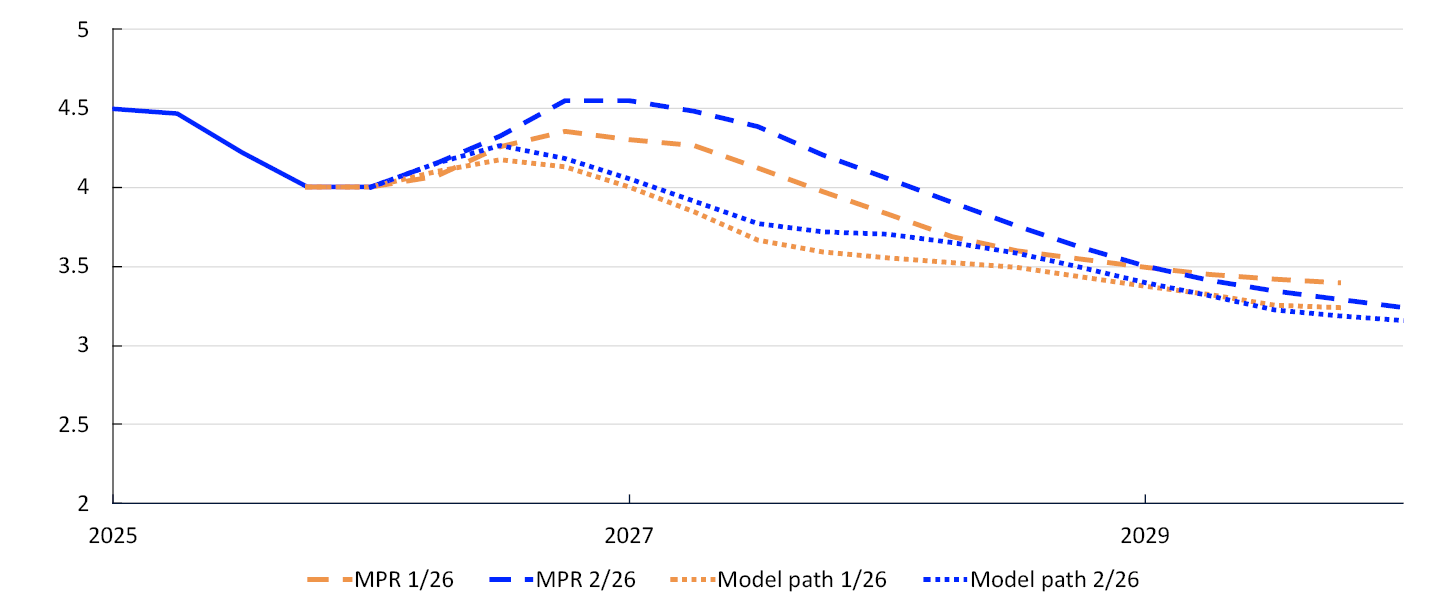
NEMO generates a policy rate path that strikes a balance between low and stable inflation and high and stable output and employment given the model structure. New information and new assessments will normally generate changes in the model-based policy rate path (model path). In the March Report, the model path was lower than the rate path.
The model path for the coming years is revised up slightly compared with the March Report (Chart 3.2). The krone exchange rate is assumed to weaken somewhat from the current level upon publication of this Report if the rate path follows the model path, reflecting the fact that the model path is lower than market-implied policy rates in the near term.
Policy rates. Percent2
The decomposition in Chart 3.3 shows how changes in the model forecasts for inflation, the output gap and the krone exchange rate, among other factors, contribute to changes in the model path. Presenting the decomposition in this manner does not necessarily indicate anything about underlying causal relationships in the model. In other words, the decomposition shows how changes in the projections affect the model rate, but not what drives the changes. The height of a bar in the decomposition depends on both how much the projection for the variable has changed and the weight of the variable in GEORG (blog post in Norwegian only). The broken line shows the sum of the bars and the change in the model path, and the solid line shows changes in the policy rate forecast.
Cumulative contribution. Percentage points. 2026Q3 – 2029Q43
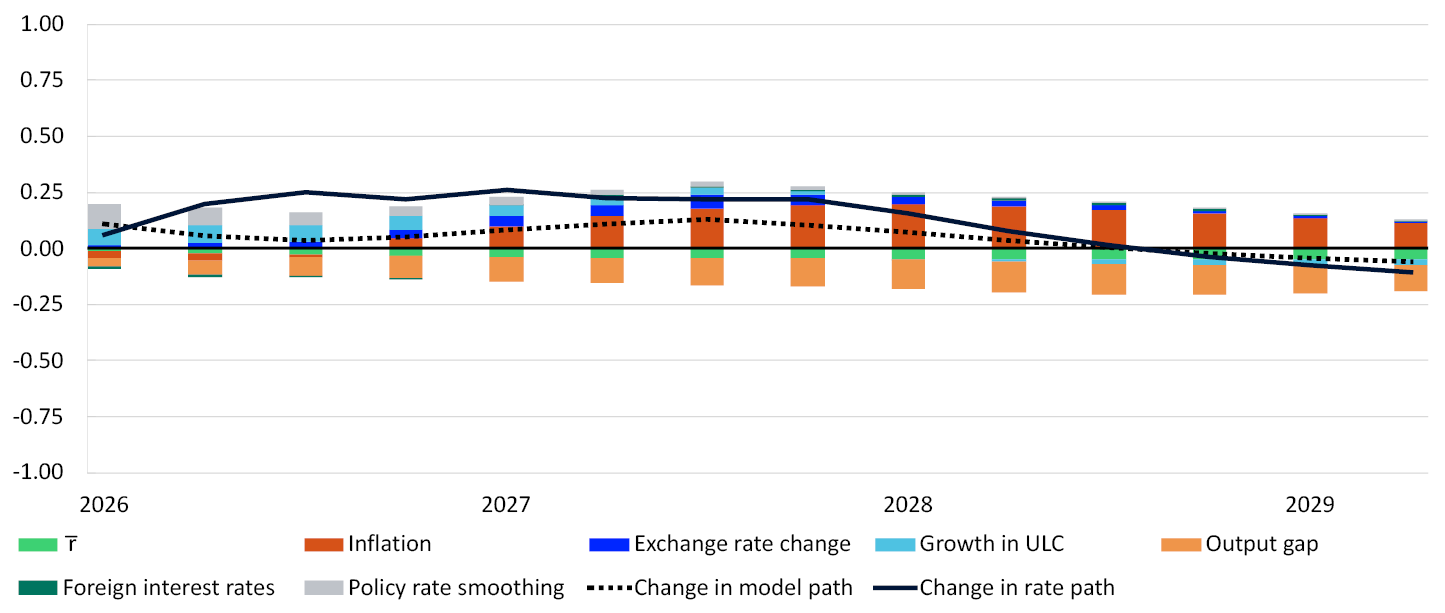
The main contributions to changes in the model path are:
- The inflation projection is little changed in the near term but slightly higher further out in the projection period compared with the March Report. Higher inflation pushes up the model path (red bars).
- The output gap is little changed in the near term and is thereafter slightly lower than in the March Report, which pulls down the model path (orange bars).
- Wage growth is projected to be slightly higher in 2027 than in March, and projected underlying productivity growth has been revised down a little in 2026. The rise in unit labour costs therefore pushes the model path slightly higher ahead (light blue bars).
- For the model path, the krone exchange rate is projected to be a little weaker than assumed for the model path in the March Report. The exchange rate therefore contributes to a slight increase in the model path (dark blue bars).
- In the near term, market-implied policy rates abroad are little changed since the March Report and contribute little to changing the model path.
- Since the rate hike in May, the model path now starts at a higher level than assumed in March. The rate level in the previous period is included in the estimation of the model path, which pushes up the path at the beginning of the projection period (grey bars).
- The point estimate for the model’s steady-state policy rate r– has been revised down slightly since the March Report and is now at 3.0%, in the middle of the interval for the neutral interest rate, reflecting the slight decline in the Norwegian market indicator (see box “Estimates of the neutral real interest rate”. The downward revision pulls down the model path throughout the projection period (light green bars).
The policy rate forecast in this Report is higher than the model path. Since the policy rate affects the projections for the economy, the decomposition is based on the model path and its corresponding projections. Using the projections from the rate path generates a change in the model path that is inconsistent with the underlying projections.
Other indicators relevant to monetary policy analysis
Other indicators relevant to the conduct of monetary policy have also been presented to the Committee:
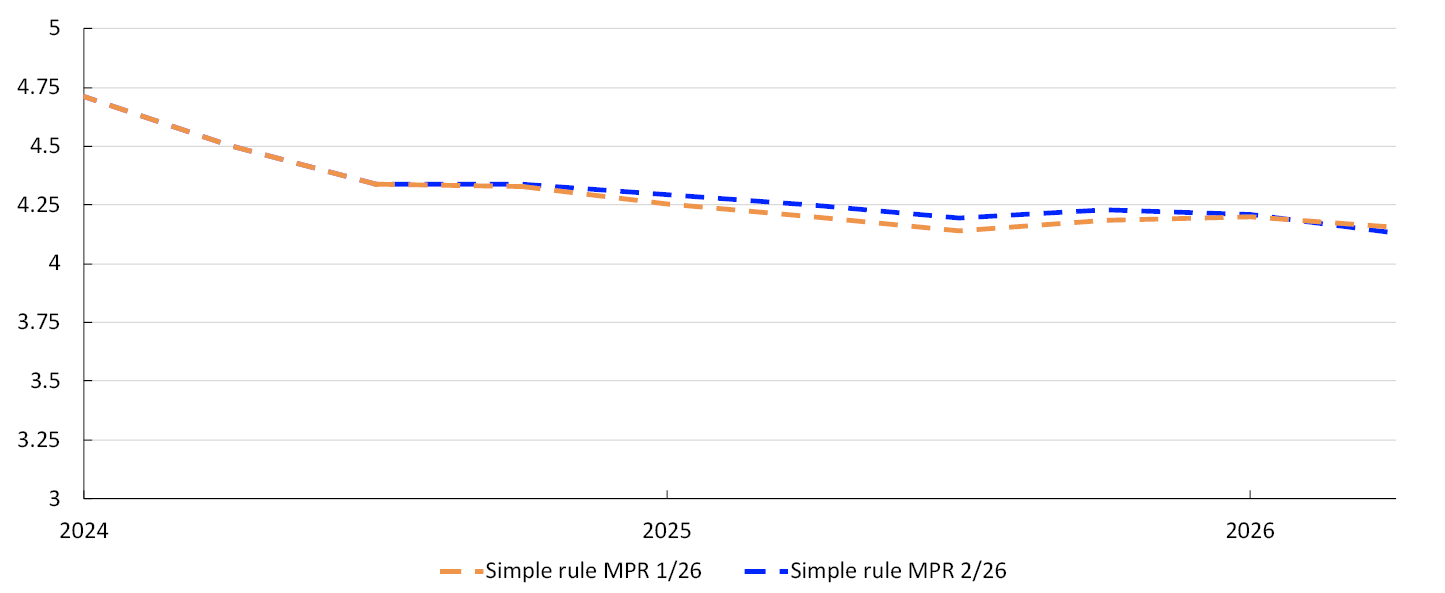
- Norges Bank’s simple Taylor rule is used as a simple cross-check of the model path. The rule estimates the historical relationship between the current policy rate on the one hand and the policy rate in the previous quarter, long-term market rates and inflation and output gap projections on the other (see Monetary Policy Report 1/2025). The simple rule now indicates a money market rate that is approximately the same as the rule indicated in the March Report (Chart 3.4) and somewhat lower than the projection for the money market rate.
Three-month money market rate. Percent4
- In the near term, market-implied policy rates can provide an indication of the market’s interpretation of new information since the previous report and market expectations of the monetary policy response. Market-implied policy rates in the coming 12 months are little changed since the March Report (Chart 3.5, left panel). In the longer term, it is difficult to directly compare market pricing with the policy rate path, partly due to term premiums. Long-term market pricing is included in Norges Bank’s assessment of the neutral interest rate (see “Estimates of the neutral real interest rate”).
Policy rates. Percent5
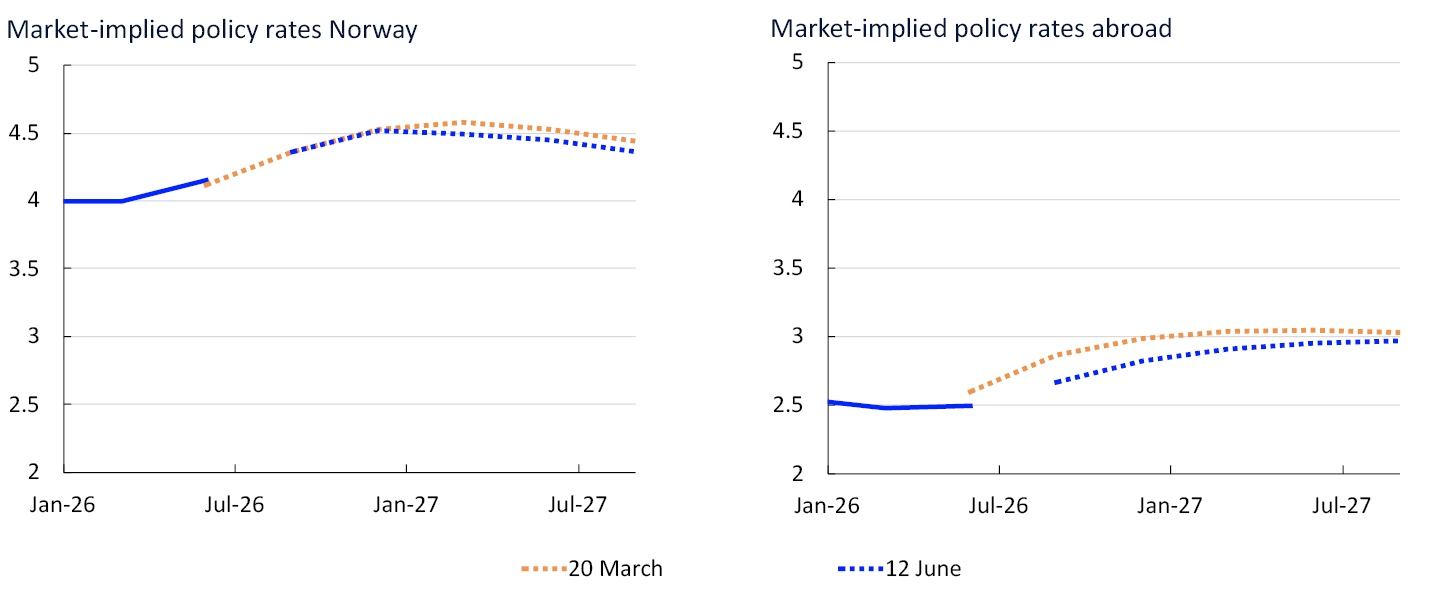
- Norway is a small open economy, with financial markets highly integrated with trading partner markets. Changes in foreign market rates can affect the krone exchange rate, and they provide an indication of market expectations for the global economic outlook. Market-implied policy rates among Norway’s main trading partners are slightly lower at the beginning of the projection period compared with the March Report (Chart 3.5, right panel).
Percent6

- 1 Projections from MPR 2/26: with new information conditioned on the policy rate path from the previous Report. CPI-ATE: The CPI adjusted for tax changes and excluding energy products. The output gap measures the percentage deviation between mainland GDP and projected potential mainland GDP.
- 2 The model’s policy rate path is calculated in our macroeconomic model NEMO. See Staff Memo by Almlid, E., I. F. Haltia and Ø. Robstad (2025) “Mapping Optimal Policy Into a Rule in NEMO: GEORG”. Staff Memo 15/2025. Norges Bank.
- 3 The contributions are based on the GEORG monetary policy rule and reflect changes in forecasts between this Report and the previous Report (see box “A monetary policy rule for understanding changes in the policy rate path” in Monetary Policy Report 4/2025). The forecasts are derived from NEMO when monetary policy follows the model path from GEORG. The policy rate path in this Report is higher than the model path the coming years. As a higher policy rate affects prospects for eg inflation and the output gap, the assumed path in the decomposition will deviate from the projections in the Report. Since the rule also gives weight to the fact the policy rate should not be adjusted too quickly, changes to the model projections will gradually change the level. The forecasts are included as deviations from their normal levels in the model.
- 4 The rule uses projections three quarters ahead for inflation and projections for the current quarter for the output gap. Since the output gap has been adjusted for previous quarters, the simple rule also indicates a slightly different rate before the current quarter.
- 5 20 March: cutoff for the Monetary Policy Report 1/2026 projections. 12 June: cutoff for the Monetary Policy Report 2/2026 projections.
The policy rate abroad is a trade-weighted average of the policy rates of the Bank of England, the European Central Bank, the Federal Reserve and Sveriges Riksbank. Owing to substantial uncertainty related to the level of policy rate expectations ahead, partly due to possible term premiums in market interest rates, the modeling system conditions on the foreign market interest rates only in the first year (see Monetary Policy Report 1/2025).
- 6 The residential mortgage rate is the average rate on outstanding mortgage loans to households from the sample of banks and mortgage companies included in Statistics Norway’s monthly interest rate statistics.
The monetary policy stance
Description of the policy rate path
The policy rate forecast (rate path) is slightly higher than in the March Report. The rate path is consistent with a higher policy rate in the course of 2026. The forecast indicates a gradual decline in the policy rate from mid-2027, reaching 3.2% towards the end of the projection period.
The rate path is slightly higher than the market-implied policy rate in the near term. It is therefore assumed that the krone will appreciate slightly upon publication of the policy rate decision and the Monetary Policy Report.
Market rates and measures of monetary policy restrictiveness
How the policy rate affects the economy depends on both the pass-through to market rates and how high these rates are compared with inflation and the long-term neutral interest rate level in the economy. Key developments in this Report are:
- The money market spread is the difference between the three-month Nibor, which is an important reference rate in the Norwegian money market, and the expected policy rate. Overall, the market pricing of the spread is as assumed in the March Report, and spread projections ahead are unchanged. The money market rate forecast has therefore been revised broadly in line with the policy rate forecast since March (Chart 3.6).
- The residential mortgage rate has been broadly as projected in the March Report. The rate is projected to rise from 5.1% in 2026 Q2 to 5.6% in 2027 Q2 and then fall gradually from mid-2027 (Chart 3.6). The mortgage rate forecast has been revised up in line with the change in the policy rate path.
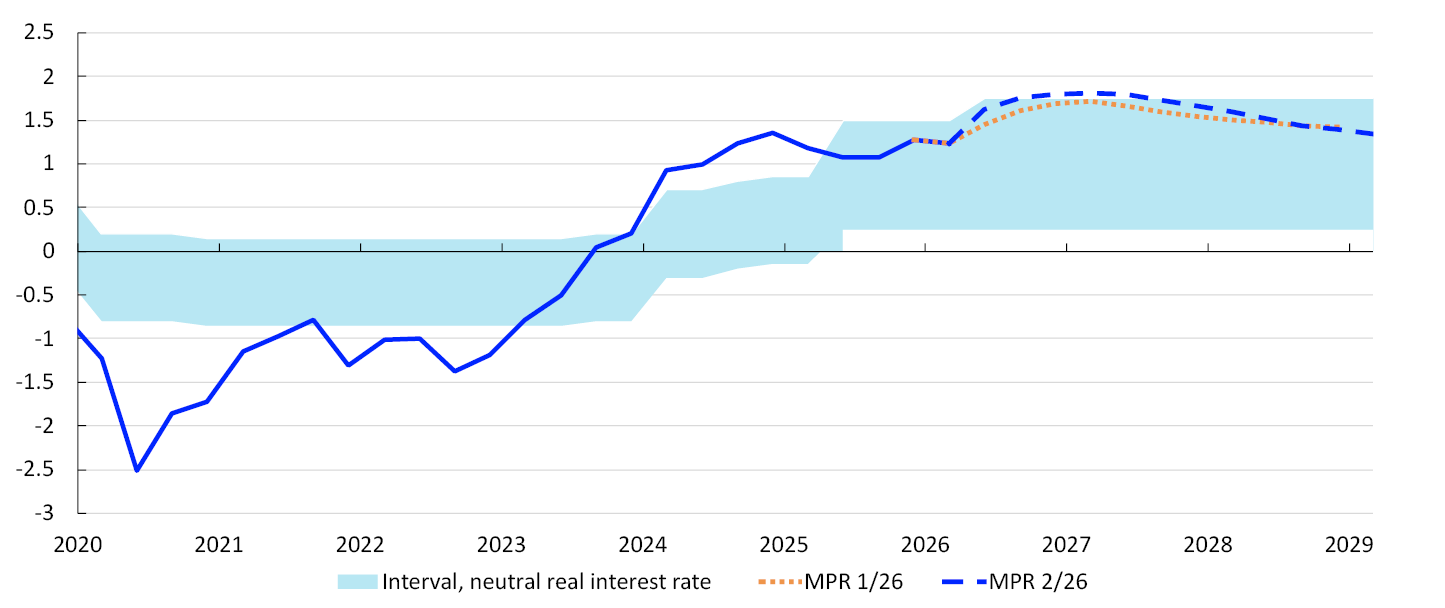
- The expected real interest rate relative to the neutral level is one of several measures of monetary policy restrictiveness. The neutral real interest rate is the real interest rate level that is consistent with a balanced economy over time. Chart 3.7 shows the real policy rate, here defined as the policy rate forecast less Norges Bank's inflation forecast. The range for the neutral real interest rate is estimated to lie between 0.25% and 1.75%, see “Estimates of the neutral real interest rate”. The real policy rate is in the upper end of this range.
Estimate of the expected real policy rate. Percent7
Monetary policy trade-offs
The trade-offs between low and stable inflation and high and stable output and employment are reflected in the Monetary Policy Statement and in the inflation and output gap forecasts. The policy rate, inflation and output gap forecasts are shown in the chart in the Monetary Policy Statement.
The points in Chart 3.8 show the average forecasts one to three years ahead for the output gap and the inflation gap (the difference between inflation and the target) in different reports. The location of the points in the chart depends on the shocks to the economy and the monetary policy response. In this Report, inflation one to three years ahead is slightly higher than in the March Report, while the output gap is lower.
Inflation gap and output gap. Average 1–3 years ahead. Percent8
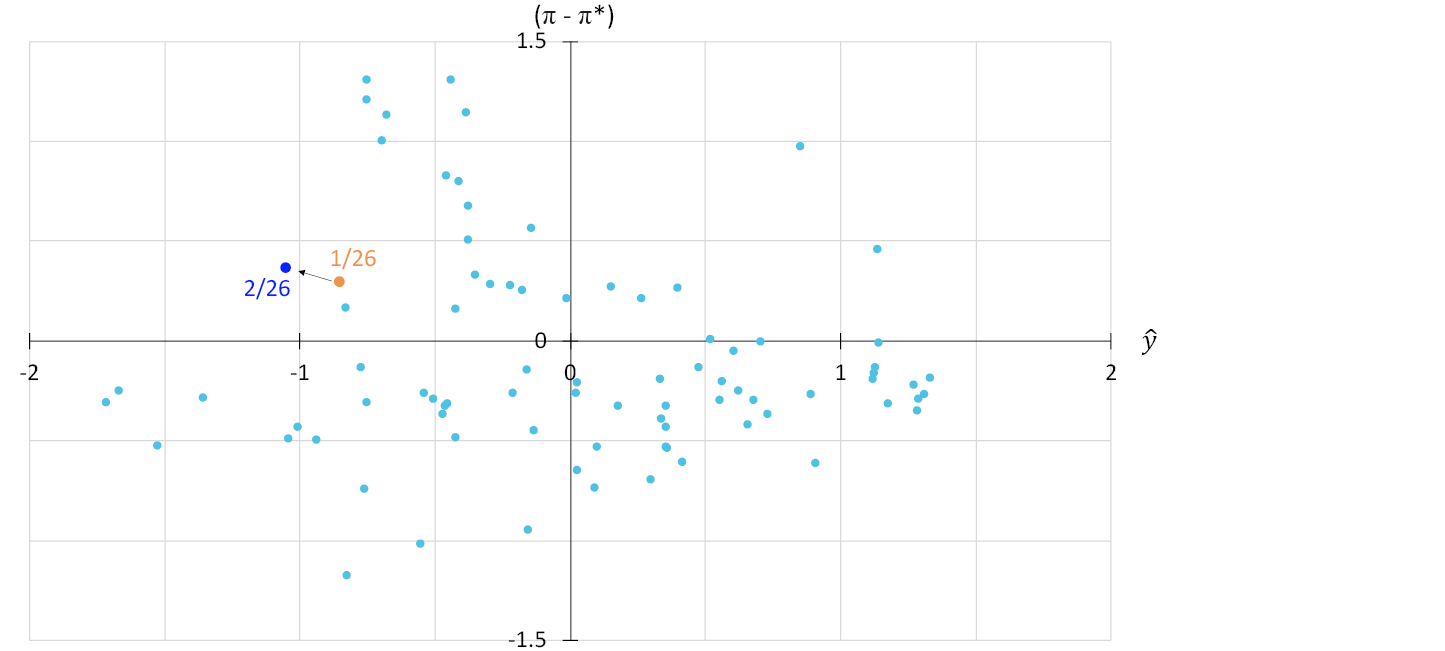
Historical forecast errors and uncertainty indicators
The analyses in this box highlight the uncertainty related to Norges Bank’s forecasts. Fan charts based on historical forecast errors provide an indication of the average level of forecast uncertainty. Model uncertainty indicators suggest that the uncertainty surrounding GDP and underlying inflation forecasts is close to historical levels.
Historical forecast errors are deviations between forecasts and actual developments (see box "Indicators of uncertainty surrounding point forecasts in the near and medium term" in Monetary Policy Report 3/2025). Chart 3.A shows the uncertainty of the forecasts in this Report based on historical forecast errors from the past 20 years. If future forecast errors follow the same pattern as historical errors, actual outcomes will lie within the light shaded areas with a 70% probability. The distributions will change little from one report to the next.
Historical forecast errors centred on the forecasts for inflation, the policy rate and the output gap. Percent1
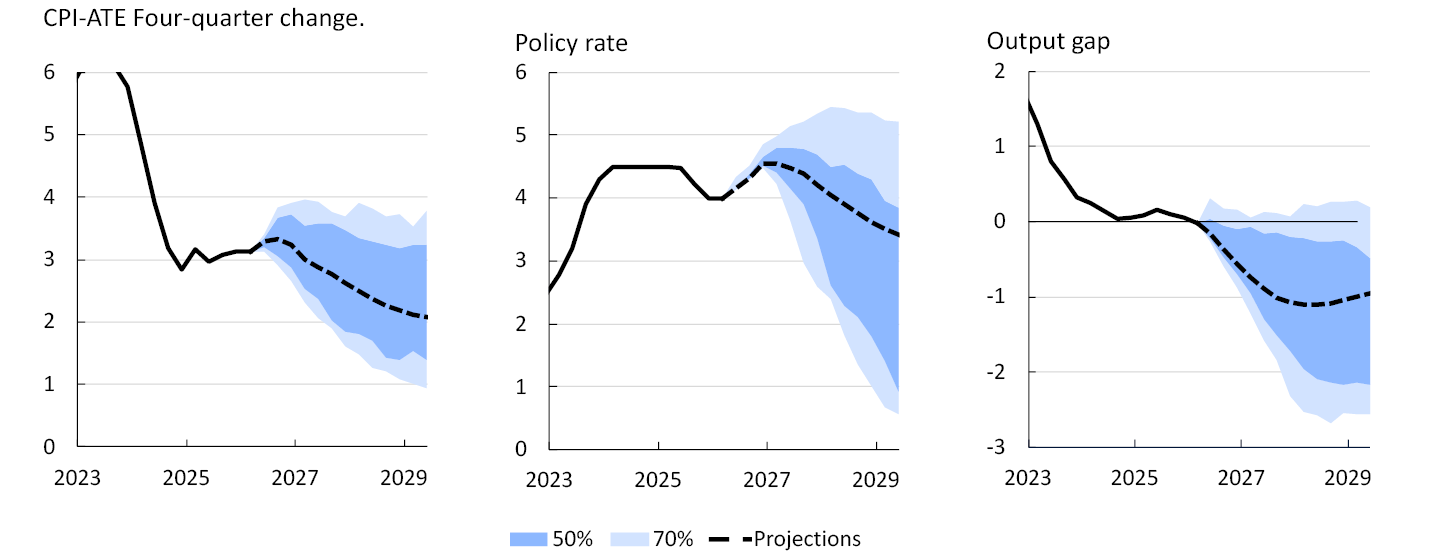
Historical forecast errors provide an indication of the uncertainty normally surrounding Norges Bank’s forecasts but provide little indication of changes in uncertainty over time. Uncertainty indicators from an estimated model framework are used to show how uncertainty has changed in recent years and how the range of possible outcomes is expected to look ahead.2 The model framework captures the relationship between a range of economic variables and uncertainty ahead. The upside risk is measured here as the difference between the 95th percentile and the median of the distribution, while the downside risk is measured as the difference between the median and the 5th percentile.
The models indicate that near-term uncertainty surrounding mainland GDP is at a normal level (Chart 3.B, left panel). In the longer term, the upside risk for GDP is close to its historical average, while the downside risk is somewhat lower and broadly unchanged from the March 2026 Monetary Policy Report (right panel).
Spread between different percentiles and median from quantile regressions. Four-quarter change in Norwegian mainland GDP. Percentage points3

There are also minor changes in uncertainty related to underlying inflation in the near term (Chart 3.C, left panel). In the longer term, the distribution is slightly skewed towards the downside (Chart 3.C, right panel).
Spread between different percentiles and median from quantile regressions. Four-quarter change in the CPI-ATE. Percentage points4

- 1 The range of possible outcomes for underlying inflation (CPI-ATE), the policy rate and the output gap are based on forecasting errors over the past 20 years. The distributions are centred on the projections from this Report.
- 2 The models use quantile regressions with different indicators to estimate the distribution of output growth, house price inflation and consumer price inflation ahead. See further description in Bowe, F., S.J. Kirkeby, I.H. Lindalen, K.A. Matsen, S.S. Meyer and Ø. Robstad (2023)“Quantifying macroeconomic uncertainty in Norway". Staff Memo 13/2023. Norges Bank.
- 3 The charts show developments in the spread between the 5th and 95th percentiles and the median for the model-estimated distribution of GDP growth one and eight quarters ahead, respectively. Broken lines indicate average 5th and 95th percentiles compared to the median between 2010 and 2019.
- 4 The charts show developments in the spread between the 5th and 95th percentiles and the median for the model-estimated distribution of consumer price inflation one and eight quarters ahead, respectively. Broken lines indicate average 5th and 95th percentiles compared to the median between 2010 and 2019.
- 7 The expected real policy rate is the projected policy rate over the next four quarters less projected CPI-ATE inflation over the same period. For 2026 Q2 and in the projection period, the expected real policy rate is estimated based on the projections in this Report. For all previous periods, the expected real policy rate is based on the most up-to-date Monetary Policy Report at the time in question. Norges Bank’s estimated interval for the neutral real rate has been adjusted over time (see box: Estimates of the neutral real interest rate). The interval for the neutral real rate is now between 0.25% and 1.75%.
- 8 The chart shows combinations of forecasts for the output gap (y) and inflation (Π) as deviations from the target (Π*) on average one to three years ahead. Each point represents the forecasts in a specific Monetary Policy Report. There are prospects for near-optimal attainment of objectives if the points are close to the origin. However, the points will typically be some distance from the origin following major shocks. The point for Monetary Policy Report 1/2026 is based on the average projections from the same time horizon as for Monetary Policy Report 2/2026.
Boxes
Norway’s trading partners are likely better able to cope with higher oil prices than before
The war in the Middle East and the closure of the Strait of Hormuz have led to a sharp rise in oil prices. As energy consumption as a percentage of GDP has declined, the economic consequences of higher oil prices may also become less severe, as supported by a new empirical analysis.
Higher oil prices have contributed to a number of economic downturns. As pointed out by James D. Hamilton more than 20 years ago, nine out of ten of the US recessions since World War II were preceded by a spike in oil prices,1 and a study by Diego Känzig published in 2021 found that, on average, an oil price increase of 10% reduced US GDP by around 0.5%.2 The decline in GDP can partly be attributed to tighter monetary policy when oil prices rise.3
There has already been a pronounced pickup in consumer price inflation in a number of countries as a result of the conflict in the Middle East. One reason is that the prices of refined products, such as diesel and jet fuel, have risen more than the price of crude oil. Higher oil prices are also assumed to dampen economic activity, but the negative effects on Norway’s main trading partners are assumed to be moderate. Norges Bank’s estimates are close to those of other forecasters, which may suggest that they have made broadly similar assessments.
To the extent that oil price increases matter less than they used to, this may partly be due to a decline in energy intensity; ie the consumption of energy products accounts for a diminishing share of GDP. While total US energy consumption in 2025 was just below 2005 levels (Chart A), GDP was almost 50% higher. In the EU, total energy consumption has declined by almost 20% over the course of 20 years, while GDP has increased by more than 30%.
PWh4

As regards the US, it is also important that the country has transitioned from being a relatively large energy importer to becoming a net exporter. As a result of technological breakthroughs in the extraction of shale oil and gas, US crude oil production has almost tripled over the course of 20 years, while natural gas production has more than doubled.
Consequently, a current rise in oil prices will therefore raise the overall US income level, but the higher income will accrue to a minority of firms and households. For a large majority, costs will rise, which could contribute to a continued net negative effect on GDP. On the other hand, if oil companies increase investment substantially and oil production increases over time, the current higher oil prices could then as a whole boost US GDP.
EU countries remain highly dependent on energy imports and therefore become poorer overall when energy prices increase. In 2024, as much as 57% of the EU’s energy consumption was imported, and the import share was somewhat higher than in the 2000s. Renewable energy production has more than doubled over 20 years, but overall EU energy production has nevertheless declined. Coal and natural gas production has declined markedly, and there has also been a decline in nuclear power production.
To shed light on how oil prices affect the economy, Norges Bank has conducted a new empirical analysis.5 In the analysis, the fact that oil prices are also affected by economic developments is taken into account. Some price increases are due to substantial increases in demand – for example as a result of strong economic growth in some countries – but such increases will have different effects than if driven by a decline in oil supply. In this context, the analysis seeks to uncover the effects of the latter.
In the previously mentioned study from 2021, Känzig exploits the fact that surprising OPEC production announcements quickly materialise in oil futures prices. Based on price changes around OPEC meetings, Känzig then estimates the effects of these oil supply shocks. In principle, this approach should provide an answer to the question of to what extent changes in oil supply cause changes in other economic variables.
The analysis uses the same shocks as in the Känzig study but expanded to include 2025 and more countries. Chart B shows the estimated GDP change over time when oil prices increase by 10% in the near term. When using data from 1978 through 2025, the results are close to what Känzig finds for the US, and the effects in the euro area, UK and Sweden are broadly similar.
Percent6

If the estimation commences in 2000, the effects become substantially smaller, and not all of them are significantly different from zero. If this largely reflects a decline in energy intensity, the current effects may also be less pronounced than these estimates suggest. As already mentioned, energy intensity has declined further in the period since 2000.
For Norwegian mainland GDP, the estimated effect of higher oil prices is close to zero in both of these periods. In the near term, the purchasing power of many households and firms will erode, as in other countries, but a rise in oil prices also stimulates the Norwegian economy. More investment projects on the Norwegian continental shelf will become profitable. This increases order volumes for mainland supplier firms and may contribute to stronger wage growth further out. In addition, oil company revenues will of course increase, but much of this accrues to the government through special taxation, and the fiscal rule for petroleum revenue spending means that most of these revenues are saved.
Higher oil prices push up consumer prices in all the countries examined. Underlying consumer prices, which exclude energy products, also increase, but by less and more gradually (Chart C).7 The effects in Norway are relatively modest. This may be due to oil price increases also generally strengthening the krone, which dampens inflation. In addition, the pass-through to fuel prices in Norway is also dampened by the relatively high level of indirect taxes on fuel.
Percent. 2002–20258

- 1 Hamilton, J. D. (2005) “Oil and the Macroeconomy”. Manuscript prepared for Palgrave Dictionary of Economics. University of California, San Diego.
- 2 Känzig, D. R. (2021) “The Macroeconomic Effects of Oil Supply News: Evidence from OPEC Announcements”. American Economic Review, 111(4). April, pp. 1092–1125.
- 3 See eg Bernanke, B. S., M. Gertler and M. Watson (1997) “Systematic Monetary Policy and the Effects of Oil Price Shocks”. Brookings Papers on Economic Activity, 28 (1), pp. 91–157. At the same time, more recent studies indicate that the dampening effect on GDP mainly reflects the oil price increase itself. See eg Hamilton, J. D. and A. M. Herrera (2004) “Oil Shocks and Aggregate Macroeconomic Behavior: The Role of Monetary Policy: Comment”. Journal of Money, Credit and Banking, 36 (2), April, pp. 265–286. See also Bjørnland, H. C., J. L. Cross and J. Hölz (2025) “Re-visiting the Relationship Between Oil Prices and Monetary Policy”. Norges Bank Working Paper 4/2025.
- 4 The bars in the chart show energy consumption by source. The bars for net exports also include stock changes and other adjustments. The lines show overall domestic energy production. The EU data are from Eurostat back to 1990 and are spliced with data from Our World in Data prior to that.
- 5 The results of this analysis have previously been discussed in Mæhlum, M. (2026) "Hvordan påvirker høyere oljepris inflasjonen i Norge" (How do higher oil prices affect inflation in Norway). Published on the Bankplassen blog on 21 April 2026 (in Norwegian only) The method is described in more detail in Norges Bank (2026) “Documentation of Method in Bankplassen Blog Post "Hvordan påvirker høyere oljepris inflasjonen i Norge?”. Documentation Note 1/2026.
- 6 The empirical analysis is based on quarterly data. The chart shows annual averages of the results – both for the point estimates and the confidence intervals. The chart shows the estimated impact on the level of GDP.
- 7 In the US, the UK and the euro area, food prices are also excluded from underlying consumer prices.
- 8 The empirical analysis is based on monthly data. The chart shows annual averages of the results – both for the point estimates and the confidence intervals. The charts shows the estimated impact on the level of consumer prices.
50 years of price micro data: How do firms adjust prices?
Inflation is a persistent rise in the general price level. Changes in overall inflation are the sum of changes in individual prices. A rise in inflation may reflect more price increases, fewer reductions or larger price changes. Aggregate inflation figures mask the heterogeneity of price-setting across firms, but new price micro data provide better insight into how individual firms’ decisions affect overall inflation. The data show that inflation fluctuations are largely driven by the frequency of price changes.
This box is based on the micro data underlying the consumer price index (CPI), collected by Statistics Norway.1 The underlying data comprise millions of price observations reported by a representative sample of Norwegian firms in the period between 1975 and 2024. The observations cover high-inflation periods such as the 1980s and recent years, as well as many years of low and stable inflation. These prices are primarily for non-food and non-energy products, as well as for services excluding rent. The sample includes individual prices such as “Main course of the day (excl. starter and/or dessert)” and “Electric kettle (1.2 litres)” (See Chart D). Coverage accounts for an approximate average of 35% of the CPI over the period.
Prices in NOK2
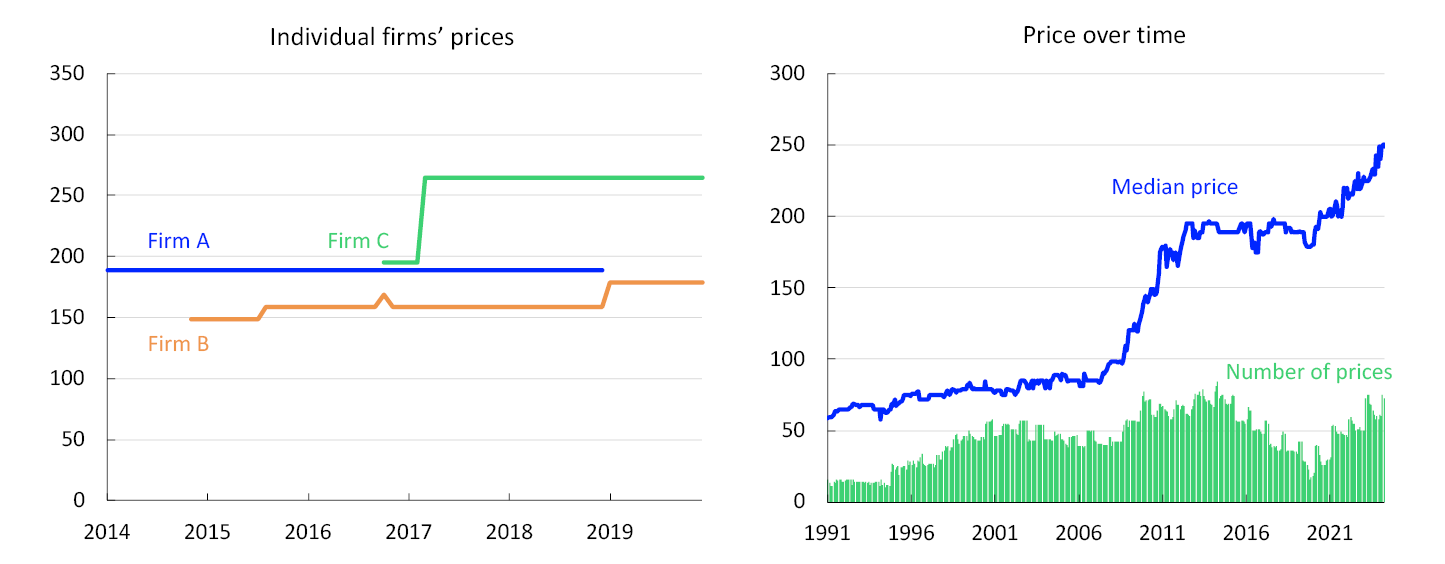
The micro data enable price change analyses along two dimensions: frequency and size. Chart E, left panel, shows the share of prices that are changed from one month to the next in the period between 2018 and 2024. On average, around 2% of prices are lowered and around 4% are raised every month. When inflation rose as the pandemic waned, the frequency of price increases also increased substantially, while the share of price reductions remained stable. On the other hand, the size of individual price changes was fairly stable throughout the period (Chart E, right panel). This implies that the period of high inflation primarily reflected more frequent rather than larger individual price changes.
Seven-month centred moving average. 2018–20243
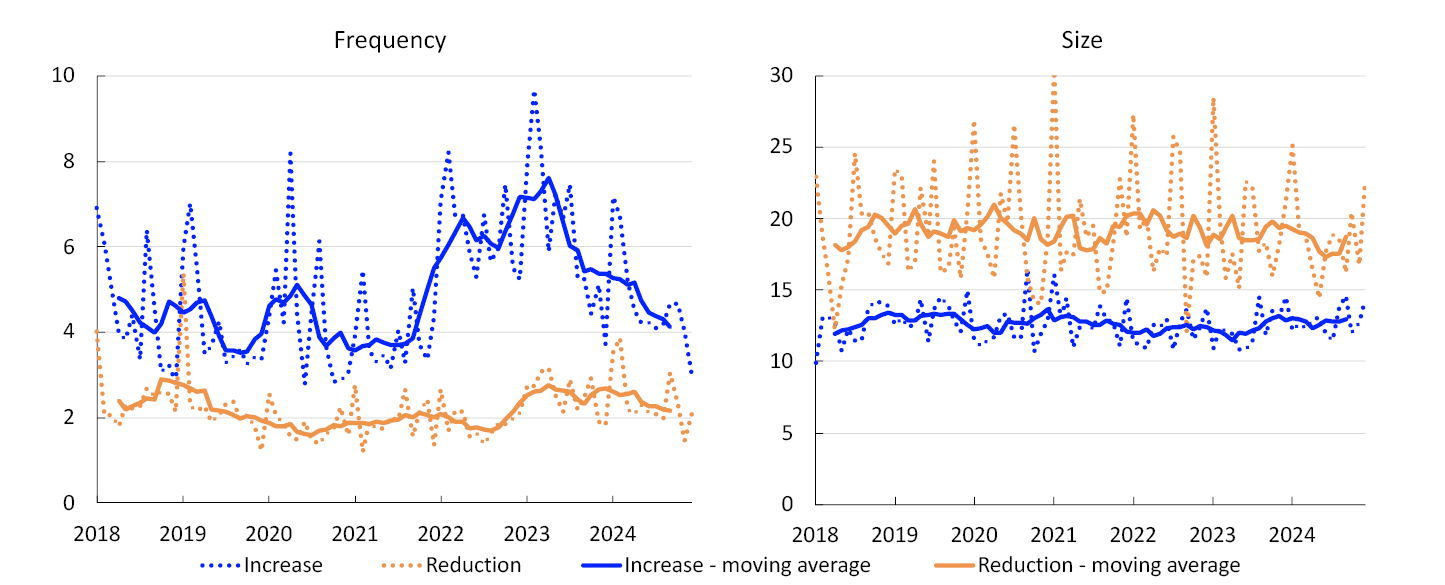
There are also signs that inflation fluctuations were driven more by frequency than size in previous high-inflation periods. The high inflation of the 1980s was primarily the result of frequent price increases (Chart F, left panel).4 This likely reflects the fact that firms often wish to adjust their prices when faced with changes in demand, costs or competition conditions. When the economy is affected by broad cost or demand shocks, more prices will deviate from firms’ desired levels, and the share of prices that are adjusted will increase.
Earlier research on price data from Norway and other countries also finds that the frequency of price changes co-varies with inflation.5 This is also consistent with newer findings from European and US studies of price-setting behaviour during the high-inflation period after the pandemic.6 At the same time, there is some heterogeneity in terms of both frequency and size across countries and across types of goods and services.
Access to new technology and digitalisation have likely made it less costly for firms to adjust prices now than before. Over the entire 50-year period, the micro data nevertheless indicate that firms now adjust prices less frequently (Chart F, left panel). At the same time, once prices are changed, adjustments tend to be greater (Chart F, right panel). When firms choose to adjust prices, the changes are therefore more likely to be substantial.
Annual average. 1975–20247
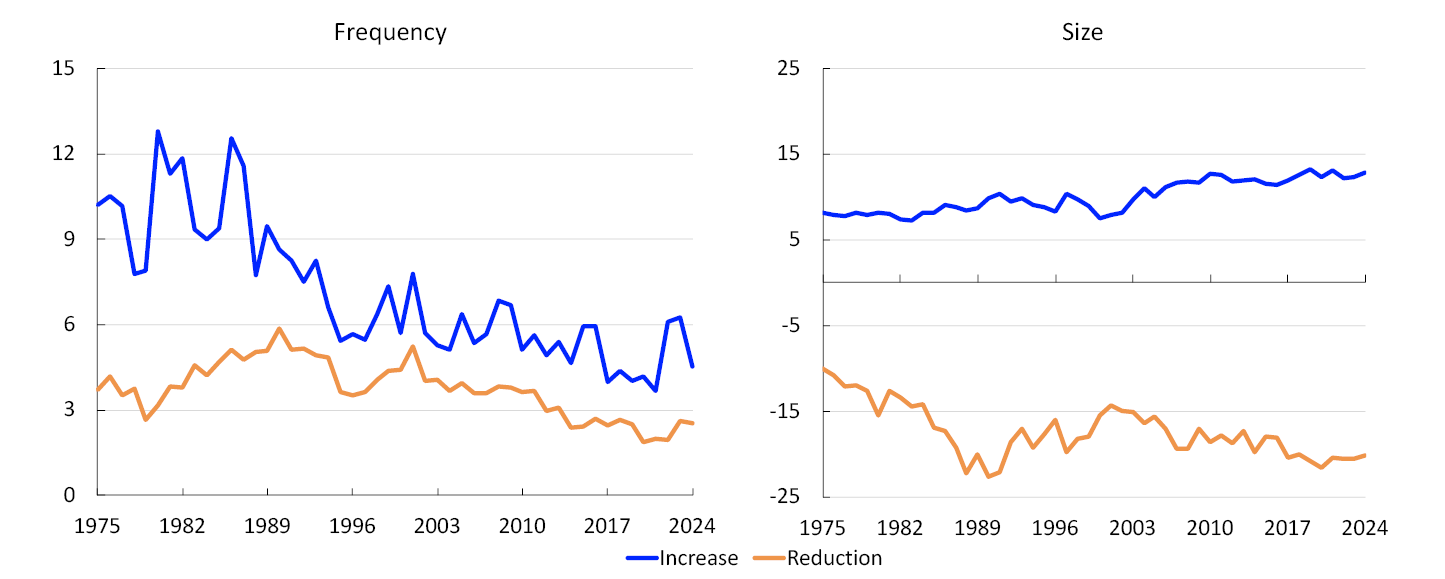
One possible explanation is that there are costs associated with adjusting prices, eg related to gathering information, decision-making or implementing the price change itself, and that firms now choose to incur these costs less frequently. In the 1970s and 1980s, when inflation was high and volatile, firms had to continuously reassess their prices. Following the introduction of the inflation targeting regime, inflation remained low and stable for many years. This may have encouraged firms to make less frequent, albeit larger, price adjustments.
While the median size of price changes has increased, so too has the dispersion in the size of price adjustments across firms. Chart G shows the dispersion in firms’ monthly price adjustments in different decades. The chart shows the percentage change and includes both price increases and reductions. For all decades, the distribution has a peak of around 2–5%, showing that when firms decide to adjust prices, many firms do so by broadly similar amounts. At the same time, the dispersion has widened: While price adjustments in the first decades were more tightly clustered around the peak, the distribution has broadened since 2000.
Price-change dispersion by decade8
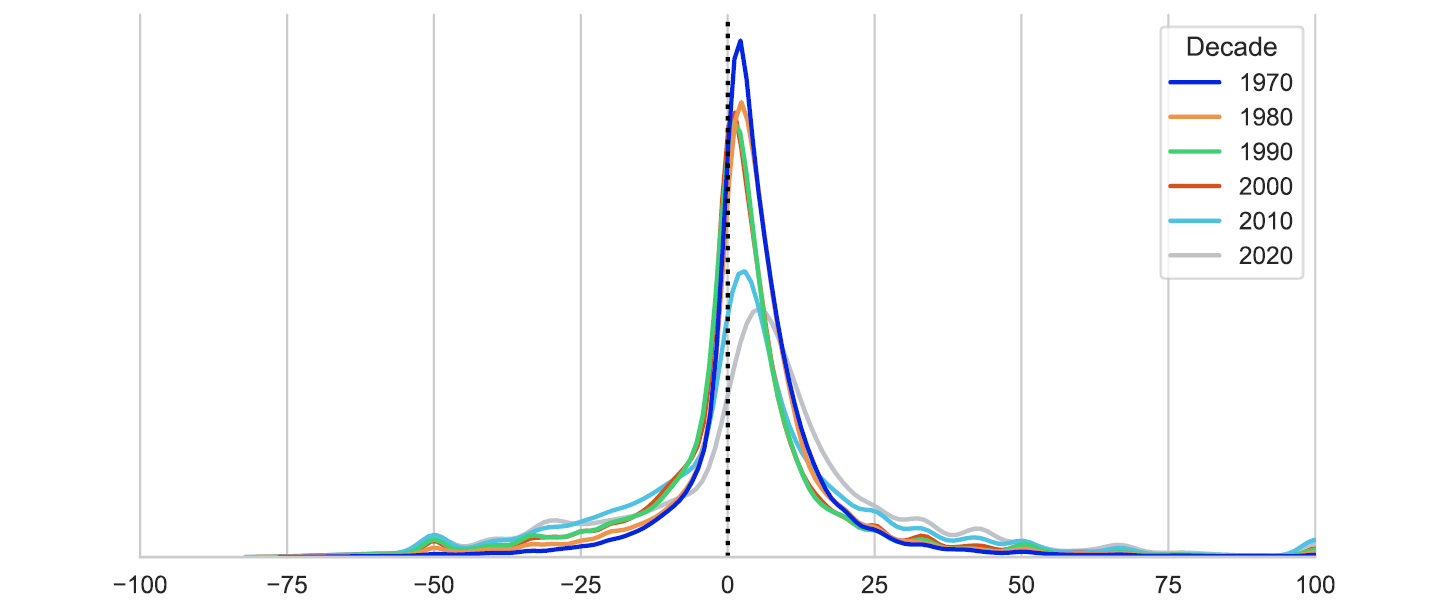
The widening of the distributions over time may reflect changes in the type of shocks affecting firms’ costs and demand. In the 1970s and 1980s, broad-based supply and demand shocks likely affected many firms similarly, leading to more uniform price adjustments. In the decades preceding the pandemic, product-specific shocks have likely become more important drivers of price changes.9 This may contribute to larger variation in costs, and in the need to adjust prices, for each individual firm.
- 1 For further details on the underlying data, calculation methods and robustness checks, see Brubakk, L., K. Mjølnerød, E. S. Njølstad and S. Seland (2026), Norges Bank Working Paper (forthcoming).
- 2 The median among firms that have reported prices during the month in question.
- 3 In the left panel, “increase/reduction” refer to the average share of prices that have been increased/reduced since the previous month. In the right panel, “increase/reduction” refer to the average price increase/reduction in preceding months among firms that have adjusted prices.
- 4 In Chart F, COICOP 7 Transport is excluded throughout the period owing to substantial changes in the group sample over time.
- 5 See Wulfsberg, F. (2016) "Inflation and Price Adjustments: Micro Evidence from Norwegian Consumer Prices 1975–2004". American Economic Journal: Macroeconomics, 8 (3), July, pp. 175–94 for a study of Norwegian price micro data and Gautier, E. et. al. (2024) "New Facts on Consumer Price Rigidity in the Euro Area". American Economic Journal: Macroeconomics, 16 (4), October, pp. 386–431 for comparisons of both frequency of change and size in the US, the euro area as a whole and individual countries within the euro area.
- 6 See Gautier, E. et al. (2026) "Consumer Price Stickiness in the Euro Area During an Inflation Surge". ECB Working Paper No 3181 for a study of European data, and Montag, H. and D. Villar (2023). "Price-Setting During the Covid Era". FEDS Notes for a study on US data.
- 7 In the left panel, “increase/reduction” refer to the average share of prices that have been increaced/reduced since the previous month. In the right panel, “increase/reduction” refer to the average price increase/reduction in preceding months among firms that have adjusted prices.
- 8 The dispersion shows the change from the preceding month among the firms that have adjusted prices.
- 9 For example Borio, C., P. Disyatat, D. Xia and E. Zakrajšek (2021) "Monetary policy, relative prices and inflation control: flexibility born out of success". BIS Quarterly Review, September find that US inflation in the period leading up to the pandemic was driven to a greater extent by sector-specific price changes, with the common component of inflation becoming less important over time.
Monetary policy’s effect on inflation
Monetary policy affects inflation through a number of channels. When the policy rate is raised, borrowing costs for households and firms rise and it becomes more attractive to save. This dampens demand in the economy and leads to lower wage and price inflation. A fall in prices for homes and other assets may amplify the decline in consumption and investment. In addition, a higher policy rate level in Norway will typically lead to a stronger krone, which results in lower imported goods inflation and dampens demand for Norwegian goods. Monetary policy can also affect inflation through inflation expectations. If households, firms and the social partners expect lower inflation owing to a policy rate hike, this alone can immediately contribute to lower wage and price inflation. This channel is likely to be particularly important if interest rates are expected to remain higher for a long time ahead. On the other hand, some firms may pass higher borrowing costs on to selling prices, which in isolation can stoke inflation.
Knowledge about the channels through which monetary policy affects the economy strengthens understanding of how the policy rate affects inflation. For example, previous research has found that both investment and consumption decline as a result of a higher policy rate, partly reflecting higher interest rate payments, and that lower demand leads to a decline in inflation.1 Analyses of Norwegian data also find that a higher policy rate strengthens the krone exchange rate and that a stronger exchange rate results in lower imported prices.
How policy rate changes affect inflation can also be studied more directly. A challenge is then that the policy rate and inflation often move in the same direction, reflecting the fact that central banks often raise policy rates when inflation is high or rising. In such cases, a higher policy rate will affect the economy but may nevertheless initially appear to have no effect or to even push inflation higher. It is therefore important to distinguish the effect of monetary policy from the conditions to which monetary policy responds. If the policy rate is raised in response to higher inflation, the question is how much higher inflation would have been ahead if the central bank had not raised the rate.
In approaching this question, researchers examine policy rate changes that were not anticipated by financial markets. Such policy rate surprises can be measured as changes in market rates within a narrow window around the publication of the policy rate decision. Researchers can then examine how the economy and inflation evolve following such rate surprises and thereby estimate how monetary policy affects inflation. The method is well established in the international research literature, and previous studies from other countries show that higher policy rates lead to lower inflation.2
A new study by Aastveit and Maffei-Faccioli uses this method to estimate how the policy rate affects inflation in Norway.3 The study is based on data from the period between 2001 and 2025. Chart H, left panel, shows how an unexpected policy rate hike affects the money market rate in the months following a monetary policy meeting. The shaded areas show 68% and 90% confidence intervals. The policy rate surprise is normalised so that the money market rate increases by 0.25 percentage point in the first month. Thereafter, the money market rate remains higher for about one year after the policy rate surprise. Chart H, right panel, shows how underlying inflation, measured as the 12-month change in the consumer price index adjusted for tax changes and excluding energy products (CPI-ATE), responds to the rate hike. Inflation declines and is approximately 0.3 percentage point lower after one year and 0.2 percentage point lower after two years. As the model is linear, if the policy rate is increased so that the money market rate rises by 0.5 percentage point, inflation will be 0.6 percentage point lower one year ahead compared with a situation where the rate had not been raised. A policy rate reduction will lead to a corresponding increase in inflation. Statistically, these effects differ significantly from zero, but as shown by the confidence intervals, the extent of the decline in inflation is highly uncertain.
Effect of a monetary policy shock on interest rates (6-month NIBOR) and underlying inflation (CPI-ATE). Percent4
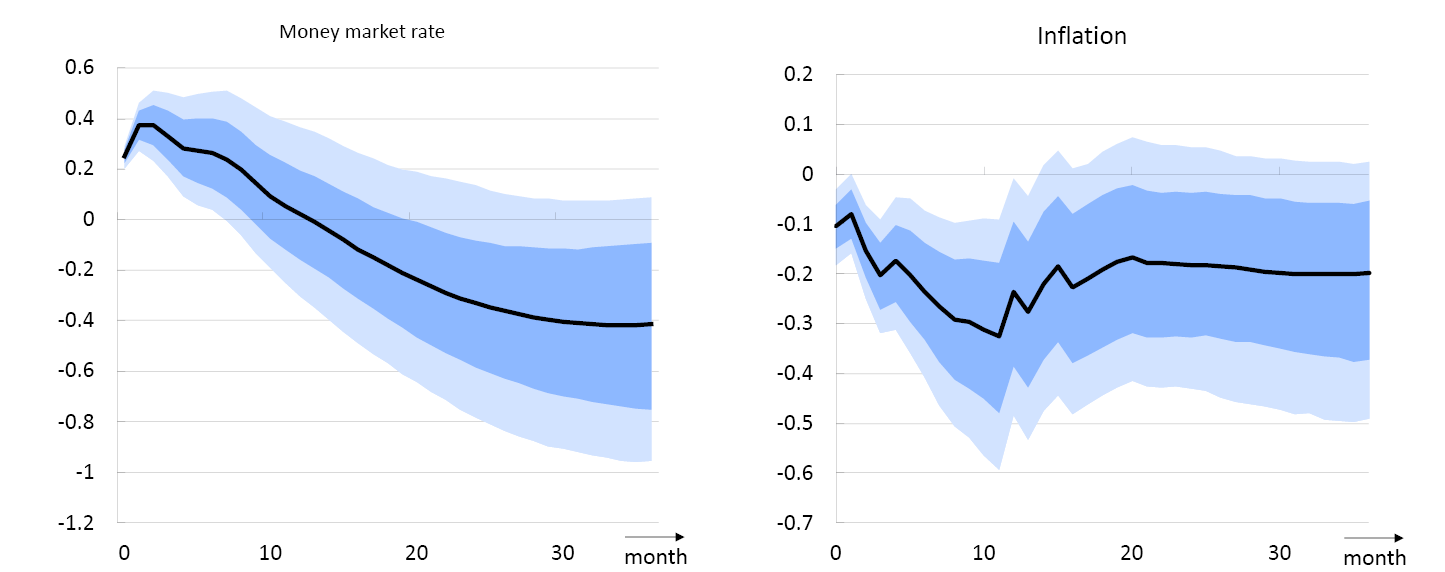
Chart I shows how the krone exchange rate and imported inflation respond to the policy rate hike. In line with previous research, the krone appreciates immediately (see box: “The effect of monetary policy on the krone exchange rate” in Monetary Policy Report 1/2025). A stronger krone reduces imported goods prices in NOK terms and dampens imported inflation markedly (see Chart I, right panel). As a relatively large share of consumer goods in Norway is imported, lower imported inflation contributes to a marked decline in overall inflation. The role of the exchange rate in bringing down inflation when the policy rate rises is in line with research from other countries. The rapid decline in imported inflation explains why underlying inflation falls as early as in the first months following the policy rate hike.
Effect of a monetary policy shock on the krone exchange rate (I-44) and imported inflation. Percent5
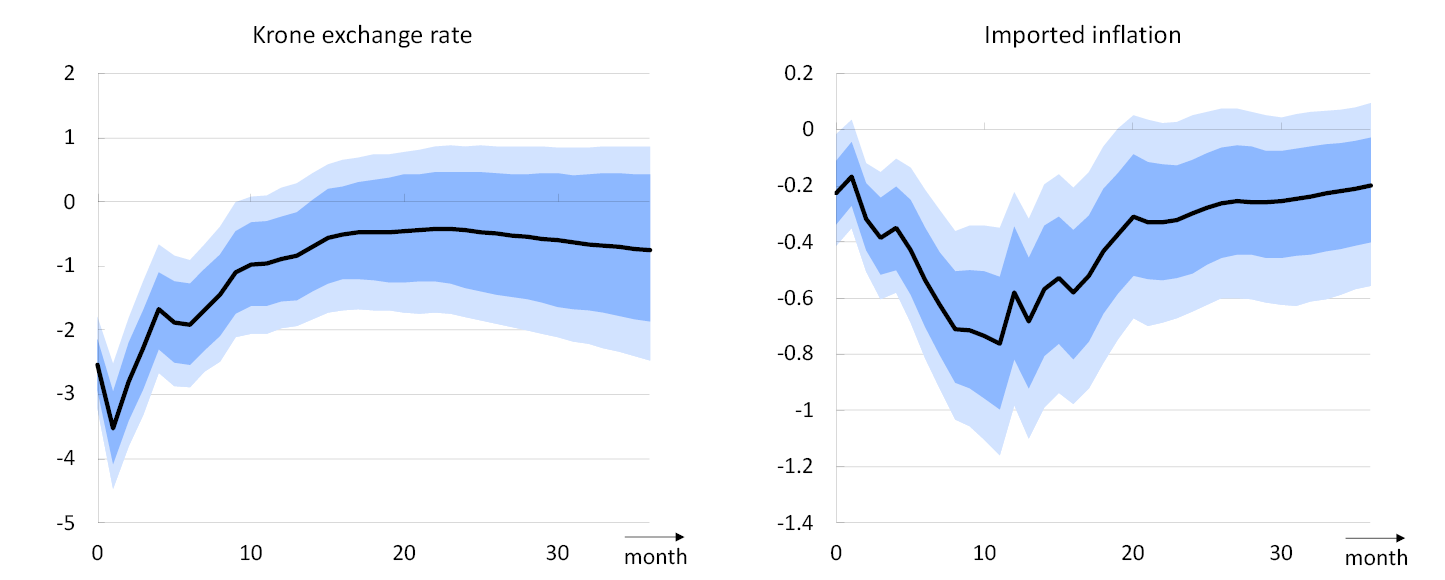
Domestic inflation responds more gradually. The analysis shows that a higher policy rate pushes down aggregate demand in the economy over time. GDP falls, unemployment rises and prices for both homes and equities decline. Lower economic activity gradually leads to lower domestic wage and price inflation. In addition, a stronger krone may push down imported intermediate goods inflation. Chart J, left panel, shows that domestic inflation declines as a result of higher policy rates, while Chart J, right panel, shows that the rent component of the consumer price index increases somewhat in the near term, likely because higher interest rates lead to higher borrowing costs for landlords. If both actual and imputed rents are excluded, the estimated effect on inflation becomes somewhat larger.
Effect of a monetary policy shock on domestic inflation and the rent component in CPI-ATE. Percent6
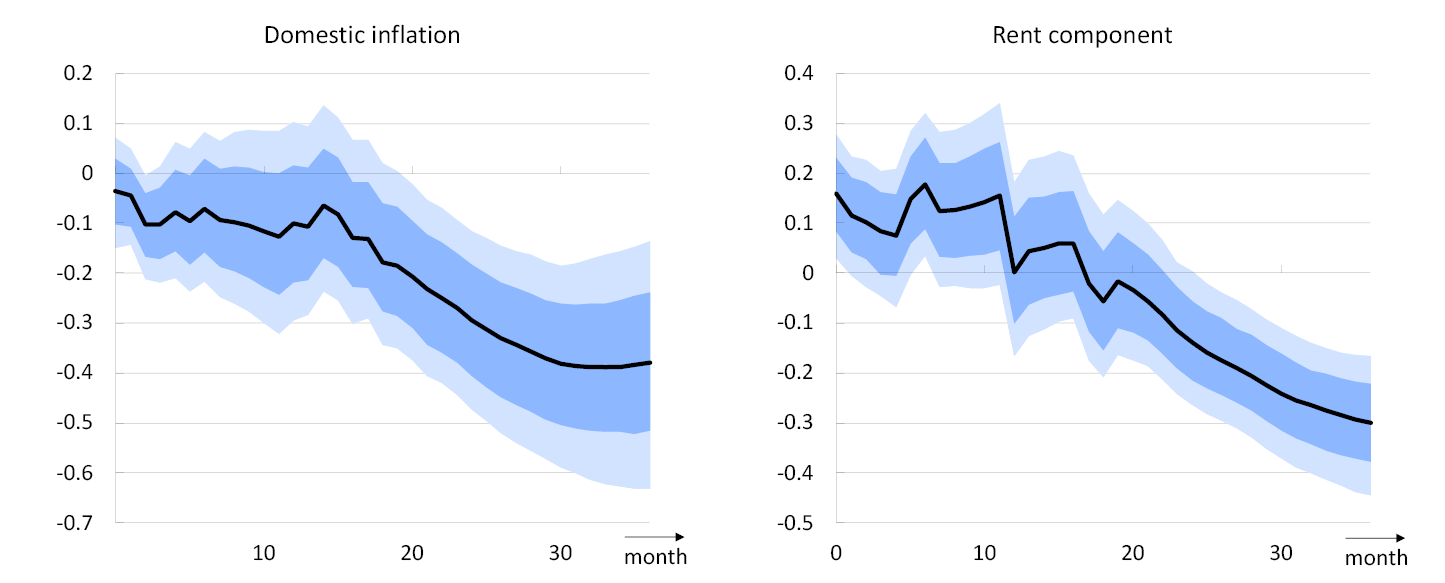
In line with previous research, the results from Aastveit and Maffei-Faccioli show that a higher policy rate dampens inflation in Norway. However, the strength of this effect is highly uncertain. An important reason for this is that the policy rate changes that surprise the market account for a small share of the total variation in policy rates. These changes therefore explain a small share of inflation volatility, which may contribute to large differences between studies that apply different methods or examine different time periods. For example, Bauer and Swanson find that the estimated effect of the policy rate on inflation in the US varies substantially depending on the monetary policy surprises applied.7
The estimated effect on inflation presented in Chart H is stronger than in some previous studies based on Norwegian data. Compared with Holm and Seland (2025), Aastveit and Maffei-Faccioli estimate a decline in the price level after two years that is two to five times larger when the monetary policy shock is scaled to the same magnitude.8 This difference may partly reflect the fact that the authors use data for different time periods. Bergholt and co-authors (2026) examine the same period as Aastveit and Maffei-Faccioli and find a fairly similar effect on inflation using a different method.9 Since the policy rate path differs between the three studies, it is nevertheless difficult to compare the effects directly.
The effect shown in Chart H is also somewhat stronger than in Norges Bank’s main model, NEMO, which is estimated on Norwegian data. However, comparisons between empirical estimates and structural model results are not straightforward. When market rates increase upon publication of a monetary policy decision, this may either reflect slightly earlier than expected policy rate hikes or the fact that market participants now expect a more restrictive long-term monetary policy stance. The latter type of movement is likely to have a particularly strong effect on inflation, but such movements are to a limited extent captured by a temporary monetary policy shock in NEMO. On the other hand, if rate hikes are perceived by model agents as more persistent or as a signal that monetary policy systematically responds more forcefully to high inflation than before, the effect on inflation in the model would also become more pronounced. In NEMO, such changes are better captured by systematically changing the reaction pattern in monetary policy, for example by changing the parameter values in the monetary policy rule GEORG.10
The research presented in this box further increases Norges Bank’s understanding of how monetary policy affects the economy. The effects underlying Norges Bank’s projections and models are, however, not based on individual studies but on an overall assessment of available research and the monetary policy transmission channels.
- 1 Bowe, F., L. Brubakk, R. Juelsrud, S. S. Meyer, E. Njølstad and M. Åstebøl (2025) “The Interest Sensitivity of Consumption and Investment: Evidence from Norway”. Staff Memo 1/2025. Norges Bank shows that both consumption and investment fall as a result of a higher policy rate. Ahn, S., S. M. Galaasen and M. Mæhlum (2024) “The Cash-Flow Channel of Monetary Policy – Evidence from Billions of Transactions”. Norges Bank Working Paper 20/2024 finds that household consumption falls as a result of higher interest rate payments. Brubakk, L., K. Hagelund and E. Husabø (2018) “The Phillips curve and beyond - Why has wage growth been so low?” Staff Memo 10/2018. Norges Bank estimates the Phillips curve for wage growth based on Norwegian data. See also box “The role of expectations in price formation” in Monetary Policy Report 1/2026. Mæhlum, M. (2025) “Monetary Policy and the Exchange Rate in Norway”. Staff Memo 3/2025. Norges Bank shows that a higher policy rate results in a stronger krone exchange rate, while the box “A weaker krone exchange rate pushes up inflation – but by how much?” in Monetary Policy Report 3/2024 presents analyses of how the krone exchange rate affects inflation.
- 2 See eg Gertler, M. and P. Karadi (2015) "Monetary Policy Surprises, Credit Costs, and Economic Activity". American Economic Journal: Macroeconomics, 7 (1), January, pp. 44-76.
- 3 See Aastveit, K. A. and N. Maffei-Faccioli (2026) “How Does Monetary Policy Affect Inflation in Norway?". Norges Bank Working Paper 5/2026. The analysis is based on a proxy SVAR model where monetary policy shocks are identified using changes in the two-year swap rate within a 30-minute window around the publication of the policy rate decision.
- 4 Estimated effect of a monetary policy shock in a proxy SVAR model. The shock is measured as the change in the two-year swap rate with six-month NIBOR as the reference rate within a 30-minute window around the publication of the policy rate decision. The shaded areas indicate 68% and 90% confidence intervals. Inflation is measured as the 12-month change in the logarithm of the CPI-ATE.
- 5 Estimated effect of a monetary policy shock in a proxy SVAR model. The shock is measured as the change in the two-year swap rate with six-month NIBOR as the reference rate within a 30-minute window around the publication of the policy rate decision. The shaded areas indicate 68% and 90% confidence intervals. Inflation is measured as the 12-month change in the logarithm of the CPI-ATE. A lower value of the import-weighted exchange rate index I44 implies a stronger krone exchange rate.
- 6 Estimated effect of a monetary policy shock in a proxy SVAR model. The shock is measured as the change in the two-year swap rate with six-month NIBOR as the reference rate within a 30-minute window around the publication of the policy rate decision. The shaded areas indicate 68% and 90% confidence intervals. Inflation is measured as the 12-month change in the logarithm of the CPI-ATE.
- 7 See Bauer, M. D. and E. T. Swanson (2023) "A Reassessment of Monetary Policy Surprises and High-Frequency Identification". NBER Macroeconomics Annual, 37, pp. 87-155.
- 8 See Holm, M. and S. Seland (2025) “Monetary Transmission to Prices: Disaggregated Evidence from Norway". Unpublished manuscript. This study is based on previous work by Holm, M., P. Paul and A. Tischbirek (2021) "The Transmission of Monetary Policy under the Microscope". Journal of Political Economy, 129 (10), October, pp. 2861-2904. Compared with this study, the effect is approximately twice as pronounced in Aastveit and Maffei-Faccioli when the monetary policy shock is normalised so that the rate rises by the same amount in the first month, but five times as pronounced when comparing shocks that push up the rate by the same amount in the first year on average. The difference reflects the differences in the effect on the policy rate path in the two studies.
- 9 See Bergholt, D., I. N. Friis, F. Furlanetto, K. Matsen and Ø. Robstad (2026) “Demand Shocks During the Post-Pandemic Inflation Surge: An International Perspective". Journal of International Economics, forthcoming.
- 10 GEORG is discussed in the box “A monetary policy rule for understanding changes in the policy rate path” in Monetary Policy Report 4/2025.
Estimates of the neutral real interest rate
The neutral rate is assessed to be in the interval between 2.25% and 3.75%. The neutral rate, or normal rate, is the level the policy rate is expected to approach somewhat further ahead. This is also the rate that is consistent with output at its potential level and inflation at target over time. Subtracting the 2% inflation target from the neutral rate provides an estimate of the neutral real interest rate.
A number of indicators are used in estimating the neutral rate. One source of information is a portfolio of models for the neutral rate.1 The average estimate from the model portfolio is shown in Chart K. The blue bands represent the overall uncertainty in the models. The models and the other indicators are described in more detail in a documentation note.2
Nominal policy rate3
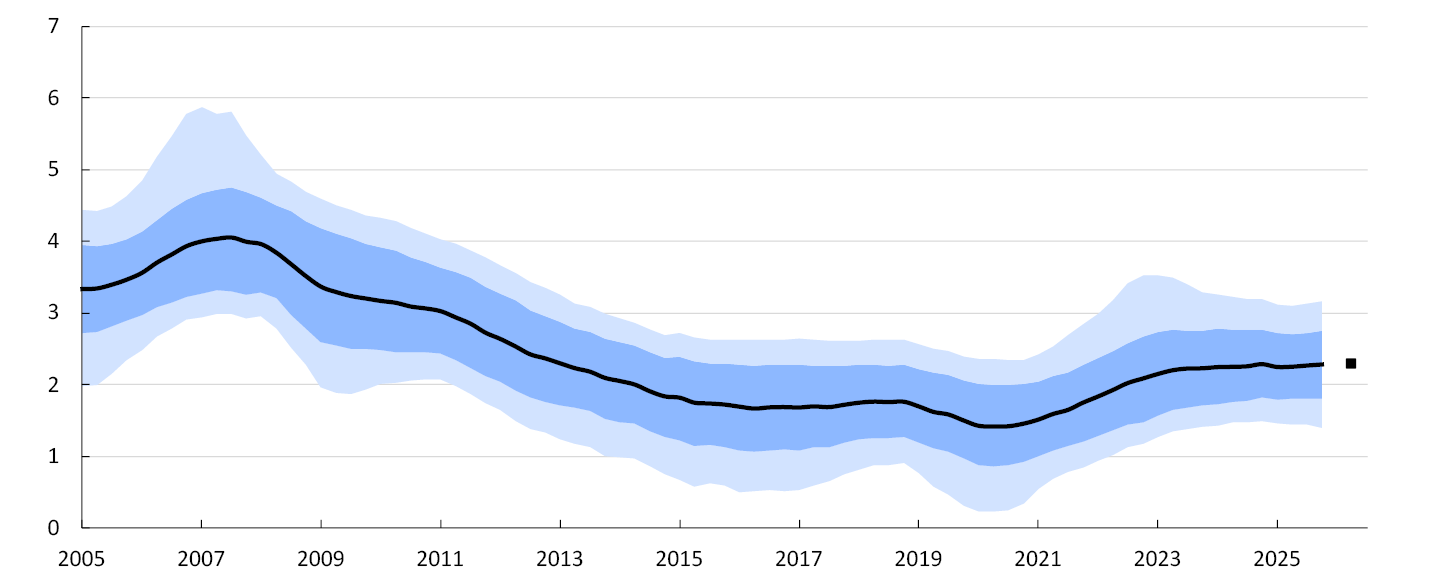
The average from the models has risen since the low point in 2020 but remains appreciably below the levels from before the financial crisis. In Chart K, the point to the right in 2026 indicates the average estimate for 2026 Q2.
Norway is a small open economy and there is therefore reason to assume that developments in the neutral rate in Norway will not differ substantially over time from developments abroad. Consequently, Norges Bank also monitors how other central banks estimate neutral rates. In recent years, a number of central banks have communicated that the neutral rate has likely risen again since 2020. Communication about the neutral rate varies across central banks, and their estimates are therefore not necessarily directly comparable. Chart L shows the intervals that represent Norges Bank’s interpretation of a sample of central banks’ published analyses and communication. An import-weighted average of these provides an interval for the neutral rates among trading partners of between 1.8% and 3.0%.
Percent4
In addition to indicators from models and other central banks, market-based indicators are also examined. Relevant market indicators are market rates somewhat further ahead, both in Norway and among trading partners.
One such indicator is the one-year rate four years ahead (1Y4Y), as interpreted from the overnight index swap market. It indicates the interest rate level priced in by the market just beyond Norges Bank’s forecast horizon. Market rates do not necessarily reflect market-implied policy rate expectations alone. They can also reflect term premiums, which partly compensate investors for bearing interest rate risk. In addition, it is conceivable that market-implied policy rates reflect the fact that the economy has not completely regained its balance, even at four and five-year horizons. To arrive at an indicator for the neutral rate based on market pricing, market rates are adjusted for term premiums and inflation expectations beyond the inflation target.
Historically, the interest rate level in Norway has been somewhat higher than among trading partners. In the model framework, this is viewed as a permanent NOK risk premium. Looking ahead, the differential is assumed to be around 0.5 percentage point, in line with the average from the past decade. The trading partner market indicator has therefore been revised up by 0.5 percentage point to function as an indicator for the Norwegian neutral rate. The same adjustment is made for the interval among trading partners from Chart L before inclusion in Chart M.
Percent5
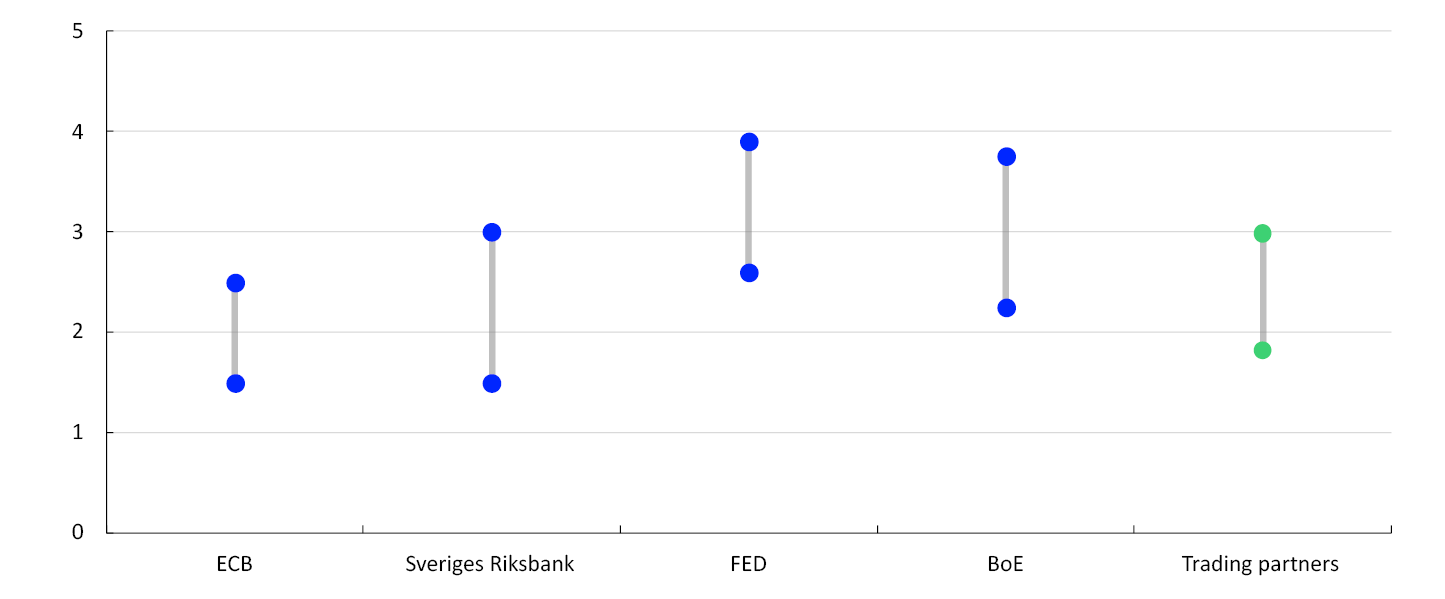
Chart M summarises the different indicators monitored and shows Norges Bank’s neutral rate estimate. The average of the estimates from the model portfolio is 2.3%. The market-based indicators are somewhat higher, at 2.9% and 3.0%, and the interval from other central banks is unchanged between 2.3% and 3.5%.
Percent6
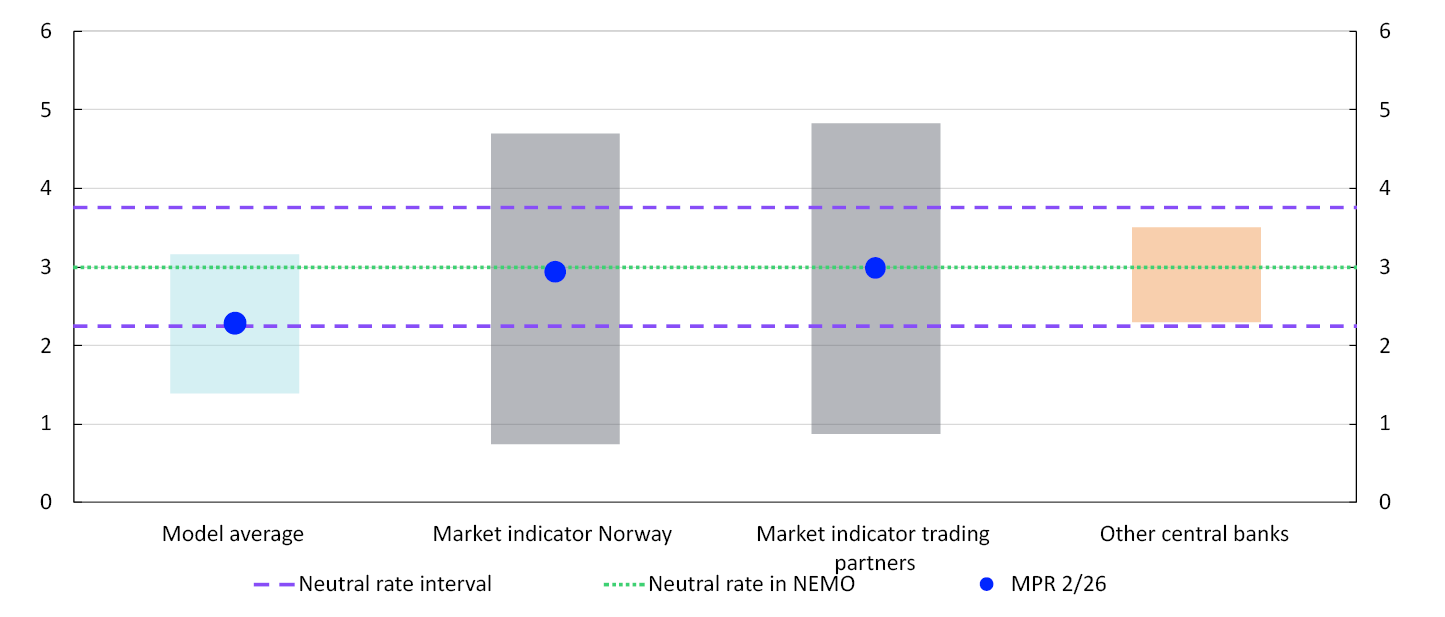
Chart M also shows uncertainty intervals around the different indicators. The uncertainty interval for the model portfolio ranges between 1.4% and 3.2%. The uncertainty intervals around the market-based estimates are calculated based on option pricing in US fixed-income markets.7 These intervals will also reflect uncertainty surrounding both the neutral rate and economic conditions four years ahead.
The purple lines in Chart M indicate the neutral rate’s estimated interval. In Monetary Policy Report 2/2025, the neutral rate was estimated to lie between 2.25% and 3.5%. In 2026, indicators and uncertainty intervals have been updated for both Norges Bank’s model suite and market-based measures. Based on these indicators and uncertainty intervals, the neutral rate is assessed to range between 2.25% and 3.75%.
There has to be a point forecast in the NEMO core model and the GEORG interest rate rule for the neutral rate.8 In this Report, the point forecast is assumed to be 3.0% (green line in Chart M). This assumption will be reassessed quarterly based on the indicators presented above and the reassessment continually documented in the Bank’s Monetary Policy Reports.
- 1 See Almlid, E. and S. Asshoff (2025) "Estimating the Neutral Rate of Interest in Norway". Staff Memo 8/2025. Norges Bank.
- 2 See Documentation Note 2/26 "Indicators for the neutral rate" (to be published on Friday 19 June).
- 3 Model-based estimates and uncertainty intervals for the neutral rate
- 4 The blue dots represent the communicated intervals for the neutral rate among our four selected trading partners. The green dots represent an import-weighted average interval for the four trading partners combined.
- 5 The blue dots represent the communicated intervals for the neutral rate among our four selected trading partners. The green dots represent an import-weighted average interval for the four trading partners combined.
- 6 Various indicators of the neutral rate. Purple lines indicate the interval we assume for the neutral rate. The green broken line is the level of the neutral rate assumed in NEMO.
- 7 Uncertainty intervals for the models and market indicators correspond to 95% confidence intervals.
- 8 See Staff Memo by Almlid, E., I. F. Haltia and Ø. Robstad (2025) "Mapping Optimal Policy Into a Rule in NEMO: GEORG". Staff Memo 15/2025. Norges Bank.
Annex
Detailed tables of projections
Table 1 International projections
|
Change from projections in Monetary Policy Report 1/2026 in parentheses |
Weights1 Percent |
Percentage change from previous year |
||||
|---|---|---|---|---|---|---|
|
2025 |
2026 |
2027 |
2028 |
2029 |
||
|
GDP |
||||||
|
US |
12 |
2.1 |
2 (-0.2) |
1.9 (0.1) |
2 (0.1) |
1.9 (0) |
|
Euro area |
47 |
1.5 |
0.5 (-0.4) |
1.2 (0.1) |
1.3 (-0.1) |
1.3 (-0.1) |
|
UK |
15 |
1.4 |
1.2 (0.5) |
1.2 (-0.2) |
1.6 (-0.1) |
1.6 (0) |
|
Sweden |
18 |
1.8 |
1.9 (-0.3) |
2.2 (0.1) |
2 (0) |
1.6 (0) |
|
China |
8 |
5 |
4.6 (-0.2) |
4.3 (0.1) |
4 (0.2) |
3.9 (0.2) |
|
5 trading partners1 |
100 |
1.9 |
1.4 (-0.1) |
1.7 (0.1) |
1.8 (0) |
1.7 (0) |
|
Prices |
||||||
|
CPI US |
2.7 |
3.6 |
2.6 |
2.3 |
2.3 |
|
|
HICP Euro area |
2.1 |
3.1 |
2.2 |
1.9 |
2.0 |
|
|
Underlying inflation2 |
2.6 |
2.3 (0.1) |
2.4 (0.2) |
2.3 (0.1) |
2.1 (0) |
|
|
Wage growth2 |
3.8 |
3.3 (-0.1) |
3.2 (0) |
3.2 (0) |
3.1 (0) |
|
|
Prices for consumer goods imported to Norway, including freight rates3 |
0.1 |
1.3 (0.7) |
2.1 (0.8) |
1.1 (0) |
1.2 (0) |
|
|
Prices for intermediate goods imported to Norway4 |
0.6 |
4.8 (1.8) |
3.5 (0.9) |
1.8 (0) |
1.9 (0) |
|
Table 2 Short-term estimates
Table 2a Consumer prices. Twelve-month change. Percent
|
2026 |
|||||||
|---|---|---|---|---|---|---|---|
|
Mar |
Apr |
May |
Jun |
Jul |
Aug |
Sep |
|
|
Consumer price index (CPI) |
|||||||
|
Actual |
3.6 |
3.4 |
3.1 |
||||
|
Projections MPR 1/26 |
3.5 |
3.7 |
3.3 |
3.6 |
|||
|
Projections MPR 2/26 |
3.2 |
3.1 |
3.0 |
3.2 |
|||
|
CPI-ATE |
|||||||
|
Actual |
3.0 |
3.2 |
3.4 |
||||
|
Projections MPR 1/26 |
3.0 |
3.2 |
3.3 |
3.3 |
|||
|
Projections MPR 2/26 |
3.3 |
3.3 |
3.3 |
3.4 |
|||
Sources: Statistics Norway and Norges Bank
Table 2b House prices. Monthly change. Seasonally adjusted. Percent
|
2026 |
|||||||
|---|---|---|---|---|---|---|---|
|
Mar |
Apr |
May |
Jun |
Jul |
Aug |
Sep |
|
|
Actual |
0.1 |
0.5 |
0.1 |
||||
|
Projections MPR 1/26 |
0.3 |
0.2 |
0.4 |
0.4 |
|||
|
Projections MPR 2/26 |
0.3 |
0.4 |
0.4 |
0.4 |
|||
Sources: Eiendomsverdi. Finn.no. Real Estate Norway and Norges Bank
Table 2c Registered unemployment (rate). Percent of labour force. Seasonally adjusted
|
2026 |
|||||||
|---|---|---|---|---|---|---|---|
|
Mar |
Apr |
May |
Jun |
Jul |
Aug |
Sep |
|
|
Actual |
2.1 |
2.1 |
2.1 |
||||
|
Projections MPR 1/26 |
2.0 |
2.0 |
2.0 |
2.0 |
|||
|
Projections MPR 2/26 |
2.1 |
2.1 |
2.1 |
2.1 |
|||
Sources: Nav and Norges Bank
Table 2d GDP for mainland Norway. Quarterly change.1 Seasonally adjusted. Percent
|
2025 |
2026 |
|||
|---|---|---|---|---|
|
Q4 |
Q1 |
Q2 |
Q3 |
|
|
Actual |
0.2 |
0.2 |
||
|
Projections MPR 1/26 |
0.4 |
0.4 |
||
|
Projections MPR 2/26 |
0.4 |
0.3 |
||
- 1 Quarterly figures based on monthly national accounts.
Sources: Statistics Norway and Norges Bank
Table 3 Projections of main economic aggregates
|
Change from projections in Monetary Policy Report 1/2026 in parentheses |
Percentage change from previous year (unless otherwise stated) |
|||||
|---|---|---|---|---|---|---|
|
Constant 2023 prices (NOK bn) 2024 |
2025 |
Projections |
||||
|
2026 |
2027 |
2028 |
2029 |
|||
|
Prices and wages |
||||||
|
CPI |
3.0 |
3.2 (-0.2) |
2.4 (0.1) |
2.1 (-0.1) |
2.1 (0.0) |
|
|
CPI-ATE |
3.1 |
3.2 (-0.1) |
2.8 (0.0) |
2.3 (0.1) |
2.1 (0.0) |
|
|
Annual wages |
4.9 |
4.5 (0.0) |
4.0 (0.1) |
3.6 (0.0) |
3.3 (-0.1) |
|
|
GDP deflator, mainland Norway |
3.3 |
3.9 (-0.1) |
3.8 (-0.1) |
3.4 (0.1) |
2.9 (0.0) |
|
|
Real economy1 |
||||||
|
Gross domestic product (GDP) |
5447 |
1.2 |
0.9 (-0.3) |
0.2 (-0.1) |
-0.4 (-0.1) |
-0.2 (0.0) |
|
GDP, mainland Norway2 |
4124 |
1.7 |
0.9 (-0.5) |
0.8 (-0.1) |
1.1 (-0.1) |
1.4 (0.0) |
|
Output gap, mainland Norway (level) |
0.1 |
-0.3 (-0.1) |
-0.9 (-0.1) |
-1.1 (-0.2) |
-0.9 (-0.2) |
|
|
Employment, persons, QNA |
0.7 |
0.5 (0.0) |
0.3 (-0.1) |
0.3 (-0.2) |
0.6 (-0.1) |
|
|
Registered unemployment (rate, level) |
2.1 |
2.1 (0.0) |
2.3 (0.0) |
2.4 (0.1) |
2.3 (0.0) |
|
|
Demand1 |
||||||
|
Mainland demand2 |
4294 |
2.0 |
1.6 (-0.9) |
2.1 (0.1) |
1.9 (0.0) |
2.0 (0.1) |
|
– Household consumption |
2199 |
2.7 |
1.6 (-0.3) |
1.8 (0.1) |
1.7 (0.0) |
1.8 (0.1) |
|
– Business investment |
469 |
2.7 |
2.6 (-2.5) |
2.6 (0.9) |
1.7 (0.1) |
2.3 (0.3) |
|
– Housing investment |
193 |
-3.6 |
-0.6 (-3.4) |
3.9 (-1.3) |
6.5 (-0.1) |
7.0 (0.6) |
|
– Public demand |
1434 |
1.4 |
1.5 (-1.0) |
2.2 (0.2) |
1.6 (0.0) |
1.5 (0.0) |
|
Petroleum investment2 |
262 |
7.2 |
-3.0 (-2.0) |
-5.0 (-2.0) |
-2.0 (2.0) |
1.0 (0.0) |
|
Mainland exports2 |
1188 |
5.8 |
1.9 (-0.2) |
1.3 (0.8) |
1.5 (0.0) |
2.0 (-0.1) |
|
Mainland imports2 |
1691 |
3.7 |
4.7 (1.8) |
2.5 (-0.3) |
2.7 (0.1) |
2.8 (0.2) |
|
House prices and debt |
||||||
|
House prices |
5.9 |
3.5 (-0.5) |
4.4 (-1.7) |
6.5 (-0.6) |
6.5 (0.4) |
|
|
Household credit (C2)3 |
4.7 |
4.7 (0.0) |
4.7 (0.0) |
4.6 (0.0) |
4.5 (0.0) |
|
|
Interest rates and exchange rate |
||||||
|
Policy rate (level) |
4.3 |
4.3 (0.1) |
4.4 (0.2) |
3.8 (0.1) |
3.4 (0.0) |
|
|
Import-weighted exchange rate (I-44) (level) |
119.6 |
113.2 (0.0) |
112.0 (-0.5) |
112.0 (-0.5) |
112.0 (-0.5) |
|
|
Policy rate, trading partners (level)4 |
2.8 |
2.6 (-0.1) |
3.0 (0.0) |
3.0 (0.0) |
3.0 (0.0) |
|
|
Household income and saving1 |
||||||
|
Real disposable income excl. dividend income |
3.3 |
2.3 (0.2) |
1.4 (-0.1) |
2.3 (0.0) |
2.2 (0.1) |
|
|
Fiscal policy |
||||||
|
Structural non-oil deficit as a percentage of GPFG5 |
2.6 |
2.7 (-0.1) |
2.8 (-0.1) |
2.8 (-0.1) |
2.8 (0.0) |
|
- 1 All figures are working-day adjusted.
- 2 Annual figures based on monthly national accounts.
- 3 Household credit is reported as four-quarter growth at the end of the year.
- 4 Overnight Index Swap.
- 5 Government Pension Fund Global measured at the beginning of the year.
Sources: Eiendomsverdi, Finn.no, LSEG Datastream, Ministry of Finance, Norwegian Labour and Welfare Administration (Nav), Real Estate Norway, Statistics Norway and Norges Bank