Financial stabilty assessment
The global economy is marked by uncertainty about future trade policies, and growth prospects abroad appear weaker. There is a higher risk of market turbulence and downturns that could weaken financial stability. However, Norges Bank’s Monetary Policy and Financial Stability Committee considers the Norwegian financial system to be robust. Banks in Norway are profitable and have liquidity and capital buffers that enable them to withstand considerable losses and financial market turbulence without having to tighten lending. In the face of heightened uncertainty, maintaining this resilience is important.
Heightened uncertainty
In recent years, the global economy and financial markets have been marked by pandemic, inflation and war. This has resulted in significant market volatility and substantial uncertainty, but the financial system has coped without contributing to an economic downturn. Considerable government measures have dampened the impact on the economy, while adaptations to higher capital requirements and improved risk management following the financial crisis have made the financial system more resilient to shocks.
After the US announced the introduction of considerable tariff increases, uncertainty indicators increased substantially, and there have been large price movements in financial markets. Oil prices fell, the krone depreciated and risk premiums rose. Market movements have largely been reversed, but uncertainty regarding global trade policies and persistent geopolitical tensions appear to have weakened the economic outlook internationally.
Even with a reversal of introduced and announced tariffs, the uncertainty generated regarding the framework for international economic relations will likely persist. This increases the risk of shocks that can be a source of both more difficult funding conditions and credit losses. Financial system vulnerabilities may amplify the effects.
Continued prospects for low bank losses
The high indebtedness of many households is a key vulnerability in the Norwegian financial system. High debt levels can amplify economic downturns because they can make the household sector vulnerable to interest rate increases or income losses. For some households, coping with higher interest rates has been difficult. However, default rates are low, partly reflecting high employment.
In recent years, debt has risen less than income. Such developments may reduce household vulnerability further out. If looser financial conditions result in rapidly rising house prices and debt, vulnerability could increase again.
Another key financial system vulnerability is banks’ high commercial real estate (CRE) exposure. Higher interest rates have weakened the profitability of CRE firms and real estate developers. While high employment and rental income growth have so far enabled most CRE firms to service higher interest expenses out of current earnings, the situation is more difficult for real estate developers. Norges Bank’s analyses indicate that corporate credit losses have increased somewhat, albeit from low levels.
Uncertainty surrounding global economic developments ahead is higher than normal. Extensive trade restrictions and heightened uncertainty could lead to a downturn abroad with spillover effects to the Norwegian economy. Firms’ earnings and debt-servicing capacity could then fall, and banks’ credit losses could increase. If employment were to decline markedly and rental income were to be appreciably lower than envisaged, many real estate firms could face debt-servicing problems. The direct effect of trade restrictions on bank losses is likely relatively modest as banks’ exposure to the largest export industries is moderate.
The cyber threat to the financial sector is increasing. Successful cyberattacks may disrupt financial institutions and impose significant costs on the sector. If cyberattacks impact critical functions or cause a broad-based loss of confidence, they could pose a threat to financial stability.
In the somewhat longer term, banks’ exposures to firms with substantial greenhouse gas emissions may represent a source of vulnerability. When these firms have to restructure, their debt-servicing capacity may be weakened. Natural disasters resulting from climate change must be expected to contribute to higher costs in the years ahead because considerable investment will be needed to prevent damage and because insurance premiums may increase markedly.
Banking sector resilience is strong and must be maintained
Current earnings and sound risk management are banks’ first line of defence against losses. This may be insufficient in the event of downturns or severe stand-alone incidents. Banks’ minimum capital requirements and buffer requirements are intended to cover unexpected losses. This results in increased resilience and constitutes banks’ second line of defence against losses. When there is heightened uncertainty, maintaining resilience is particularly important. Norges Bank provides advice on the systemic risk buffer (SyRB) rate and sets the countercyclical capital buffer (CCyB) rate based on an assessment of financial system vulnerabilities. On 7 May, the Monetary Policy and Financial Stability Committee decided to keep the CCyB rate unchanged at 2.5%.
The solvency stress test in this Report shows how banks as a whole can absorb large credit losses, while still maintaining lending if the buffer requirement is reduced. However, banks are different, and individual banks may need to tighten lending in response to a severe economic downturn. Moreover, all bank customers may experience reduced access to credit as a result of new credit risk assessments made in a downturn.
Banks’ liquidity positions are vulnerable to covered bond market turbulence
Bank’s fundamental business model entails liquidity risk, which may come to the fore during market turbulence and downturns. The liquidity stress test in this Report assumes a not very likely yet conceivable scenario and shows how banks as a whole hold sufficient liquidity reserves to weather an extended period of pronounced stress without new wholesale funding. The impact differs across banks.
Covered bonds account for a large part of banks’ liquidity reserves. If a number of banks need liquidity and have to sell such a large quantity of covered bonds that their value falls, the value of covered bond holdings in the liquidity reserves of all other banks will also fall. Cross-holdings of bonds mean that banks fund other banks. If banks are no longer buyers of covered bonds during market stress, this could weaken the possibility of other banks issuing new covered bond funding, and could more easily lead to liquidity problems spreading across banks and becoming self-reinforcing.
Turbulence in the covered bond market may also arise if other large covered bond holders engage in large-scale divestment, for example if they are in need of liquidity. Such bond holders include alternative investment funds (hedge funds). They are often very free to invest with moderate equity capital and are not subject to specific regulation. Negative events that are not linked to the Norwegian economy orto Norwegian banks can rapidly propagate through hedge funds and spill over to Norwegian markets. Turbulence in the covered bond market may also be linked to traditional asset managers, such as insurance companies and mutual funds, which for different reasons need to revise down their covered bond exposure.
If hedge funds, asset managers or others need to carry out covered bond fire sales, funding costs in the covered bond market could rise substantially or the market could cease to function. This may lead to liquidity difficulties for banks and impact the entire credit market.
There is often unsufficient information on the activity of lightly regulated market participants. More information on, and analyses of, the interconnectedness of banks and other financial institutions is needed to identify and understand vulnerabilities and channels of contagion. This requires international cooperation.
Regulatory simplification must not be at the expense of necessary resilience
The harmonisation and simplification of regulations is now higher up on the international agenda, and in a number of countries there is increased pressure to ease banks’ capital requirements. There are good reasons to explore opportunities to simplify complex and comprehensive regulations, but this should not be achieved by easing requirements necessary to limit the build-up of risk and maintain financial system resilience. It is important to avoid inter-jurisdictional competition for the most accommodative regulations – this would make us all more vulnerable.
Ida Wolden Bache
Pål Longva
Øystein Børsum
Ingvild Almås
Steinar Holden
The global economy is marked by uncertainty about future trade policies, and market movements have been substantial. This contributes to a higher risk of market stress and downturns that could weaken financial stability. Vulnerabilities, such as highly indebted bank borrowers, can have an amplifying effect. This Section provides a summary of risks and key financial system vulnerabilities.
1.1 Market stress and an uncertain economic outlook
Considerable market impact of trade policy and geopolitics
US economic policy uncertainty increased after the new administration took office in January. Market participants revised down their GDP growth expectations for the US, and US yields and equity indices fell (Chart 1.1). A number of European countries announced substantial defence and infrastructure investments, which contributed to higher growth expectations in Europe and a rise in European yields and equity indices.
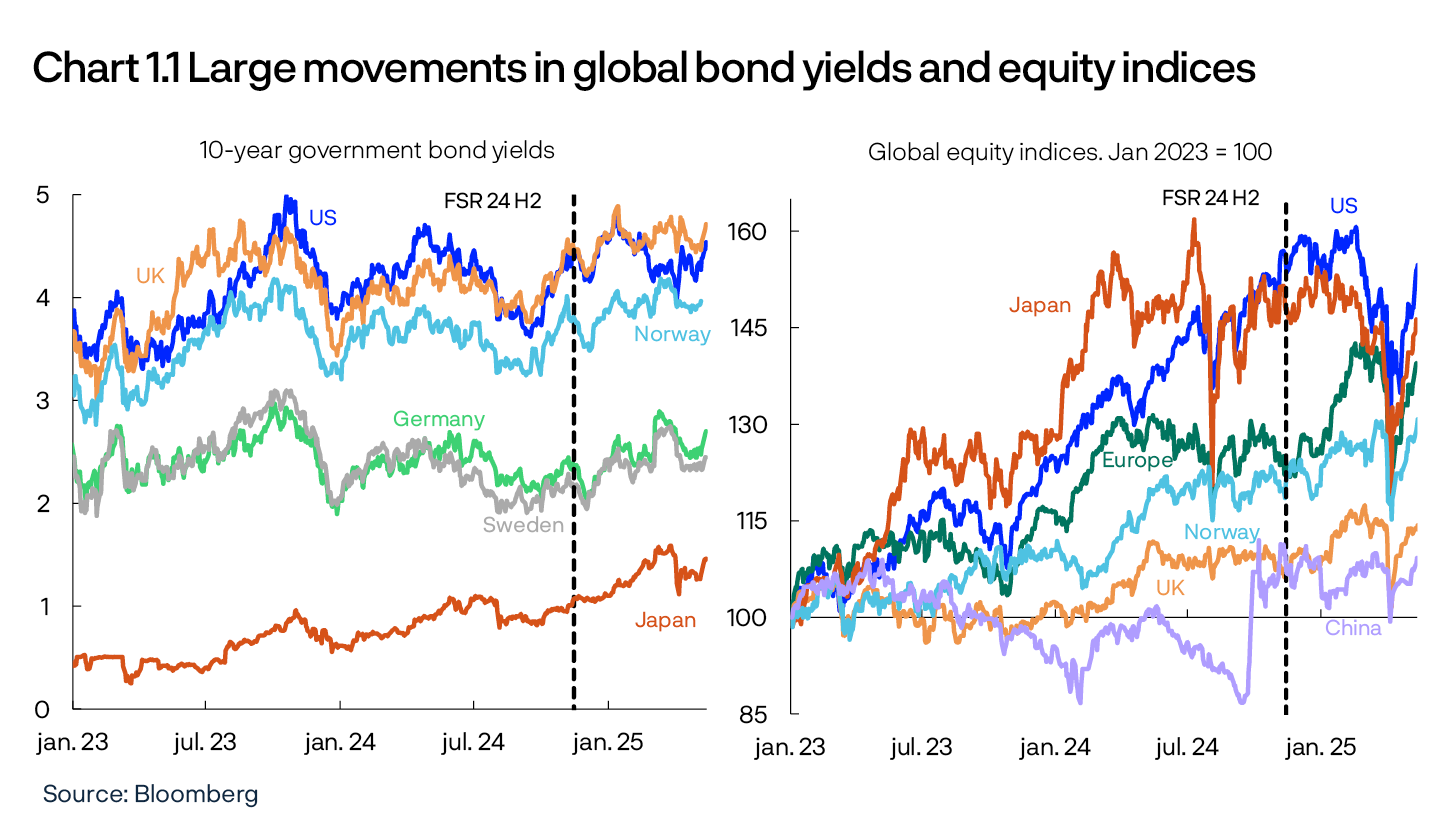
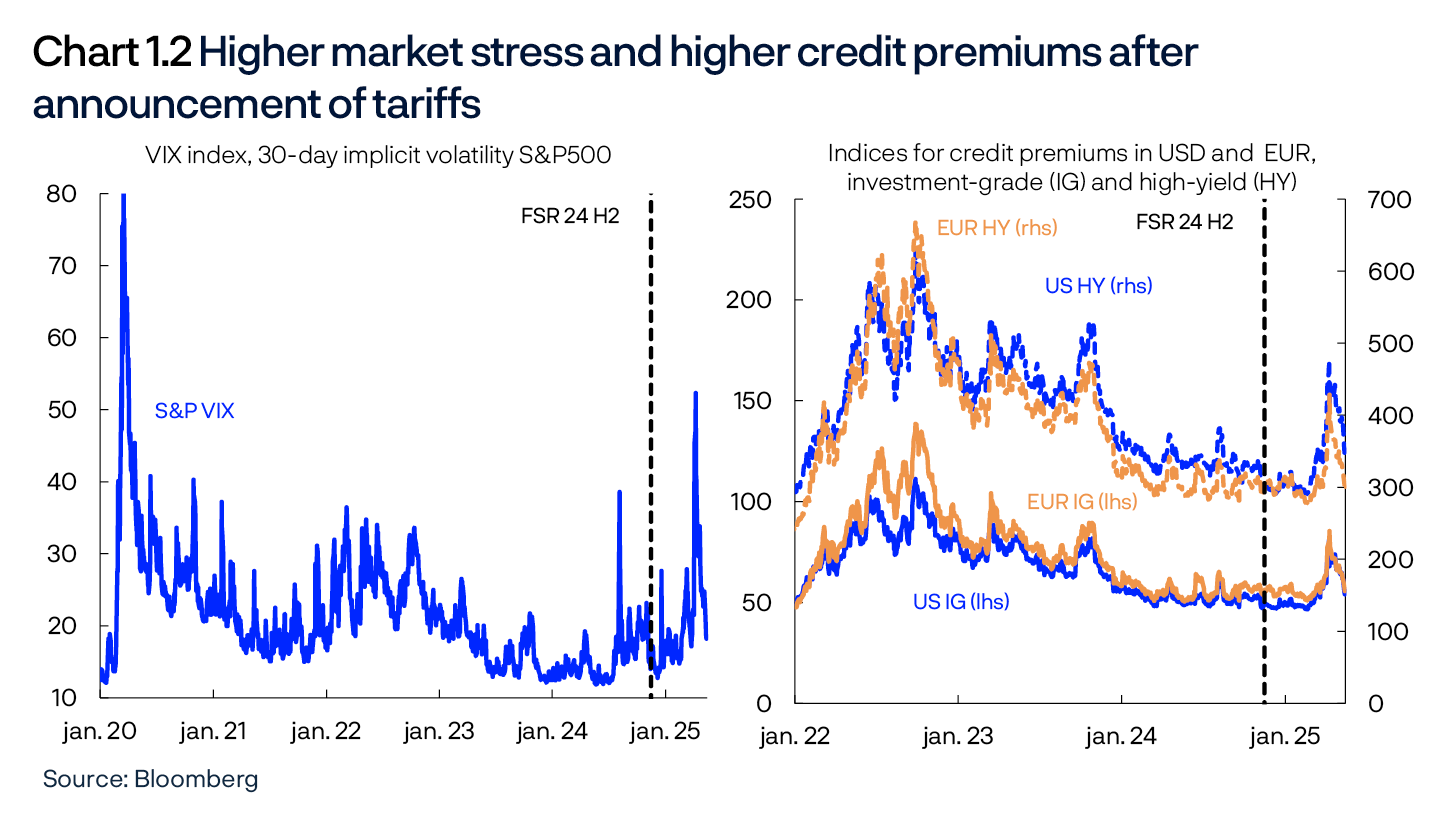
At the beginning of April, the US announced extensive import tariffs. Together with other countries’ countermeasures, this weighed on global growth expectations. Global yields and equity indices fell markedly, the US dollar depreciated, indicators of market stress rose and credit premiums increased globally (Chart 1.2). In the weeks that followed, news about trade restrictions led to high market volatility. Many firms reported that they were postponing plans to raise capital or financing. At the same time, there were few signs of markets not functioning sufficiently or that banks or other financial institutions were facing liquidity problems.
With positive signals coming from the ongoing negotiations between the US and its trading partners, turbulence related to the trade conflict has abated through spring. Market movements in April have thus largely been reversed. Nevertheless, considerable uncertainty persists about growth and inflation prospects.
Large impact also on Norwegian financial markets
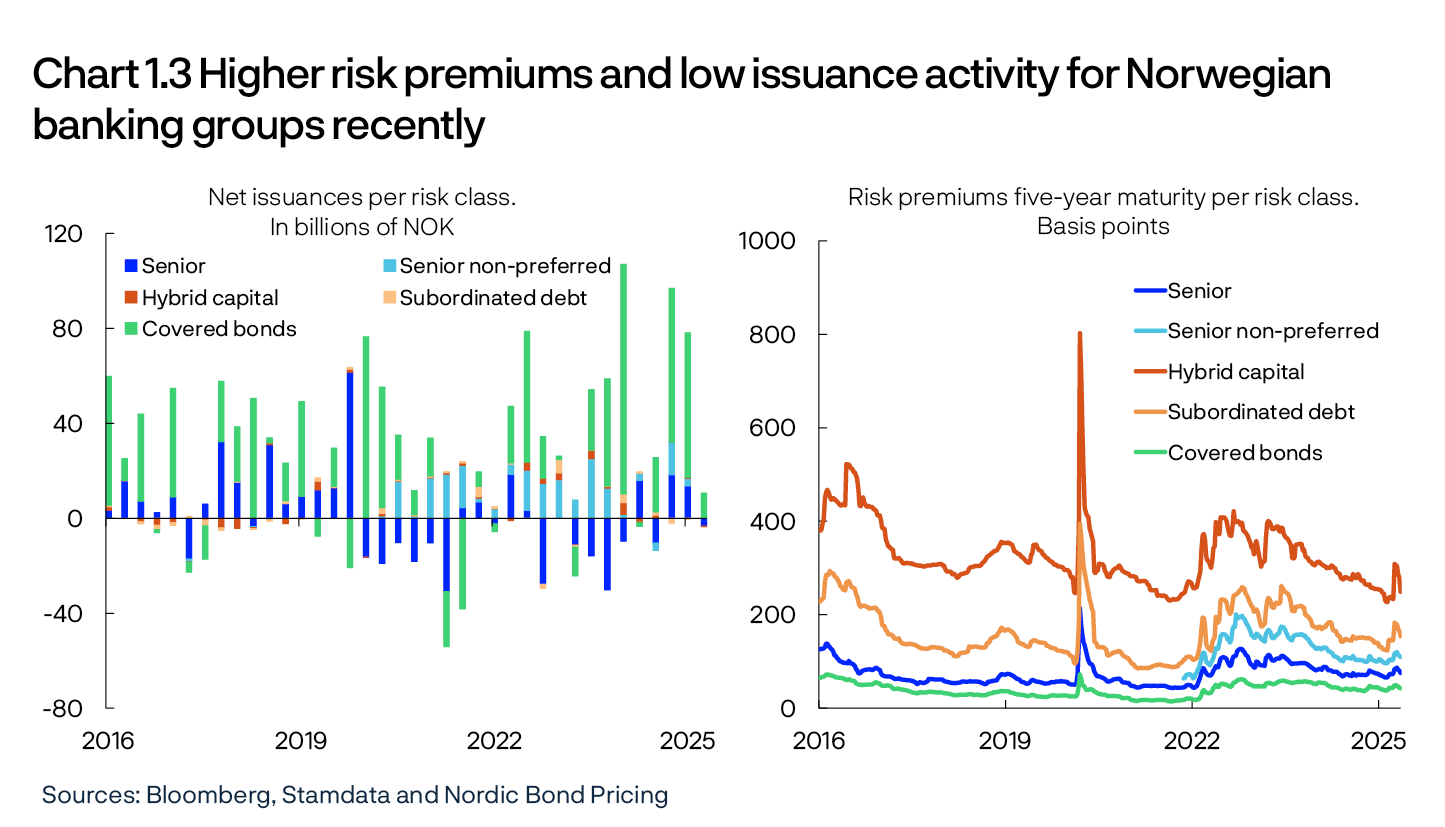
Market stress also led to large market movements in Norway. Both short-term and long-term yields fell. The Oslo Børs Benchmark Index, which reached an all-time high just before the market stress, fell sharply. Norwegian financial market risk premiums rose abruptly for most risk classes, with the most pronounced rise for non-financial corporates with low credit ratings. Premiums also rose for bonds issued by Norwegian banking groups (Chart 1.3). The krone depreciated markedly, and daily fluctuations were substantial. Liquidity in the NOK market showed deterioration, and the FX market bid/ask spread was wider than normal. Despite large market movements and deteriorated liquidity conditions in NOK and other asset classes, markets were well-functioning.
As in other countries, markets in Norway have stabilised as the turbulence has abated. Bond risk premiums have fallen in recent weeks but remain higher than before the market turbulence started.
Banks’ access to wholesale funding has been ample but issuance volumes have fallen. In 2025 Q1, issuance volumes were at historically high levels (Chart 1.3). However, after the market turmoil in April, activity declined considerably, reflecting issuers delaying issuances until uncertainty subsided. Turnover in the secondary bond market has been high, but transaction costs have risen slightly.
Uncertainty about economic developments is higher than normal
Trade conflicts and other geopolitical tensions have resulted in higher-than-normal uncertainty about economic developments. In the April Global Financial Stability Report, the IMF revised down its global growth projections and emphasised the heightened level of uncertainty.
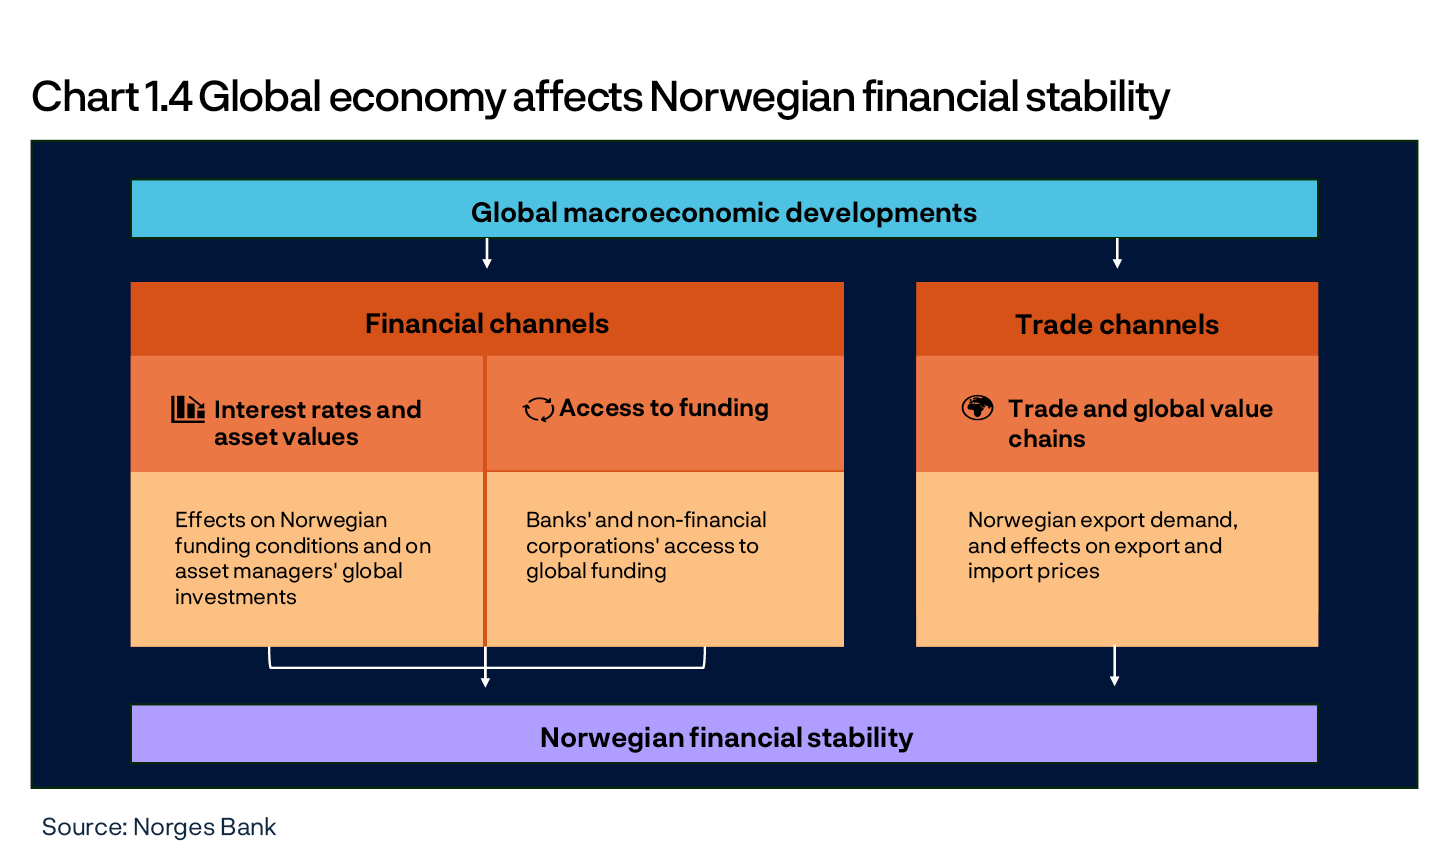
The global economy affects financial stability in Norway both through financial markets and the real economy (Chart 1.4). The Norwegian economy is well-positioned to deal with large shocks and possible lower global growth. Unemployment is low, and capacity utilisation is close to a normal level. Banks are resilient, and the Norwegian financial system is robust (see further discussion in Sections 2 and 3). In order to maintain banks’ resilience, it is important that capital and liquidity requirements are not eased (see “Heightened uncertainty regarding the implementation of international banking regulation”).
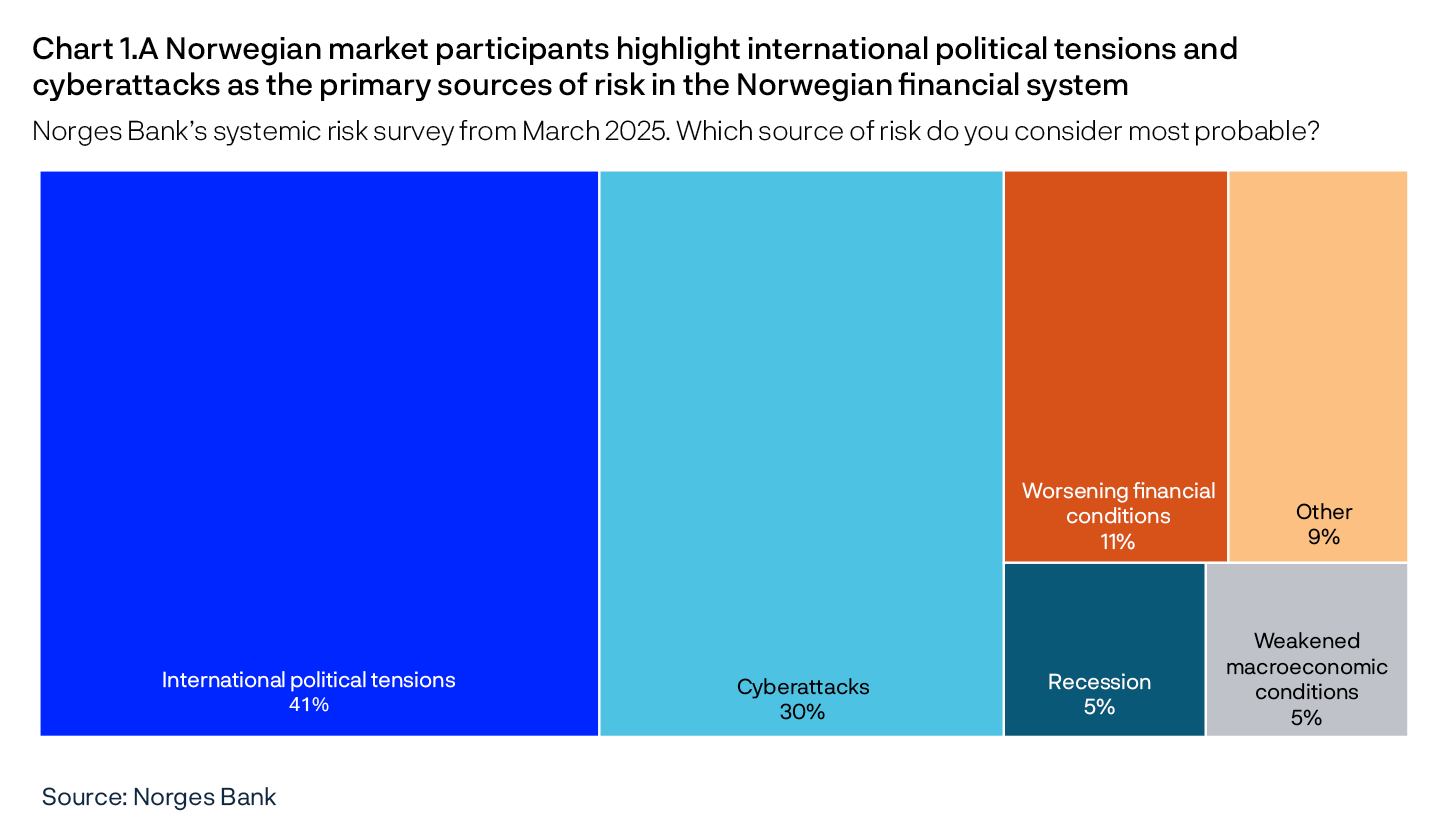
According to Norges Bank’s systemic risk survey conducted in March, Norwegian financial market participants are highly confident that the Norwegian financial system will remain stable despite the risk of shocks (see “Systemic risk survey”).
Systemic risk survey
Norges Bank’s systemic risk survey conducted in March showed that Norwegian financial market participants consider international political tensions and cyberattacks to be the primary sources of risk in the Norwegian financial system (Chart 1.A). Respondents were asked how they assess the probability of an event with a substantial impact on the financial system occurring in the next three years and how this probability has changed over the past six months (the response alternatives were: decreased, decreased somewhat, unchanged, increased somewhat and increased). Most responded that the probability had increased somewhat. No respondents answered that the probability had decreased. Respondents were also asked about how confident they were that the Norwegian financial system would be stable over the next three years, with the response alternatives being: very low, low, medium, high or very high. Most responded that confidence levels were high (no respondents answered low or very low).
1.2 Vulnerabilities in the Norwegian financial system
Financial system vulnerabilities can amplify turbulence and downturns. High household indebtedness poses the greatest risk to financial stability. Other vulnerabilities can exist in financial institutions, for example large market movements can be amplified by funding structures and links between banks and non-bank financial institutions.
High indebtedness makes households vulnerable to higher interest rates and loss of income
Many households are highly indebted. This may amplify an economic downturn as many households may face debt-servicing problems or may have to reduce consumption substantially. A tightening of consumption may reduce firms’ earnings and debt-servicing capacity and inflict losses on banks.
So far, Norwegian households have been able to service their debt in the face of higher interest rates and high inflation, partly reflecting high employment levels and real wage growth in 2024. Furthermore, accumulated savings over the past ten years have provided many households with a solid foundation. See Financial Stability Report 2024 H2 for analyses of household debt-servicing capacity.
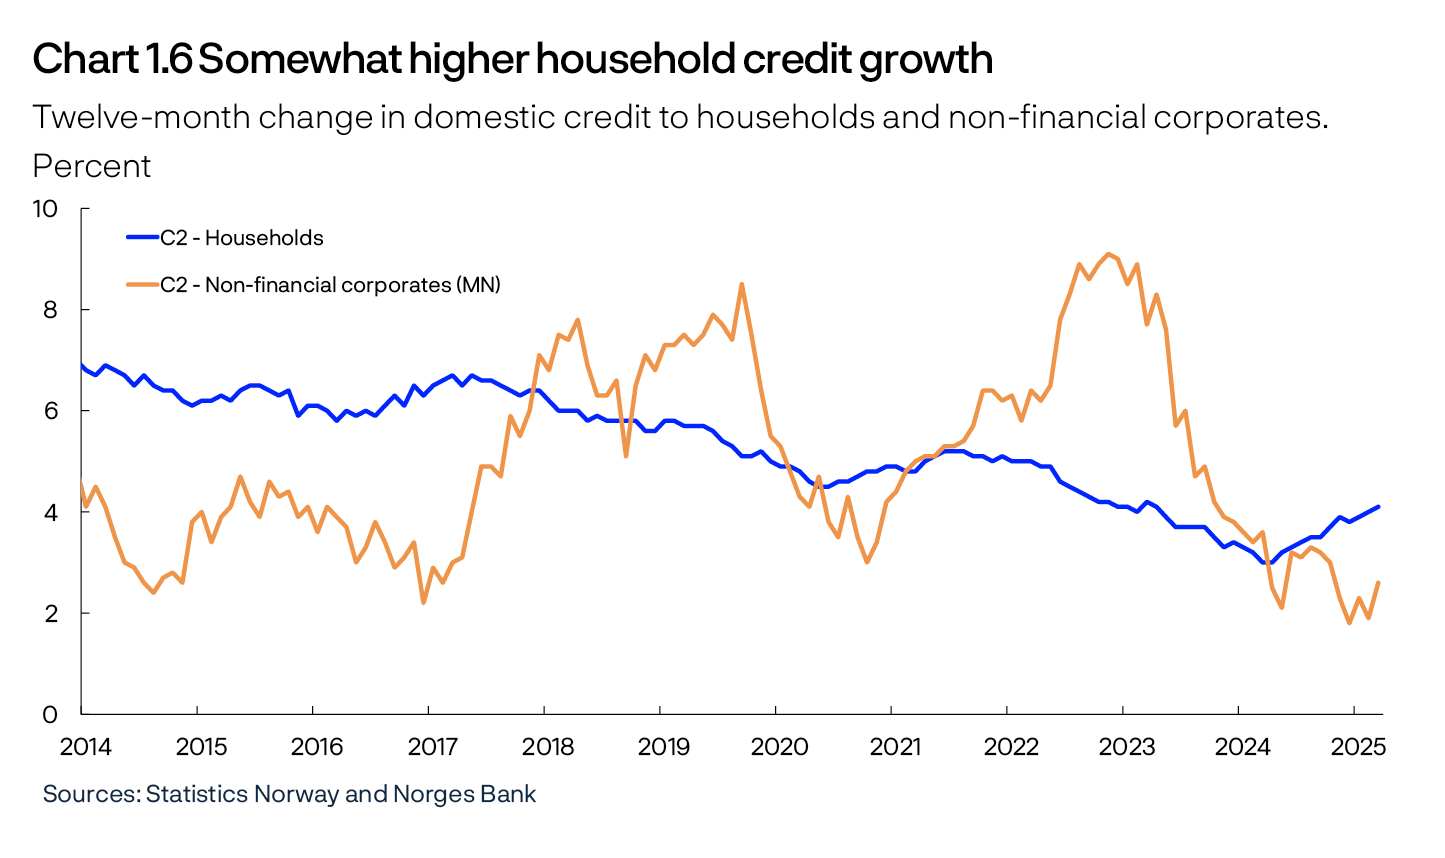
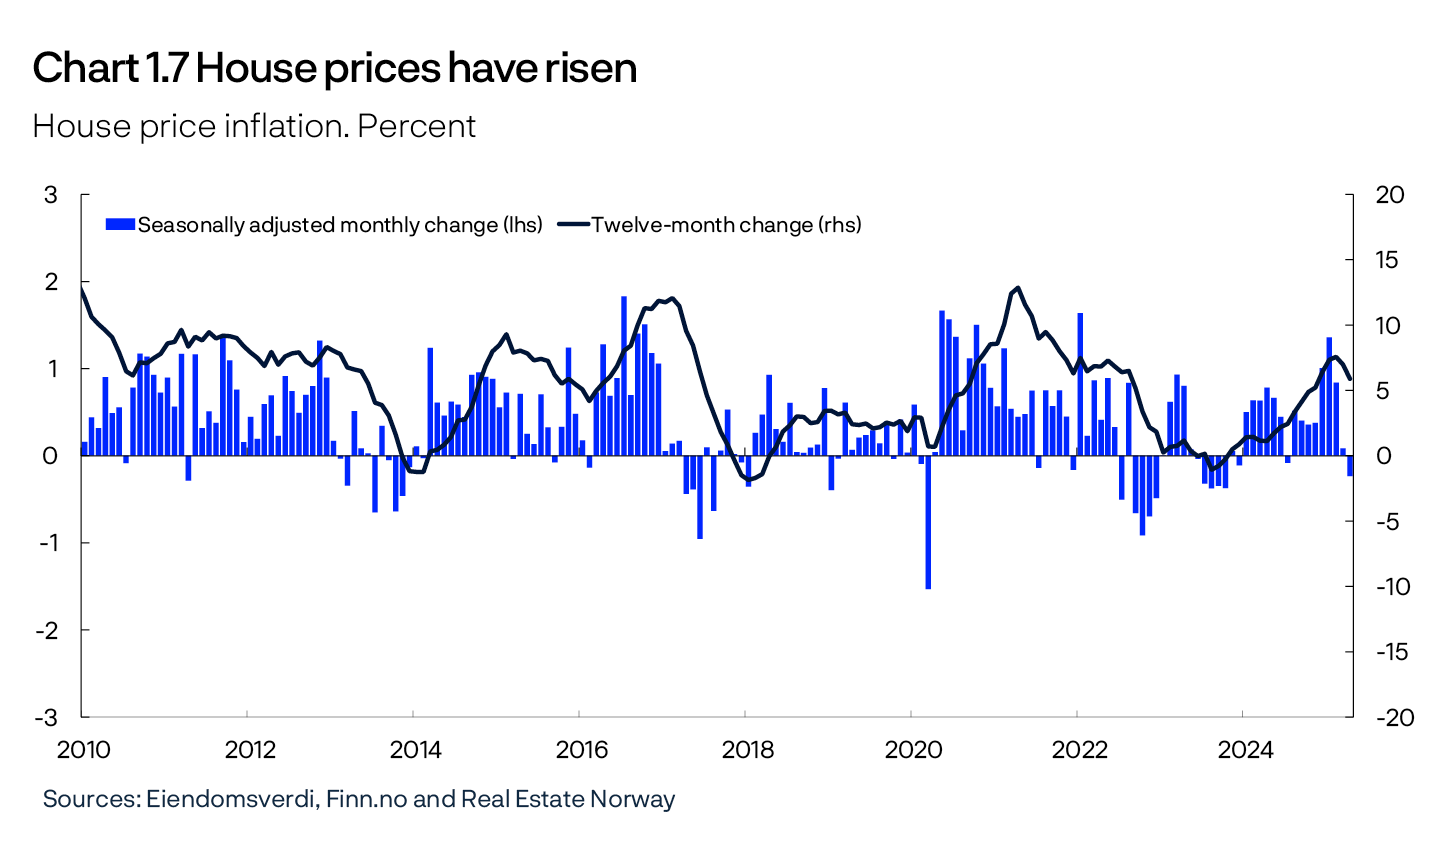
In recent years, debt growth has been slower than income growth and contributed to lower debt burdens (Chart 1.5). Household credit growth has edged up over the past year after having slowed over a long period (Chart 1.6). Credit growth is normally closely linked to house price inflation. House price inflation picked up sharply in January and February but slowed in March and April (Chart 1.7). Turnover in the secondary housing market has been high in 2025. Activity in the primary housing market remains low, but the number of housing starts picked up in March. The regulatory reduction in the share of equity required to finance house purchases at year-end 2024 has likely had the largest impact on the purchasing power of non-homeowners. For small flats in the largest cities, the rises in prices and turnover were higher than for other segments at the beginning of 2025.
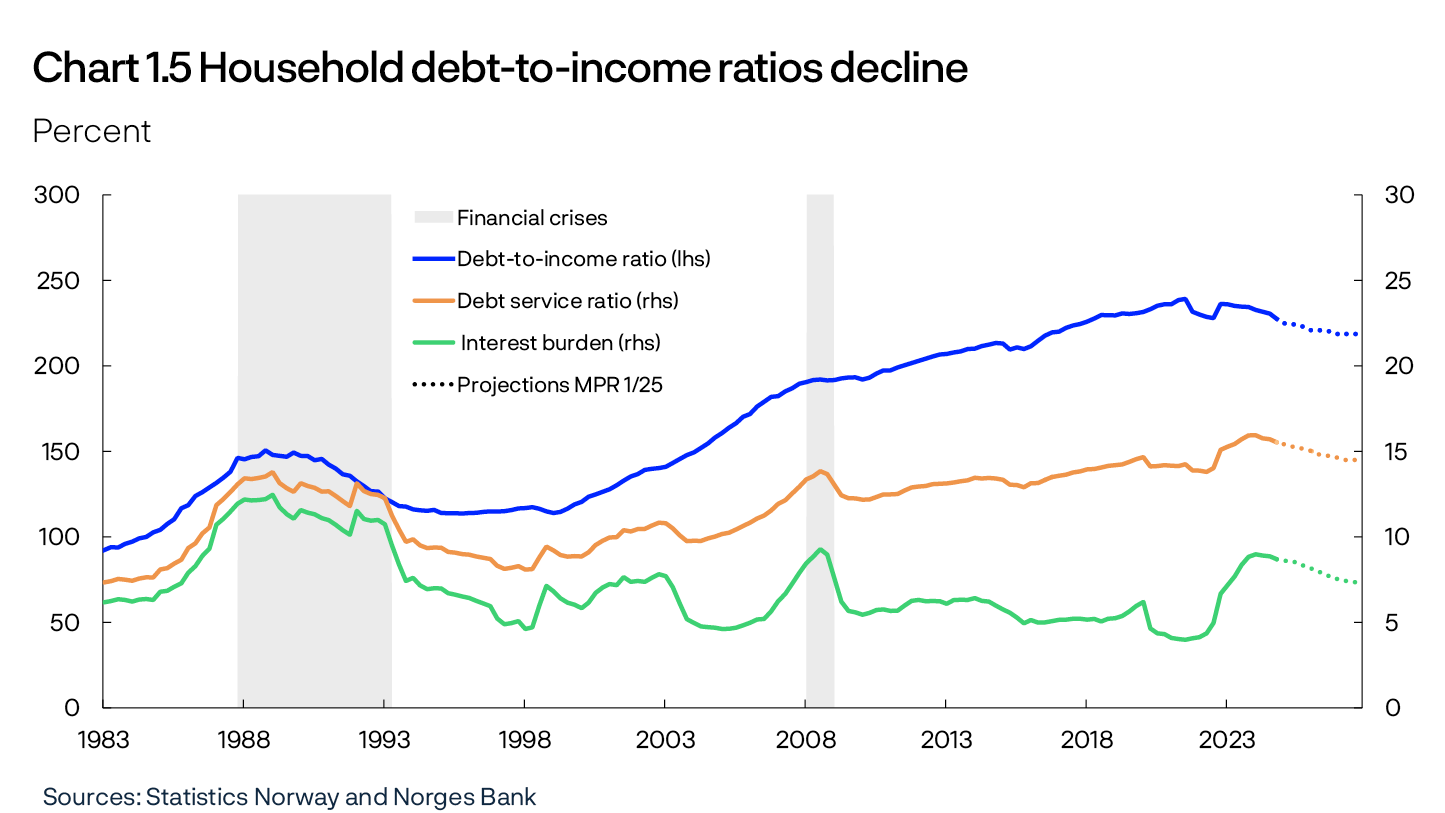
The high indebtedness of many households is a key vulnerability in the Norwegian financial system (see “Key vulnerabilities in the Norwegian financial system”). Should the debt-to-income (DTI) ratio decline over time, the household sector could become less vulnerable to interest rate increases and loss of income. Vulnerabilities could rise again if looser financial conditions result in rapidly rising house prices and debt.
Banks are vulnerable to negative developments in the real estate sector
CRE loans account for close to half of banks’ loans to non-financial corporates. Experiences from banking crises in Norway and abroad have shown that losses on CRE exposures during sharp economic downturns have been an important factor behind solvency problems in the banking sector.
Overall, CRE firms’ debt-to-earnings ratios are high. Firms’ profitability has been impaired due to higher interest rates, but because of a rapid rise in rental income owing to high employment along with inflation adjustments under existing leases, growth in rental income has so far enabled most CRE firms to service higher interest expenses with current earnings.
Commercial property selling prices fell somewhat from the peak in autumn 2022 (Chart 1.8). Estimated selling prices fall with increasing yields and with decreasing rents. Rents and selling prices have increased slightly over the past year. Looking ahead, selling prices are expected to continue to rise moderately.
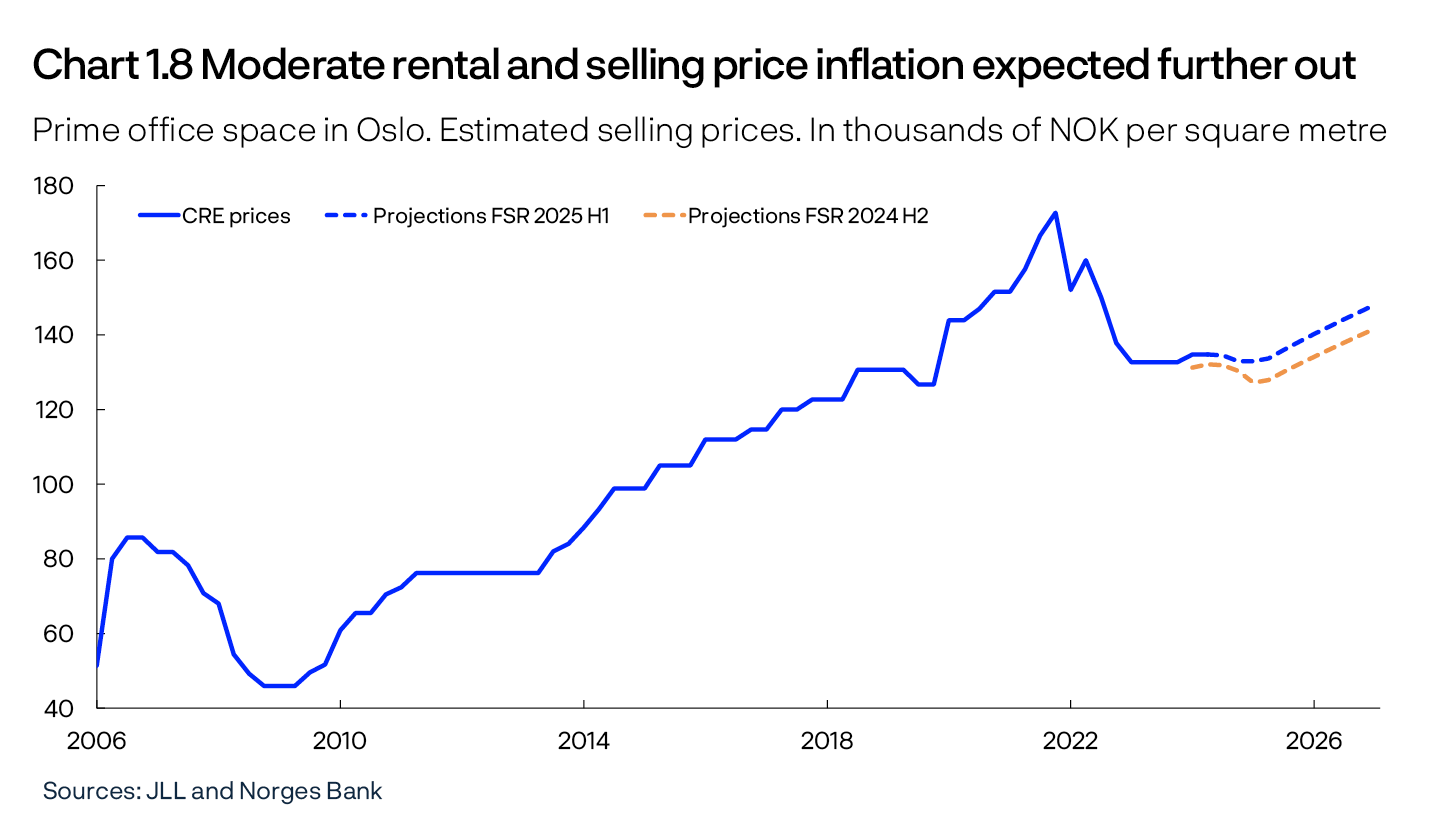
There is still uncertainty surrounding further developments in the real estate sector. While CRE firms appear to have managed to maintain activity levels in spite of higher interest rates, there are still challenges for real estate developers (see Financial Stability Report 2024 H2 for a detailed discussion).
For CRE firms, profitability and property values will deteriorate if long-term interest rates or risk premiums rise markedly or rental income proves markedly lower than expected. Profitability will also weaken with higher short-term interest rates. Lower equity ratios and profitability may make rolling over maturing loans more demanding and may necessitate property fire sales, which could in turn amplify a fall in property prices if many such sales were to coincide. Writing down property values may result in considerably higher bank losses than assumed in Section 2.
Concentration and cross-holdings in the covered bond market are sources of vulnerability for banks’ liquidity
A large share of banking groups’ funding comes from deposits, and approximately half is covered by the deposit guarantee scheme. Wholesale funding primarily consists of bonds and short-term paper, including covered bonds. The cross-holdings between banking groups are substantial as banks themselves have large covered bond holdings, while covered bonds account for an important share of banks’ liquidity reserves.
The credit risk on covered bonds is low because they are backed by Norwegian mortgages with low LTV ratios and collateral values are substantially higher than the face value of the bonds. House prices must fall substantially and the debt-servicing capacity of Norwegian households must deteriorate significantly before credit losses are incurred on covered bonds.1
However, prices of covered bonds and other fixed-income instruments can fall sharply and rapidly when a number of market participants sell heavily at the same time. Such sales may for example reflect many banks’ wish to sell to obtain liquidity. If other banks simultaneously decide not to buy covered bonds when they need liquidity, cross-holdings will allow liquidity stress to spread quickly across banks, liquidity problems can become self-reinforcing and markets can cease to function.
Moreover, asset managers, such as insurance companies and securities funds, may seek to rebalance their portfolios or sell covered bonds to obtain liquidity for collateral (margining) in derivatives contracts (see discussion in Section 2.3). A divestment from covered bonds by foreign hedge funds may also have a negative impact on these prices (see “Hedge funds own an increasing share of covered bonds issued in NOK”).
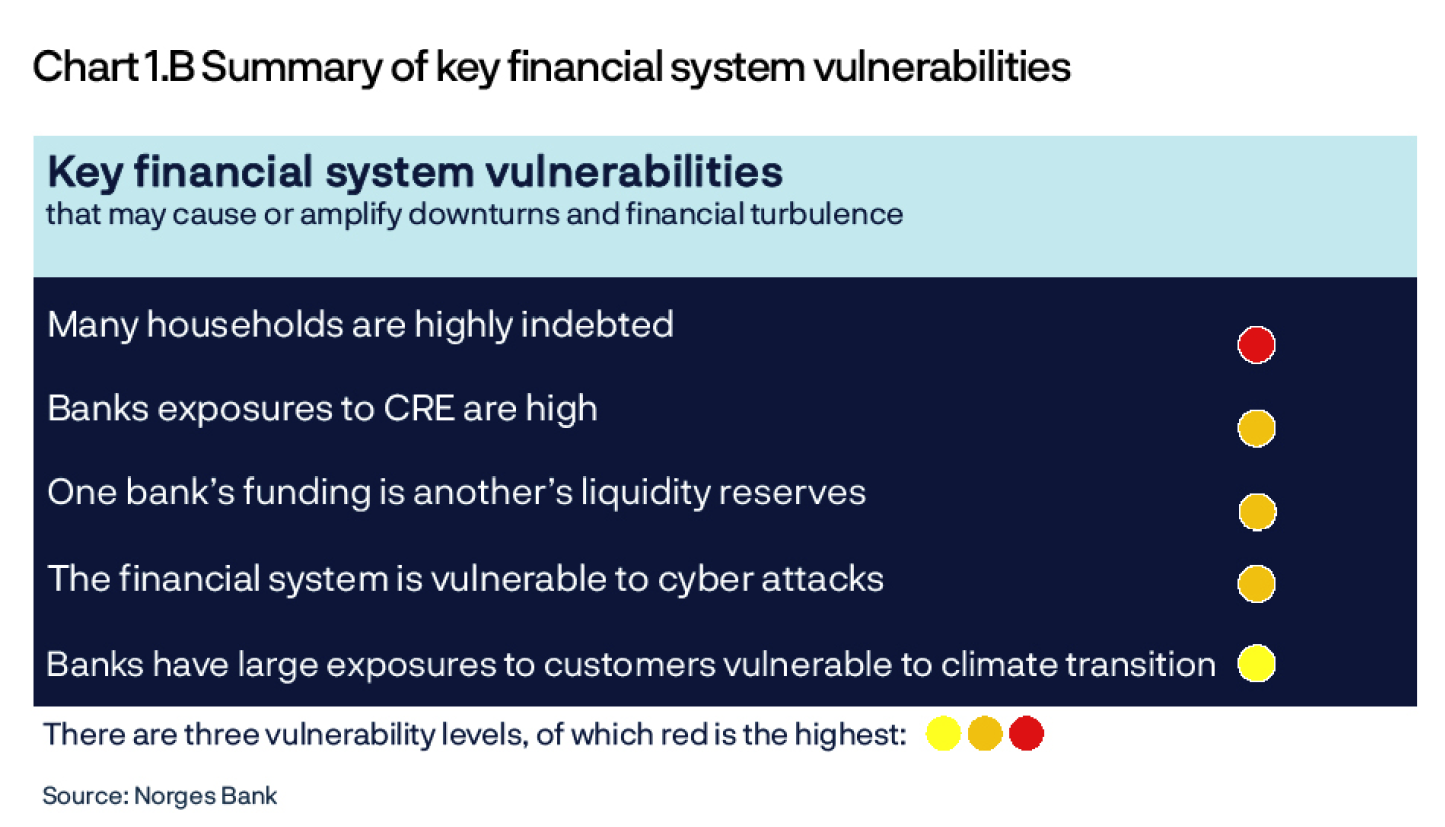
Key vulnerabilities in the Norwegian financial system
The economy is regularly exposed to shocks that affect both the real economy and the financial system. Promoting financial stability means ensuring sufficient financial system resilience to absorb such shocks. In this work, Norges Bank focuses on assessing systemic risk. The financial system should contribute to stable economic developments by channelling funds and offering savings products, executing payments and distributing risk efficiently. Systemic risk is the risk of disruption to the financial system’s ability to perform these functions.
The level of systemic risk depends on a number of factors. The risk of economic shocks, such as geopolitical tensions and trade restrictions, exacerbates systemic risk. Financial system vulnerabilities further increase systemic risk.
Chart 1.B summarises Norges Bank’s key assessments of vulnerabilities.
In response to financial system vulnerabilities, a number of measures have been introduced to strengthen resilience, including requirements for banks’ solvency, liquidity and lending practices.
1 An analysis on page 39 of Financial Stability Report 2022 shows that house prices can fall by about 50% before mortgage companies as a whole are at risk of breaching the collateralisation requirement in covered bond contracts.
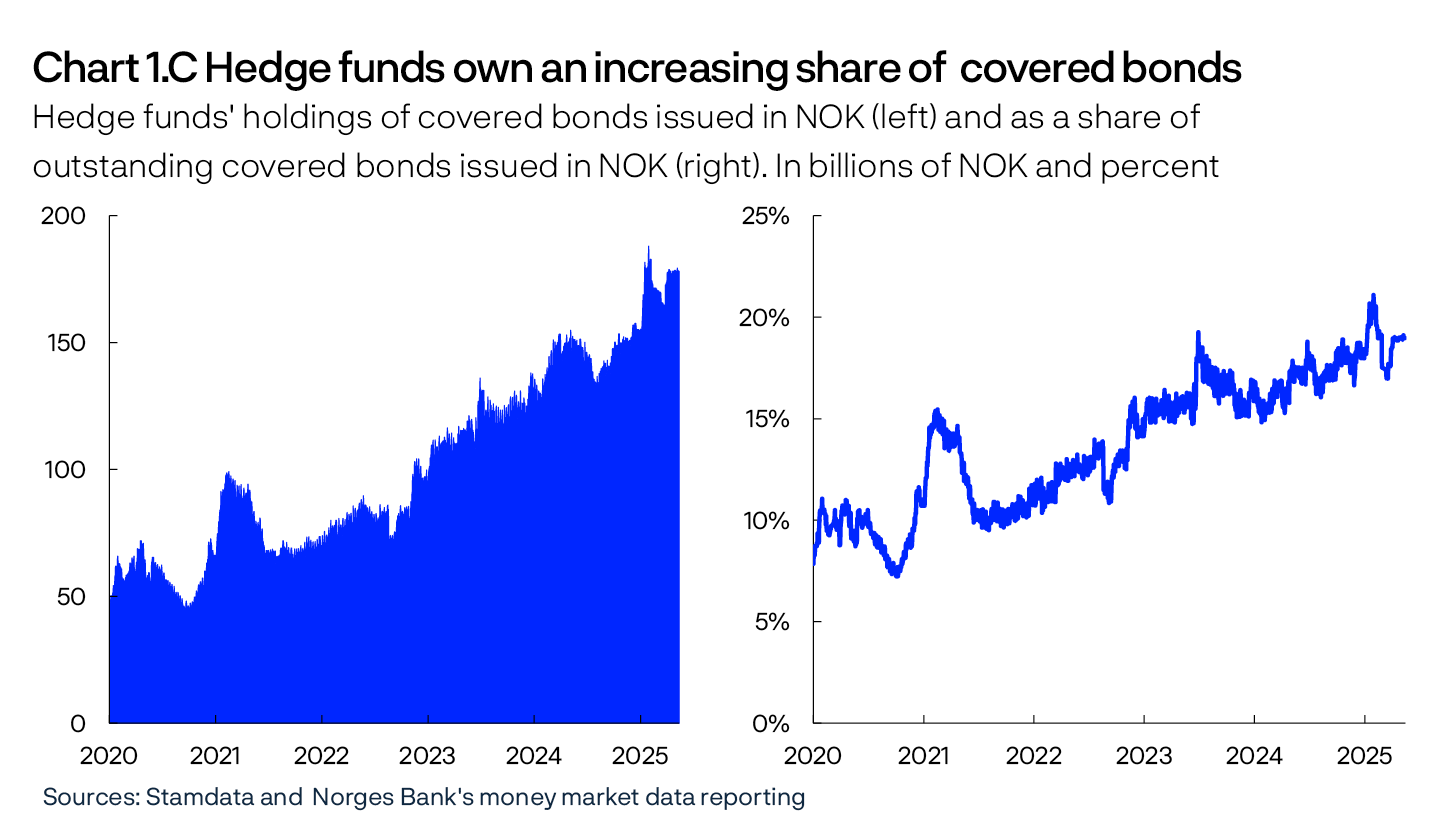
Hedge funds own an increasing share of covered bonds issued in NOK
Alternative investment funds (hedge funds) own an increasing share of covered bonds issued in NOK. In the covered bond market, this contributes to ownership diversification and is generally advantageous for liquidity. The funds’ purchases are leveraged with repurchase agreements (repos, see explanation in box) with Nordic banks. Leveraging enables the funds to achieve high returns but also makes them vulnerable to events that may force fire sales of covered bonds. This may lead to stress in the covered bond market, which may spread to other parts of the credit market.
Why are hedge funds and banks doing this?
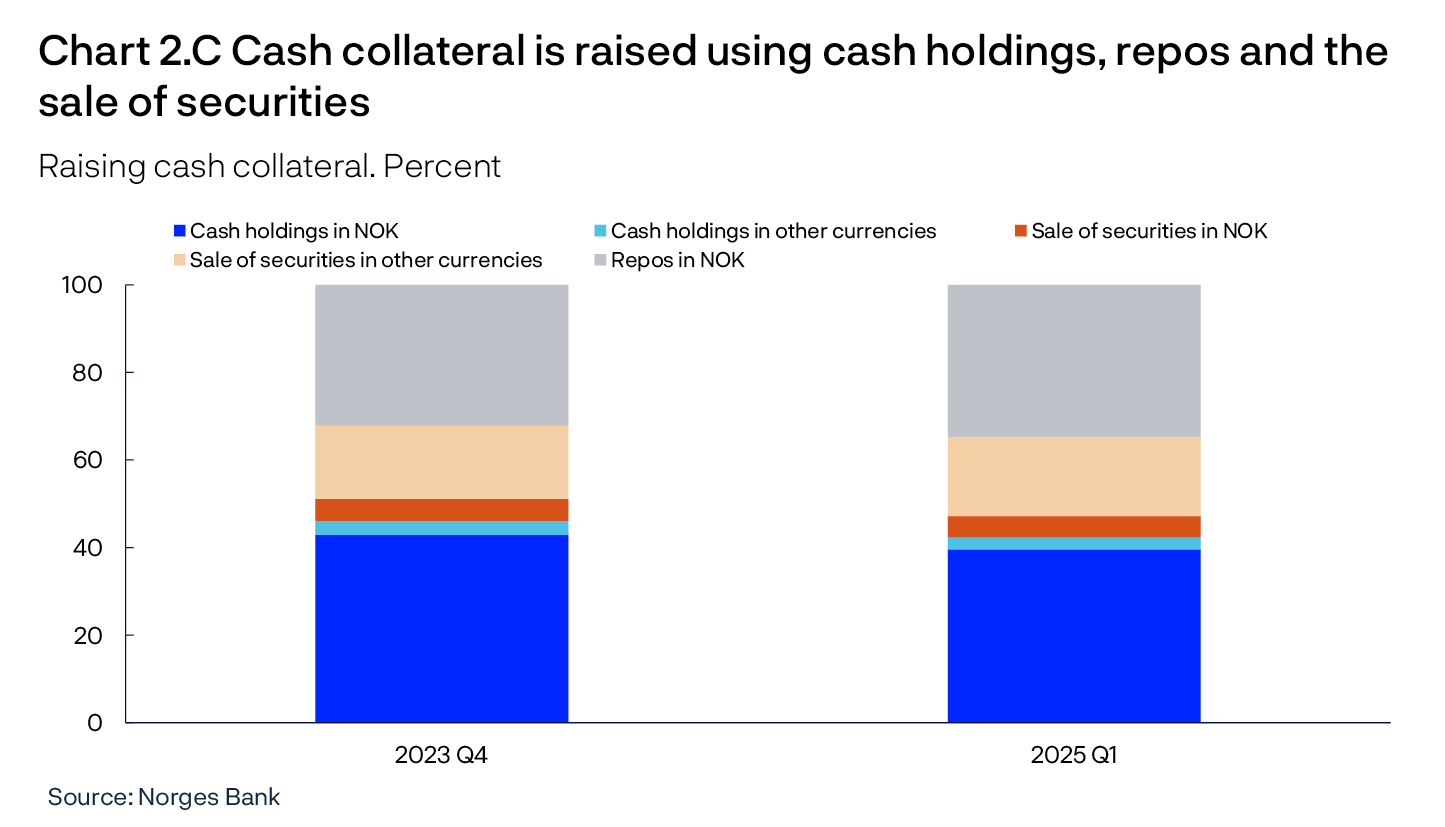
Hedge funds’ Norwegian covered bond holdings have increased in recent years. Since 2020, outstanding repos backed by Norwegian covered bonds between Nordic banks and hedge funds have increased from around NOK 50bn to slightly below NOK 200bn. Measured as a share of outstanding covered bonds issued in NOK, this amounts to an increase from around 10% to 20% over the same period (Chart 1.C). A few hedge funds account for nearly all of the volume.
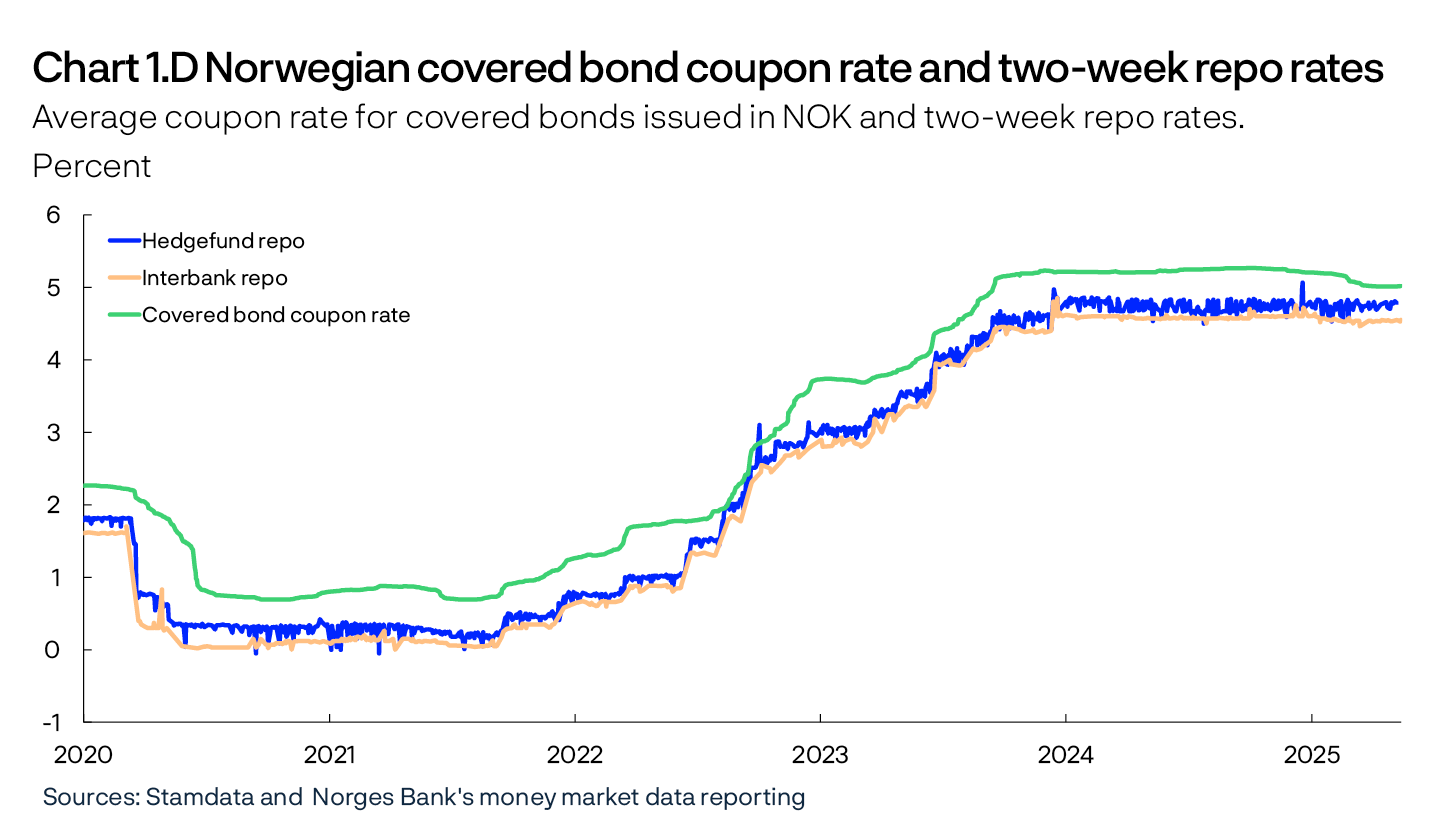
Many hedge funds finance their investments using leverage to achieve high returns for their investors, for example by financing covered bond purchases with repos. When using repos to finance covered bond purchases, a hedge fund returns the covered bond to the counterparty as collateral so that most of the purchase is leveraged. Hedge funds generate profit provided that the return on covered bonds from yields and price fluctuations is higher than the interest they pay on repos. In recent years, the average coupon rate on covered bonds in NOK with floating rates has been around 40 basis points higher than repo rates (Chart 1.D ). At the same time, the price fluctuations of floating rate covered bonds have been very small. Stable current returns combined with high leveraging have made this strategy profitable for hedge funds.
Hedge funds’ repo counterparties are market makers among the large Nordic banks that also facilitate bond issuances for covered bond mortgage companies. Banks offer repo financing when issuing bonds on behalf of covered bond mortgage companies. This may provide better access to investors and, in isolation, reduce financing costs for covered bond mortgage companies. In addition, banks earn an interest margin as the borrowing rate on NOK to hedge funds in repos is higher than banks’ borrowing costs. This is because the repo rate on lending to hedge funds is higher than interbank repo rates.
Risk
Hedge funds assume the highest risk, and in principle, the risk to banking groups is low.
Slightly simplified, hedge funds face two types of risk. First, they face a risk of losses on the position itself, because covered bond premiums can rise and coupon rates can fall below the repo rate. Second, they face refinancing risk as they risk not being able to roll over the repo when it matures. Repos typically have maturities of less than one month, and hedge funds are likely to have to roll over repos to continue holding covered bonds. If for some reason they are unable to roll over the repos, they may have to sell covered bonds in the market. The high degree of leverage results in a high risk of losses.
Generally, the risk to banking groups is low. Banks’ loans are secured, and if repos are defaulted upon, banks will acquire the covered bonds and can then freely sell them in the market to recover the loan. Unless hedge funds default on banks’ loans, they carry the market risk. A haircut of 2% to 3% (overcollateralisation) is typically applied to repos as a buffer to limit the likelihood of banks taking a loss on bonds they may acquire due to a fall in prices. Normally, price fluctuations for floating rate covered bonds are much smaller than repo haircuts. Covered bond mortgage companies, on the other hand, received money upon issuance of the covered bond and are not directly impacted if hedge funds default or sell covered bonds.
However, this structure can create problems. For example, an unexpected event that is not directly related to the covered bond market or banks may result in hedge funds having to sell covered bonds to reduce risk or obtain liquidity. If the need for such a sell-off is pressing and arises quickly, it may be difficult to find buyers. High ownership shares and concentrated ownership may increase the likelihood of such developments. This may then lead to a sharp rise in credit premiums, which in turn may lead to poorer access to market funding for banking groups and have negative spillovers to other parts of financial markets. The larger the share of the covered bond market that is owned by hedge funds in this way, and the more concentrated the ownership is among these funds, the greater the potential for negative effects.
What is a repurchase agreement?
A repurchase agreement (repo) is a financial transaction similar to a loan, with collateral in the form of securities (see p. 23 of Norway’s Financial System 2024). Party A sells a security to party B, with an agreement to repurchase the security in the future. The spread between the sale price and the repurchase price represents the repurchase agreement rate (repo rate). The repurchase price is normally higher than the sale price, meaning that party B, which provides (lends) money, receives interest. In addition, the borrowing amount is also typically limited by a haircut, meaning that party A that sells the security borrows less than the market value of the security. Party B, which buys the security, can use it freely until the repo matures and will permanently acquire the security if party A is unable to repurchase the security at maturity. Repos are therefore loans with substantially lower counterparty risk than unsecured loans.
Vulnerability to cyber attacks
Digitalisation makes the financial system efficient but also gives rise to vulnerabilities. Concentration, complexity and interconnectedness may entail that the consequences of a cyberattack are amplified and spread quickly and widely across the financial system. If the overall consequences are extensive, financial stability could be threatened. Such a scenario may arise if, for example, critical financial system functions are disabled, if there is uncertainty about the integrity of the systems and if such events weaken confidence in the functioning and security of the financial system.
So far, no attacks with consequences for Norwegian or global financial stability have been observed, but cyberattacks against the financial sector are on the rise. For a more detailed review of cyberattack vulnerabilities in the financial system and measures to reduce the risk of systemic consequences of cyberattacks, see the discussion in Norges Bank’s Financial Infrastructure Reports.
Climate transition increases the need for financing and may be a source of higher risk for banks
Many industries in Norway will face considerable challenges related to reducing their greenhouse gas emissions. The transport industry, the processing industry and the oil and gas industry are particularly vulnerable, but all industries could experience new climate target requirements and higher costs related to counteracting the effects of climate change. Restructuring and adapting to climate changes will mean higher costs for households and firms. This will, in isolation, weaken their debt-servicing capacity. It is important that households and firms recognise the implications of climate transition and climate change when planning to invest and borrow, and that banks assess how climate-related factors affect their customers.
Changes to weather patterns and vegetation owing to higher temperatures may exacerbate natural disasters. Floods and wildfires have caused substantial economic losses abroad over the past year. Insurance companies may be particularly vulnerable when major events occur (see “Insurance companies can manage the costs from natural disasters”). Over time, there is reason to assume that insurance companies will pass on this cost to their customers through higher premiums. For some objects, private insurance may become prohibitively expensive. Insurance is necessary if real estate is to be pledged as collateral.
Other types of restructuring needs may also be a source of higher risk for banks. If global trade policy or the need for supply security were to change permanently, a need for restructuring and an increased risk of losses on existing corporate exposures may arise.
Increasing interconnectedness between cryptoassets and traditional finance
Cryptoassets are financial instruments that may affect the pricing of traditional instruments such as equities and bonds. Cryptoassets have historically fluctuated substantially in value and primarily serve as investment or speculative assets. In connection with the US election results in November 2024, the cryptoasset market surged, partly reflecting expectations of a more accommodative US regulatory framework.
Abrupt rises in cryptoasset values have often been followed by abrupt falls. Uncertainty about fundamental values, debt financing, as well as herding and panic behaviour contribute to substantial swings in value. The risks may be high for individual cryptoasset investors. Increasing interconnectedness has been observed between traditional finance and cryptoassets. In the long term, these may provide avenues for systemic risk. More investment products have emerged that make it easier for both traditional firms and financial institutions to gain exposure to cryptoassets. In addition, the use of stablecoins, ie cryptoassets that seek to maintain a stable value against reference assets, eg US dollars, has increased. The largest stablecoins have reserves held in bank deposits and securities. These reserves must be sold quickly when there is a loss of confidence.
Regulatory developments in the US that pertain to stablecoins and banks’ involvement in services related to cryptoassets may strengthen the interconnectedness between cryptoassets and traditional finance (TradFi). In the EU/EEA, the capital framework for banks and insurance companies will limit the risk of exposure for such entities. Systemic risk related to cryptoassets is discussed in greater detail in the Financial Infrastructure Report.
Heightened uncertainty regarding the implementation of international banking regulation
Basel III is an international regulatory framework developed by the Basel Committee on Banking Supervision in response to the financial crisis of 2007-2008. The aim of Basel III is to strengthen the regulation, supervision and risk management of the banking sector. Much of Basel III has been implemented in European banking regulation. The final Basel III standards, referred to as the “end game”, are now the subject of international discussion. Some of the final key elements in the end game include a lower limit for the calculation of risk-weighted assets, new approaches for calculating credit and operational risk, and reforms related to the Fundamental Review of the Trading Book (FRTB). The finalisation of Basel III is expected to provide long-term advantages for the global financial system but will require banks to make extensive adjustments.
It has been argued that the regulations may dampen innovation and economic growth, and that requirements should be simplified and eased. Authorities in the US have signalled a possible delay for finalising the implementation of Basel III standards to 2026 and lower risk-weights for certain assets such as residential mortgages and retail trade exposure. There are also discussions about the requirement for an additional leverage ratio surcharge for global systemically important banks (G-SIBs), as the requirement may limit their ability to hold a large securities portfolio and thus maintain sufficient market liquidity.
A number of the new heads of various US regulatory bodies have expressed the need for greater flexibility, more growth, more responsibility to financial institutions and less regulation. On the other hand, the former heads of these bodies have highlighted the need for international regulation and sufficiently high capital requirements.
In the UK, the Bank of England and the Prudential Regulation Authority (PRA) have delayed the implementation of Basel III standards to 1 January 2027. The CEO of the PRA has highlighted the need for a balanced approach that supports both growth and competitiveness.
In Europe, the European Central Bank (ECB) and other supervisory authorities have delayed finalising the implementation of the FRTB to 1 January 2026. This has been done to preserve a level playing field internationally and to adjust to delays in other jurisdictions.
Insurance companies can manage the costs from natural disasters
Major floods in southern Europe in summer 2024 and wildfires in Los Angeles at the beginning of 2025 drew attention to the potential consequences of natural disasters for the insurance industry. The financial basis of insurance assumes that the probability of damages is small and generally occurs randomly across policy holders. If everyone pays a small premium, this is sufficient to cover the substantial expenses of individual policy holders that arise each time a loss occurs. However, natural disasters differ from standard insurance losses, such as residential fires. Natural disasters often affect many policyholders at the same time, so when damages occur, payouts are particularly large. In many countries, this type of insurance is voluntary. Norway stands out with its very high level of insurance coverage for most types of natural disasters. Since 1979, Norway has developed a statutory scheme, based on insurance principles, where indemnity for natural disaster damage is covered by insurance companies.1 Today, such coverage is organised through the Norwegian Natural Perils Pool, which is mandatory for all policy holders that have fire insurance.
Insurance companies can manage even major natural disasters
The Los Angeles wildfires are reported to have damaged more than 10 000 homes. The total damages have been estimated, albeit with a significant degree of uncertainty, at more than of NOK 2 500bn.2 However, this includes many costs that cannot be insured. The total expected insurance payout is in the order of NOK 300bn. Nevertheless, it is assessed that the insurance companies should be able to handle this without jeopardising their solvency.
The companies that sell insurance policies to households and firms, sell (all or parts of these policies) to a group of reinsurers – the insurance companies of insurance companies.3 These are the companies that ultimately bear the losses incurred from the large wildfires. Reinsurers annually set aside reserves to cover potential natural disaster claims. It has been estimated that damages from the Los Angeles wildfires may amount to close to 30% of European reinsurers’ reserves for natural disaster claims in 2025.4 This is a considerable amount, but as long as no more disasters of the same scale occur, these companies still have adequate buffers. For the time being, rating agencies do not expect the losses in Los Angeles to materially affect insurance companies’ ability to achieve their earnings targets for 2025.
One of the reasons why the losses from the Los Angeles wildfires are manageable is that insurance companies have reduced their exposure to fire-prone buildings in this area over several years. The challenge is that more households and firms must now bear the cost of rebuilding. In Los Angeles, it is estimated that of the approximately 10 000 affected buildings, only 25% were insured against fire damage.5 When insurance companies reduce their exposure, insurance premiums may become significantly more expensive, or, at worst, unavailable for some customers. Climate change increases the probability of some types of disasters, such as flooding and forest fires. Some areas are more exposed than others. Insurance companies can choose to avoid these customers by increasing insurance premiums for the highly exposed or by no longer offering coverage in such areas. Keys and Mulder (2024)6 show that US home insurance premiums have risen 33% in the period between 2020 and 2023 alone (17% in real prices). This is primarily because reinsurers have now raised their prices.
It has already been reported that changes in insurance terms and conditions affect access to residential mortgages. The US mortgage companies FannieMae and FreddieMac have reportedly blacklisted properties that they deem to be insufficiently insurable.7 Banks are now sceptical of providing loans if properties are not fully insured or where the deductible is set too high. When lenders are no longer willing to provide mortgages to potential buyers, properties cannot be sold. The cost for the individual homeowner may be high, but such adjustments reduce the risk of banks having to absorb climate-related losses.
The Norwegian Natural Perils Pool reduces insurance companies’ exposure in Norway
In Norway, natural disasters are covered through the Norwegian Natural Perils Pool and the Norwegian National Fund for Natural Damage Assistance. Natural disasters entail damage directly caused to buildings or contents by landslides, avalanches, storms, floods, storm surges, earthquakes, volcanic eruptions, tidal waves or meteorite impacts. Damages resulting from other water ingress, such as stormwater, is not covered. The Norwegian Natural Perils Pool functions like a group insurance scheme where all the insurance schemes that offer fire insurance must include natural disaster insurance. The mandatory premium for participation in the Natural Perils Pool is currently 0.008% of the fire insurance premium. This ensures that all properties are covered against natural disasters and that the costs of such damages are distributed evenly across insurance companies.
The Norwegian National Fund for Natural Damage Assistance is insured to be able to cover damages up to NOK 16bn.8 The largest payout made by the Fund so far was in 2023, slightly higher than NOK 3.7bn.9 This was the year the extreme weather event “Hans” hit Norway, with claims totalling approximately NOK 1.7bn.10 Other years with notable natural disasters include 2011, when payouts amounted to NOK 3.5bn, and 1992, when Norway was hit by a winter storm system just after the new year and payouts amounted to NOK 2.7bn (all in 2023 NOK). Given the historical level of payouts, it appears that Norway has a sound scheme in place to handle natural disasters, which provides additional security for both insurance companies and their customers.
So far, the costs of natural disasters have been limited and distributed over many regions in Norway and payments to the Norwegian Natural Perils Pool have been limited. The legitimacy of the scheme has therefore been high. If payouts from the pool were to increase in some regions at the same time as prices rise substantially, the scheme may come under pressure.
Looking ahead, it may become necessary to increase payments to the Natural Perils Pool to cover expected costs in the years to come. At the same time, insurance premiums for weather-related damage that is not covered by the Natural Perils Pool, such as stormwater intrusion or roof leaks could increase in the coming years. There is therefore reason to believe that insurance costs will rise in the years ahead, also for Norwegian homeowners.
The Norwegian Natural Perils Pool contributes to the high level of insurance coverage in Norway for many types of climate-related damages. A challenge with the current coverage system, however, is that covering all properties automatically at the same price provides less incentive to prevent damage. If damages were to occur, they would be covered by the insurance policy. On the other hand, the cost of damage prevention must be borne by the individual homeowner. Over time, this may contribute to higher insurance payouts. To ensure that the scheme remains sustainable over time, it is important to work proactively on measures to prevent damage caused by natural disasters.
1 Since 1990, this is outlined in Lov om naturskadeforsikring [Act on natural perils insurance] (in Norwegian only).
2 See AccuWeather website for cost estimates. Note that this figure includes costs related to estimated loss of labour input, temporary relocation and damage to public infrastructure. Such costs would normally not be included in claims submitted to private insurance companies.
3 Examples of European reinsurers are Swiss Re, Munich Re and Hannover Re.
6 Keys B.J. and P. Mulder (2024): Property insurance and disaster risk: New evidence from mortgage escrow data. Working paper no. 32579. NBER
7 The law firm Allcock Marcus has published a list of properties.
9 By comparison, the insurance payout for ordinary fire insurance was approximately the same in that year. In 2023, more than NOK 15bn was paid out in motor vehicle claims, see Finans Norge website (in Norwegian only).
10 The single largest payout event in 2023 was, however, not weather-related, but was a NOK 1.2bn claim for a rockslide that hit Norske Skog’s facility in Halden.
Financial institutions provide saving, loans and payment services, and they redistribute risk. To be able to perform these tasks, the institutions must be profitable and robust, even in periods of market stress and increased losses.
2.1 Banks are resilient
Norwegian banks are profitable and solid. In the Bank’s projections, the net interest income and profitability of the largest banks are expected to fall somewhat in the coming years. At the same time, losses are expected to remain at a low level. Nevertheless, a heightened risk of market turbulence and downturn entail that there is uncertainty surrounding developments ahead. In this Report, the largest Norwegian banks are defined as the macro bank, which comprises the seven largest Norwegian-owned banking groups: DNB Bank, SpareBank 1 Sør-Norge, Sparebanken Vest, SpareBank 1 SMN, Sparebanken Sør, SpareBank 1 Nord-Norge and SpareBank 1 Østlandet.1
Norwegian banks are highly profitable
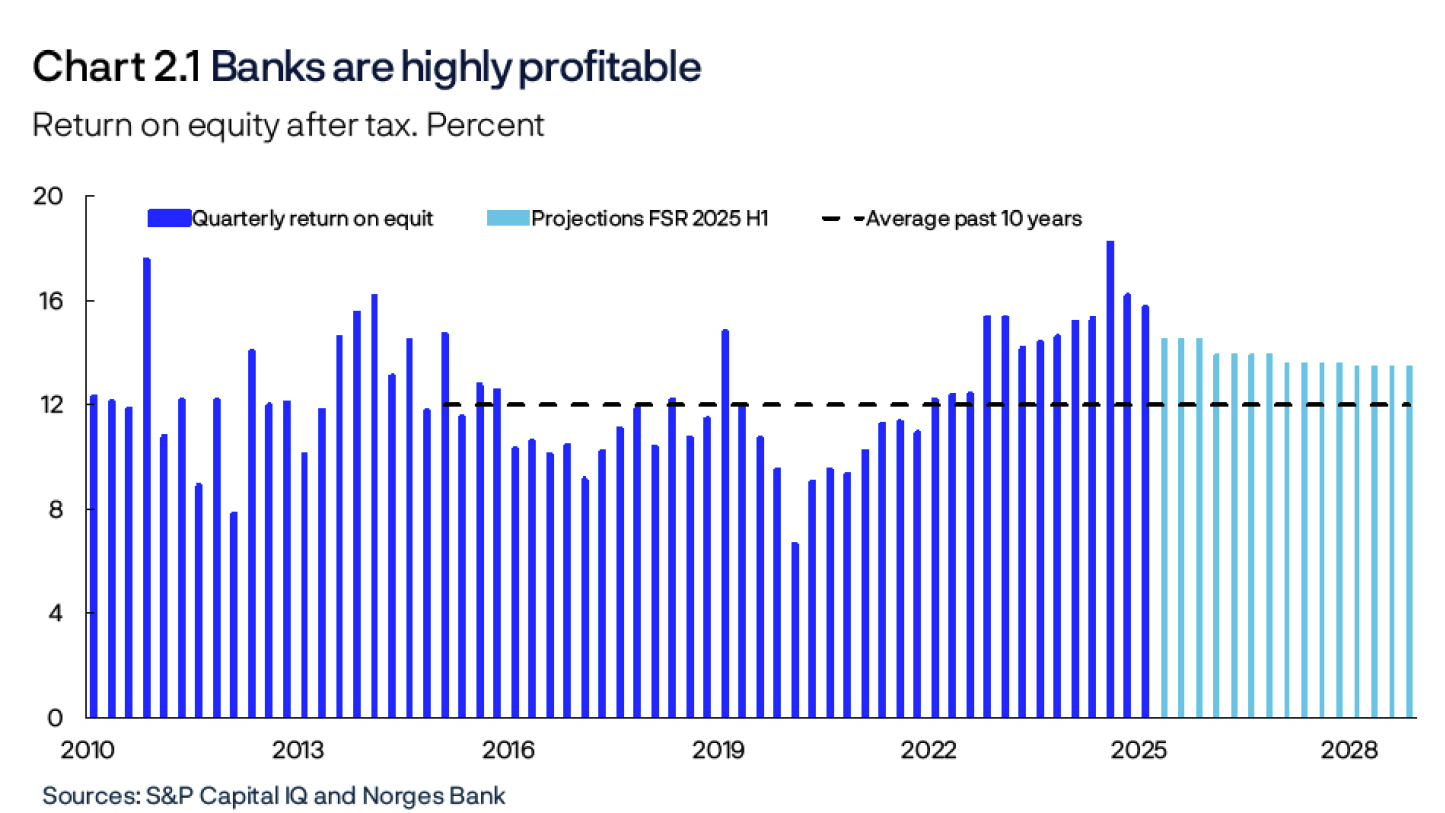
Norwegian banks have been highly profitable through the post-pandemic tightening cycle, and the return on equity in Norway’s largest banks has continued to increase through 2024 (Chart 2.1). This increase in profitability has been mainly driven by increased net interest income and low losses. The return on equity is expected to fall to around 13.5% towards 2028, still well above the average for the past 10 years (Chart 2.1). In 2024, a number of banks revised up their return on equity targets, indicating that the banks expect continued high profitability in the coming years.
Increased profitability in European banks strengthens resilience
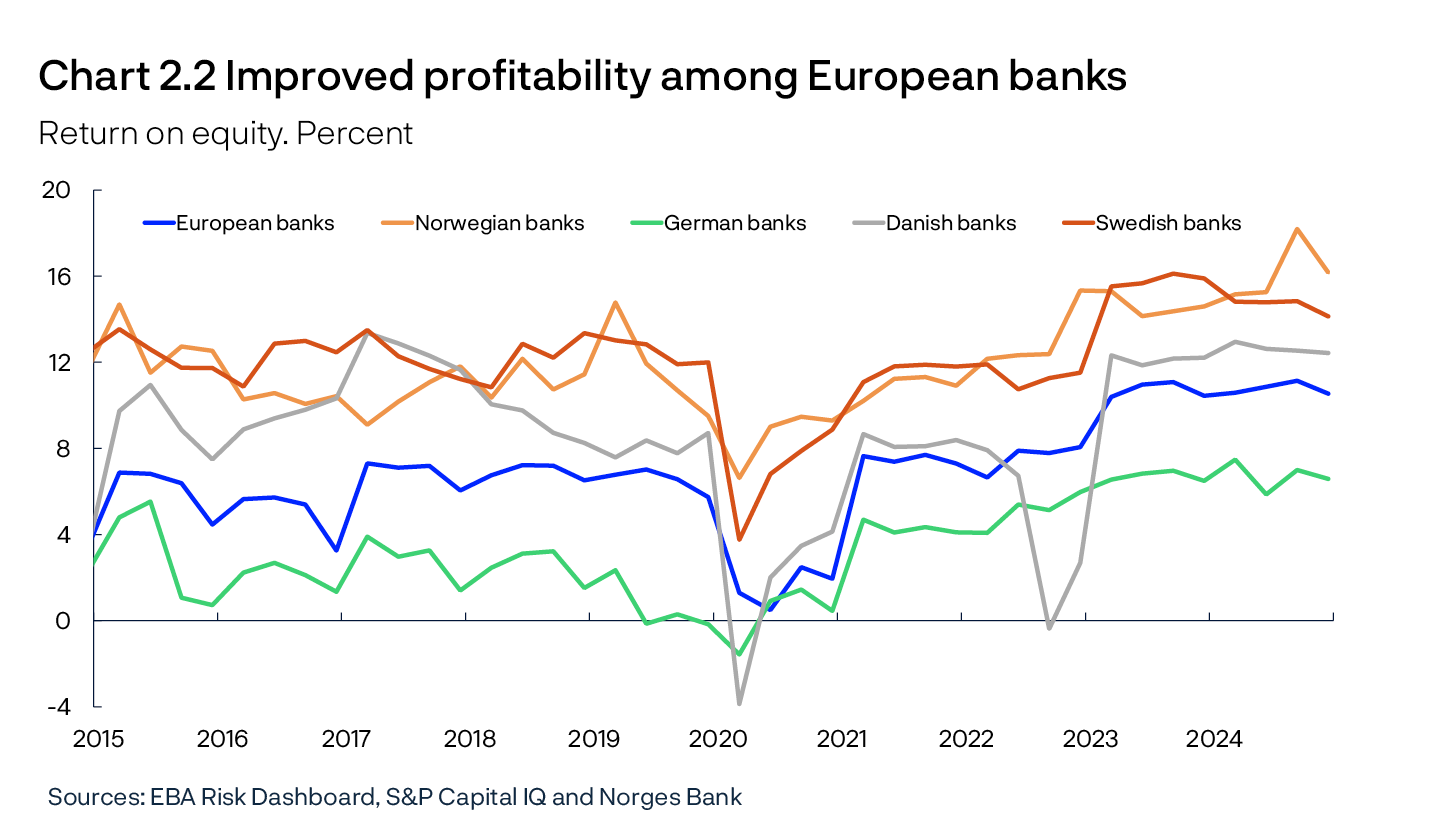
Like Norwegian banks, European banks have increased their profitability through the tightening cycle. At the same time, the profitability of European banks is, in general, lower than Scandinavian banks (Chart 2.2). Increased profitability improves banks’ resilience and provides a stronger foundation to weather capital market stress and to manage economic downturns. Against a backdrop of declining net interest income due to lower interest rates in many European countries, banks’ return on equity now appears to have peaked in a number of countries (Chart 2.2).
Turbulence abroad increases uncertainty regarding future losses
The global economy is marked by uncertainty surrounding the future trade regime (see Section 1). As a whole, Norwegian banks have moderate direct exposure to export-oriented industries, ie those directly impacted by trade restrictions. Just above 15% of banks’ corporate lending is to industries such as fishing, shipping, manufacturing and wholesale trade, but since there are regional variations in industry structure, the exposures of banks with different regional ties can vary. While around a third of corporate lending of some of the large Norwegian banks is to export-oriented industries, the exposure of other large banks is low. Banks are well equipped to withstand substantial losses on loans to these industries. However, if activity levels were to fall sharply and unemployment rise markedly, banks could face large losses on corporate exposures across a broad range of industries. As seen in the past, losses may also increase when market turbulence increases.2 If economic developments are in line with projections in Monetary Policy Report 1/2025, banks’ credit losses are nevertheless expected to remain low.
Credit losses are low
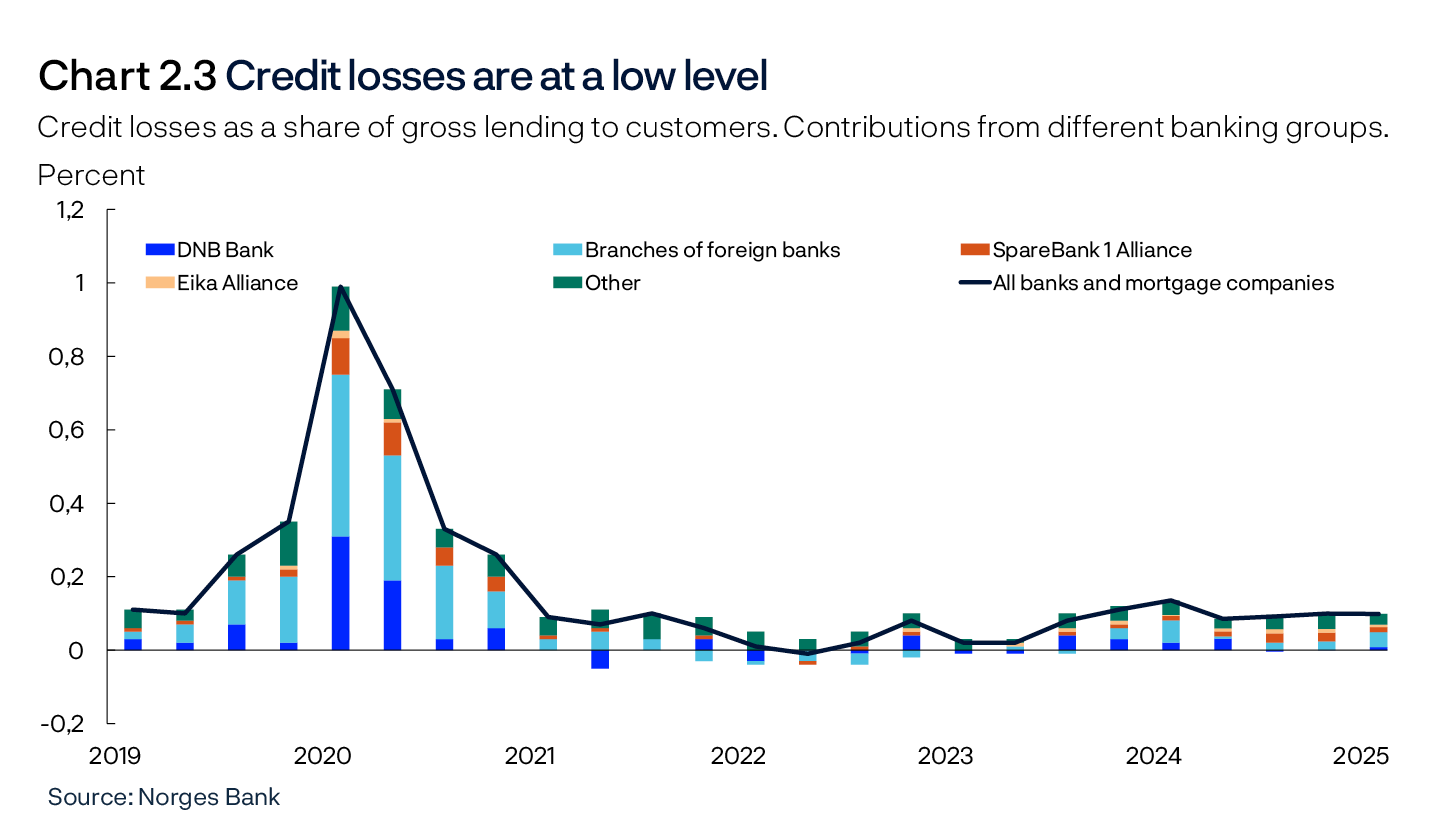
Norwegian banks have had low credit losses through the tightening cycle, and losses also remained low through 2024. Reversals of previous loan loss provisions have pulled down recognised credit losses (Chart 2.3). The share of loans with a significant increase in credit risk (stages 2 and 3 combined) rose slightly through 2022 and 2023 (see box Credit losses and loss provisioning in large Norwegian banks in Financial Stability Report 2024 H1). The impact on banks’ credit losses was small (Chart 2.3). Through 2024, the share of loans with high credit risk fell back somewhat, indicating improved credit quality in banks’ loan portfolios.
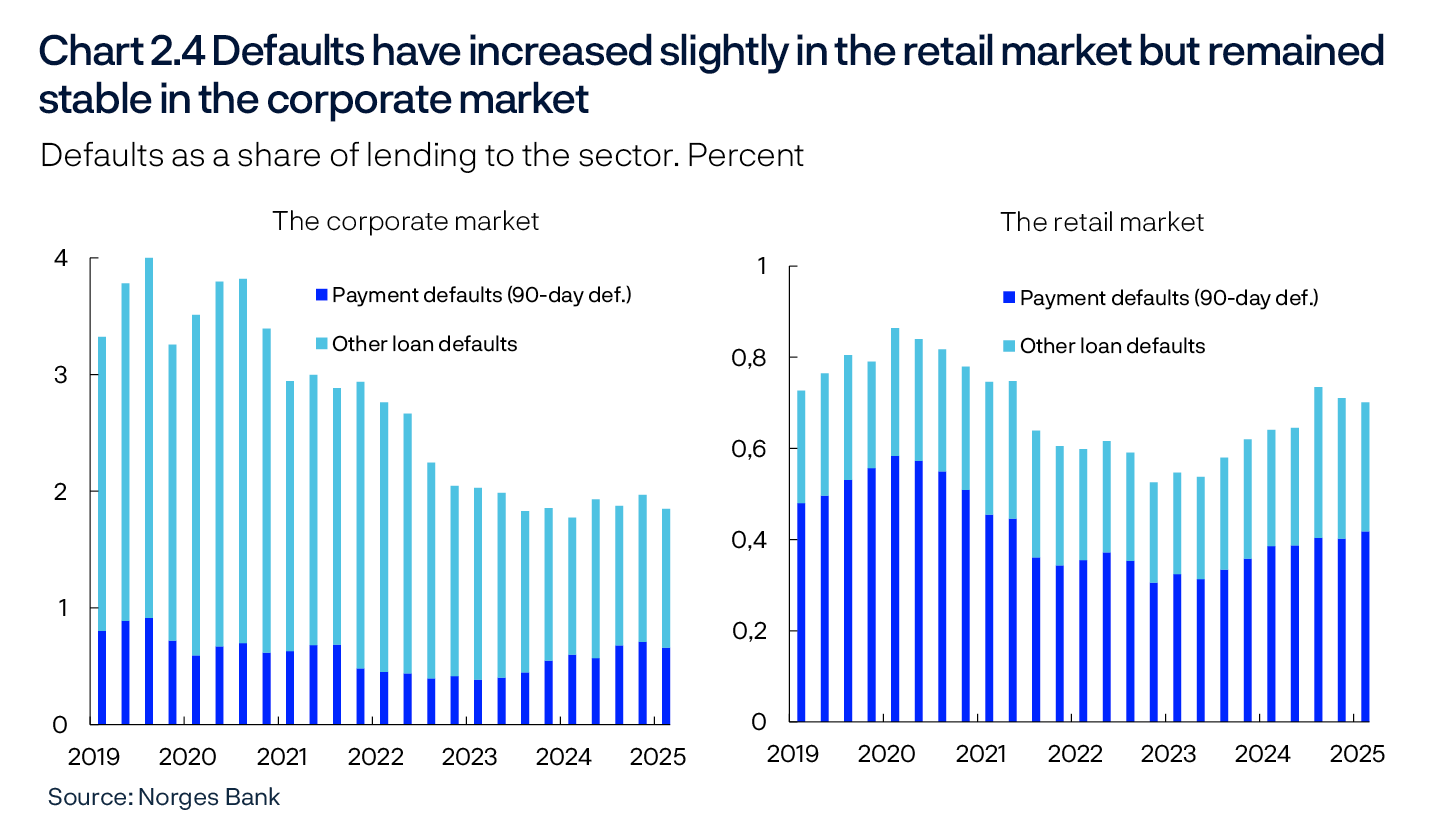
Corporate defaults have fallen steadily for several years from the peak in 2020 and are now at a historically low level. Corporate payment defaults have increased slightly since 2023 (Chart 2.4, left panel). Lower economic growth and weak property market developments in recent years have likely reduced the business sector’s debt-servicing capacity. Since 2023, defaults in the retail market have increased slightly but have levelled off in recent quarters (Chart 2.4, right panel).
The share of corporate bankruptcies has increased since the beginning of 2023 (Chart 2.5). The rise in bankruptcies likely reflects lower economic growth and a normalisation following unusually low bankruptcy figures during the pandemic. The share of corporate bankruptcies is now close to the average for the past 10 years. The increase in bankruptcies has been most pronounced in the real estate sector, reflecting the fact that this sector has been hit particularly hard by rising interest rates and declining construction activity (see discussion in Section 1).
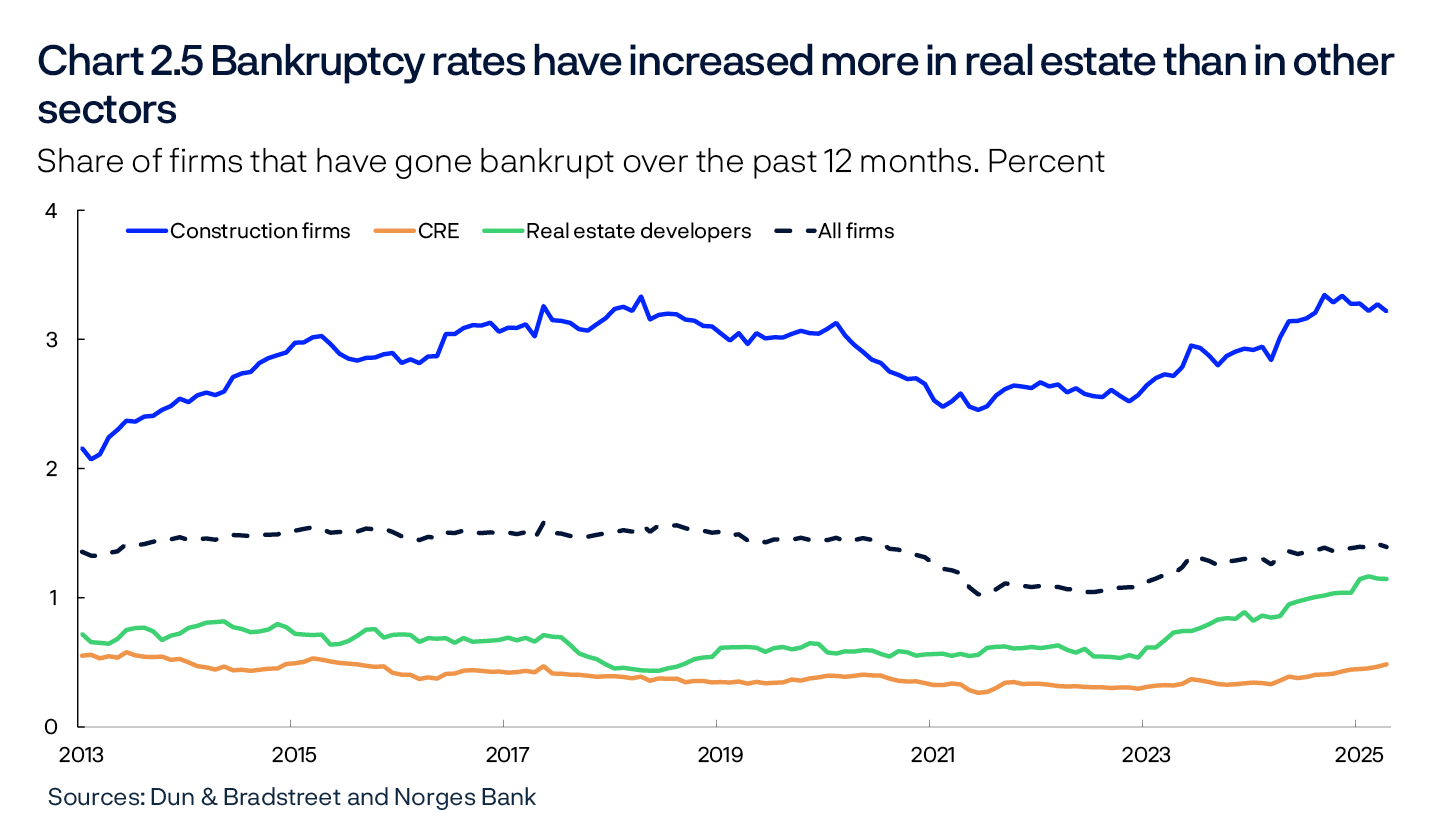
Defaults in the real estate sector have increased significantly, particularly in real estate development (Chart 2.6). In the 2025 Q1 survey of bank lending, half of banks reported that the risk of loan defaults among real estate developers had increased somewhat over the past six months. Continued high interest costs and low construction activity are expected to contribute to somewhat higher defaults and corporate credit losses ahead, with the largest increase in losses expected on loans to real estate developers. See Section 3 in Financial Stability Report 2024 H2 for a detailed discussion on the risk of losses in different industries.
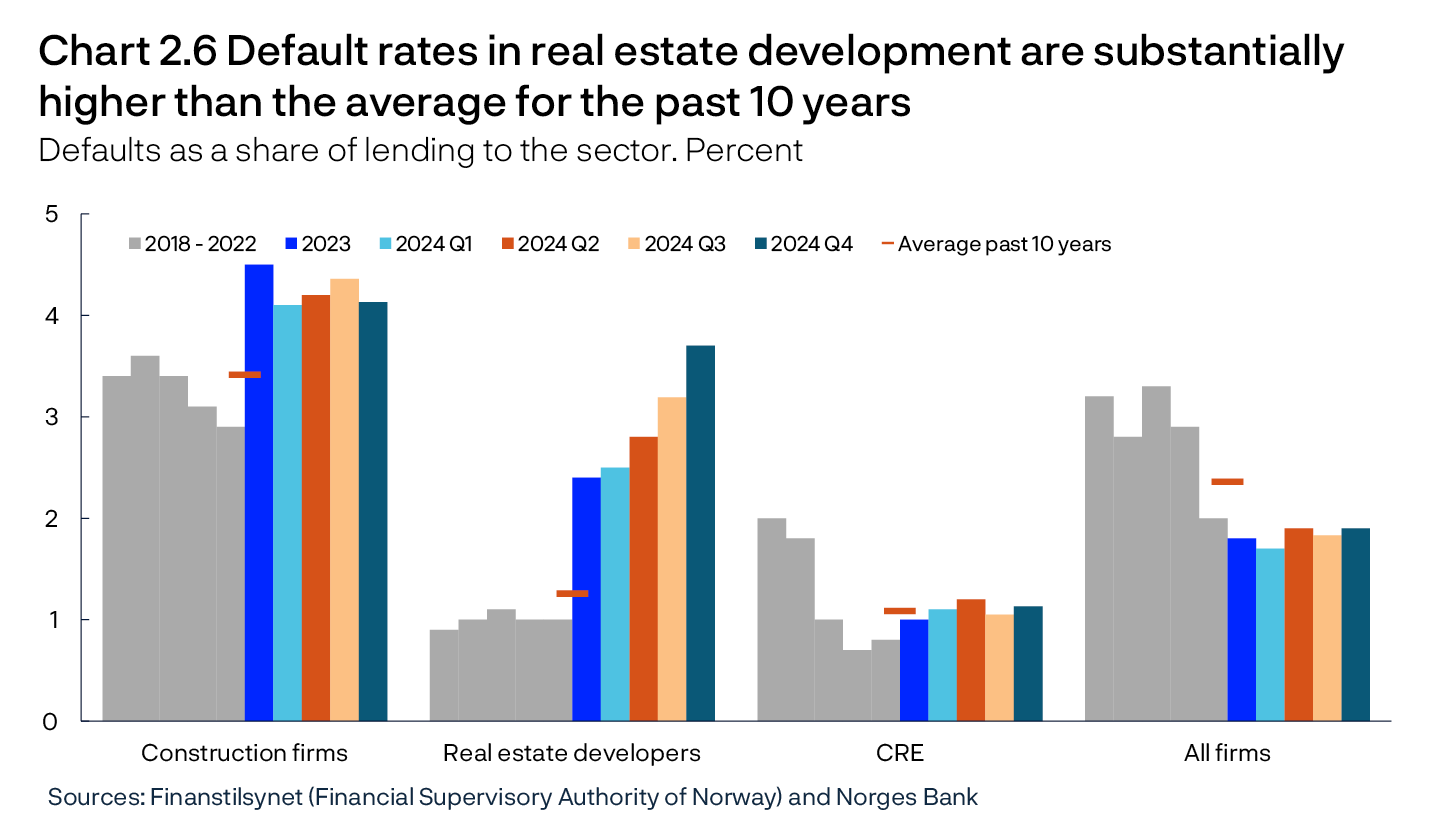
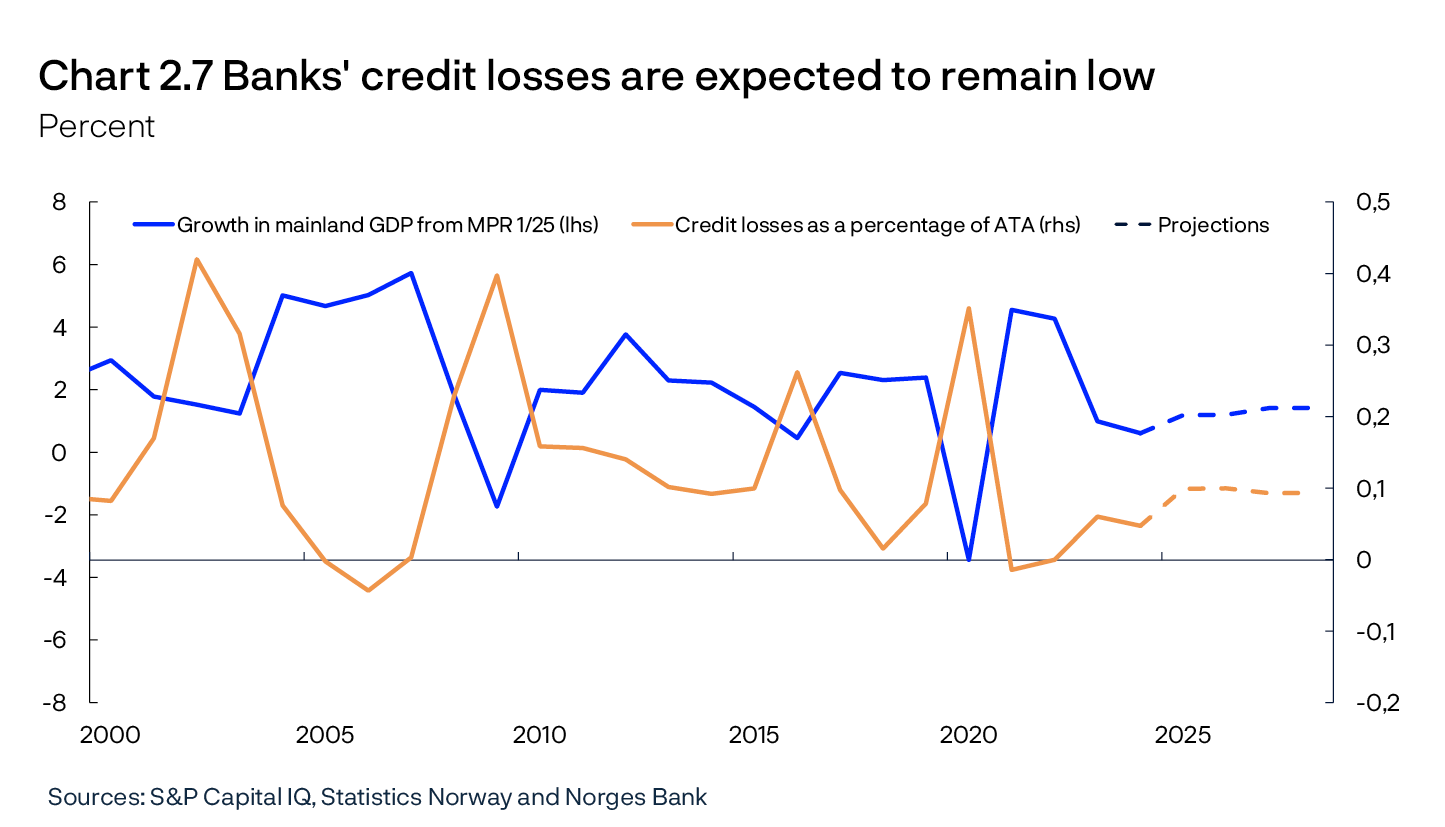
Credit losses as a share of average total assets are estimated to be around 0.1% in the period to 20283 (Chart 2.7). This is close to the average for the past 20 years. In Monetary Policy Report 1/2025, growth in the Norwegian economy is projected to pick up somewhat through 2025. Higher growth and a somewhat lower household interest burden are expected to contribute to keeping bank losses low. On the other hand, conditions are still difficult for some real estate firms, and the outlook for real estate development is uncertain. This pushes up credit loss projections somewhat. At the same time, there is limited potential that credit losses will be pulled down by reversals as the stock of loan loss provisions is now at a low level.
Net interest income and banks’ margins are expected to decrease
A higher policy rate is often followed by higher net interest income because banks hold more interest-bearing assets than interest-bearing liabilities. When the policy rate is raised, interest income will increase more than interest expenses (equity effect). The equity effect has accounted for around half of the increase in net interest income of the largest banks since the tightening cycle began in 2021.4
In addition, changes in interest margins usually lead to increased net interest income when the policy rate is raised. Since the tightening cycle began in autumn 2021, developments in banks’ residential mortgage and deposit rates have diverged. In general, banks’ interest rates have increased less than the policy rate, but lending rates have increased more than deposit rates, which has pushed up banks’ interest margins. Wholesale funding accounts for a large share of banks’ funding, and the increase in net interest income has been restrained somewhat by the fact that market funding rates have risen more than deposit rates.
Chart 2.8 shows that the spread in household deposit rates across banks has widened through the tightening cycle, whereas the spread in residential mortgage rates has narrowed. This may suggest that competition for deposits is weaker than competition for residential mortgages. Historical distributions of similar interest rate series show that the spread in deposit rates is also wider than it was during previous tightening cycles. Through 2024, the spread in residential mortgage rates has continued to narrow, at the same time as the spread in deposit rates remains wide.
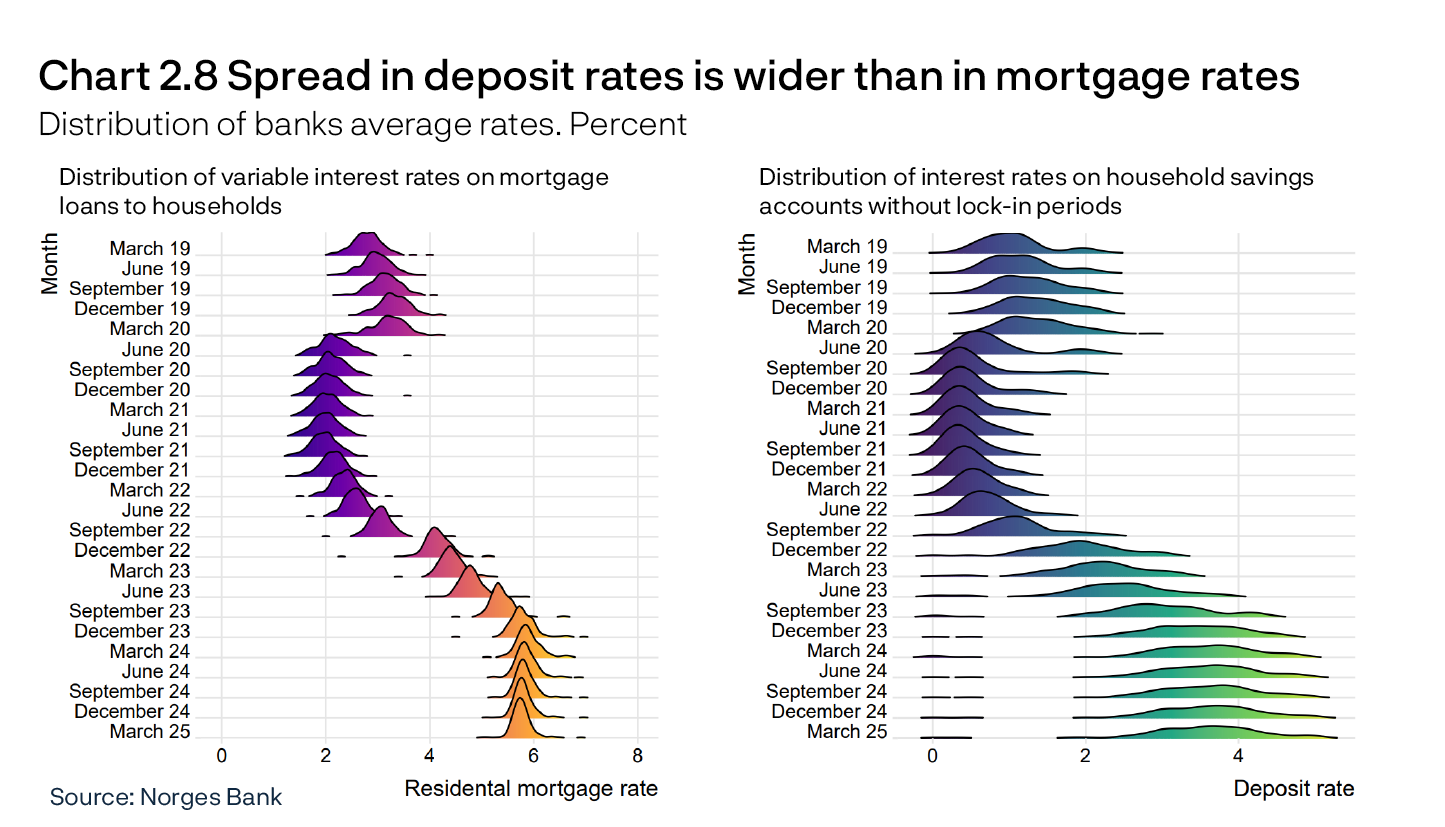
Developments in banks’ deposit rates during the tightening cycle must also be seen in light of banks’ ample access to deposit funding during and after the pandemic. Growth in household deposits declined in the years following 2020 but has edged up again since 2023 H2. Furthermore, banks are reluctant to set deposit rates below zero and have low margins when the policy rate is particularly low. Therefore, deposit margins may have increased considerably owing to the policy rate being raised from a very low level.
In Monetary Policy Report 1/2025, the policy rate is projected to decline in the years ahead. Continued strong competition is expected to contribute to a strong pass-through from the policy rate to residential mortgage rates. This contributes to residential mortgage rates being adjusted slightly more than deposit rates, resulting in banks’ interest margins being gradually reduced somewhat. The decline in banks’ interest margins, together with a lower interest rate level ahead (equity effect), will pull down net interest income and thus banks’ profitability (Chart 2.9).

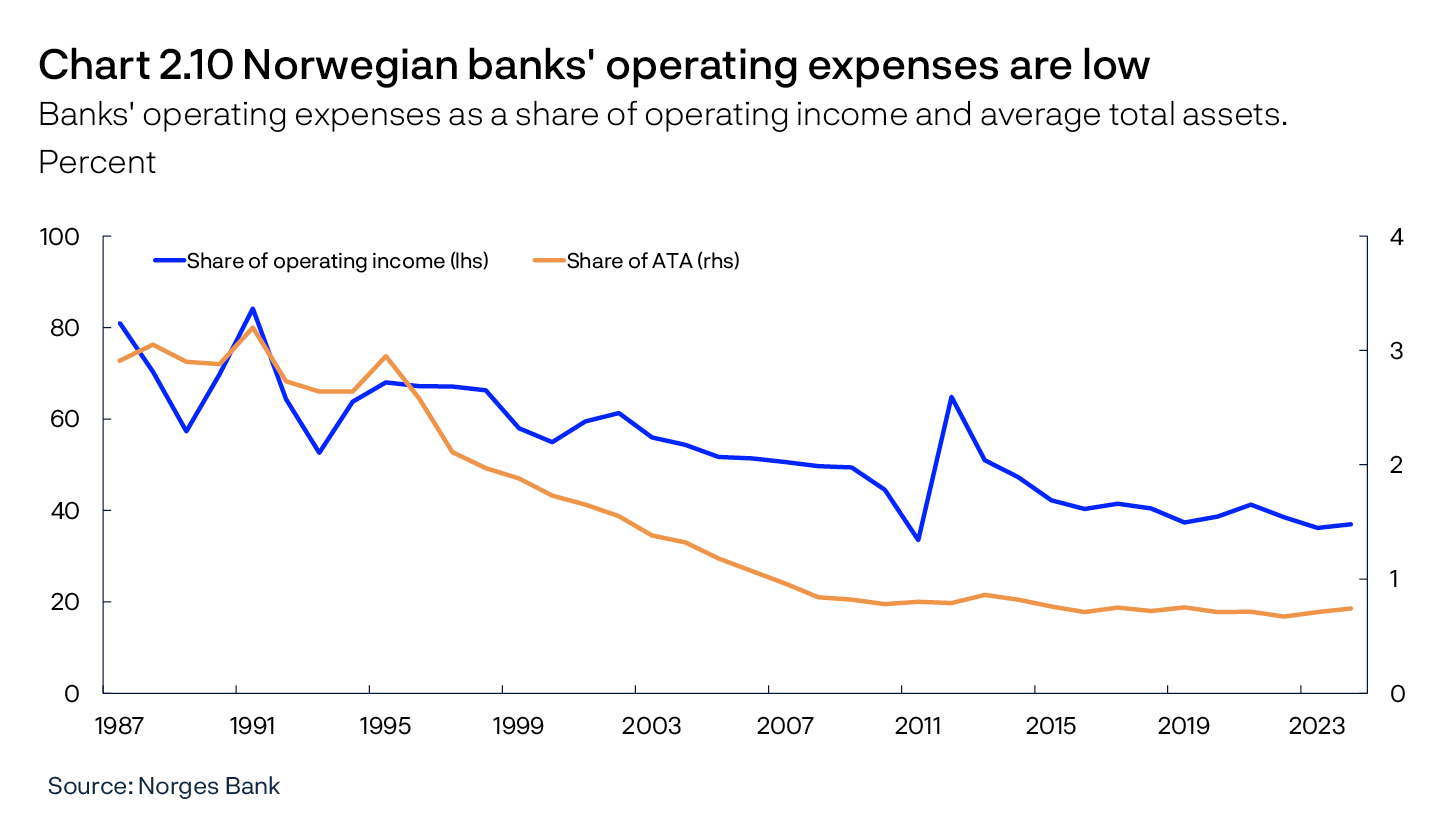
Banks are still cost-efficient
Norwegian banks have reduced operating expenses over recent decades, partly through automation and digitalisation.5 A typical measure of banks’ cost efficiency is operating expenses as a share of banks’ assets or operating income. In recent years, inflation has increased wage and cost growth for firms and banks. Nevertheless, costs as a share of assets and income have remained relatively stable (Chart 2.10).
Norwegian banks have built up buffers and are solid
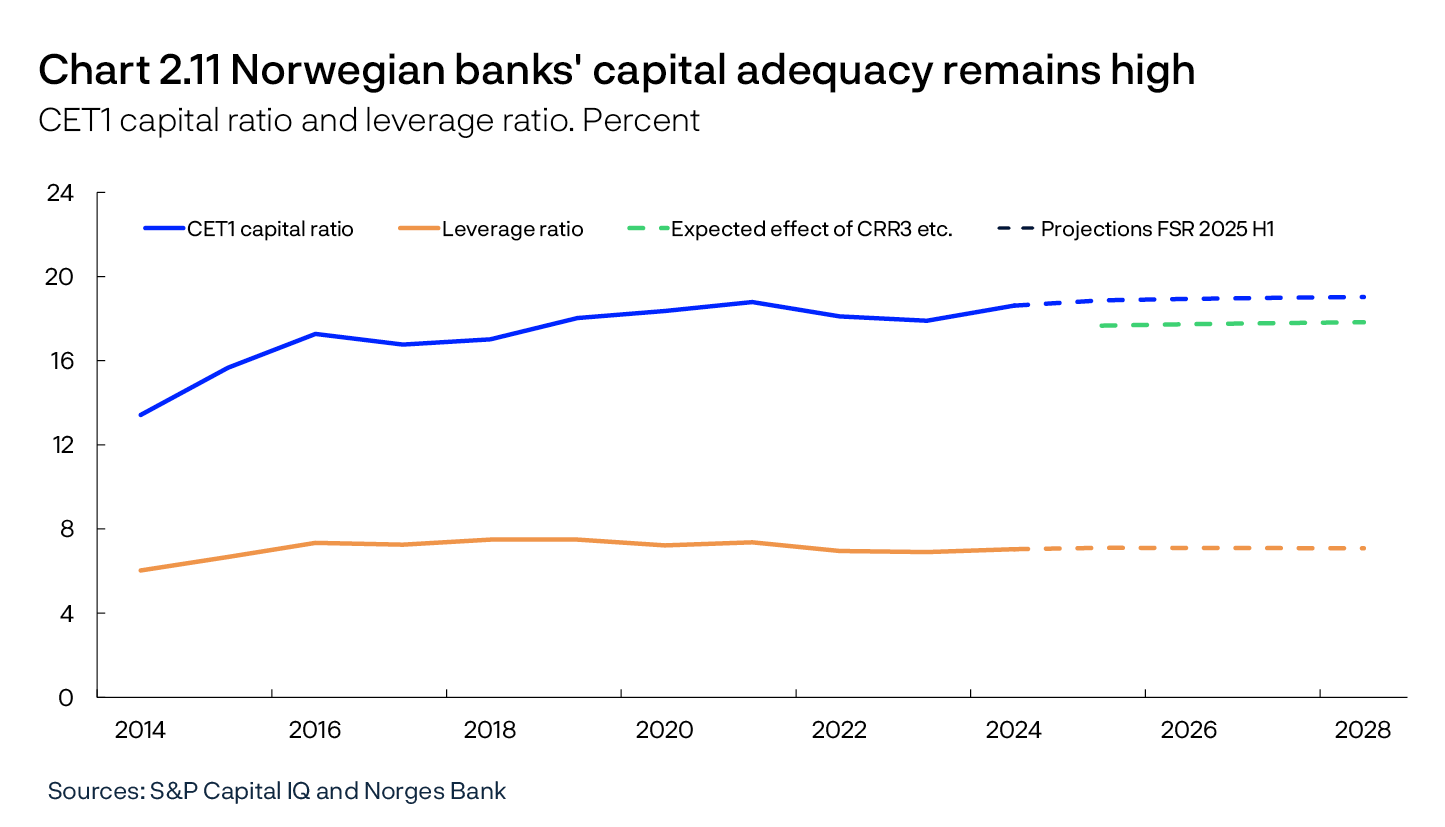
Strong profitability over many years has helped ensure that Norwegian banks on the whole are solid and satisfy the capital requirements by an ample margin. The macro bank’s risk-weighted Common Equity Tier 1 (CET1) capital ratio has remained around 18% since 2019, and the leverage ratio is well above the minimum requirement of 3% (Chart 2.11). The solvency stress test in Section 3 shows that the macro bank has sufficient capital adequacy to deal with a severe downturn, assuming that the countercyclical capital buffer (CCyB) is set at zero. There is some variation across banks in how they perform in the stress test.
Looking ahead, continued high profitability and low losses are expected to keep banks’ capital adequacy ratios at a high level (Chart 2.11). In the projections, new regulations and mergers not reflected in financial statements at 31 December 2024 are not taken into account as there is uncertainty surrounding how banks will adjust to these changes and the effect on the CET1 ratio ahead. In isolation, the amendments to the Capital Requirements Regulation (CRR3) and the increased risk weight floor for residential mortgages for IRB banks will likely reduce the macro bank’s CET1 capital ratio by around 0.5 percentage point. Furthermore, financial statements for 2025 Q1 show that DNB’s acquisition of Carnegie, in isolation, contributed to pushing down the macro bank’s CET1 capital ratio by 0.7 percentage point (Chart 2.11).
1 On 2 May 2025, Sparebanken Vest and Sparebanken Sør merged to become Sparebanken Norge.
2 Simple VAR models for the macro bank that capture the effects of the macro economy and other variables on bank losses indicate that an increase in the VIX index may lead to increased bank losses.
3 The loss estimates are supported by a set of simple VAR models for banks’ credit losses. The VAR models include key macroeconomic variables, such as mainland GDP growth, the policy rate, core inflation and the real exchange rate. The set of VAR models has been expanded to include a broad range of financial indicators, such as commodity prices, real estate prices and expectation indicators, as well as alternative measures of activity and interest rates.
4 See Alstadheim, R. and R. Johansen (2023) Norwegian banks’ net interest income and macroeconomic developments over the past 30 years. Staff Memo 17/2023. Norges Bank.
5 See Andersen, H. (2020). The cost efficiency improvement of Norwegian banks can be explained by automation and digitalisation. Staff Memo 9/2020. Norges Bank.
2.2 Multiple drivers of structural change in the banking sector
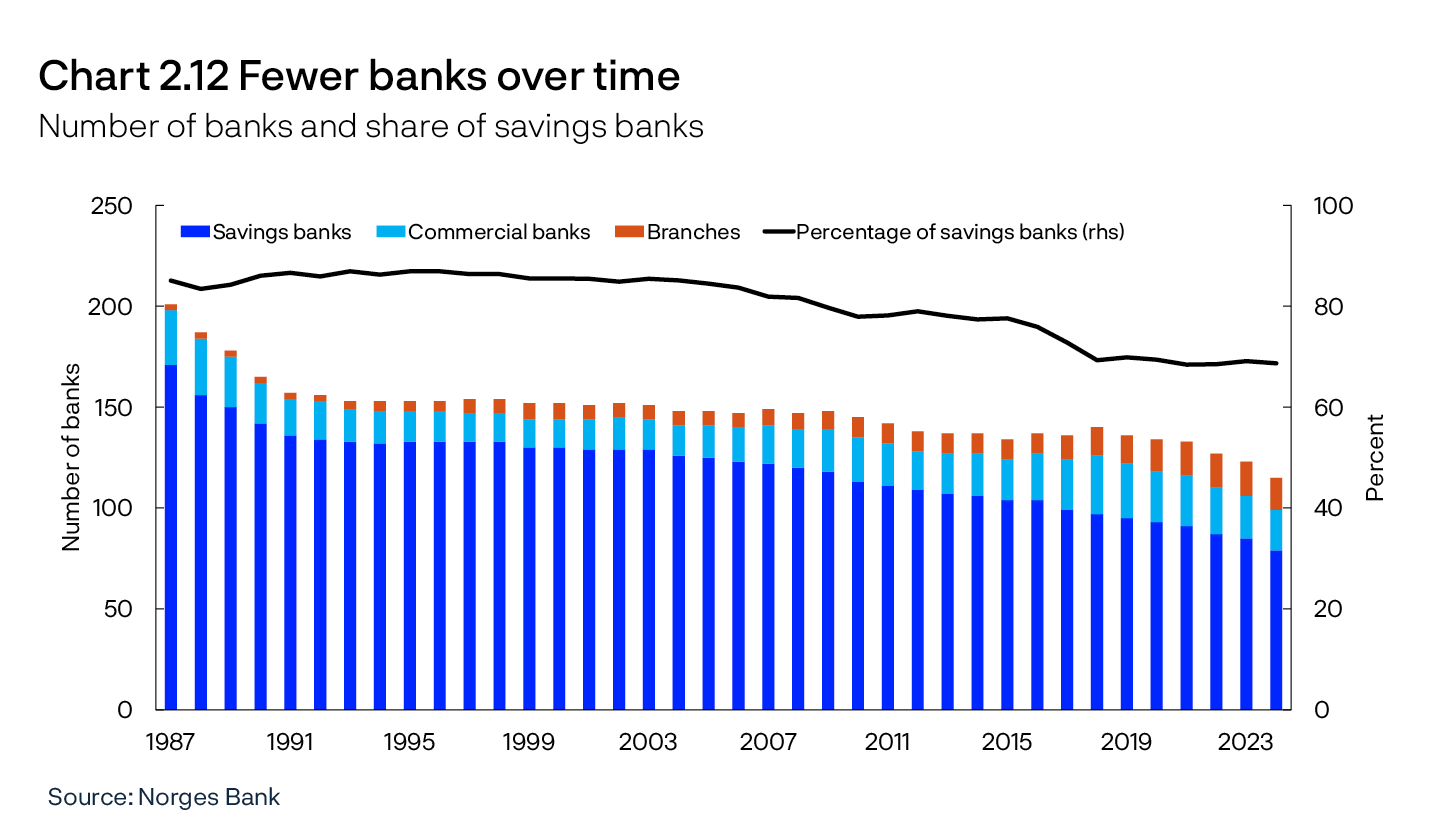
Increased number of mergers in the banking sector
Over the past 20 years, the number of banks in Norway has fallen from around 150 to 120 (Chart 2.12). The Norwegian banking sector consists of various types of banks with different ownership structures and traditions, including savings banks, commercial banks and branches of foreign banks. Over time, the number of branches of foreign banks has increased, while savings banks have become fewer and larger (Chart 2.12).
Competition for banking services fosters innovation and efficiency. Over time, this is important for financial stability. It is uncertain whether increased market concentration resulting from bank mergers has resulted in weakened competition in the banking sector. The degree of competition in the market for banking services depends on many different factors, including the cost of switching banks, customer mobility and whether services are offered by multiple banks or other financial institutions. Customers’ ability to switch banks and choose between different providers of banking services is key to an efficient market with well-functioning competition. Therefore, fewer providers of banking services may weaken competition. On the other hand, mergers may lead to more banks having the capacity to compete in a larger geographical area for larger customers and for a broader range of services, which may strengthen competition and over time strengthen financial stability.
Mergers may make banks more cost-efficient
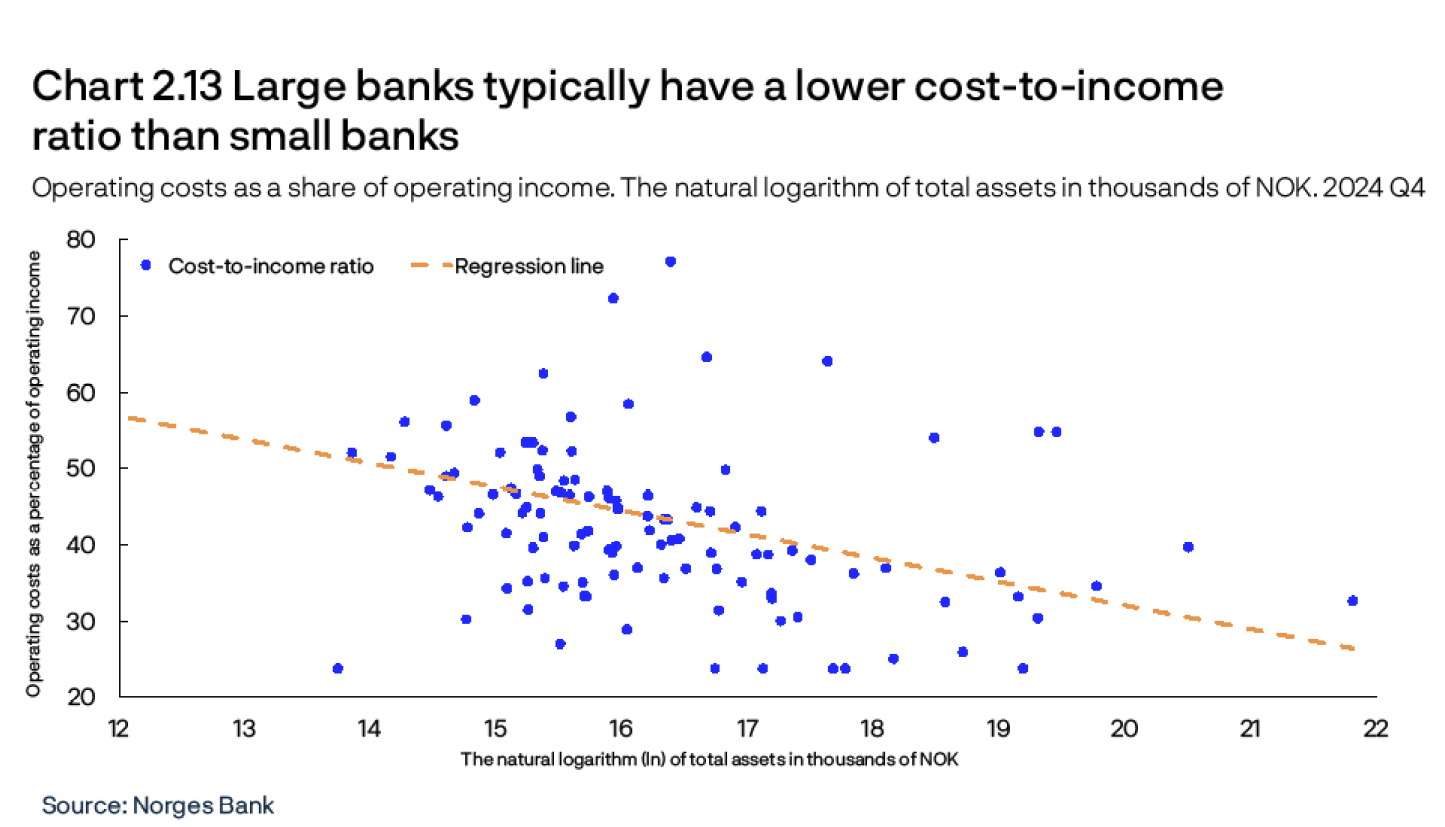
Cost efficiency is a possible reason for bank mergers. If the ongoing mergers in the banking market yield economies of scale, this may result in more cost-efficient institutions and potentially strengthen financial stability if competitive intensity is maintained. The literature supports the existence of economies of scale in the banking sector.6 Data from the Norwegian banking sector indicate that large banks generally have a lower cost-to-income ratio than small banks (Chart 2.13).
Regulatory compliance costs may be another source of economies of scale in the banking sector and one reason why several banks are now choosing to merge. Bank regulation has become more extensive over time. A significant share of compliance costs is fixed and will therefore weigh heavier for small banks compared with large banks. This may make mergers profitable, even though large banks are often subject to more extensive regulations than small banks. Furthermore, the largest banks apply an internal ratings-based approach (IRB) to calculate capital requirements. Such internal models usually result in lower capital requirements than the standardised approach (SA), which small banks must apply. A number of Norwegian banks have reported that the reason for merging with another bank was an easing of capital requirements, as the merged bank can apply the IRB approach for the entire loan portfolio.
Regulatory changes may affect interbank competition
Transposing the CRR3 into Norwegian law affects both SA and IRB banks (see discussion in Financial Stability Report 2024 H2). The changes to the standardised approach, which entered into force on 1 April 2025, mean that SA banks will have lower capital requirements for low-risk exposures. At the same time, the decision has been made to increase the risk-weight floor for residential mortgages for IRB banks from the current level of 20% to 25%, with effect from 1 July 2025.
The changes to the standardised approach will reduce differences in capital requirements between large and small banks. In isolation, this may strengthen the competitiveness of small banks, in particular for low-risk loans. On average, the new risk-weight floor for IRB bank residential mortgages will be binding and thus result in increased capital requirements for the largest Norwegian banks. In isolation, the changes pull in the direction of somewhat weaker incentives for applying the IRB approach. This may in turn slightly reduce the attractiveness of mergers where the intention is to apply the IRB approach on the entire new bank’s loan portfolio. On the other hand, the wish to exploit economies of scale may still pull in the direction of more mergers.
Proposed changes may result in a simplified capital structure and increased transparency in the savings bank sector
In its report, the Savings Bank Committee proposed a new capital structure for equity certificate banks that is less complicated than the current ownership structure.7 In the proposed equity share model, primary capital and equity share capital are treated equally, with the same loss absorption and priority for the two types of equity. This means that the equity share model can satisfy the CET1 capital requirements under the CRR3. A clearer and straightforward capital structure will also simplify the assessment of banks’ financial positions, solvency and compliance with regulatory requirements. Norges Bank supported the proposal for the equity share model in its consultation response but noted that such a model is nevertheless more complex than the capital structure of pure primary capital banks or limited liability savings banks. Furthermore, Norges Bank supported the Savings Bank Committee’s proposal that banks themselves can choose whether to organise themselves as a primary capital bank, an equity share bank –cf the equity share model – or a limited liability savings bank.
The Committee also proposed removing the option to pay out customer dividends. When customer dividends are paid out, payments are made to customers depending on the size of their loans and/or the deposits they have had over the preceding year. Customer dividends help maintain a high ownership ratio, making it more attractive to invest in savings banks with customer dividends. This may improve access to equity and facilitate recapitalisation in bad times. On the other hand, customer dividends may weaken competition in the banking sector because lending and deposit rates become less transparent, which makes it harder to compare prices across banks (see Financial Stability Report 2022). Norges Bank supported the Committee’s proposal to remove the option to pay out customer dividends, in particular because it makes the comparison of banks’ rates more complicated and thus weakens competition.
6 See eg: Wheelock, D. C., and P. W. Wilson (2018). The Evolution of Scale Economies in U.S. Banking. Journal of Applied Econometrics, Vol. 33(1), pp 16–28; Kovner, A., J. Vickery and L. Zhou (2014). Do Big Banks Have Lower Operating Costs?. FRBNY Economic Policy Review Vol. 20(2); Hughes, J. P., and L. J. Mester (2013). Who said large banks don’t experience scale economies? Evidence from a risk-return-driven cost function. Journal of Financial Intermediation, Vol. 22(4), pp 559–585.
7 NOU 2024:22. "Norske sparebanker – tradisjon og tilpasning" [Norwegian savings banks – tradition and adaptations] (in Norwegian only).
2.3 Non-bank financial institutions influence systemic risk
Important functions in the financial system are performed by non-bank financial institutions (NBFIs)8, such as insurance companies, asset managers and investment funds.9 Banks have historically been subject to fairly strict regulation because they engage in maturity transformation, take on liquidity risk and create money in the form of deposits. In recent years, the European Systemic Risk Board (ESRB), the Financial Stability Board (FSB) and the International Monetary Fund (IMF) have called for stricter regulation of NBFIs (see further discussion in “Need to expand macroprudential supervision to non-bank financial institutions”), and the potential contagion of stress from NBFIs to the rest of the financial system has gained increased attention.
The share of total assets held by NBFIs has increased over time
In many countries, including Norway, the total assets held by NBFIs have grown more than the total assets held by banks. From 2013 to 2023, Norwegian NBFIs’ share of the financial sector’s total financial assets rose by around 4 percentage points, the same as in euro area countries (Chart 2.14). NBFIs’ share of these financial assets in Norway is around 40%, compared with more than 50% in euro area countries.
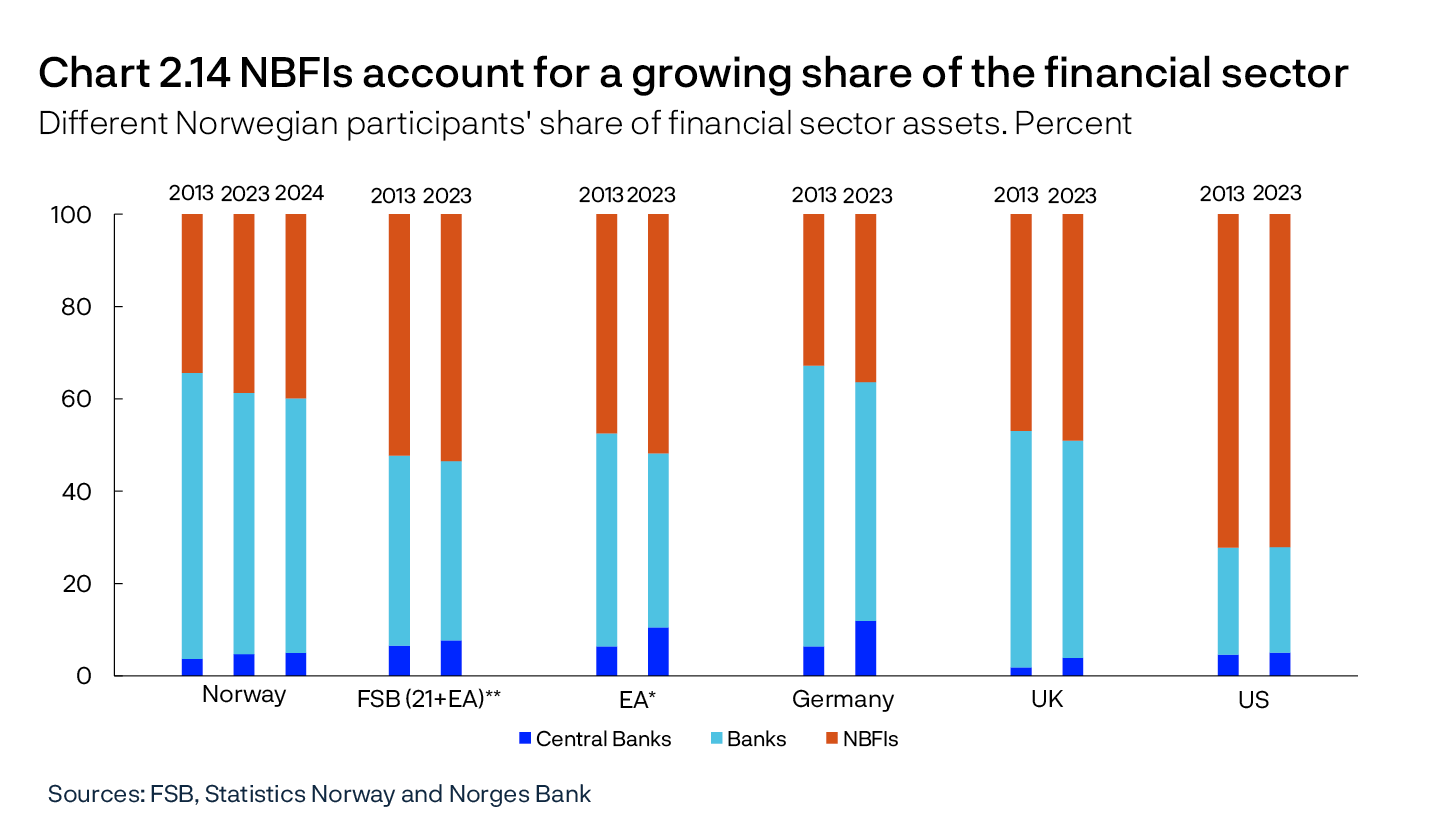
The Norwegian financial sector is part of the global financial system. This gives interconnectedness between countries through global financial markets, transactions with non-Norwegian counterparties and cross-border activities by non-Norwegian financial institutions. The importance of NBFIs for the Norwegian financial system therefore depends on both Norwegian and international NBFIs.
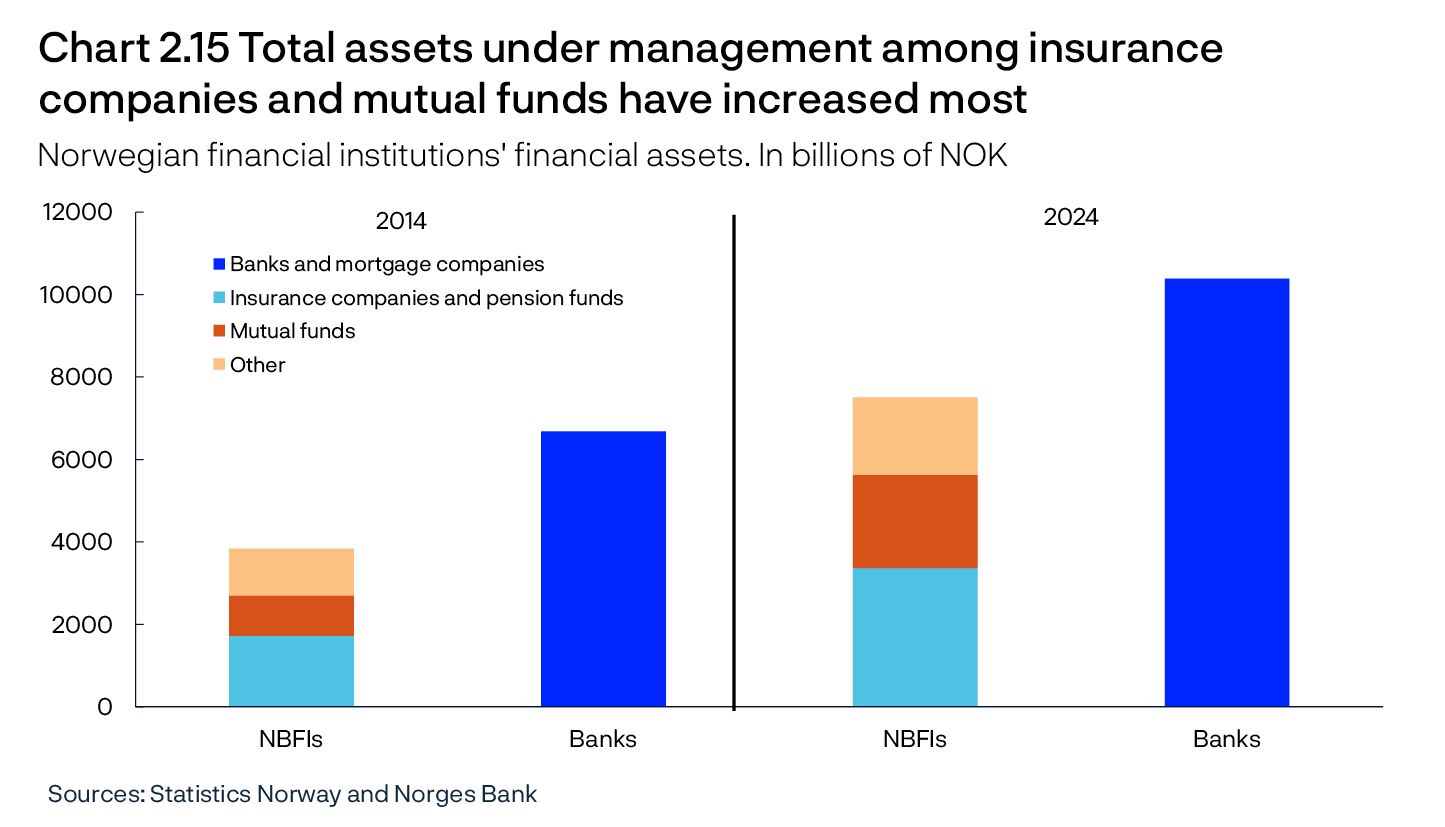
Insurance companies and mutual funds have shown the strongest growth
The largest groups of financial institutions among NBFIs are insurance companies and mutual funds (Chart 2.15). These financial institutions are large in size and have grown over the past 10 years due to the fact that they manage a large proportion of long-term savings. Life insurance companies and pension funds manage pension savings and these savings are partly invested in mutual funds.
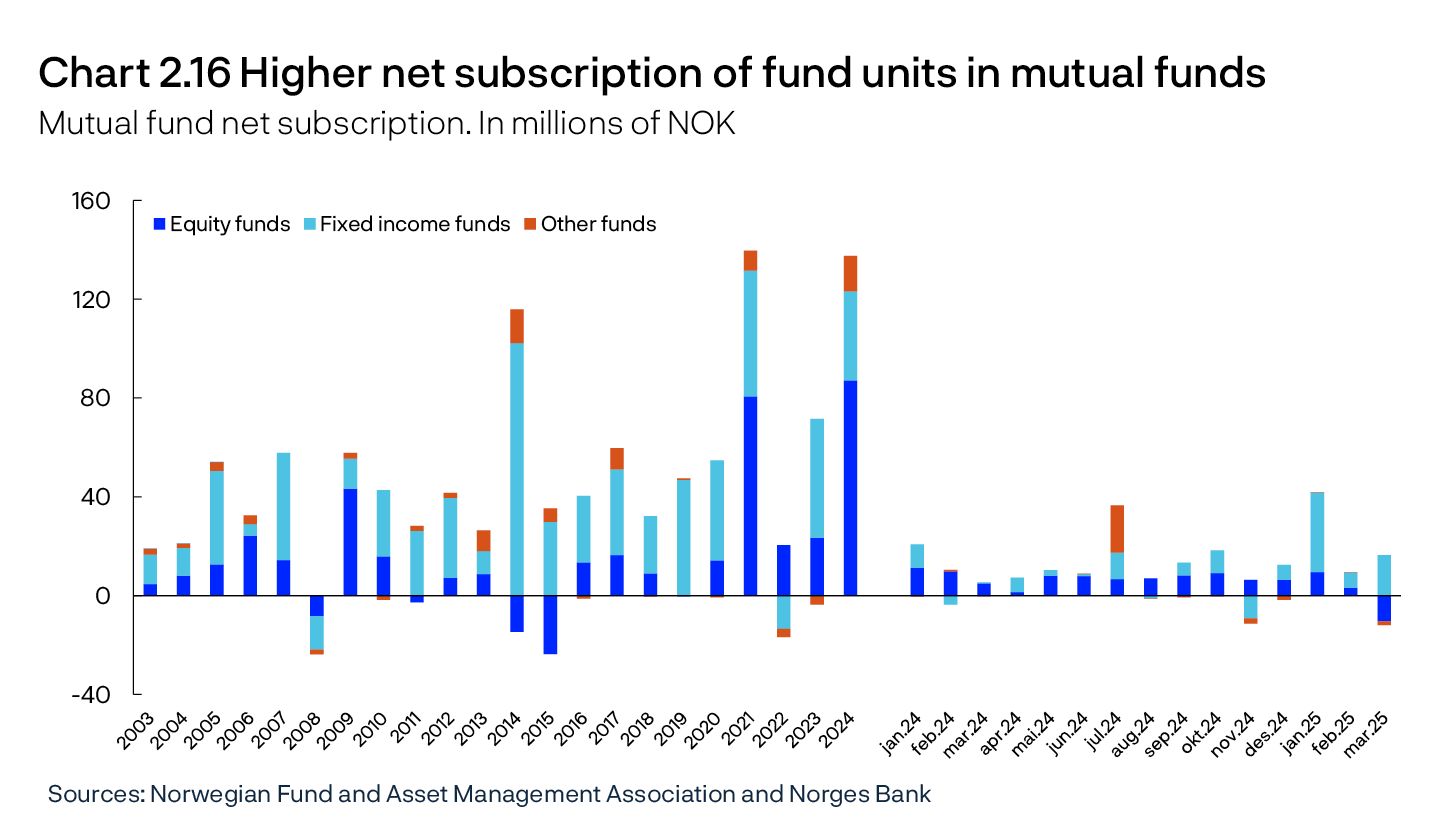
The increase in mutual funds’ total assets is due to the rise in the value of securities and the net subscription of fund units. In the period since 2003, net subscriptions on an annual basis were positive apart from in 2008 (Chart 2.16).10 Since January 2024, net fund subscription has been positive every month with the exception of November 2024.
A number of proposed regulatory changes for mutual funds
In 2024, a number of mutual funds relocated from Norway to countries such as Sweden and Finland. Disadvantageous regulation of Norwegian-registered funds were given as the reason for the relocations. Another cited reason was lower administration costs when the funds are based in one country.
The authorities have changed and are currently changing some of the regulatory framework for mutual funds and their asset managers.11 A primary objective of these changes is to strengthen the competitiveness of the Norwegian mutual fund sector. It remains to be seen whether the proposed changes will reduce the relocation of mutual funds. Over time, the relocation of mutual funds may impact the activity of asset management companies, potentially resulting in more employees being based abroad than in Norway. Asset management companies and the mutual funds themselves decide where their operations are to be registered.
Through cross-border activities, foreign funds offer savings and investment opportunities to Norwegian customers, they invest in Norwegian securities and act as counterparties in derivative transactions with Norwegian financial institutions. Relocated funds therefore retain their significance for the financial sector in Norway, but the direct regulation of these funds by Norwegian authorities is reduced.
The share of loans from Norwegian NBFIs is low, but the ownership share of bonds issued by non-financial corporates is high
Norwegian NBFIs account for only a small share of loans to households and non-financial corporates, but mutual funds, life insurance companies and pension funds hold a significant share of bonds issued by non-financial corporates. In total, securities lending and direct lending from NBFIs accounted for around 20% of domestic credit to non-financial corporates and around 3% to households at the end of 2024. This share has changed little over the past 10 years. By comparison, banks and mortgage companies account for around 80% of domestic credit to non-financial corporates and around 90% to households.
Interconnectedness between NBFIs and banks
Direct ownership of one another’s equity or liabilities is an example of direct interconnectedness between NBFIs and banks. Direct ownership may be positive for financial stability through increased diversification but may be undesirable if ownership is concentrated among a few financial institutions or similar financial institutions that will act uniformly during for example market turbulence.
Asset managers are often banks’ counterparties in derivative contracts. Moreover, banks enter into repurchase agreements (repos) with hedge funds (see “Hedge funds own an increasing share of covered bonds issued in NOK” in Section 1). Such interconnectedness, combined with the fact that NBFIs are key owners of banks’ issued debt, may lead to financial stress spreading from different types of institutions to banks.
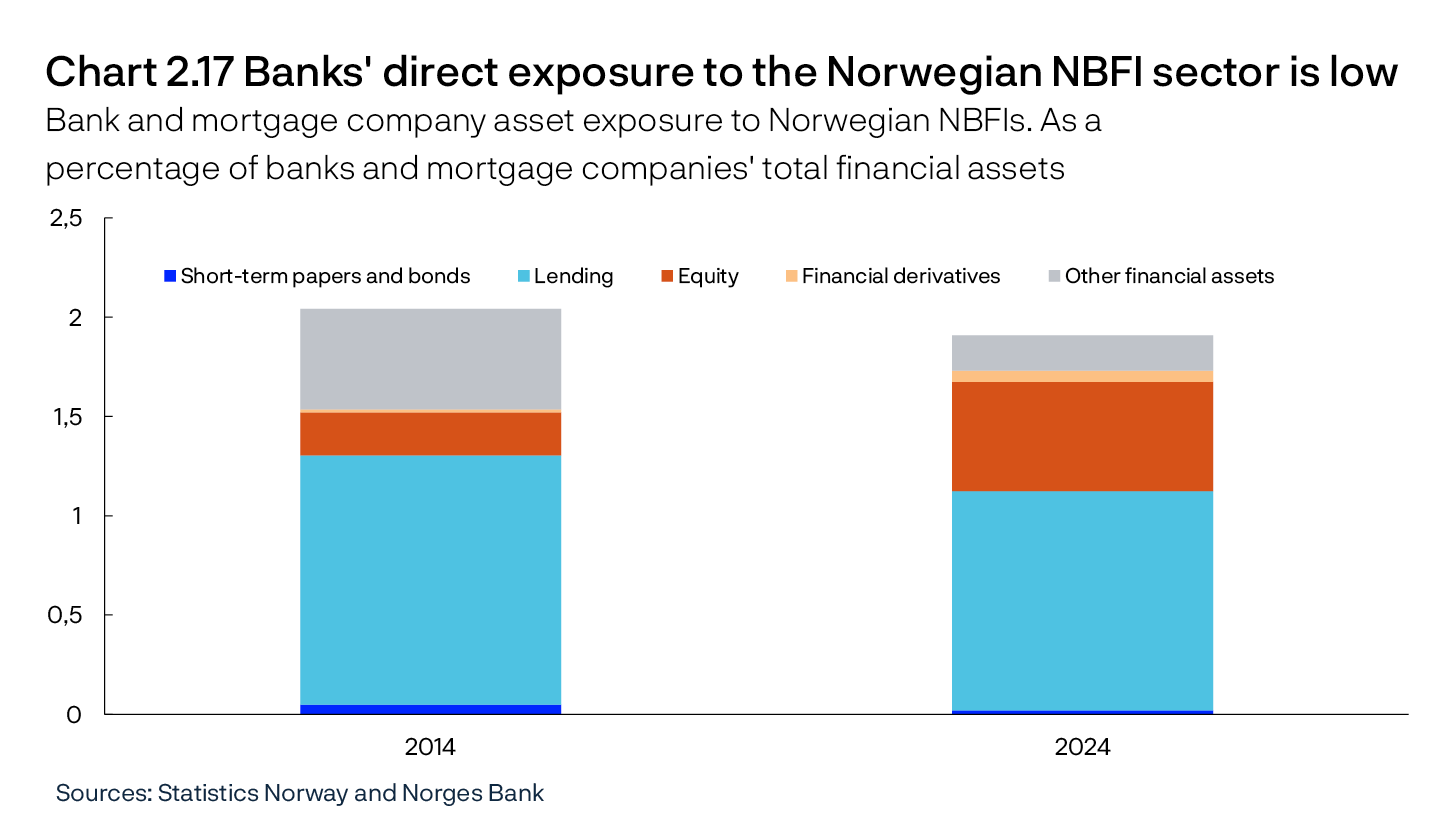
Banks’ and mortgage companies’ direct asset exposure to Norwegian NBFIs was just under 2% of total claims at the end of 2024 (Chart 2.17). This share has fluctuated over time but has remained around 2% since 2012. The largest exposure is to financial institutions in the group “other financial corporations”12 and this is related to bank lending and banks’ ownership share of equity issued by NBFIs (Chart 2.17). In addition, there is exposure to the non-Norwegian NBFI sector, which is difficult to quantify owing to a lack of data. Foreign NBFIs’ cross-border activity with Norwegian banks is shown in official statistics, such as in financial sector accounts, under the broad category “abroad”. There is therefore a need for more data and analyses in this area and data collection initiatives have been made both in Europe and internationally (see “Need to expand macroprudential supervision to non-bank financial institutions”).
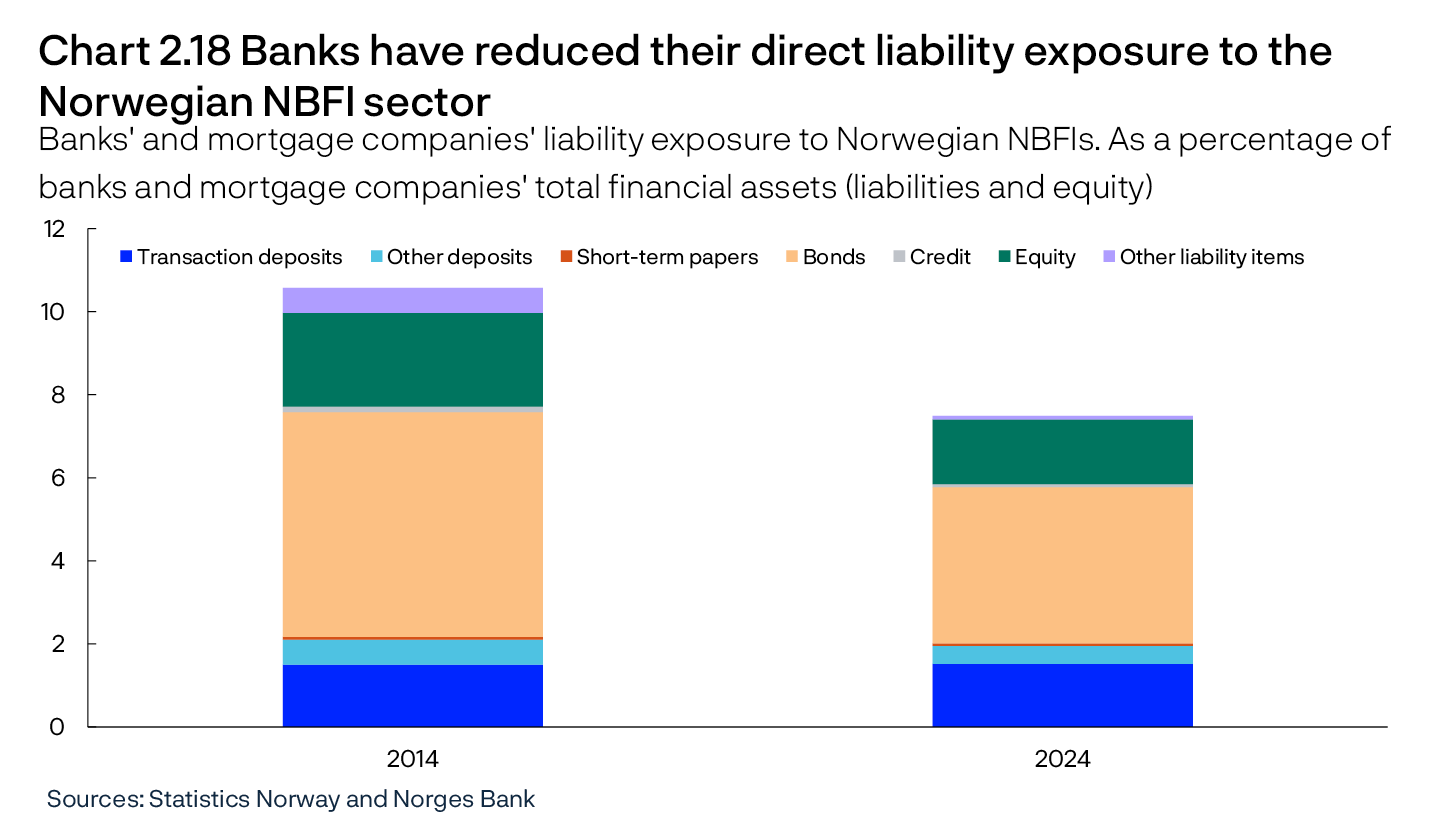
Banks’ and mortgage companies’ direct liability exposure to Norwegian NBFIs on their balance sheets was 7.5% at the end of 2024 (Chart 2.18), of which, Norwegian NBFIs’ deposits in banks accounted for around 2%, equity holdings accounted for 1.6% and bond holdings accounted for around 3.8%. Direct liability exposure to the Norwegian NBFI sector has varied over time and has shown a downward trend since 2018. The largest exposure was to mutual funds and insurance and pensions firms.
Life insurance companies, pension funds and mutual funds are key participants in securities markets
Even though banks’ direct exposure to Norwegian NBFIs is relatively low compared to banks’ total assets, the Norwegian NBFI sector is important for banks’ wholesale funding. At the end of 2024, Norwegian funds and insurance and pension companies held just under 30% of bonds issued by banks and credit institutions registered in the VPS (Norwegian Central Securities Depository) (Chart 2.19).13 Moreover, Norwegian NBFIs can contribute to banks’ funding by owning bonds that are not registered in the VPS.
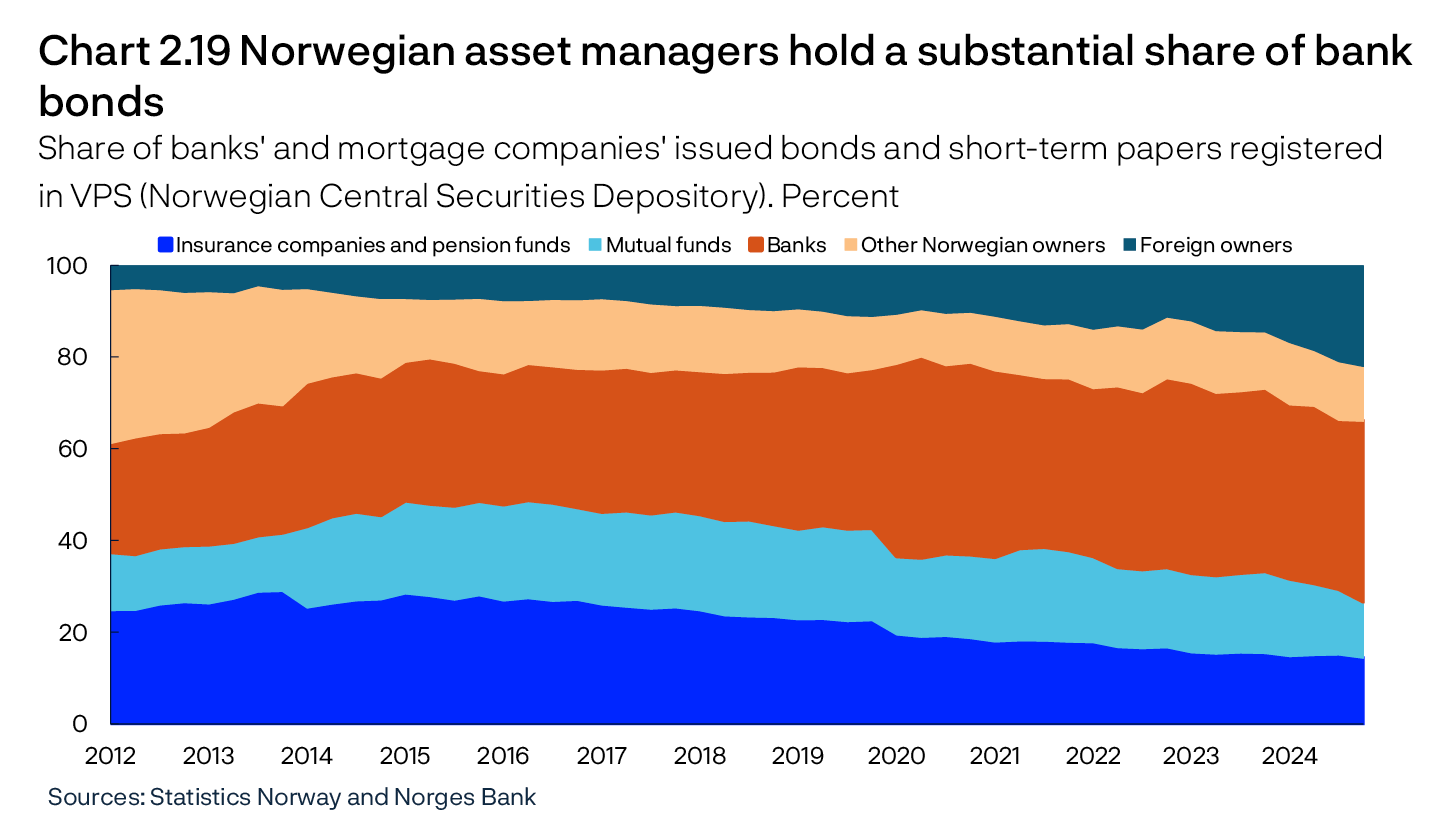
Banks hold one another’s covered bonds in their liquidity portfolios (see Section 3), which is reflected in the fact that banks hold just under 40% of bonds registered in the VPS (Chart 2.19). In recent years, foreign ownership has increased to 16%.
If many asset managers rebalance their portfolios at the same time and sell large holdings of equities or bonds, prices may be significantly reduced when market liquidity is low. One reason why asset managers sell securities at the same time may be the need to raise liquidity for collateral (margining) for currency hedging contracts (see box below).14, 15 Accepted forms of collateral are agreed upon when entering into derivative contracts and these are usually bank deposits and to a certain extent safe bonds. Bank deposits can be obtained by selling securities in the market or using repos. In spring 2020, direct sales of bonds in the market contributed to a significant rise in credit premiums. Figures from a sample of asset managers show that the extent of currency hedging is still high (see box below). Moreover, the survey shows that the ability to pledge securities as collateral has increased.
8 NBFI is an abbreviation for non-bank financial Institutions or non-bank financial intermediation.
9 See Section 2 of Norway’s Financial System 2024 for a description of financial institutions.
10 Note that foreign-registered funds are not included in the mutual fund statistics from Statistics Norway. Foreign-registered funds marketed in Norway are included in the market statistics from the Norwegian Fund and Asset Management Association.
11 In November 2024, the Ministry of Finance began allowing currency hedging within different share classes in a fund. In January 2025, the Ministry of Finance submitted a consultation proposal to change taxation of mutual funds and their unit holders. The Ministry of Finance has also submitted a consultation proposal to allow income-sharing agreements between asset management companies and unit holders.
12 This group comprises finance companies, financial holding companies, financial auxiliaries, state lending institutions, state investment companies and other investment companies.
13 Based on ORBOF accounting statistics, bonds (covered bonds, bank bonds, and certificates) accounted for approximately 30% of banks’ and mortgage companies’ total assets at the end of 2024. Just under 50% of these bonds are registered in VPS. The share of VPS-registered bonds held by funds and insurance and pension companies is therefore less than 4%, measured in relation to banks’ and mortgage companies’ total assets.
14 Other reasons are outlined in the box on page 51 in Financial Stability Report 2022.
15 Margins pledged are referred to as initial margin and variation margin, see discussion in the box on page 13 in Financial Stability Report 2022. For OTC FX swaps, no initial margin is required.
Survey of Norwegian asset managers
Since the end of 2023, Norges Bank has collected data from a sample of asset managers about their currency hedging against NOK.1 This was due to the need for information on how much liquidity asset managers would require in the event of a depreciation of the krone. In connection with the market turbulence in spring 2020, Norges Bank focused on the potential for greater flexibility in the contractual framework between counterparties in the derivatives market, and that an expanded network of counterparties could increase the supply of liquidity during periods of stress (see Financial Stability Report 2020). Adjustments now appear to have been made to the contractual framework: There has been an increase in the use of repos that can increase access to cash and margin agreements that allow for using securities as collateral instead of cash (bank deposits). This means that selling pressure on securities to obtain deposit money in the event of market movements may be reduced.
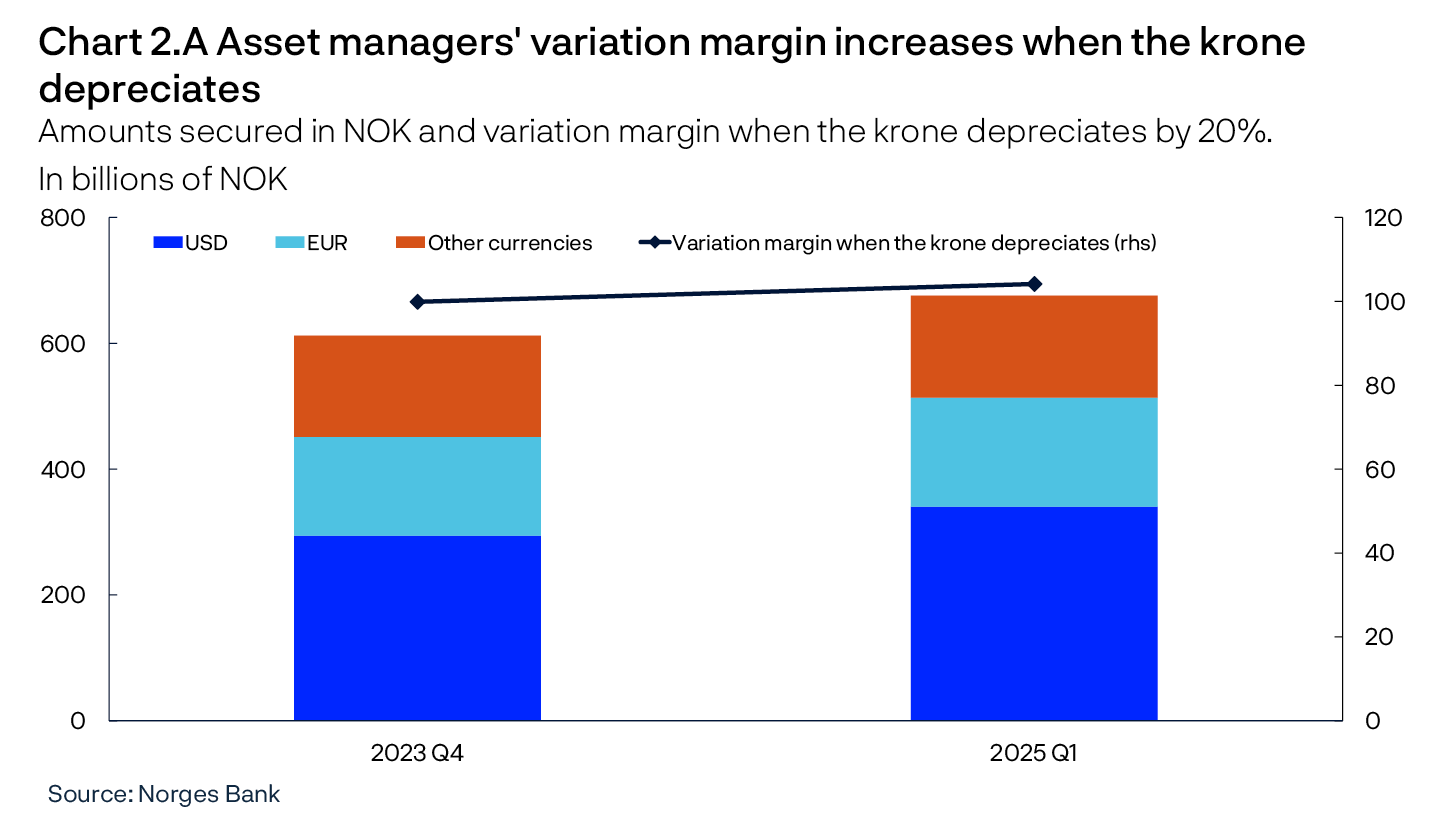
The total hedged amount is around NOK 680bn, and there have been no significant changes in the extent of currency hedging since the end of 2023 (Chart 2.A). The assets hedged against NOK are primarily denominated in USD. The respondents estimate how much collateral will need to be pledged for counterparty risk (variation margin) if the krone abruptly depreciates by 20% against all other currencies. At the end of 2025 Q1, respondents estimated that they would have needed to pledge a total of NOK 104bn (Chart 2.A), a slight increase compared with 2023 Q4.
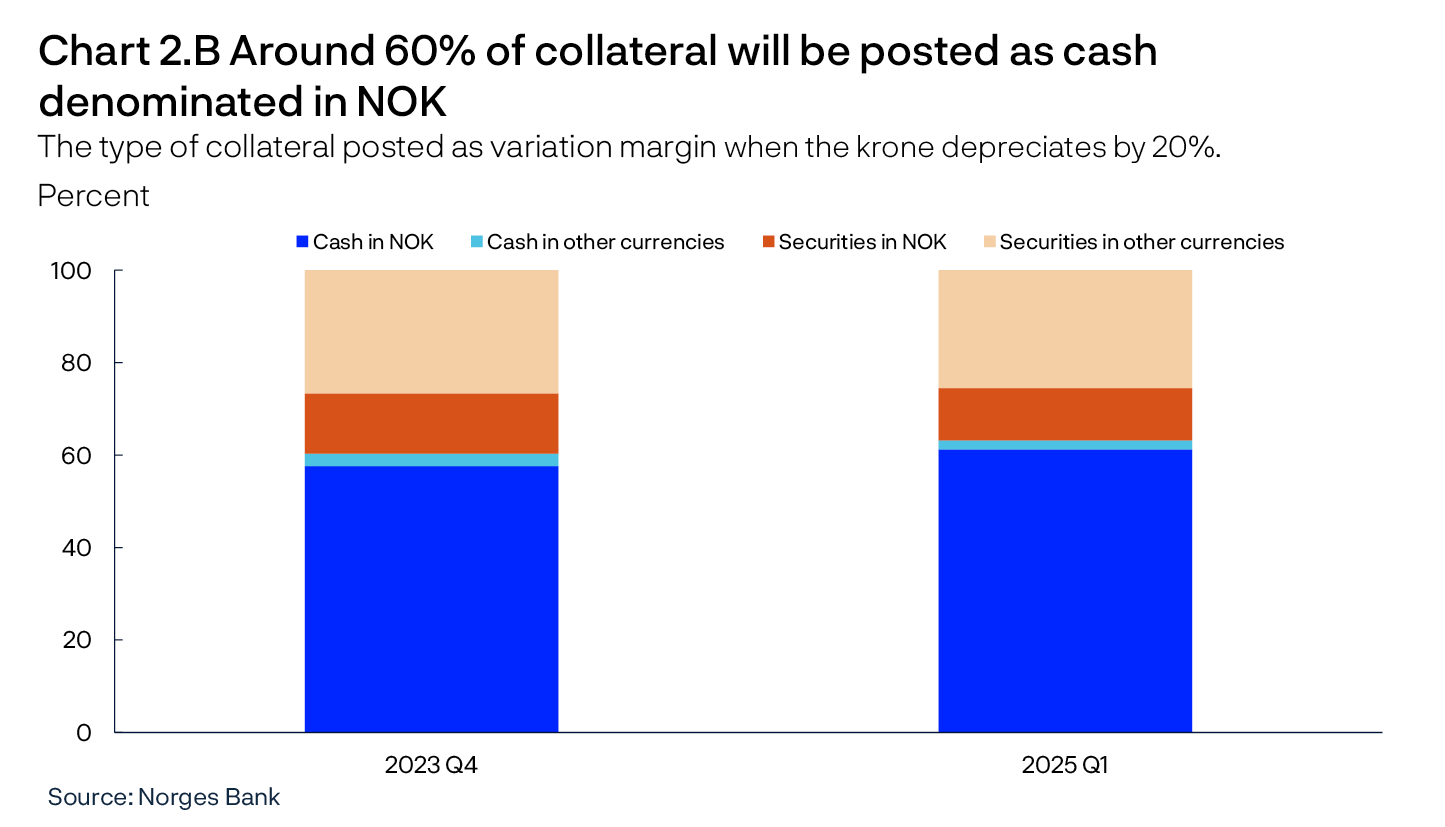
As to the type of collateral that can be pledged, the respondents on the whole estimate that around 60% is pledged as deposit money in NOK (Chart 2.B) ie bank deposits. Securities that can be pledged as collateral are primarily high-grade fixed-income instruments. Just over 25% of the collateral is expected to be pledged in foreign currency securities. It is also estimated that Norwegian securities can be pledged for around 10% of the total collateral requirement.
To obtain cash for margin calls, the respondents on the whole estimate that around 40% can be drawn from cash reserves2, over 20% can be obtained by selling securities and just under 40% can be obtained through repos (Chart 2.C).3
1 The sample consists of 10 mutual fund management companies. The survey covers hedges made within the funds and hedges made for clients outside the funds. The 10 companies (listed alphabetically) are: Alfred Berg Kapitalforvaltning AS, Danske Invest Asset Management AS, DNB Asset Management AS, Eika Kapitalforvaltning AS, Holberg Fondsforvaltning AS, KLP Kapitalforvaltning AS, Nordea Funds, Norwegian Branch, ODIN Forvaltning, Pareto Asset Management AS and Storebrand Asset Management AS.
2 Note that Charts 2.A-C show total hedging, which includes hedging of managed assets not placed in funds. Cash reserves are mainly held outside the funds.
3 Repos are described in “Hedge funds own an increasing share of covered bonds issued in NOK”.
Need to expand macroprudential supervision to non-bank financial institutions
Macroprudential measures are aimed at curbing the build-up of vulnerabilities in the financial system as a whole and strengthening resilience against shocks. Since the financial crisis, the focus has been on assessing and implementing measures for banks, such as higher capital requirements and requirements for larger liquidity buffers. On the other hand, there has been less emphasis on the macroprudential supervision of non-bank financial institutions (NBFIs). Internationally, a number of processes have been initiated to investigate whether this is a deficiency in the current regulatory framework.
Risks and regulation
Regulation should seek to correct for market failures. For example, it is important that market participants understand which risks they expose themselves to. Moreover, it is difficult for participants to assess the consequences for others of the risks they assume, and therefore they may underestimate the consequences if many participants take on the same risks at the same time. This can cause systemic risk. On the other hand, participants capable of bearing risk should be permitted to do so if they so choose, provided they are able to absorb the potential losses.
Banks are strictly regulated because a collapse in the banking system could have serious consequences for the entire financial infrastructure and pose a systemic risk. NBFIs have long been regulated to ensure that they meet the obligations associated with the products they offer. In some cases, NBFIs assuming banks’ risky tasks may help transfer risk to institutions that are better equipped to manage such risk. On the other hand, it is not beneficial if this is because the regulation is weaker for NBFIs, and systemic risk is transferred from well-regulated banks to NBFIs. It is also unfortunate if customers with the same risk are treated differently, depending on whether the counterparty is a bank or an NBFI.1
It is also unfortunate if shocks resulting from NBFIs taking on riskier tasks propagate to other parts of the financial system. This can occur through several channels. Many NBFIs have significant credit lines with banks, making them co-dependent. Furthermore, banks are often counterparties in derivative contracts entered into by NBFIs, creating additional interconnectedness between the sectors. Under normal circumstances, such interconnectedness may contribute to an efficient allocation of risk and liquidity between banks and NBFIs. However, during crises, close ties may amplify economic fluctuations and spread stress to different parts of the financial system – even between sectors that initially appear relatively independent.
International challenges
Regulation is complicated as many NBFIs can easily relocate their activities to other jurisdictions. Historically, banks have garnered their market advantage by operating domestically, whereas non-banks that invest in securities can be located almost anywhere. The choice of cross-border localisation is often driven by differences in tax rates and regulation.2 Minor differences in regulatory implementation may prompt the relocation of funds between countries. This has, among other things, been brought to the fore by the relocation of several funds from Norway to Sweden and Finland (see Section 2.3). Cross-border holdings also complicate the collection of data that can provide a better overview of interconnectedness, systemic risk and potential regulatory requirements. Effective regulation thus requires building on the extensive international collaboration that exists in both Europe and globally.
Measures and proposals
In recent years, both the Financial Stability Board (FSB)3 and the International Monetary Fund (IMF)4 have called for more extensive regulation of NBFIs. In spring 2024, the European Commission5 initiated a consultation on measures to regulate this financial market segment. For example, these bodies have proposed a limit for the use of debt to increase risk, ie financial leverage. Leverage can be increased through derivatives and swaps and is oftendifficult to identify by financial counterparties. They have also proposed provisioning requirements to ensure liquidity during crises. In addition, they also point out the need to enhance the understanding of how different markets are interconnected. This necessitates a need for more data, analysis and guidelines on how authorities should intervene during various shocks.
European regulation
At a European level, investment funds are subject to the UCITS directive6, which regulates securities funds marketed across European countries, and the AIFM directive7, which regulates alternative investment funds. In 2017, new regulations for European market infrastructures (EMIR)8 were introduced. Insurance companies are regulated through the Solvency II directive.9 The AIFM directive, EMIR and Solvency II directive frameworks have been transposed into Norwegian law. To date, these regulations have primarily focused on ensuring robust institutions, with limited consideration given to systemic risk elements.
Measures proposed at the EU level10 include:
1. Conducting a stress test of the entire European financial system to quantify risk and interconnectedness.
2. Strengthening the macroprudential perspective through a more effective framework for overseeing non-bank institutions.
3. Improving data access and risk assessments within the non-bank sector.
Over the past year, other initiatives have also been presented. For example, the Bank of England has proposed regulating large NBFIs more in line with banks during crises, including applying direct crisis measures. In Norway, Norges Bank Papers 3/2021 outlines principles for liquidity policy.
For the time being, NBFIs constitute a smaller part of the financial system in Norway compared to many other countries. Nevertheless, it is important to closely monitor developments in this segment of the financial market in the coming period.
1 For example, loan-based regulation should apply independently of the type of institution. In Norway, this is solved by the Lending Regulations for lending to households applying to all financial institutions operating in Norway.
2 For example, many European investment funds are located in Luxembourg and many pension funds are located in the Republic of Ireland.
3 See Leverage in Non-Bank Financial Intermediation: Consultation report – Financial Stability Board
4 See IMF Global Financial Stability report, April 2023.
5 Macroprudential policies for non-bank financial intermediation (NBFI) – European Commission
6 “Undertakings for collective investment in transferable securities”, see Directive – 2009/65.
7 “Alternative Investment Fund Managers and amending Directives”, see Directive – 2011/61.
8 “European Market Infrastructure Regulation”, see Derivatives / EMIR – European Commission
10 See Financial intermediation beyond banks: taking a macroprudential approach
Norges Bank is tasked with promoting financial stability and conducts regular stress tests of banks’ liquidity and solvency. The stress tests are used to analyse how external shocks and vulnerabilities in the Norwegian financial system may cause funding problems and bank losses. According to the results, banks are robust and can weather severe market turbulence and downturns in the Norwegian economy, enabling them to maintain their functions and therefore not amplify a downturn.
3.1 A severe global stress scenario results in market turbulence and an economic downturn
There have been substantial price movements in financial markets in recent months, and the economic outlook is more uncertain than normal. If banks are not robust in the face of market turbulence and downturns that may cause substantial liquidity shortfalls or credit losses, such shocks can trigger financial crises. This will entail substantial economic costs.
In the stress scenario, a situation is outlined with a highly uncertain domestic and global economic outlook. In the liquidity stress test, conditions are applied that influence banks’ liquidity and funding over a period of six months. In the solvency stress test, conditions are applied that influence banks’ profitability and losses over a three-year period. Both stress tests are based on the same scenario.
Norwegian financial markets are severely impacted in the scenario
The scenario assumes substantial negative effects in international financial markets and a global economic downturn where risk premiums increase substantially as a result of heightened uncertainty and reduced confidence in economic stability. Investors shift capital from risky assets in small economies to presumed safer investments in large economies with more liquid currencies. This results in particularly negative effects for small, open economies.
In the scenario, market stress is expected to result in large movements in the krone exchange rate in the short term in response to the depreciation of the krone and other minor currencies. Large falls in global equity markets also force Norwegian asset managers to sell NOK and buy foreign currency to maintain the extent of FX hedging in global investment portfolios. This amplifies movements in the krone exchange rate and causes more international investors to exit Norway.
In the scenario, uncertainty leads to higher funding market risk premiums. For the first six months of the scenario, it is assumed that the repo market ceases to function and Norwegian banks lose access to funding in foreign money markets (Table 3.1). The redistribution of liquidity is weakened and the money market rate increases significantly. It is also assumed that Norwegian banks have no access to the domestic and global bond and short-term paper markets for the first six months. Nor are firms able to obtain financing in the bond market and thus have to draw on their credit lines in Norwegian banks.
Table 3.1 Assumptions about net payments and falls in value in the liquidity scenario
|
0–30 days |
1–2 mths |
3–6 mths |
Proxy LCR 30 days |
||
|---|---|---|---|---|---|
|
The percentages specify the share of contractual payments that are not refinanced but must be paid |
|||||
|
Money market |
|||||
|
Interbank deposits in Norway |
0% |
0% |
0% |
100% |
|
|
Repo market |
100% |
100% |
100% |
100% |
|
|
Deposits from financial institutions, in FX1 |
100% |
100% |
100% |
100% |
|
|
Derivatives |
|||||
|
Currency swaps |
0% |
0% |
0% |
100% |
|
|
Krone depreciation that requires collateral2 |
-20% |
12% |
6% |
HLBA |
|
|
Short-term paper and bonds |
100% |
100% |
100% |
100% |
|
|
Customer deposits3 |
|||||
|
Retail/SME – guaranteed |
1.0% |
1.5% |
2.5% |
5.0% |
|
|
Retail/SME – non-guaranteed |
2–4% |
2–4% |
5–10% |
10–16% |
|
|
Large firms – operational deposits |
1–7% |
1.5–8% |
2.5–10% |
5–25% |
|
|
Large firms – guaranteed |
4% |
10% |
10% |
20% |
|
|
Large firms – non-guaranteed |
6% |
10% |
20% |
40% |
|
|
Other contractual inflows and outflows |
100% |
100% |
100% |
100% |
|
|
The percentages specify a fall in value |
|||||
|
Liquidity reserves |
|||||
|
Central bank reserves |
0% |
0% |
0% |
0% |
|
|
Treasury bills etc (Level 1) |
5% |
0% |
0% |
0% |
|
|
Covered bonds (Level 1) |
10% |
0% |
0% |
7% |
|
|
Other |
15–50% |
0% |
0% |
15–50% |
|
Economic developments in Norway weaken in the scenario
The solvency stress test highlights banks’ ability to manage a sharp economic downturn. Financial market stress and the downturn in the international economy are assumed to cause a pronounced and protracted decline in activity levels (Table 3.2). As a result of lower consumer confidence and a weaker economic outlook, households increase saving and reduce consumption. The decline in demand leads to a decline in GDP and higher unemployment, which in turn results in an increasing number of household defaults. The fall in the equity market also reduce the wealth of many households.
Table 3.2 Macro-economic aggregates. Annual change.4 Percent
|
2025 |
2026 |
2027 |
2028 |
|
|---|---|---|---|---|
|
GDP for mainland Norway |
1.2 |
-3.7 |
-2.6 |
1.2 |
|
CPI-ATE |
3.4 |
2.3 |
2.0 |
1.5 |
|
Private consumption |
2.2 |
-2.0 |
-0.4 |
1.3 |
|
Business investment |
1.7 |
-8.7 |
-14.9 |
5.1 |
|
Registered unemployment |
2.0 |
3.7 |
4.9 |
4.0 |
|
Policy rate |
4.4 |
2.4 |
0.1 |
0.0 |
|
Money market premium |
0.2 |
0.7 |
0.5 |
0.4 |
|
Residential mortgage rate |
5.5 |
4.5 |
2.0 |
1.8 |
|
CRE prices5 |
5.7 |
-19.2 |
-19.0 |
6.3 |
|
House prices |
8.1 |
-10.5 |
-7 |
5.2 |
|
Credit growth (C2) to households |
3.8 |
-1.5 |
-0.7 |
1.5 |
|
Credit growth(C2) to NFCs. mainland Norway6 |
3.7 |
-4.5 |
-2.5 |
2.0 |
|
Total credit losses7 |
0.1 |
2.8 |
1.8 |
1.2 |
|
CET1 capital ratio |
18.9 |
15.4 |
15.2 |
15.2 |
In the solvency stress test, a substantial fall in investment weighs on demand. In addition, the credit supply for firms that rely on bond financing is limited and risk premiums are elevated. Heightened uncertainty and reduced economic activity lead to a sharp fall in residential and commercial property prices. Firms that benefit from a weaker krone cope better than others through the downturn. Real estate sector firms are hit especially hard by a fall in residential and commercial property prices.
Vulnerabilities in the Norwegian financial system result in higher risk of a particularly steep decline in GDP. A severe downturn is, for example, illustrated by the 5th percentile of GDP growth two years ahead (see Chart 2.B on page 20 in Monetary Policy Report 1/2025). Greater-than-normal uncertainty is reflected in the stress scenario by a more pronounced decline in GDP for mainland Norway than the 5th percentile now indicates. Automatic fiscal stabilisers are assumed to function as normal, but no specific fiscal response to the crisis is assumed.
1 Includes customer deposits from other financial institutions.
2 The percentages specify change in the krone exchange rate. A negative change is a NOK depreciation and generates inflows for the bank. HBLA: Historic look-back approach, cf. LCR rules.
3 The percentages specify outflows as share of original balance sheet amounts.
4 Unless otherwise stated. Level variables are measured as annual averages. Projections for 2025 for GDP for mainland Norway, private consumption, registered unemployment, house prices, credit, consumer price index and mortgage rates are taken from Monetary Policy Report 1/2025.
5 Prices for prime office space in Oslo.
6 NFCs are non-financial corporates. Four-quarter change as at Q4.
7 Total credit losses as a percentage of lending to customers and CET1 capital ratio for the macro bank.
Sources: Eiendomsverdi AS, Entra, Finn.no, Jones Lang LaSalle (JLL), Labour and Welfare Administration (NAV), Real Estate Norway, Statistics Norway and Norges Bank
3.2 Substantial market turbulence results in liquidity problems, but banks are equipped to cope for an extended period
In the liquidity stress test, banks are assessed in an assumed situation with substantial market turbulence and funding shortfalls, specified in the scenario described above. The results show that the macro bank (the seven largest Norwegian-owned banking groups) has sufficient liquidity reserves to weather an extended period of severe stress without receiving new wholesale funding.
Banks should expose themselves to liquidity risk
Banks face liquidity risk because customers can take out long-term loans while depositors can withdraw their funds at any time. Banks contributing to maturity transformation is efficient for society, and it is therefore not an objective per se that banks’ liquidity risk is as low as possible. When banks are sufficiently liquid, people can make payments, save, borrow and hedge against financial risk. Banks must therefore be resilient enough to handle extraordinary outflows and maintain operations, even during market stress. Financial stability can be threatened if many or large banks face serious liquidity problems.
Contractual maturities show maturity transformation in normal times (Chart 3.1). Banks have substantial contractual maturities with very short-term horizons. This is due to demand deposits accounting for a large share of banks’ funding. In addition, banks’ wholesale funding maturities range from one day to more than five years. Banks’ inflows are mainly from customers’ loan repayments.
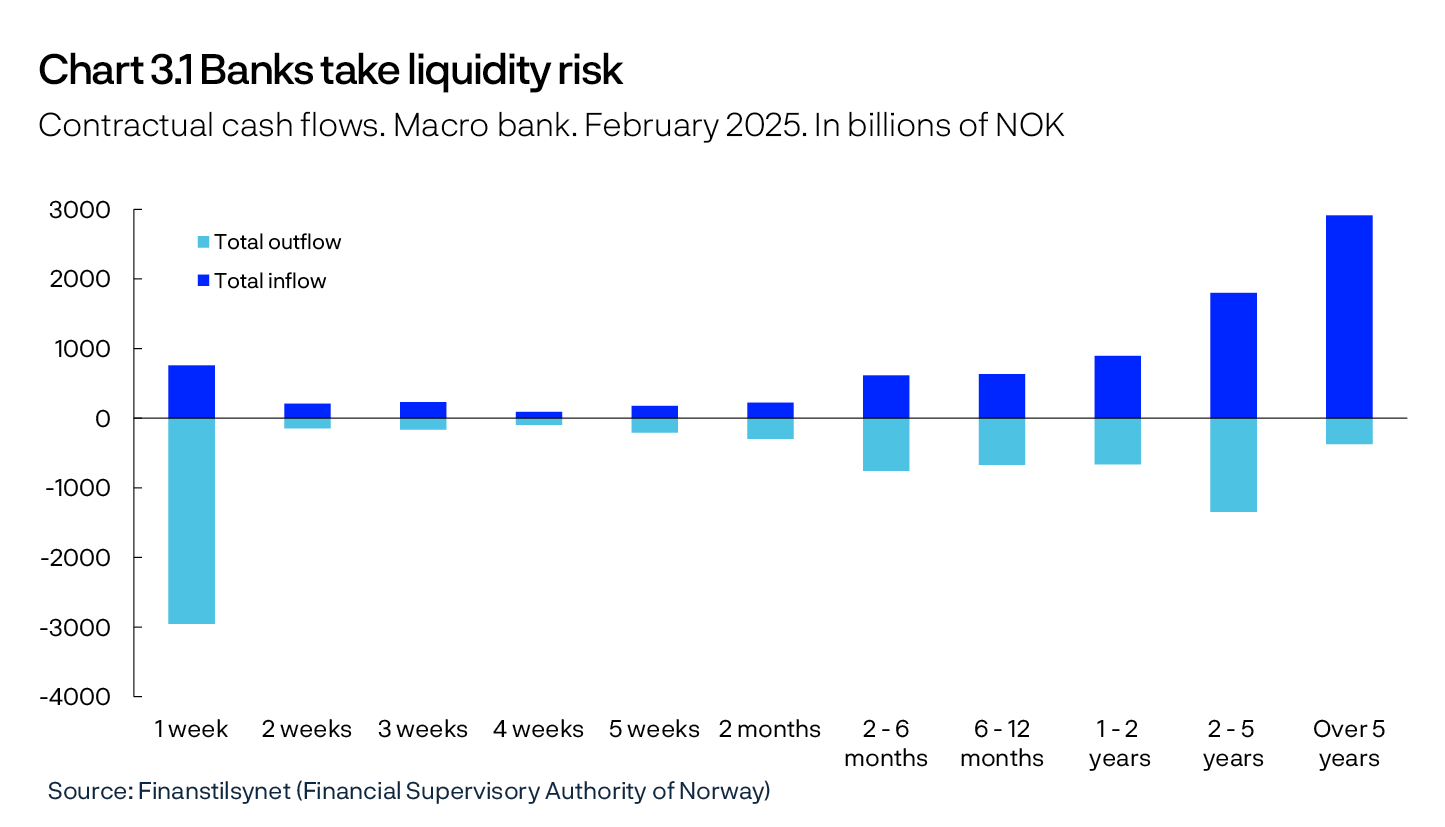
At the end of 2024, all Norwegian banks met the liquidity requirements, see Finanstilsynet’s (Financial Supervisory Authority of Norway) Solvency report for financial institutions etc. of 31 December 2024 (in Norwegian only). The liquidity rules help reduce vulnerabilities in the funding structure as the liquidity coverage requirement makes it more costly for banks to have a high share of short-term debt and unstable funding. Under the liquidity coverage ratio (LCR) requirement, banks must hold a buffer of liquid assets that can withstand net liquidity outflows and funding problems for 30 days, see Norway’s Financial System 2024. Banks must also meet the net stable funding ratio (NSFR) requirements that require banks to fund illiquid assets with long-term funding, thereby limiting refunding risk.
As the lender of last resort, Norges Bank can provide extraordinary liquidity to the banking system or individual banks and thereby help to prevent financial problems from spreading and escalating into a major crisis. However, it is first and foremost the responsibility of banks themselves to manage their liquidity risk. Banks must adjust their balance sheets to manage substantial risk without liquidity support from the central bank. The liquidity stress test assumes no explicit measures from Norges Bank or other authorities.
About the liquidity stress test
The liquidity stress test model is a tool for shedding light on how severe market stress can impact banks’ funding.1 The aim of analysing scenarios in the model is not to calculate precise outcomes, but rather to structure challenges and assessments relating to banks’ liquidity and funding. The model is designed to capture liquidity and funding characteristics of the seven largest Norwegian-owned banking groups. The stress in the liquidity scenario does not originate with individual banks but are due to shocks that impact the entire banking sector. Banks are stress-tested individually, and there are no explicit links between the banks in the model. The model is partial in the sense that the situation of banks does not have a feedback effect on the behaviour of other market participants. For example, it is conceivable that depositors transfer from the hardest hit banks to the less affected, but stress factors are equal for all banks The results must therefore be interpreted with caution, but they do provide an overview of how banks will manage substantial liquidity problems. The impact on different banks will vary.
The model is a cash flow analysis of inflows and outflows related to assets, liabilities and off-balance sheet items. In addition, each bank has initial holdings of liquid assets, which also provide the basis for the LCR calculation.
While the LCR requirement requires banks to hold liquid assets as a buffer against a given level of liquidity stress over a 30-day period, the liquidity stress test covers a period of six months. The stress assumptions also differ from the LCR. The model is based on the dataset “Additional Liquidity Monitoring Metrics” from February 2025, which banks report to Finanstilsynet (Financial Supervisory Authority of Norway). The dataset includes a detailed overview of banks’ contractual inflows and outflows. Cash flows under stress are estimated using assumptions about the behaviour of the bank itself, customers, other banks and other market participants (Table 3.1).
The liquidity stress test stresses bank’s liquidity for all currencies combined, and assumes that the FX market functions.
1 See Erard et al (2025). “Liquidity risk in the banking system – a new model and a stress test with a cyberscenario” [in Norwegian only] Staff Memo 2/2025. Norges Bank
Banks have liquidity reserves to withstand financial market turbulence
The liquidity stress test is based on banks’ contractual maturities and includes some of the the assumptions underlying the LCR requirement. This year’s stress test examines the effects of liquidity stress over a period longer than the LCR’s 30-day horizon. The assumptions also include more pronounced liquidity effects from krone exchange rate movements through margin calls than assumed under the LCR requirement (see “Movements in the krone exchange rate affect the liquidity needs of financial system participants” and Table 3.1). In addition, a major fall in value of the liquidity reserve is assumed. The adjustments enable an assessment of how a not likely yet conceivable scenario may impact banks’ liquidity situation.
Wholesale funding is a key source of funding for banks, and bonds, short-term paper and other debt amount to slightly less than 50% of banking groups’ funding (see Table 4 in bank statistics on Norges Bank’s website). In the first weeks of the scenario, banks have substantial net liquidity outflows as they are assumed to be unable to roll over short-term funding in the international money market, and customer deposits in foreign-currency from financial institutions are assumed to be withdrawn from banks in their entirety (Chart 3.2). When the repo market ceases to function, this results in inflows to the macro bank at the beginning of the scenario, at the same time as the liquidity reserve is drawn down. This is because banks as a whole are net lenders in the repo market and receive bonds as collateral. Lack of opportunities to refinance more long-term wholesale funding will result in outflows for banks, in particular in the latter half of the stress period.
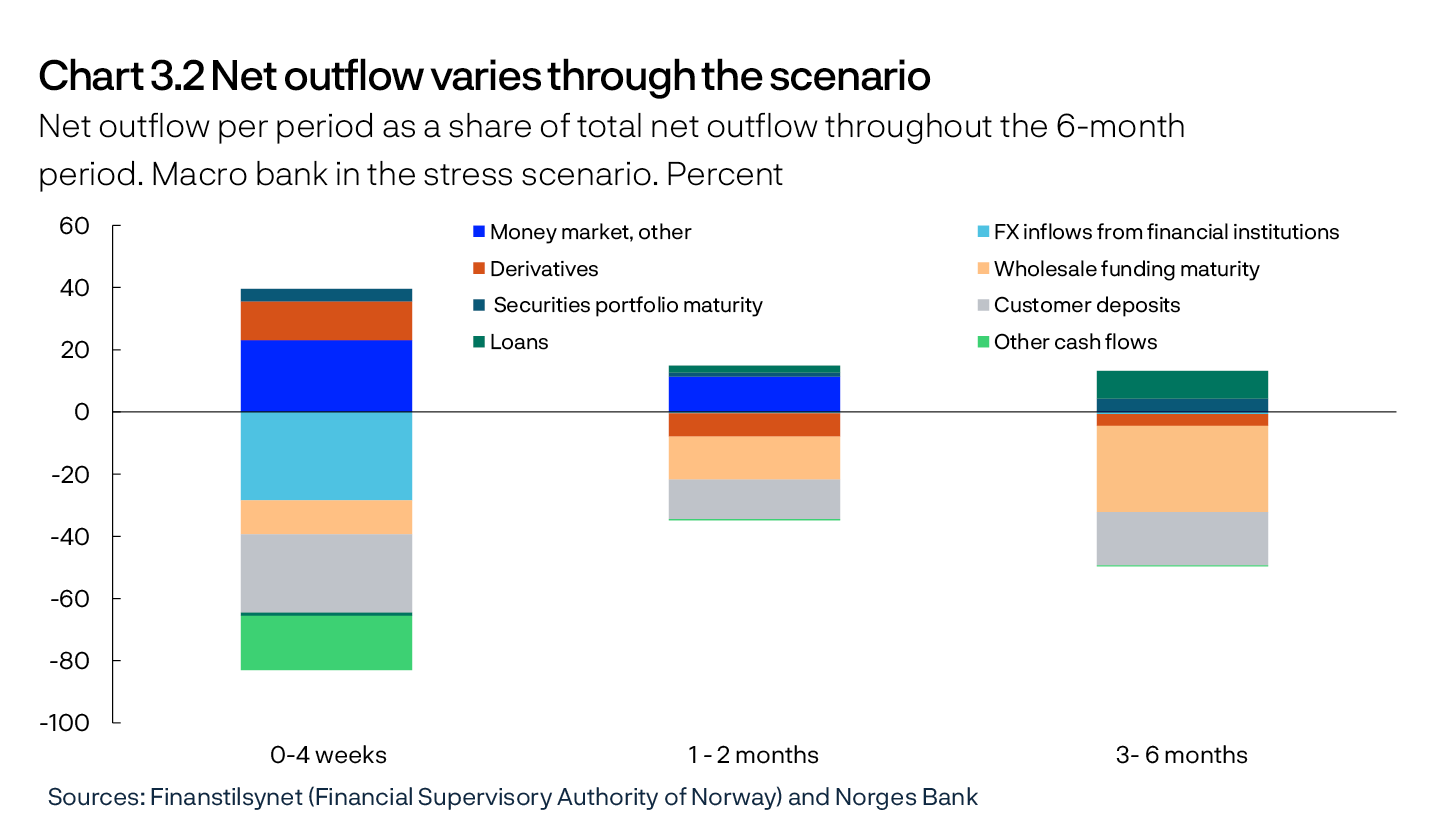
The potential size of customer deposit withdrawals during six months of market stress is uncertain. The banking turmoil in spring 2023, when several small and medium-sized US banks experienced liquidity and solvency problems, showed that deposits can disappear very quickly if confidence in a bank is lost. In the scenario, a loss of confidence is not assumed, but it is nevertheless taken into account that some banks may experience deposit withdrawals. For example, disinformation and misinformation may contribute to a loss of confidence and a run on deposits in banks that did not originally face difficulties, and deposits may be transferred to other banks in Norway than those included in the stress test.
Many customers will not want to move their deposits to mutual funds when prices fall in bond and equity markets. If they had nevertheless moved their deposits to mutual funds that invest in Norway or bought securities from Norwegian market participants, this would not have reduced total bank deposits. The deposits would then have merely been held by someone else. This is not the case in the US, where some money market funds can place deposits at the central bank, with the result that deposits can be withdrawn from the banking system. If customers place more of their deposits in mutual funds that invest abroad, banks’ customer deposits may decline at the same time as net foreign funding increases, but this is not an assumption in this year’s stress test. In the scenario, 5% of guaranteed retail deposits are withdrawn over a period of six months (Table 3.1). By comparison, the assumption in the LCR requirement, which is intended to reflect both a specific institutional shock in addition to market turbulence, is a 5% withdrawal over 30 days.
As there is a lack of historical examples of banks drawing down their liquidity reserves, a sharp fall in the value of liquidity reserves is assumed in the stress test (Table 3.1). This is to enable an assessment of banks’ robustness in an even more severe crisis than assumed in the LCR stress test. The fall in value is also intended to reflect second-round effects. In the scenario, the value of covered bonds falls by 10%, reflecting a high concentration in the covered bond market (see “Concentration in the covered bond market may weaken banks’ liquidity”). The value of other very high quality securities, such as government securities and debt securities issued by local governments and international bodies falls by 5%. Other liquid reserves are assumed to fall in value as in the LCR scenario, leading to a fall in the value of the macro bank’s liquidity reserves of just under NOK 70bn over 30 days.
Movements in the krone exchange rate affect the liquidity needs of financial system participants
Large movements in the krone exchange rate will reduce or increase the value of banks’ foreign-currency assets and liabilities. Norwegian banks have largely hedged foreign exchange risk through foreign exchange and currencyy swaps, and open FX positions are very small. Exchange rate volatility can nevertheless affect liquidity needs.
To ensure that the counterparty will honour a swap agreement, margins are generally required to be posted for the duration of the contract. Margin is often posted in the form of deposits (cash). Banks have more foreign-currency liabilities than assets and will therefore have to post margin when the krone appreciates. Asset managers have large foreign-currency investments that are currency-hedged and must post margin when the krone depreciates. Banks are largely the asset managers’ counterparties in these swap agreements.
With a weaker krone, banks receive liquidity inflows, but funding markets may weaken
In the liquidity stress test scenario, the krone exchange rate is assumed to depreciate temporarily by 20%, appreciating to somewhat below the original level thereafter. This results in margin payments by asset managers and others to banks, therefore strengthening banks’ liquidity position at the beginning of the scenario (see the item “derivatives” in Chart 3.2).
At the same time, the krone depreciation in the scenario may contribute to fire sales by asset managers to be able to post sufficient margin at short notice. In the scenario, it is assumed that this contributes to a fall in the market value of banks’ liquidity reserves. During the market turbulence in March 2020, selling pressure on banks’ funding instruments had a negative impact on banks, even though they received an inflow of liquidity from asset managers. Since then, a number of asset managers have entered into agreements that allow for more flexible forms of collateral, and vulnerabilities relating to fire sales have likely been reduced somewhat (see “Survey of Norwegian asset managers” in Section 2).
With a stronger krone, banks will need liquidity
If the krone were to appreciate, banks would have to post collateral. This would, in isolation, weaken their liquidity positions. The LCR requirement does not require that banks must hold liquidity reserves to fully cover liquidity needs in the event of large exchange rate movements. However, a stronger krone will not constitute significant liquidity stress for the macro bank. A 20% appreciation of the krone equals a liquidity need of around 8% of the macro bank’s liquidity reserves. For individual banks, liquidity needs may vary considerably.
The results of the liquidity stress test indicate that most banks have sufficient liquidity reserves to cover net outflows for six months (Chart 3.3). The extent to which banks exceed the liquidity requirements affects the outcome of the liquidity stress test. The more liquid the assets and the more stable the funding structure, the better equipped banks are to cope with liquidity stress.
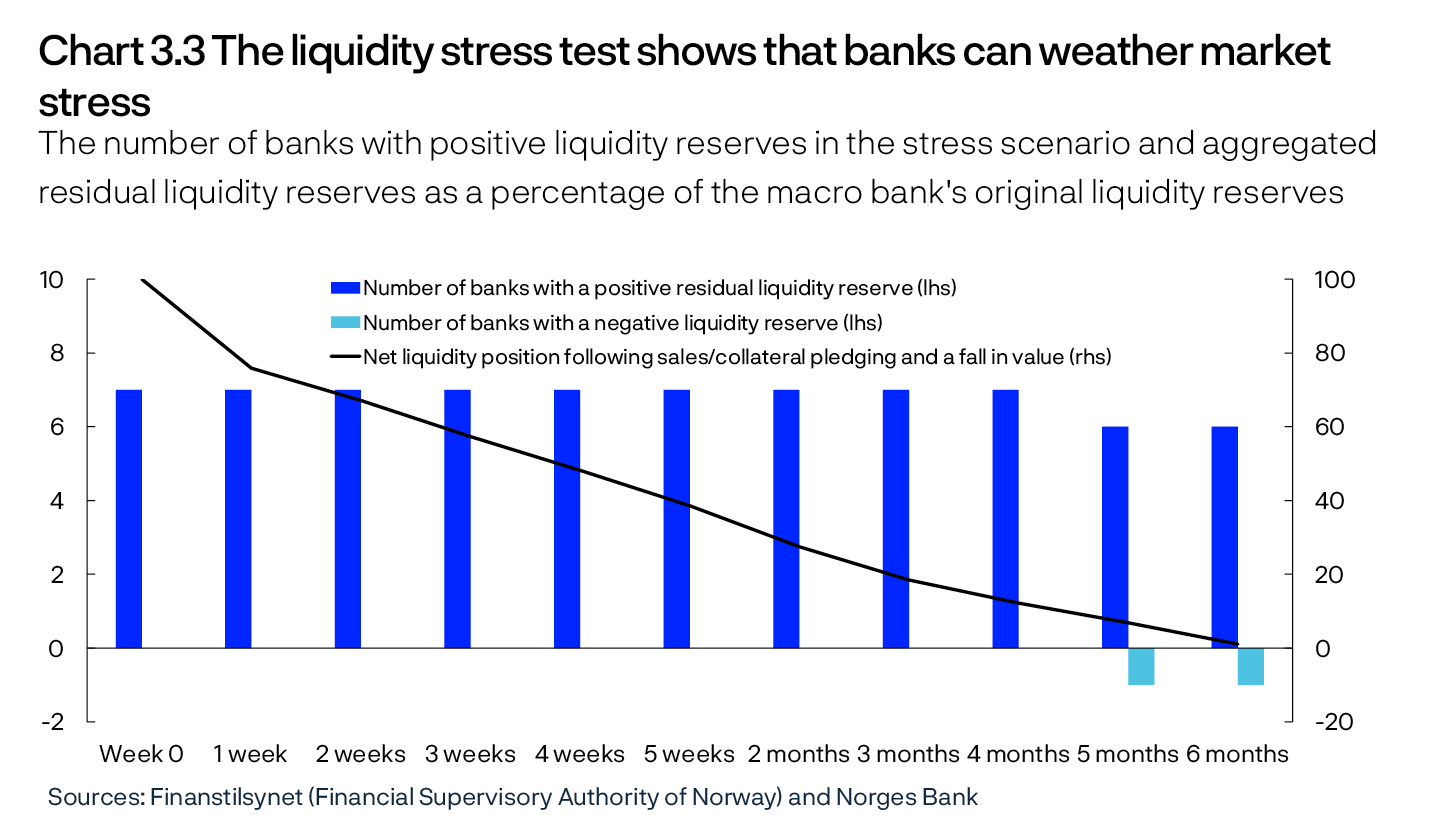
Liquidity reserves are a buffer that can be used
Banks hold securities in their liquidity reserves that can be sold or pledged if they have difficulties obtaining new funding. Although most banks have sufficient liquidity reserves to cover net payments for a period of six months, banks’ LCR will weaken through the scenario period (Chart 3.4). This is primarily because banks use their liquidity reserves to cover funding shortfalls. A fall in the value of the reserve also leads to a lower LCR.
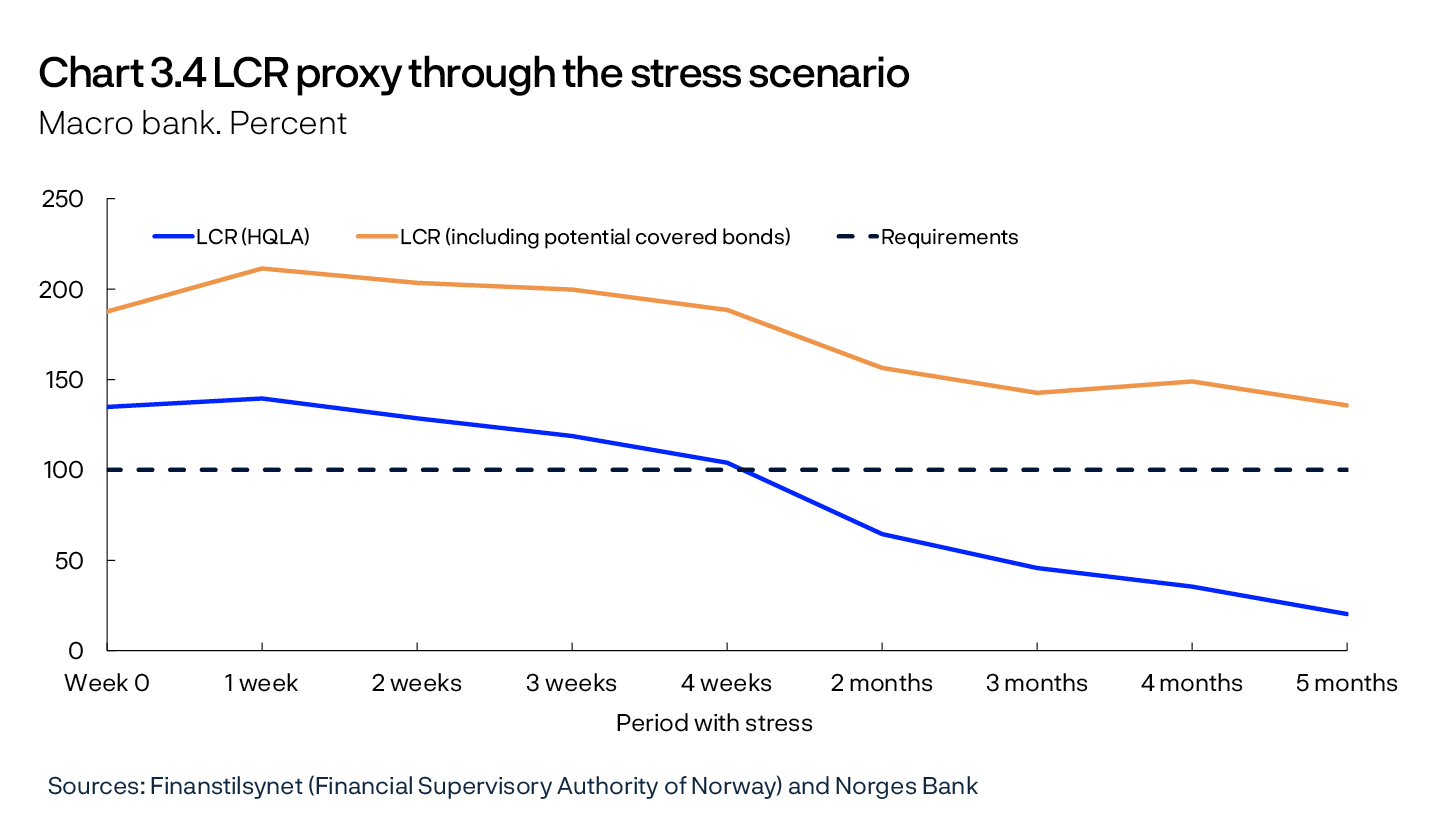
Banks are dependent on their ability to issue new covered bonds to keep their LCR above the 100% requirement. This requires an open covered bond market. In the scenario, the market is assumed to be closed and banks’ do not satisfy the LCR requirement.
Banks’ liquidity reserves serve as a buffer that can be drawn upon during periods of liquidity stress, and it is therefore understood that the LCR can fall below the requirement in times of market turbulence that result in funding problems for banks. All banks have recovery plans that include measures to be implemented if they face considerable difficulties. When a bank draws on liquidity reserves, resulting in low levels of LCR, the bank is required to present a plan to Finanstilsynet on how it will restore the reserves. Finanstilsynet will assess the plan in light of the market situation and decide whether the bank’s measures and the time allocated to restoring the liquidity reserves are realistic and sufficient for the bank to build resilience so that it can again cope with future liquidity and funding difficulties.
Concentration in the covered bond market may weaken banks’ liquidity
Covered bonds are bonds primarily collateralised by residential mortgages and are the most important source of funding for banks after customer deposits. In addition, half of liquidity reserves in NOK consist of covered bonds (Chart 3.A). Banks also use covered bonds as collateral for loans from Norges Bank. Preserving the value and market liquidity of covered bonds is therefore important for banks’ liquidity.
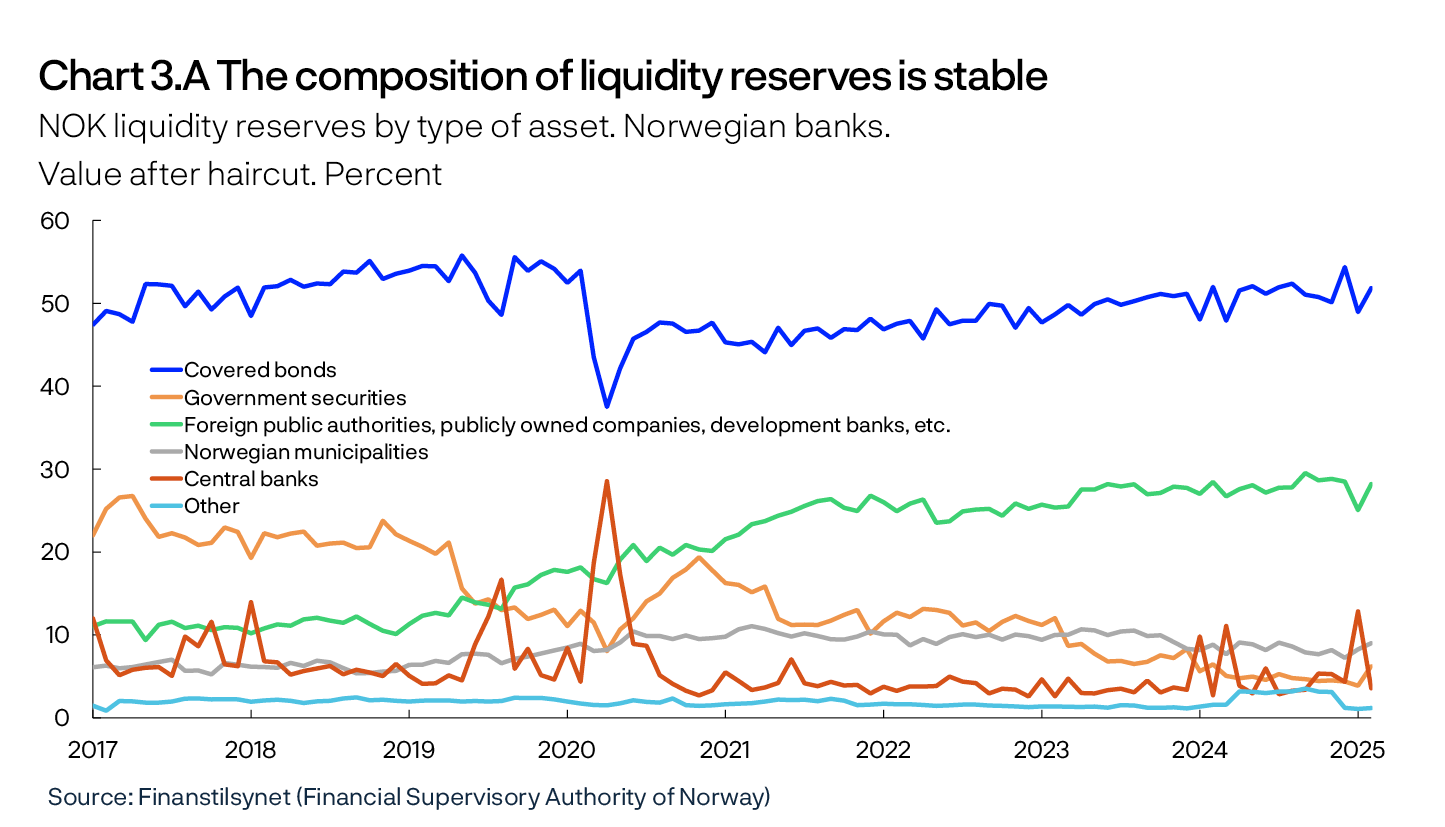
Fire sales may amplify market stress and impair banks’ liquidity
In general, all investors with liquidity difficulties can generate selling pressure if they have substantial investments in one single class of securities. Selling pressure can lead to a fall in value or to a less well-functioning market for the class of securities. Liquidity difficulties may be due to the inability of investors to obtain refinancing or having large collateral requirements in financial contracts. Investors can also generate selling pressure with major changes to their investment profile, for example as a result of weaker returns or changed preferences. Such “voluntary” divestment will often enable investors to sell securities efficiently and therefore more rarely trigger severe fire sales and substantially impact market prices.
Banks operating in Norway, including branches of foreign banks, are by far the largest investors in covered bonds, accounting for around 60%. They hold covered bonds in liquidity reserves since covered bonds are deemed high-quality liquidity assets. This means that covered bonds can be realised or borrowed against if banks need liquidity. Fire sales may be triggered if many banks experience liquidity difficulties simultaneously. This may make it more difficult for banks to obtain new funding in the covered bond market, which in turn may amplify liquidity and funding problems.
In the liquidity stress test, the macro bank sells covered bonds to cover liquidity needs. The sales account for approximately 15% of all covered bonds in the market. If all banks in the Norwegian banking sector experience the same problems as the macro bank, the sale is estimated to amount to around 40% of the covered bond market. This figure also includes sales from other Norwegian banks and Norwegian branches of foreign banks.
Other Norwegian financial institutions such as asset managers, also invest heavily in covered bonds. Selling pressure from these investors may lead to a fall in prices and amplify market stress, as seen during the pandemic in 2020. In addition, mutual funds may, in a severe market stress scenario, need to conduct fire sales of securities if there are large withdrawals of fund units.
Foreign alternative investment funds (AIFS, hedge funds) have become important investors in the covered bond market in recent years (see “Hedge funds own an increasing share of covered bonds issued in NOK” in Section 1). Hedge funds hold around NOK 200bn of covered bonds, amounting to 20% of the market. These funds finance the purchase of covered bonds by borrowing from banks through repurchase agreements that are well secured by covered bonds. The spread between the borrowing rate and the covered bond yield is not wide but can nevertheless generate a solid return on equity because the hedge fund’s equity ratio is low. This can be a vulnerable construction, as even small movements in market prices may lead to negative hedge fund returns, which may force the fund to retreat from the covered bond market. A significant sell-off may have negative consequences for the value of covered bonds and increase banking groups’ funding costs in the covered bond market. Ultimately, this may prevent them from obtaining new funding in the covered bond market.
3.3 Banks can withstand a severe economic downturn
The aim of the solvency stress test is to show banks’ capacity to withstand a deep economic downturn with large losses. It casts light on whether banks have sufficient capital to withstand large losses without amplifying an economic downturn by tightening lending.
The solvency stress test is based on the current macroeconomic situation and banks’ capital ratios.1 The baseline scenario for activity levels in the Norwegian economy is in line with projections in Monetary Policy Report 1/2025. In the solvency stress test, it is assumed that the economy is exposed to large shocks (see Section 3.1) and that banks are exposed to significant liquidity stress with a fall in the price of securities in the first year of the crisis (see Section 3.2).
Banks’ capital ratios, earnings and losses in an economic downturn are analysed, given the assessment of financial system vulnerabilities. The analysis takes into account that banks are both affected by and affect economic developments.
Substantial losses on corporate exposures but banks have sufficient buffers
In the solvency stress test, banks incur substantial losses on corporate exposures. This is due to many firms facing weak demand and difficulties fully passing on higher costs to prices. Banks incur substantial losses on CRE exposures, as well as higher losses on loans to households owing to a fall in house prices and higher unemployment.
Stable earnings and sufficient solvency among banks help them withstand a deep downturn without tightening credit supply. The macro bank maintains its capital ratios in excess of the regulatory requirements throughout the scenario (Chart 3.5). The countercyclical capital buffer (CCyB) rate is assumed to be set at zero, giving banks more room to provide credit. The macro bank is also well above the leverage ratio requirement.
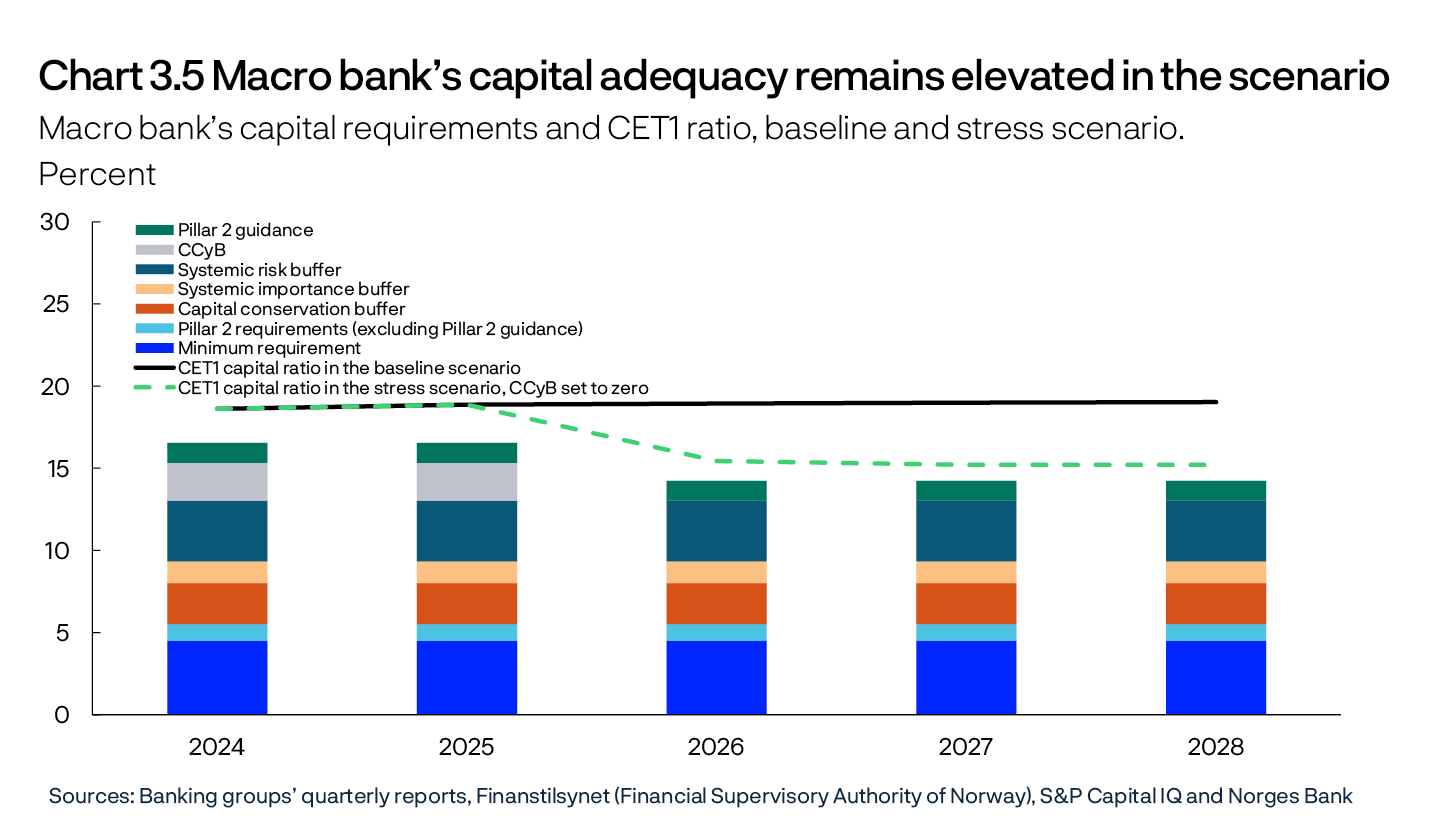
The solvency stress test primarily focuses on how the macro bank copes in the scenario. The performance of individual banks varies because they have different starting points. This may for example be differences between actual capital ratios and the capital adequacy requirement, different levels of net interest income or different exposure to corporate loans or the securities market. Even though a weighted average of the seven largest Norwegian-owned banking groups’ CET1 ratios meets the requirement through the scenario, different paths for individual banks may result in them breaching capital requirements. Changes in capital requirements and mergers in 2025, which have not been taken into account, may also have some effect on the results.
To counter a fall in capital ratios, some banks may wish to curtail lending growth, and others may be less willing to accept new customers. Other factors may also limit bank lending, for example, a demanding liquidity situation for banks or considerable uncertainty about whether future developments may result in changes to credit ratings and tighter lending conditions for both firms and households. At the same time, lower credit demand in the scenario will dampen the need for credit from banks, and tighter lending by banks will likely not amplify an economic downturn.
The systemic risk buffer provides additional resilience
How loss and earnings will develop in a stress scenario is uncertain. If the downturn is so severe that a reduction of the CCyB rate is not sufficient to enable banks to meet credit demand, the capital requirement regulations also provide for a reduction of the systemic risk buffer (SyRB) rate. This will improve the macro bank’s lending capacity. Nevertheless, the needs of individual banks to keep capital ratios elevated will likely result in credit tightening, which may amplify an economic downturn.
In order for the macro bank’s capital ratio to be weakened to such an extent that the entire SyRB is lost, credit losses would have to increase by a further two-thirds compared with the scenario. A situation may arise in which specific industries are particularly hard hit or in which the Norwegian economy is affected generally, more severely and for longer than assumed in the solvency stress test. Net interest income developments in a stress scenario are also uncertain. Should net interest income be halved compared with the assumptions in the stress test, the macro bank will lose large parts of the SyRB. This may occur for example as a result of new and unexpected mechanisms in the financial system.
Annex
Important regulations and measures
Table 1 Important regulations and measures in Norway’s financial system
|
Category |
Instrument |
First introduced |
Current level |
|---|---|---|---|
|
Deposit guarantee scheme |
Guarantee of retail and commercial deposits in Norwegian banks1 |
1996 |
NOK 2m per depositor per bank2 |
|
Credit standards requirements for mortgages and other secured loans3 |
Tolerate higher interest rate (stress test) on total debt |
20154 |
A 7% interest rate or a 3-percentage point interest rate increase, whichever is higher |
|
Maximum loan-to-value (LTV) ratio |
20154 |
90%. Additional collateral is permitted |
|
|
Principal repayment requirement |
20154 |
2.5% a year with LTV above 60% or as a 30-year amortising loan |
|
|
Maximum debt-to-income (DTI) ratio |
2017 |
5 times gross income |
|
|
Flexibility quota5 |
2015 |
10% (8% for loans secured on dwellings in Oslo) |
|
|
Credit standards requirements for consumer credit6 |
Tolerate higher interest rate (stress test) |
20194 |
A 7% interest rate or a 3-percentage point interest rate increase, whichever is higher |
|
Principal repayment requirement |
20194 |
Monthly principal repayment, maximum term 5 years |
|
|
Maximum debt-to-income (DTI) ratio |
20194 |
5 times gross income |
|
|
Flexibility quota5 |
2019 |
5% |
|
|
Risk-based capital requirements7 (share of risk-weighted assets)8 |
Pillar 1 Minimum CET1 requirement |
2013 |
4.5% |
|
Pillar 1 Minimum Tier 1 requirement |
19919 |
6% |
|
|
Pillar 1 Minimum regulatory capital 1991 8% |
1991 |
8% |
|
|
Pillar 1 Combined buffer requirements: |
|||
|
Capital conservation buffer |
2013 |
2.5% |
|
|
Systemic risk buffer |
2013 |
4.5% |
|
|
Buffer for systemically important financial institutions (SIFIs) |
2015 |
1% for Kommunalbanken AS,Nordea Eiendomskreditt AS and SpareBank 1 Sør-Norge ASA, and 2% for DNB ASA11 |
|
|
Countercyclical capital buffer |
2015 |
2.5% |
|
|
Pillar 2 requirements |
2007 |
Varies across banks |
|
|
Risk weighting for risk-based capital requirements |
Floor for average risk weights for residential mortgages |
2020 |
20%. 25% effective 1 July 2025. |
|
Floor for average risk weights for CRE mortgages |
2020 |
35% |
|
|
Leverage-based capital requirements7 (share of exposure measure) |
Leverage ratio |
2017 |
3% minimum requirement |
|
Liquidity requirements |
Liquidity Coverage Ratio (LCR) |
201510 |
100% |
|
LCR in individual currencies (Pillar 2 requirements) |
2017 |
Varies across banks |
|
|
Net Stable Funding Ratio (NSFR) |
2022 |
100% |
|
|
Minimum requirement for own funds and eligible liabilities (MREL)11 |
Loss absorption amount |
2019 |
Minimum requirement for regulatory capital + Pillar 2 requirements + combined buffer requirements12 |
|
Amount necessary for recapitalisation13 |
2019 |
Minimum requirement for regulatory capital + Pillar 2 requirements + combined buffer requirements excluding countercyclical capital buffer requirement |
|
|
Total MREL |
2022 |
Total MREL is described on page 39 of Financial Stability Report 2021 |
|
|
Subordinated MREL is described on page 38 of Financial Stability Report 2021 |
|||
|
Testing of financial sector cyber resilience |
TIBER-NO14 |
2022 |
Guidance for threat-based testing of financial sector cyber resilience. |
1 For deposits in Norwegian banks’ foreign branches, a limit of EUR 100 000 applies.
2 Additional amounts deposited in the course of the previous 12 months following a particular life event, such as a home sale or insurance payout, are also covered. The guarantee does not cover deposits from credit or financial institutions or from public authorities.
3 From 1 July 2023, loans secured on collateral other than a dwelling, such as car and boat loans, will be covered by the regulation’s general DTI and debt-servicing capacity requirements.
4 Prior to being laid down in a regulation, the requirements were issued as guidelines, for residential mortgage loans in 2010 and for consumer credit in 2017.
5 Up to a certain percentage of the total value of new mortgage loans/consumer credit granted by banks each quarter may be loans in breach of one or more of the requirements. A separate flexibility quota for Oslo was introduced in 2017. A separate flexibility quota of 10% for loans secured on collateral other than housing was introduced in 2023.
6 Exemption for credit cards with credit limits below NOK 30 000 and exemption for loan refinancing as long as the value of the refinanced loan (and new loan costs) does not exceed the value of the existing loan (and previous loan costs).
7 See explanation of capital requirements in Norway’s Financial System 2023, Appendix 2.
8 Risk-weighted assets. A number of regulations have been introduced for banks’ calculation of risk weights, especially for residential mortgage loans.
9 In 2013, the minimum requirement increased from 4% to 6% when CRR/CRD IV were implemented in the Norwegian rules.
10 Applied to systemically important financial institutions from 2015 but was phased in for other firms in the course of 2017.
11 Liabilities eligible for MREL must be lower in priority than senior debt. However, before 1 January 2024, ordinary senior bonds issued before 1 January 2020 may also be used to satisfy MREL.
12 The loss absorption amount requirement is the larger of the leverage-based Tier 1 capital requirements and total risk-based capital requirement (minimum requirement, Pillar 2 requirements and buffer requirements). In Norway, the risk-based requirement is the more binding.
13 Applies only to banks subject to resolution and not liquidation under public administration.
14 TIBER-NO is the Norwegian implementation of TIBER-EU, which applies in the EU.
Sources: Finanstilsynet (Financial Supervisory Authority of Norway), Ministry of Finance, Norwegian Banks’ Guarantee Fund and Norges Bank.