Financial stabilty assessment
The financial system is marked by higher interest rates
Since the previous Financial Stability Report published in May 2023, policy rates in both Norway and other countries have been raised further to bring down inflation, and long-term interest rates have continued to rise. Economic growth is expected to be sluggish over the next year, and there is still a heightened risk of negative events occurring that can weaken financial stability. The policy rate hikes are now putting pressure on the debt-servicing capacity of some sovereigns, firms and households. At the same time, geopolitical tensions are higher than they have been in many years.
Households draw on savings to meet higher costs
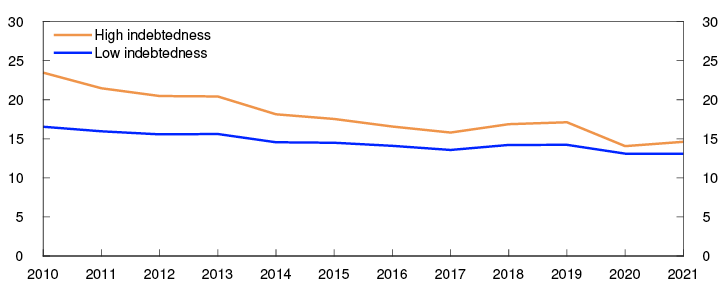
Many households are highly indebted, and house prices have risen over many years. These vulnerabilities could amplify a downturn in the Norwegian economy. For many years, debt rose faster than household income, but over the past two years, debt growth has been slower than income growth. Owing to high debt levels, households need to spend a larger share of their income on interest payments when interest rates rise.
Household financial wealth has risen faster than income over the past 10 years, and the rise was particularly pronounced in 2020. The accumulated savings have helped reduce household sector vulnerabilities. Last year, many households drew on savings on the back of high inflation and higher interest rates. Analyses in this Report show that bank deposits fell most among highly leveraged households. Less leveraged households had higher deposits at the end of 2022 than before the pandemic.
The vast majority of households can service debt in the face of higher costs, but many will likely have to tighten consumption. If consumption is tightened to a substantial degree, corporate earnings and debt-servicing capacity may fall. This may lead to bank losses on corporate exposures and amplify an economic downturn through tighter credit standards. Losses will most likely be limited because banks’ exposures to the most consumption-oriented industries are relatively low, but problems in these industries may result in spillovers.
House prices rose at the beginning of 2023, after falling the previous autumn. Since May, house prices have edged down again in response to higher interest rates, and the number of unsold homes has increased. House price developments are more uncertain than normal. Large and abrupt falls in house prices may trigger higher losses on banks’ exposures. The risk of a large decline in house prices is dampened by low construction activity and low unemployment.
Higher interest rates affect the real estate sector in particular
Banks’ high commercial real estate (CRE) exposures are a key financial system vulnerability. For a long period, low interest rates fuelled a rapid rise in commercial property prices. Over the past year, prices have decreased, and future price developments are more uncertain than normal. Somewhat lower commercial property prices are expected ahead.
CRE firms are facing reduced profitability as a result of higher interest rates, and lower commercial property prices are lowering their equity ratios. If both rental income and property prices should fall markedly, many firms will have problems servicing debt. Since high employment is helping sustain demand for office space, rental income is still expected to rise, which means that most CRE firms will be able to cope with higher interest expenses. Lower equity ratios and profitability will make rolling over maturing loans more demanding. This may force fire sales of properties, which can amplify a fall in property prices.
Banks also hold some loans to real estate developers, whose earnings have been impaired by higher interest rates, increased construction costs and a low level of construction activity. These factors will make it more difficult for real estate developers to service debt out of current earnings. These firms’ equity ratios appear to be fairly good, which reduces the risk of bank losses.
Norwegian banks are well equipped to absorb higher losses
Resilient banks are crucial to financial stability. In spring there was financial market turbulence owing to problems at some international banks. There was a risk that the turbulence would affect Norwegian banks’ access to funding. Since May, this turbulence has eased considerably. Norwegian banks satisfy capital and liquidity requirements by a solid margin and have ample access to both deposit and wholesale funding. Creditworthy firms and households have ample access to credit.
Banks’ profitability is the first line of defence against losses. Norwegian banks are highly profitable, and interest margins have risen since the tightening cycle began in 2021, at the same time as losses have been low. Interest margins are expected to decline and losses to edge up, but profitability is likely to continue to be solid. Losses on loans to households are expected to remain low. There is greater uncertainty about losses on loans to firms in the real estate sector, but some increase is expected. If rental income developments in the CRE sector prove markedly weaker than expected and selling prices fall sharply, bank losses may be substantial.
The capital requirements reflect the vulnerabilities in the Norwegian financial system and the countercyclical capital buffer requirement of 2.5% helps ensure that banks are well positioned to absorb higher losses. If there is a sharp economic downturn, credit losses may prove to be so large that banks will operate at a loss and have to draw on the capital they have built up. Stress and sensitivity tests, including in Financial Stability Report 2022, show that banks can absorb substantial credit losses, while still maintaining lending, and thus not amplify an economic downturn.
The financial system in Norway is resilient, and the overall financial stability outlook has not materially changed since the May Report. Financial system vulnerabilities are little changed over the past six months, and there is still a heightened risk that they can amplify an economic downturn. In the face of high inflation and higher interest rates, some households and firms may experience problems servicing their loans, but Norwegian banks are solid and well equipped to absorb higher losses.
Ida Wolden Bache
Pål Longva
Øystein Børsum
Ingvild Almås
Jeanette Fjære-Lindkjenn
1. Financial system risks, vulnerabilities and resilience
1.1 Continued risk of shocks that can weaken financial stability
The financial system is global. Shocks to financial markets or the real economy in other countries may therefore spread to Norway.
Sharp and rapid rise in interest rates
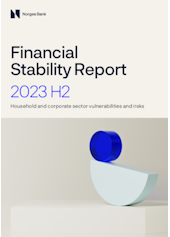
Global inflation has risen sharply since autumn 2021. Central banks worldwide have therefore raised policy rates sharply and rapidly. Disinflation is important for the long-term stability of the economy and the financial system. The rise in policy rates has led to a rapid rise in long-term interest rates from a low level (Chart 1.1).
Yields on 10-year government bonds in selected countries. Percent
The rise in interest rates has contributed to financial market unrest over the past year. In March, problems arose at certain banks, and the authorities in the US and Switzerland implemented measures to prevent the turbulence from spreading to other parts of the financial system. The events illustrate that the rapid rise in interest rates may uncover vulnerabilities and that it is difficult to foresee where these vulnerabilities will emerge.
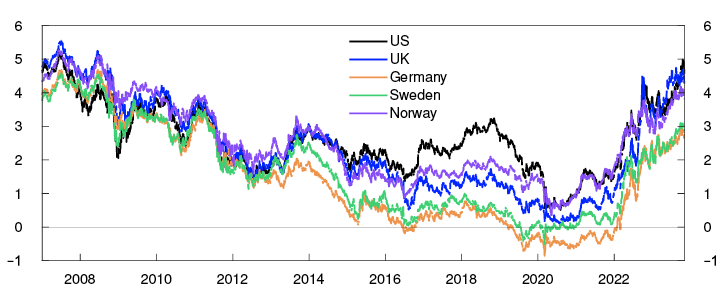
Since Financial Stability Report 2023 H1 in May, inflation has declined in many countries and is expected to decline further. However, economic growth has remained higher than expected. International policy rates are therefore expected to remain higher for somewhat longer. This has pushed up long-term interest rates (Chart 1.1), reflecting prospects for higher borrowing requirements in many countries, while many central banks unwind their asset purchase programmes and thus reduce demand for long-term fixed-income instruments. This has likely pushed up the premiums required by investors to hold long-dated rather than short-dated bonds, measured as the term premium.2 Uncertainty about the inflation outlook and future policy rate developments is still high, as illustrated by the continued high volatility in fixed income markets (Chart 1.2).
Volatility indicators for equity and fixed income markets
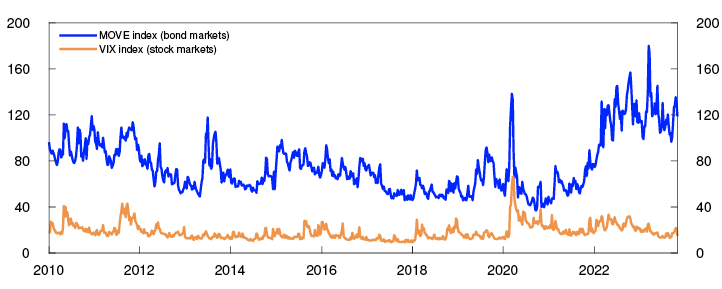
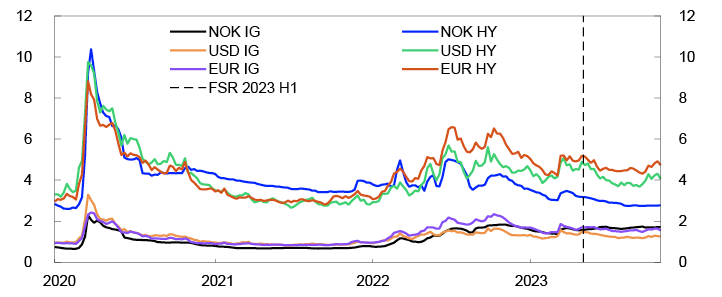
Following the market turbulence in spring, equity market volatility has declined. Stronger-than-expected economic growth has driven up equity prices, while higher interest rates have pulled down equity prices. Examining the period since May 2023 as a whole, leading equity indexes in the US and Europe have shown little change (Chart 1.3). In Norway, higher oil prices have fuelled an advance on Oslo Børs. Corporate bond risk premiums, both in Norway and internationally, have fallen slightly since May (Chart 1.4).
Selected equity indexes. 1 January 2020 = 100
Percentage points above the benchmark index
Risk of negative shocks that can weaken financial stability
Low but positive economic growth among Norway’s trading partners is expected over the next year (see Monetary Policy Report 3/2023). However, there is still a heightened risk of adverse events weakening financial stability.
Increased costs put pressure on the debt-servicing capacity of sovereigns, firms and households. Nevertheless, consumption has been sustained in many countries. This is likely because of robust labour markets and substantial savings accumulated by households during the pandemic. There is still a risk of a fall in consumption that could lead to a more pronounced economic downturn. In its October Global Financial Stability Report, the IMF points to the fact that high inflation and higher interest rates are contributing to raising the risk of weaker-than-expected growth.
In the commercial real estate (CRE) sector, higher interest rates have resulted in substantially higher financing costs. Many firms are therefore facing higher refinancing risk as much of their debt will mature in the coming years. This increases the risk of weakened financial stability because the CRE exposures of many banks and other financial institutions are high. Commercial property prices have risen over a long period, but over the past year, the rise in interest rates and prospects for lower economic activity have led to a price fall. In many countries, the decline in prices is being amplified by structural changes in the demand for commercial property, partly owing to the rise in remote working.
Furthermore, geopolitical tensions are higher than they have been for a long time. An escalation of war or conflict may result in renewed financial market stress and major disruptions to world trade. This may in turn lead to new inflationary pressures and weaker global growth prospects.
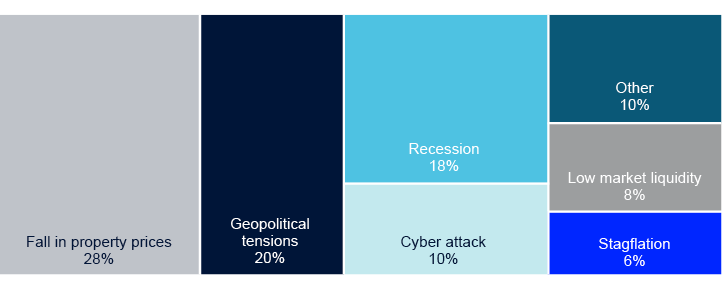
Norges Bank’s systemic risk survey conducted in October shows that Norwegian financial market participants consider a fall in property prices, geopolitical tensions, recession and cyber attacks to be the main sources of risk to the Norwegian financial system (Chart 1.5). They also assess that the probability of an event with a substantial impact on the financial system occurring in the next three years has increased somewhat, but that confidence in a stable financial system remains high.
Norges Bank’s systemic risk survey from October 2023. Which source of risk do you consider most likely?
Banks in a number of countries have tightened credit standards
Banks are the most important source of financing for most households and firms. As deposit rates have not been increased as much as lending rates, higher interest rates have also boosted profitability for many banks.
On the other hand, higher interest rates, uncertain growth prospects and a fall in property prices increase the risk of default among banks’ customers. This has contributed to banks in many countries becoming more restrictive in extending credit. Lending surveys indicate that US banks have tightened credit standards substantially over the past year, particularly for firms. European banks have also tightened credit standards but less than US banks.
In Norway, creditworthy households and firms have ample access to credit
In Norway, creditworthy households and firms have ample access to credit. The banks in Norges Bank’s lending survey reported unchanged credit standards for firms and households in 2023 Q3, as they did in 2023 Q2.
Banks have reported somewhat tighter standards for the CRE sector over the past year. In the survey for 2023 Q3, the majority of banks reported a somewhat higher risk that CRE firms and real estate developers will breach the terms of existing loan covenants and are imposing somewhat stricter equity requirements for new loans.
1 Period: 2 January 2007 – 3 November 2023.
2 See Norges Bank’s estimations of the term premium on 10-year government bond yields in Norway and a sample of other countries in Benum A, V.Ø. Opheim and E.S. Wasberg (2023) “Estimations of the term premium on Norwegian government bonds”. Government Debt Management Memo 3/2023. Norges Bank.
3 Period: Week 1 2010 – week 44 2023.
VIX and MOVE indexes measure expected 30-day volatility in equity and fixed income markets, respectively. The indexes are derived from option prices.
4 Period: 1 January 2020 – 3 November 2023.
5 Period: Week 1 2020 – week 44 2023.
Five-year credit premium on investment-grade (IG) and high-yield non-financial corporate bonds.
6 Based on Norges Bank’s systemic risk survey from October 2023. Survey respondents are a sample of participants in the Norwegian financial system, and responses reflect risk assesements at the time of the survey.
The chart shows the most likely risk in the financial system reported by the respondents.
1.2 Vulnerabilities in the Norwegian financial system are not building up further
Vulnerabilities in the Norwegian financial system may give rise to or amplify an economic downturn. Debt and property prices rose substantially over many years. Recently, household debt growth has slowed, and property prices have fallen. Norges Bank’s overall assessment is that vulnerabilities are not building up further. However, there is still a heightened risk that vulnerabilities could result in an economic downturn. If the slow pace of debt growth and property price inflation continues, financial system vulnerabilities may eventually diminish.
Household debt is falling from a high level, and many households are drawing on savings to cover increased costs
The fact that many households are highly indebted and therefore have to spend more of their income on interest payments when interest rates rise is the most serious vulnerability in Norway’s financial system. This increases the risk that households will be unable to service debt. This also increases the risk that households reduce consumption. A sharp tightening of consumption will reduce firms’ earnings and debt-servicing capacity, which may inflict losses on banks and amplify an economic downturn through tighter credit standards.
Over many years, household debt has risen faster than income and contributed to increased vulnerability of the financial system. In recent years, debt growth has gradually slowed, and over the past two years, indebtedness has risen less than income. This contributes in isolation to reducing vulnerability.
In response to higher interest rates, a loss of income or house price fall, households can for a period use liquidity to service debt or dampen a fall in consumption. Over the past 10 years, household financial wealth has risen faster than income. The rise was particularly pronounced in 2020. This has helped reduce household sector vulnerabilities. In 2022, many households drew on accumulated savings in response to high inflation and higher interest rates. The analyses in Section 2 show that households with the highest debt-to-income (DTI) ratios reduced bank deposits the most. Households with lower DTI ratios had higher deposits at the end of 2022 than before the pandemic.
The vast majority of households are able to service debt in the face of higher costs, but many will probably have to tighten consumption. Should consumption cuts prove substantial, corporate earnings and debt-servicing capacity could decline. This could lead to credit losses on corporate exposures and amplify an economic downturn with tighter bank credit standards. Household sector vulnerabilities are discussed further in Section 2.
House prices have fallen a little, and future developments are uncertain
House prices rose at the beginning of the year after falling the previous autumn. Since May, house prices have edged down in response to higher lending rates and a large stock of unsold homes. House price inflation is expected to be weak in 2024 before picking up again (see Monetary Policy Report 3/2023). This reflects low residential construction activity and expectations that residential mortgage rates will stabilise and decline further out. There is a risk that house price inflation will be weaker than currently envisaged. Residential mortgage rates have risen rapidly from a low level, and households’ response to higher interest rates remains uncertain.
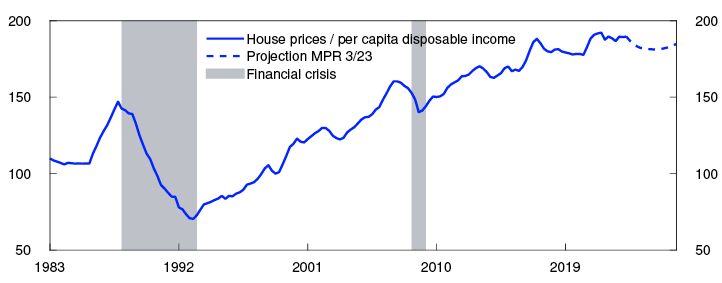
Over a long period, house prices have risen more than household income (Chart 1.6). This has increased housing market vulnerabilities and the risk of a sharp price fall that could trigger a tightening of household consumption and lead to higher bank losses. Over the past two years, house prices have risen broadly in pace with income. In the near term, house prices are expected to rise somewhat less than income. Such developments may reduce housing market vulnerabilities.
Index. 1998 Q4 = 100
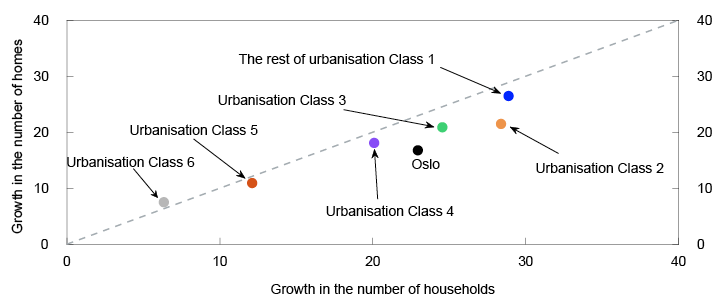
The low level of construction activity and low unemployment are dampening the risk of a large decline in house prices. Over the past 15 years, the increase in the number of homes has been lower than household formation. This applies particularly in urban areas, where household formation has been high (Chart 1.7). This trend is expected to continue into the coming years.
Past 15 years (2007–2022). Percent
Fall in commercial property prices and lower CRE sector earnings in response to higher interest rates
Banks’ high CRE exposures is a key financial system vulnerability. For a long period, low interest rates fuelled a rapid rise in commercial property prices. Prices have fallen over the past year, but the price outlook is more uncertain than normal. Commercial property prices are expected to be somewhat lower ahead.
CRE firms are facing reduced profitability as a result of higher interest rates, and lower commercial property prices are lowering their equity ratios. If both rental income and property prices should fall markedly, many firms will have problems servicing debt. Since high employment is helping sustain demand for office space, rental income is expected to rise, which means that most CRE firms will be able to cope with higher interest expenses. Lower equity ratios and weaker profitability will make rolling over maturing loans more demanding. This may force fire sales of properties, which can amplify a fall in property prices. This is discussed further in Section 3.
Other key vulnerabilities in the Norwegian financial system
Digitalisation and the close interconnectedness of banks make the financial system more efficient but also give rise to vulnerabilities. Serious cyber incidents can spread quickly across sectors and threaten financial stability (see Financial Infrastructure Report 2023). For example, Norwegian banks are interconnected through their cross-holdings of covered bonds. The fact that one bank’s funding is another’s liquidity reserve means that problems at one bank may more easily spread to other banks. This increases financial system vulnerabilities (see Financial Stability Report 2023 H1).
1.3 The financial system is resilient
Banks are clearly the most important source of credit for Norwegian households and firms, and resilient banks are therefore important for financial system stability. Norwegian banks satisfy capital and liquidity requirements by an ample margin.
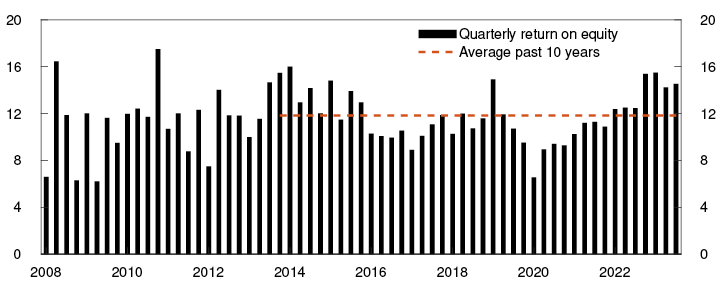
Current earnings are banks’ first line of defence against losses. Large Norwegian banks’ return on equity has been high in recent quarters and has been rising since 2020 (Chart 1.8). This primarily reflects higher net interest income and low credit losses. Analyses show that policy rate hikes often lead to higher net interest income.9 An important reason for this is that following a policy rate hike, banks generally raise lending rates more than deposit rates, ie the interest margin increases.10 Another reason is that banks do not pay interest on equity capital, which results in a greater rise in interest income than interest expenses when the policy rate is raised.
Return on equity after tax. Percent
The interest margin has increased since the tightening cycle began in 2021. The increase in the interest margin is being driven by a higher deposit margin (Chart 1.9). Some of the increase reflects the unusually low deposit margin during the pandemic owing to very low interest rates. An ample supply of deposits after the pandemic may have amplified the increase in the deposit margin. A lower lending margin has dampened the increase in banks’ interest margin.
Percent and percentage points
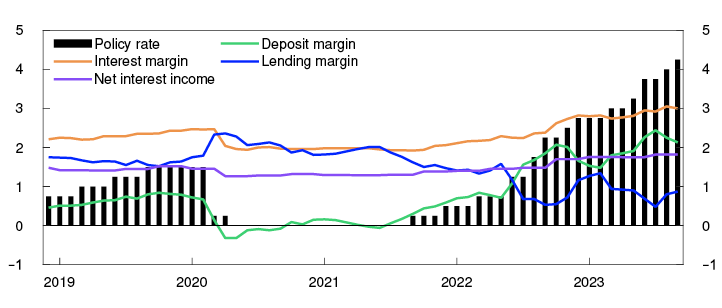
Deposits are not the only source of bank funding as wholesale funding accounts for a large share of total bank funding. Wholesale funding costs have increased considerably more than deposit rates and have curbed the increase in banks’ net interest income.
Looking ahead, the deposit margin is expected to edge down as a result of increased competition for household deposits, partly because households are reducing their deposits (see Section 2). This will pull the interest margin down somewhat, but profitability is expected to remain solid.
Bank credit losses are low, partly reflecting reversals of previous impairment, particularly for oil-related exposures. The reversals reflect better-than-expected economic developments in these sectors. In the period ahead, reversals are expected to be lower, which means losses will be somewhat higher.
In Financial Stability Report 2023 H1, credit losses were projected to edge up and lie at around the average for the past 20 years. So far this year, losses have been lower than projected. Somewhat higher losses on loans to households are expected owing to increased inflation and higher interest expenses, but the level will likely remain low (see the analyses in Section 2). Somewhat higher losses are also expected on loans to the property sector (see the analyses in Section 3). On the whole, developments since May suggest that banks’ credit losses may be slightly higher than the projections in the May Report, with losses surrounded by greater uncertainty than normal. If rental income developments in the CRE sector prove markedly weaker than expected and selling prices fall markedly, bank losses may rise substantially.
Norwegian banks are solid. This gives the flexibility to lend to creditworthy firms and households, even in the event of higher losses and market turmoil. For banks as a whole, the Common Equity Tier 1 (CET1) capital ratio has been over 18% since 2020. This is well above total capital requirements and above banks’ own target ratios. Capital adequacy is expected to remain broadly at the same level in the coming years.
Stress tests conducted by Norges Bank and Finanstilsynet show that sharp economic downturns can result in such large losses that banks will draw down their capital buffers.13 In the stress scenario in Financial Stability Report 2022, a sharp downturn resulted in significantly higher inflation and interest rates than are expected ahead. In the scenario, households were hit hard, which resulted in bank losses. Banks also incurred considerable losses on corporate exposures owing to a sharp fall in property prices and belt-tightening by many households. These are still relevant risks for bank losses (see Sections 2 and 3). The stress test showed that the largest Norwegian banks overall are capable of absorbing such large losses, while still continuing to maintain lending to households and firms, and thereby do not contribute to amplifying an economic downturn. The countercyclical buffer rate of 2.5% will enable banks to absorb higher losses.
Systemic risk in the Norwegian financial system
Key to financial stability analyses is assessing the risk of shocks, vulnerabilities and resilience in the financial system.
Shocks can come from different parts of the economy and financial markets, and can trigger financial turbulence or downturns. Higher interest rates are now affecting the financial system and increasing the risk of new shocks occurring. The shocks that may affect financial stability are difficult to foresee.
The vulnerability assessments are based on historical experience regarding what causes or amplifies downturns and financial turbulence and on assessments of new features of the financial system. We distinguish between cyclical vulnerabilities, which typically fluctuate more over time, and structural vulnerabilities, which are more persistent. It is difficult to clearly distinguish among vulnerabilities, and vulnerabilities can be mutually reinforcing.
The considerable rise in property prices over many years is a key cyclical vulnerability in the Norwegian financial system. High household indebtedness and banks’ high CRE exposures are key structural vulnerabilities. Norges Bank’s assessments of these vulnerabilities are presented in this Report. Other key structural vulnerabilities are the fact that one bank’s funding is another bank’s liquidity reserve (see Financial Stability Report 2023 H1), and that serious cyber incidents can threaten financial stability (see Financial Infrastructure Report 2023).
Financial system resilience can mitigate vulnerabilities and economic downturns. A number of measures have been introduced to boost resilience, such as solvency and liquidity requirements for banks and credit standards requirements (see Financial Stability Report 2023 H1 for an overview of the measures).
Chart 1.A. Summary of key financial stability assessments
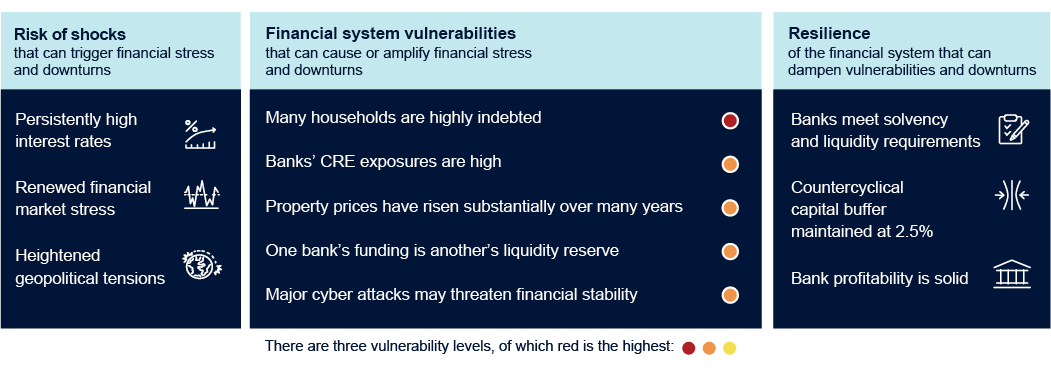
Source: Norges Bank
9 See Alstadheim, R. and R. Johansen (2023) “Norwegian banks’ net interest income and macroeconomic developments over the past 30 years”. Staff Memo 17/2023. Norges Bank.
10 This applies especially when the policy rate is raised from a very low level, since deposit margins are usually low or negative.
11 Period: 2008 Q1 – 2023 Q3.
Return on equity after tax for the seven largest Norwegian-owned banking groups. Annualised.
12 Period: December 2018 – September 2023.
Interest margin, lending margin and deposit margin for a sample of banks and mortgage companies in Norway. Net interest income as a percentage of average total assets for the seven largest Norwegian-owned banking groups.
Lending margin is defined as the difference between lending rate and money market rate (three-month NIBOR). Deposit margin is defined as the difference between money market rate and deposit rate.
The interest, lending and deposit margins are in percentage units.
The policy rate and the net interest income are in percent.
13 The losses in Norges Banks stress test were in some years approximately 10 times higher than what is expected ahead.
2. Households draw on savings to meet higher costs
An analysis of Norwegian households based on new data
Norwegian households are highly indebted, and Norges Bank has long considered high household debt to be the key vulnerability in Norway’s financial system. Owing in part to the Lending Regulation, some households have borrowed less than they would otherwise have done. Nevertheless, in 2021, debt held by approximately 20% of Norwegian households exceeded 400% of after-tax income. Given the combination of high indebtedness and floating rates,1 households have to spend more income on interest payments when lending rates rise.
Household expenses have risen on the back of high inflation and higher interest rates, which increases the risk that households will be unable to service debt and also increases the risk that households reduce consumption. A sharp tightening of consumption will reduce firms’ earnings and debt-servicing capacity, which may inflict losses on banks and amplify an economic downturn through tighter credit standards.
Recent research shows a greater reduction in consumption among highly indebted households with floating-rate loans than less indebted households in response to interest rate increases (see box on "Household access to liquid assets is important for changes in consumption"). Access to liquidity in the form of available accumulated savings and access to credit may cushion the reduction in consumption. Numerous studies also find that it is access to liquidity, not the level of debt, that affects changes in household consumption in the event of unexpected changes in income or house prices.
In this section, we analyse households’ overall financial position, ie both indebtedness (Section 2.1) and access to liquidity (Section 2.2) and we assess the risk that households default on debt or sharply reduce spending (Section 2.3). The section presents analyses of household sector vulnerabilities and risks and does not include new projections of household consumption. 2
1 In Norway, 94% of households’ total loans are at a floating rate.
2 The projections in Monetary Policy Report 3/2023 imply that household consumption will edge down in the course of 2023 before rising slightly in 2024.
2.1 Household leverage declines from a high level
Norwegian household leverage3 has risen over many years and is high both historically and compared with other countries (Chart 2.1). An important reason for the increased indebtedness is the long period of declining and low interest rates. This is why the interest burden, ie interest payments as a share of income, declined despite the increase in debt. The first post-pandemic policy rate hike was in 2021 Q3, and since then interest rates have risen rapidly. Households are expected to spend approximately 10% of their income on interest payments at the end of 2023. This is double the share since autumn 2021. Households have to spend just over 15% of income to service interest and estimated principal payments, called the household debt service ratio. The increase in the debt service ratio is less than the increase in the interest burden since some principal payments are deferred when interest rates on self-amortising mortgages are increased.4
Percent
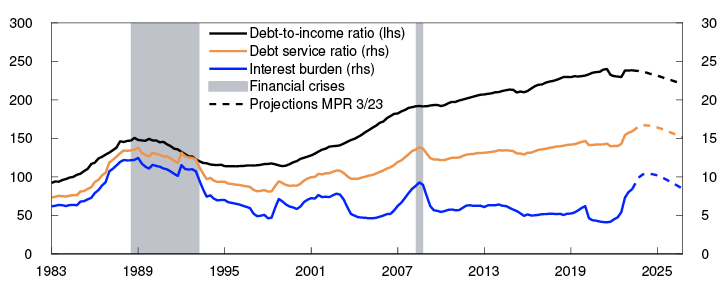
Leverage has declined somewhat since 2021 and is expected to fall further over the coming years (see Monetary Policy Report 3/2023). High inflation reduces the real value of debt and has led to higher nominal wage growth. Together with declining credit growth, this reduces leverage.6 Lower leverage will reduce the vulnerability of households further out.
The DTI ratio has increased over the past 10 years in all age and income groups (Chart 2.2). In 2021, which is the latest year with complete statistics for individual household income and wealth7, the DTI ratio declined in most household groups. The decline was most pronounced in the highest income decile, which may reflect their high accrued dividends in 2021. For other income groups, the DTI ratio was broadly unchanged between 2020 and 2021.
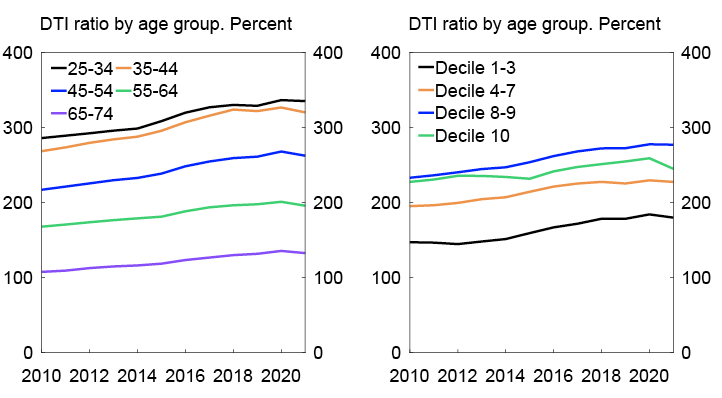
Finanstilsynet’s (Financial Supervisory Authority of Norway) residential mortgage survey9 for 2023 shows a decline debt as share of gross annual income among borrowers that take out a new residential mortgage.10 The decline in leverage was observed in all age groups. The results suggest that the debt-servicing requirement rather than the maximum DTI ratio is more of a binding constraint on households than earlier. This is shown by the fact that a smaller share of loans is being granted to borrowers with a DTI ratio above 4, while a larger share is being granted to borrowers with low liquidity in accordance with the interest rate stress test in the Lending Regulation.
There are wide differences in leverage across household groups. The youngest and the highest-income households are the most highly leveraged (Chart 2.2), which is closely linked to the lifecycle and home purchases. Newly established young households will typically be more highly leveraged, which increases with education levels (Chart 2.3, left panel). These are households with the highest expected income growth (Chart 2.3, right panel). These households are expected to have solid debt-servicing capacity over their lifespan, a factor which banks also likely assess when granting loans. Older households tend to have higher income and lower mortgage balances and are thus not as highly leveraged. Differences in both leverage and income growth across education levels decline with age.
3 Leverage is defined as debt relative to disposable income.
4 For self-amortising mortgages, the sum of interest and principal payments are distributed over the life of the loan so that each payment is the same amount.
5 Period: 1983 Q1 – 2026 Q4.
Projections from 2023 Q3 from MPR 3/23.
Househould debt-to-income (DTI) ratio is debt as share of disposable income. Disposable income is after-tax income less interest expenses. Household debt service ratio is interest expenses and estimated principal payments on loan debt to after-tax income. Interest burden is interest payments as a percentage of after-tax income.
6 See Jayaseela, N., K. Gerdrup,, and M. A. H. Gulbrandsen (2023): Høyere inflasjon har bidratt til å redusere husholdningenes gjeldsbelastning [Higher inflation has contributed to lower household debt-to-income ratios]. Bankplassen blog. 21 August 2023 (in Norwegian only).
7 Statistics Norway’s income and wealth statistics for households.
8 Period: 2010–2021.
Debt-to-income (DTI) is debt as a share of after-tax income.
Left panel: Age groups below 25 and above 75 are excluded.
Right panel: Households in the top percentile of net wealth are excluded.
9 The residential mortgage survey is based on information reported to Finanstilsynet by the 28 largest banks on close to 12 000 new residential mortgage loans granted after 1 August 2023. Close to 8 000 of these were repayment mortgages and close to 4 000 were home equity lines of credit.
10 The Lending Regulation includes a maximum DTI requirement of 500%. In Finanstilsynet’s residential mortgage lending survey, the DTI ratio is therefore debt as a share of gross income.
11 Left panel: Debt-to-income (DTI) is debt as a share of after-tax income in 2021. By age and education level. Households with net wealth in the top 1% of the distribution are excluded.
Right panel: Three-year income growth of individuals from 2018 to 2021. By age and education level in 2018. Individuals with the 5% highest and lowest incomes are excluded and individuals in households in the top percentile of net wealth are excluded.
2.2 Households have accumulated savings over many years and are now drawing on savings
Many household budgets have been tighter over the past two years than in previous years. This is because interest expenses have risen and inflation has been higher than wage growth, both of which reduce household purchasing power.12
Liquid assets may be used as a buffer for a period to service debt or to dampen a fall in consumption. Current income and accumulated savings in the form of bank deposits are the most usual form of liquidity. Other financial wealth and access to credit, such as home equity lines of credit, may also for a period alleviate the situation of households facing increased expenses or a loss of income. Households that spend all current income each month without access to other liquidity have to make greater adjustments than other households to meet a temporary increase in expenses or loss of income. If the increase in expenses persists, for example if interest rates remain high for a long time, even households with ample liquidity will need to make adjustments. In a situation where many households have limited or no financial buffers, the economy as a whole is more vulnerable to shocks.
Households’ financial buffers were high at the beginning of 2022
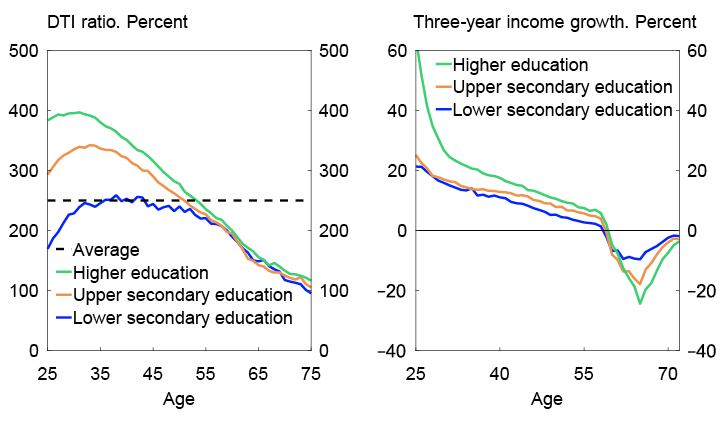
Household financial wealth, which includes bank deposits, mutual funds and equities, has risen faster than income over the past 10 years. The rise applies to all age groups and was particularly pronounced in 2020 (Chart 2.4). Developments point in isolation to a household sector that is less vulnerable over time.
Gross financial wealth as a share of annual after-tax income for different age groups. Percent
The increase in financial wealth may reflect both asset inflation over time and greater household investment in financial assets. Net financial investment, ie total purchase and sale of financial assets less changes in debt, is a measure of household financial saving behaviour. For many households, net financial investment is negative, but this is because the largest amounts borrowed are for a home purchase, and housing wealth is not included in financial investment.14 An analysis of household net financial investment shows a high level of financial asset saving across all wealth groups during the pandemic (Chart 2.5).15 This reflects limited consumption opportunities and heightened uncertainty. In 2021, the wealthiest households in particular had substantial savings in financial assets, while the saving ratio of households in the lower wealth deciles was close to its pre-pandemic level.
Net financial investment in billions of NOK
Bank deposits are most households’ primary and most liquid form of financial wealth. Overall, bank deposits rose substantially in 2020, and more than normal in 2021 too. As the increase in bank deposits was broad-based across households, households’ liquid financial buffers were high at the beginning of 2022 compared with before the pandemic.
Even though household financial wealth has increased over time, there are some households with a small or no financial buffer in the form of bank deposits. The share of households in this group has declined over the past 10 years (Chart 2.6). Households that are both highly leveraged and hold little liquidity are particularly vulnerable to interest rate increases. The share of households in this group has declined the most over the past 10 years. This suggests in isolation that the household sector at the beginning of 2022 was less vulnerable to shocks than previously.
Share of households with bank deposits amounting to less than half a month’s after-tax salary. At 31 December. Percent
Households draw on savings on the back of high inflation and higher interest rates
In the face of higher living costs and interest rates, a large share of Norwegian households has drawn on accumulated savings. Overall bank deposit growth slowed through 2022 and has continued to decline so far in 2023. Bank deposits are now rising at a slower pace than before the pandemic and at a markedly slower pace than income growth.
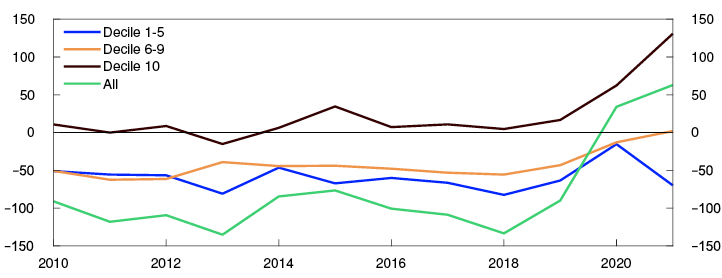
Tax returns for 2022 provide the latest available microdata for analyses of changes in individual households’ bank deposits.18 The data show that bank deposits fell for households in most income deciles in 2022 (Chart 2.7, left panel). When households are grouped by DTI ratio, the fall in bank deposits increases with the DTI ratio (Chart 2.7, right panel). However, the reduction in bank deposits was smaller than the increase in interest payments for most household groups.
Change in median bank deposit. In thousands of NOK
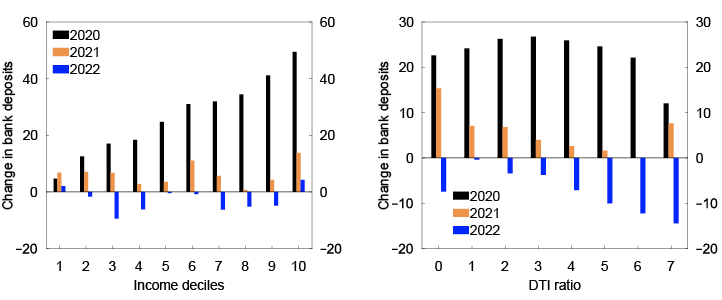
The reduction in bank deposits suggests in isolation that households are more vulnerable to new negative shocks. However, at the end of 2022, many households still had as much or higher levels of bank deposits relative to income than before the pandemic (Chart 2.8). This reflects the large increase in bank deposits in 2020, around half a gross monthly salary for the median household. Bank deposit growth was slower than income growth for most households in 2021 and 2022. Given the continued increase in costs this year, many households have lower bank deposits than at the end of 2022.
Bank deposits as a share of gross monthly salary. At 31 December
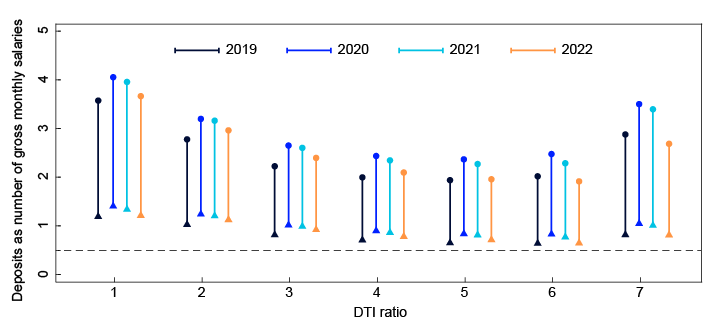
For the most highly leveraged households (5 or higher), median household bank deposits relative to income were at around the same level at the end of 2022 as before the pandemic (dot in Chart 2.8). This group represents around 13% of households. A quarter of them held close to or below half a gross monthly salary in bank deposits (triangle in Chart 2.8).
12 See Krogh, T and M. Mæhlum (2023): “Hvordan påvirkes husholdningenes kjøpekraft av høyere rente, prisvekst og lønnsvekst?” [How higher interest rates, inflation and wage growth affect household purchasing power]. Blog post on the Bankplassen blog, 30 May 2023 (in Norwegian only).
13 Period: 2010–2021.
The age groups below 25 and above 75 are excluded, as are households with net wealth in the top 1% of the distribution.
14 Total household saving, comprising both financial saving and saving in the form of tangible assets, such as a dwelling, has generally been positive since the early 1990s.
15 See Lindquist K.-G. and M. D. Riiser (2023): “Household financial saving”. Staff Memo 18/2023. Norges Bank (Forthcoming).
16 Period: 2010–2021.
Net financial investment is defined as the sum of all purchases and sales of financial assets adjusted for changes in debt.
17 Period: 2010–2021.
Debt-to-income (DTI) ratio is debt as a share of after-tax income. After-tax income is annual income divided by 12.
Low indebtedness is DTI below 3. High indebtedness is DTI above 3.
Households in the top percentile of net wealth are excluded.
18 These analyses are based on Norwegian taxpayer data for 2022 that had been processed by the Norwegian Tax Administration at 5 July 2023. Our underlying data consists of approximately 4.2m tax returns. We combine this information with information from Statistics Norway’s income and wealth statistics to verify data and observe developments over time. These final calculations and analyses are based on approximately 2.2m households, compared with 2.5m households in Norway in 2022.
19 Period: 2020–2022.
Debt-to-income (DTI) ratio is debt as a share of after-tax income. Households in the top percentile of net wealth are excluded.
20 Gross monthly income is pre-tax annual income divided by 12. The dot shows the median and the triangle shows the 25th percentile.
The broken line is a half gross monthly income and indicates a small financial buffer.
Debt-to-income (DTI) ratio 0 indicates DTI ratio between 0 and 1, DTI ratio 1 indicates DTI ratio between 1 and 2 etc. DTI ratio 7 indicates DTI ratio above 7.
2.3 Risk of default and sharp tightening of spending
Vast majority of households are able to service debt
Default rates among Norwegian households have been low since the banking crisis in the early 1990s, and household interest burdens are now at their highest level since the banking crisis. The risk of default is nevertheless limited by, for example, strong real income growth over the period, so that more income can be used to service debt. In addition, the Lending Regulation has long set limits on the maximum rise in interest rates households must be able to tolerate and how much they can borrow based on income and home value. Based on microdata for 2021, Norges Bank staff have analysed how higher interest rates influence household debt-servicing capacity.
The analysis shows that the vast majority of households that own their home are able to service debt, even if interest payments rise.21 It is assumed that households can service debt by drawing on income or accumulated savings or by increasing the LTV on their mortgage to up to 60% of the home value. The share of households that may find it difficult to pay regular expenses rises as lending rates increase (Chart 2.9). The average residential mortgage rate is expected to rise to 5.7% in 2024 (see Monetary Policy Report 3/2023). According to the analysis, just below 2% of households may experience payment problems at that rate. These households account for approximately 4% of residential mortgage debt (Chart 2.9).
Share that may have deb-servicing problems at different lending rates. By income quintile. Percent
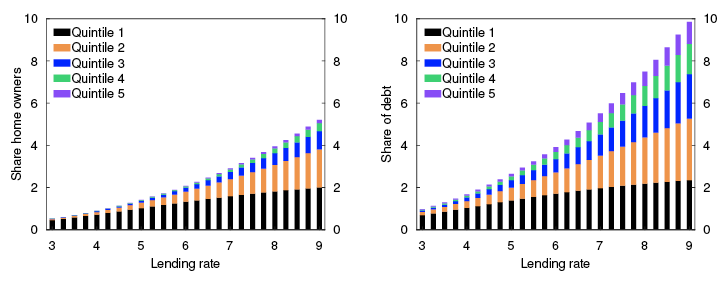
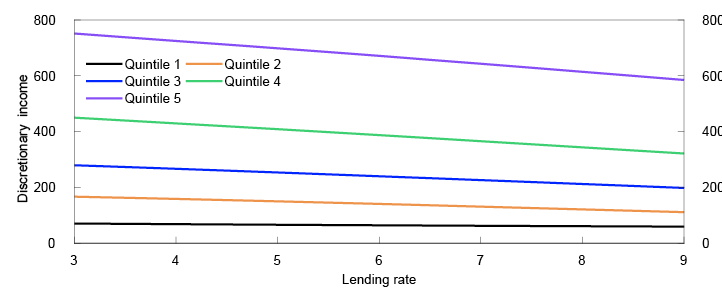
Discretionary income is income quintiles for different interest rate levels in 2021. In thousands of NOK
The analysis shows that most households with payment problems are in low-income groups. However, at interest rates above 5%, the risk of default increases even in the highest income groups. Since much of the debt is held by these groups, their share of debt at risk of default rises more.
Consumer debt is more vulnerable to losses than mortgage debt but accounts for a small share of total debt. Analyses of Norwegian households’ consumer debt show that much of the highly vulnerable consumer debt is held by low-income individuals who do not own a home.24 These households spend a large share of income on food and rent, for which prices have risen substantially over the past two years. Since 2019, consumer debt has risen more slowly than income, and no large increase in losses is expected.
The analysis in this section suggests that banks’ credit losses on loans to households are expected to edge up, but they will likely remain low (see Section 1). Before banks have to recognise losses, many households will probably tighten consumption further or make other adjustments, such as selling assets. Should lending rates prove higher than expected, households with high debt and little liquidity will be particularly vulnerable.
Risk of a sharp tightening of household consumption
Most households still have liquid buffers that they can use for consumption. Moreover, households with an LTV ratio below 60% can increase their mortgages or reduce principal payments relatively easily to alleviate their situation. The banks in Norges Bank’s lending survey reported in 2023 Q3 some increased use of interest-only periods on residential mortgages and they expect some further increase ahead. Some households will be unable to increase their borrowing or make use of interest-only periods. For them, current income will increasingly go to meeting living expenses, as their liquid buffers shrink. Small liquid buffers increase the sensitivity of consumption to unforeseen changes in income or a marked fall in house prices.
The extent to which a household tightens consumption will depend on its initial consumption level. Norges Bank does not have micro-level data on household consumption but is able to estimate household discretionary income, ie income after taxes and necessities. Discretionary income can be used for consumption and saving, including loan repayment. Substantial discretionary income also means that households can manage with higher interest payments without defaulting on debt.
Over a long period of low interest rates, most households have had a high level of discretionary income, with discretionary income highest in the highest-income groups (Chart 2.10). When interest rates rise, discretionary income falls the most for households in the highest income groups. The reason is that this group is the most highly indebted and thus faces the largest increase in interest payments. On the other hand, households with the highest income normally save more than others and have higher savings, enabling them to smooth consumption over time.
An analysis that looks at two households that purchased a home in 2021 illustrates the adjustments that need to be made to meet the recent higher living costs and interest rate increases (see box on "Expenses for households that purchased a home in 2021 considerably higher than expected"). Higher interest rates and weak real wage growth lead to a pronounced fall in discretionary income for both households. The household that borrowed the maximum amount under the Lending Regulation experiences a steeper fall in discretionary income. There is, however, little risk of default by the households as long as income levels are maintained, but they will have to spend an increasingly larger share of their accumulated savings to sustain consumption.
How total household consumption will be affected ahead remains highly uncertain. The Bank’s analyses indicate that highly leveraged households have spent the most of their bank deposits. Most households are still able to spend more of their accumulated savings in the face of higher costs and have a solid household balance sheet, but more households will also have to reduce consumption. For the broader population, such a tightening of consumption will not affect spending on necessities. Should the tightening of consumption become particularly pronounced, however, firms’ earnings and debt-servicing capacity may fall, which in turn may result in losses on banks’ corporate loans and thus lead to tighter credit standards and amplify an economic downturn.
21 The calculations use actual figures for the individual household’s after-tax income, gross financial wealth, debt and housing, and estimated figures for normal living expenses and interest expenses. Normal expenses are based on the National Institute for Consumer Research (SIFO) Reference Budget for Consumer Expenditure. In addition, fixed living expenses are projected, which include municipal fees, property tax and electricity. For a further description of the method, see Financial Stability Report 2022 and Lindquist, K.-G. H. Solheim and B. H. Vatne (2022) "Norwegian homeowners’ debt-servicing capacity is adequate". Staff Memo 8/2022. Norges Bank.
22 The groups are broken down by income quintiles. The first quintile is the fifth of households with the lowest after-tax income. The fifth quintile is the fifth of households with the highest income.
Self-employed and home owners where the main income earner is under the age of 20 and over 90 are excluded. Households with the 1% highest and lowest incomes and those with the highest 1% financial wealth are also excluded.
23 Self-employed and home owners where the main income earners are under the age of 20 and over 90 are excluded. The households with the highest and lowest 1% financial wealth are also excluded. Discretionary income is defined as after-tax income less regular expenses.
24 See Lindquist, K.-G., H. Solheim and B. H. Vatne (2022): Personer med lav inntekt og uten bolig holder mest av særlig utsatt forbruksgjeld [Low income, non-homeowners hold the largest share of the most vulnerable consumer debt]. Blog post published on the Bankplassen blog on 17 August 2022. Norges Bank (in Norwegian only).
Expenses for households that purchased a home in 2021 considerably higher than expected
The economic outlook has changed considerably in recent years. Inflation and interest rates have risen sharply since autumn 2021. Wage growth has also been high, but not as high as inflation, and purchasing power has therefore fallen. There have therefore been two negative surprises for a household that purchased a home in 2021: higher interest rates and lower real wage growth.
To illustrate how these channels affect highly indebted households, we examine two households that bought a home in 2021. The gross annual income of both households was NOK 950 000, which corresponds to the average household income in Norway in 2021. One of the households is assumed to have borrowed the highest possible amount under the Lending Regulation. Since interest rates were low in 2021, this household was bound by the debt-to-income (DTI) ratio requirement and therefore received a loan equivalent to five times its gross annual income. We assume that the other household borrowed the equivalent of three times gross annual income.1 Both households are assumed to have had sufficient equity to meet the 85% loan-to-value (LTV) ratio requirement. Both loans are 30-year amortising annuity mortgages. These calculations take into account the fact that some of the principal repayments are deferred when interest rates rise.
Our aim is to estimate the change in these households’ consumption and saving opportunities since 2021. To do so, we examine developments in household’s discretionary income after principal repayments.2 In 2021, discretionary income accounted for just under 22% of after-tax income for highly indebted households, and 43% of after-tax income for households with low debt.
Based on the projections of macroeconomic developments in Monetary Policy Report 3/2021, the households could expect a slight rise in discretionary income, even though interest rates were expected to edge up (see broken lines in Chart 2.A). Instead, low real wage growth and high interest rates have steadily eroded the discretionary share of after-tax income. For the more indebted household, discretionary income will have fallen to 10% of after-tax income at the end of 2024.
Chart 2.A Discretionary income has fallen more than households could have expected in 20213
Discretionary income as a share of after-tax income. Percent
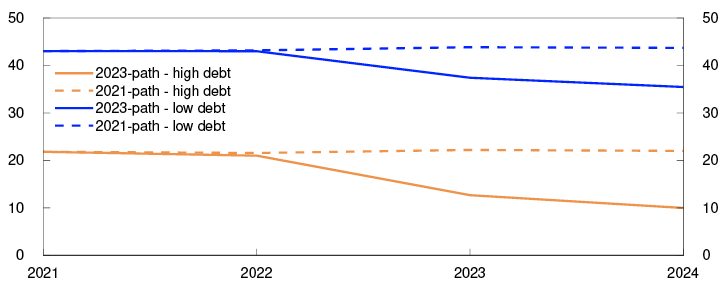
Sources: Statistics Norway and Norges Bank
Even though interest rates are expected to be high in 2024, discretionary income is set to fall, but are still expected to be positive. Households will magage to maintain normal consumption while servicing their debt. For the more indebted household, interest rates would need to rise to almost 10% for all discretionary income to disappear (see blue line in Chart 2.B). The less indebted household’s discretionary income will be reduced at that interest rate but will still amount to 30% of income.
Chart 2.B Discretionary income falls when interest rates rise4
Discretionary income as a share of after-tax income. Percent
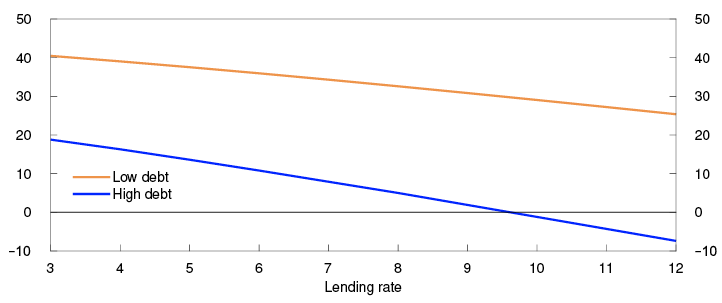
Sources: Statistics Norway and Norges Bank
The fall in discretionary income means that households must adjust consumption and saving. Households can, at least for a period, draw on financial wealth to maintain consumption.5 To illustrate this, both households are assumed to have financial wealth of approximately 30% of gross income.6 If the economic developments had been in line with the projections in 2021, the households could have maintained consumption without having to draw on financial wealth (see broken line in Chart 2.C). However, given actual developments, the financial wealth of the highly indebted household would fall to just under 10% of gross income in 2024, assuming that the household intends to maintain consumption when wages are no longer sufficient. The financial wealth of the less indebted household will fall to just over 15% if its consumption is maintained. This takes into account the fact that households have to spend increasingly more in order to maintain consumption at 2021 levels in response to the rise in prices.
Chart 2.C Financial wealth has to fall in order to maintain consumption7
Financial wealth as a share of after-tax income. Percent
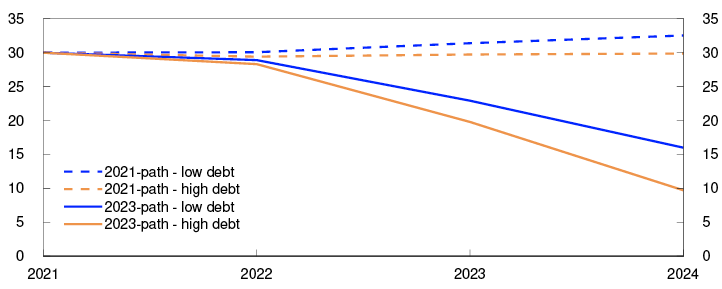
Sources: Statistics Norway and Norges Bank
This analysis shows that the financial situation has changed more for the household taking on more debt in 2021 and that it must therefore either reduce consumption or draw down on its financial wealth-1. A higher-than-assumed interest rate leads to a greater reduction in discretionary income, all else equal. The highly indebted household in particular will have to choose between substantially lower consumption or reducing debt, for example by downsizing in the housing market. As long as income is maintained, there is little risk of either household defaulting on its debt.
1 For example, this household purchased a home in a less urbanised area than the household that borrowed more.
2 The data and the methodology for estimating discretionary income are the same that are used in the analysis of default risk in Section 2.3.
3 Period: 2021–2024.
Discretionary income as a share of after-tax income. Developments in the discretionary incomes of two households, both with gross incomes of NOK 950 000 and loans of 3 and 5 times gross income in 2021, respectively, assuming income and interest rate developments in 2021 and given actual developments and projections at September 2023.
4 Discretionary income as a share of after-tax income in 2024 as a function of interest rate levels in 2024, for two households with gross incomes of NOK 950 000 and loans of 3 and 5 times gross income in 2023, respectively, assuming income and interest rate developments in 2021 and given actual developments and projections at September 2023.
5 The households could have applied for interest-only periods in order to boost discretionary income. Since both households in our example have an LTV ratio above 60%, banks must, under the Lending Regulation, use their flexibility quotas to grant these households interest-only periods.
6 This broadly corresponds to median household wealth of highly indebted households in this income segment.
7 Period: 2021–2024.
Financial wealth as a share of after-tax income for two households with gross incomes of NOK 950 000 and loans of 3 and 5 times gross income in 2021, respectively, assuming income and interest rate developments in 2021 and given actual developments and projections at September 2023.
-1 For an in-depth look at which expenses a highly indebted household can handle, see the blog “En husholdning med mye lån klarer utgiftene i 2024 – hvis de ikke får tvillinger” [A household with a lot of debt can manage its expenses in 2024 – if they don't have twins], published on the Bankplassen blogg on 8 November 2023 (in Norwegian only).
Household access to liquid assets is important for changes in consumption
Historically, economic downturns following periods of high debt growth have been deeper and more prolonged than others.1 After the financial crisis, a number of studies showed that highly indebted households reduced consumption more than others.2 These relationships have been interpreted to mean that high indebtedness makes household consumption more sensitive to shocks. In recent years, however, a number of microdata-based research papers have been published that provide more nuance to the notion that high indebtedness in itself is important for household consumption responses to higher interest rates, a loss of income and a fall in house prices.3
Changes in lending and deposit rates affect disposable income if households have floating-rate loans and deposits. The direct effect of interest rate changes on consumption via disposable income is usually called the “cash-flow channel”. Research based on data from countries where many households have floating-rate loans shows that changes in interest expenses and income feed through to changes in consumption.4 This channel is strongest for the most highly indebted and low-liquidity households. The reduction in consumption is often broadly equal to the increase in interest expenses, but households with liquidity do not tighten their consumption to the same extent. Furthermore, the analysis based on Norwegian data finds that for households with net financial wealth earning higher interest income when interest rates rise, consumption rises. The increase, however, is smaller than the additional income would suggest.
In the event of a loss of income owing to unemployment, most studies find that households reduce consumption. The reduction in consumption is more pronounced than what simple economic theory would suggest, ie that household consumption responses to temporary income losses are small because households attempt to smooth consumption over time. Studies that look at temporary income increases or decreases show that low-liquidity households, which have limited scope to smooth consumption, change their consumption the most.5 Debt levels in themselves do not determine the change in consumption.
The effect of a change in house prices on consumption is more uncertain. As long as households reside in the same dwelling, a change in the dwelling’s price is of little consequence for current income and expenses. At the same time, higher house prices allow a homeowner to take out an additional mortgage. Most studies suggest that a change in house prices influences consumption by affecting household access to credit, although these effects generally are minor.6
1 See eg Jordà, Ò., M. Schularick and A.M. Taylor (2013) “When credit bites back”. Journal of Money, Credit and Banking, 45(s2), pp 3–28; Jordà, Ò., M. Schularick and A.M. Taylor (2015) “Leveraged bubbles” Journal of Monetary Economics, 76, pp 1–20; Jordà, Ò., M. Schularick and A.M. Taylor (2016) “The great mortgaging: Housing finance, crises and business cycles”. Economic Policy 31(85), pp 107–152.
2 See Mian, A., K. Rao and A. Sufi (2013) “Household balance sheets, consumption, and the economic slump”. The Quarterly Journal of Economics, 128(4), pp 1687–1726; Mian, A. and A. Sufi (2014) “What explains the 2007–2009 drop in employment?”. Econometrica, 82(6), pp 2197–2223; Dynan, K., A. Mian and K.M. Spence (2012) “Is a household debt overhang holding back consumption?”. Brookings Papers on Economic Activity, pp 299–362.
3 For a more thorough review of this literature, see Gulbrandsen, M.A.H. (2023) “Does high debt make households more vulnerable? A survey of empirical literature using microdata” Staff Memo 3/2023. Norges Bank.
4 See Holm, M.B., P. Paul and A. Tischbirek (2021) “The transmission of monetary policy under the microscope”. Journal of Political Economy, 129(10), pp 2861–2904; Flodén, M., M. Kilström, J. Sigurdsson and R. Vestman (2021) “Household debt and monetary policy: Revealing the cash-flow channel”. The Economic Journal, 131(636), pp 1742–1771.
5 See Fagereng, A., M.B. Holm and G.J. Natvik (2021) “MPC heterogeneity and household balance sheets”. American Economic Journal: Macroeconomics, 13(4), pp 1–54; Baker, S. R. (2018) “Debt and the response to household income shocks: Validation and application of linked financial account data”. Journal of Political Economy, 126(4), pp 1504–1557.
6 See Browning, M., M. Gørtz and S. Leth-Petersen (2013), “Housing Wealth and Consumption: A Micro Panel Study”. The Economic Journal, 123(568), pp 401–428; Aladangady, A. (2017) “Housing wealth and consumption: Evidence from geographically-linked microdata”. American Economic Review, 107(11), pp 3415–3446; Andersen, H.Y. and S. Leth-Petersen (2021) ”Housing wealth or collateral: How home value shocks drive home equity extraction and spending”. Journal of the European Economic Association, 19(1), pp 403–440.
3. Higher interest rates affect the real estate sector in particular
An analysis of Norwegian firms’ financial positions based on financial reporting data
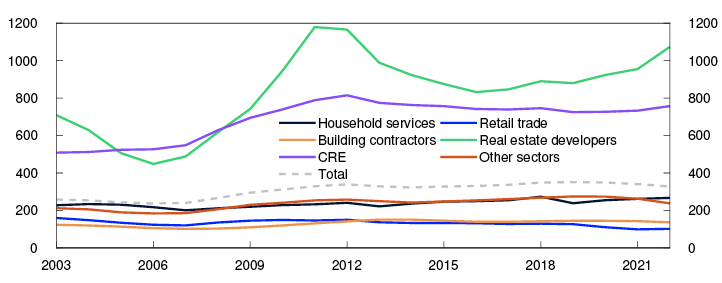
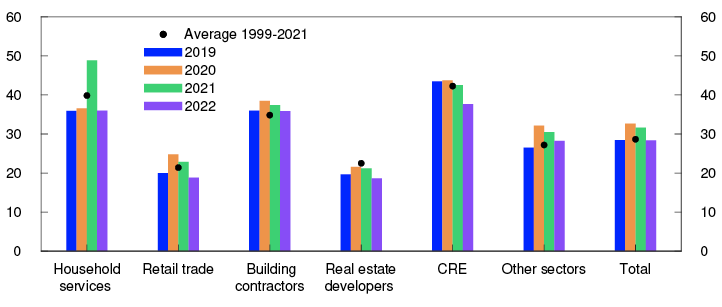
High inflation and higher interest rates impact all firms, albeit in different ways. In the financial stability assessment, there are three channels in particular through which the business sector is affected: higher interest expenses, lower construction activity and lower household consumption. First, higher interest rates affect firms directly by increasing their interest expenses. Particularly vulnerable to higher interest rates is the real estate sector, both commercial real estate (CRE) and real estate developers. This is because debt burdens, measured as debt relative to annual earnings, are relatively high in this sector (Chart 3.1). For other sectors, an interest rate increase accounts for a smaller share of current earnings. Second, higher interest rates and construction costs have reduced construction activity, which has primarily affected real estate developers and building contractors and their sub-contractors.1 Third, consumption-oriented sectors such as retail trade and household services are affected when higher prices and interest rates reduce household consumption.
Debt burden. Five-year moving average. Percent
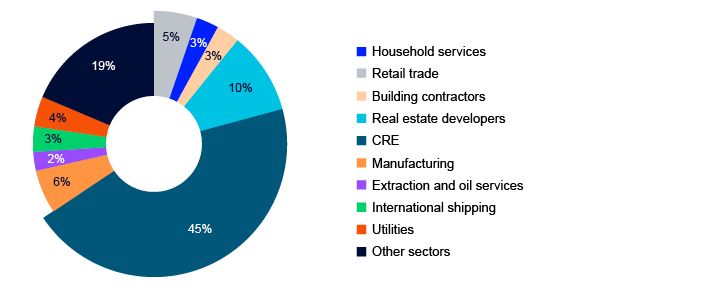
Approximately one-third of banks’ lending is to Norwegian non-financial corporates, and bank losses have historically been highest on corporate loans. Lending to vulnerable sectors accounts for approximately two-thirds of banks’ total corporate exposures (Chart 3.2). Section 3.1 describes developments in the vulnerable sectors in recent years and provides an assessment of the outlook ahead. In Norges Bank’s view, real estate exposures represent the largest financial stability risk, particularly to the CRE sector, because banks’ exposures to these firms are highest and they are therefore most affected by higher interest rates. Should banks incur substantial credit losses, tighter bank credit standards could amplify a downturn. The CRE sector and real estate developers are analysed in Sections 3.2 and 3.3, respectively.
Bank loans to Norwegian non-financial corporates at 31 December 2022
1 It is normally real estate developers that own the construction project and take out loans secured on the project, while the building contractor and sub-contractor account for most of the economic activity.
2 Period: 2003–2022.
Debt burden is interest-bearing debt as a share of earnings (EBITDA).
Household services refer to industry codes in groups 49.1, 49.3, 50.102, 50.109, 50.3, 51.1, 55–56, 79, and 90–97.
Building contractors refer to industry codes in groups 41.2 and 43.
Real estate developers refer to industry codes in group 41.1.
3.1 Firms were favourably positioned at end- 2022, but payment problems have increased somewhat in 2023
Corporate financial positions were solid at end-2022
For most sectors, economic developments were solid during the pandemic years 2020 and 2021. For vulnerable sectors, key figures in 2022 financial statements were somewhat weaker, but there are no signs of considerable change in their overall financial position.3
Corporate sector financial strength is solid. Equity ratios have risen steadily over an extended period (Chart 3.3). Overall corporate sector profitability, measured as firms’ operating margins, was close to its historical average in 2022 (Chart 3.4). During the pandemic, profitability was higher than average, especially in retail trade. In 2022, profitability in retail trade and household services weakened somewhat partly owing to higher operating costs. Profitability fell to well below average in real estate development due to a fall in revenue, while it remained solid among construction firms. CRE firms’ operating margins are typically high, as operating expenses related to leasing buildings are low and because much of their operating profits go to interest payments. Operating margins have fallen somewhat from the high levels in 2019.
Equity ratios. Percent
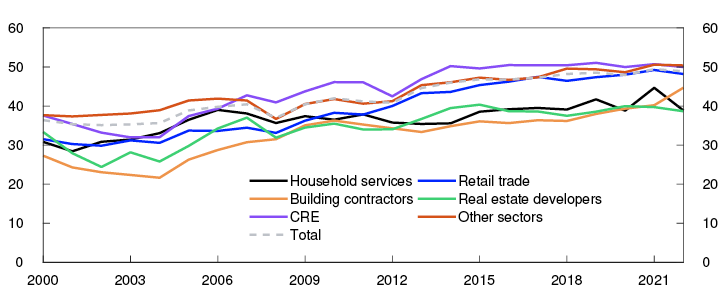
Operating margins. Percent
Liquid buffers increase firms’ resilience to periods of reduced earnings. During the pandemic, corporate bank deposits increased more than firms’ current liabilities (Chart 3.5).6 In 2020, the increase in bank deposits was broadly distributed across industries. This likely reflects firms’ desire to build up larger liquid buffers and the fact that they received government support. Certain industries, such as retail trade, posted very favourable results, which contributed to sharp deposit growth for these industries. Growth in total bank deposits continued in 2021, driven then by oil and power sector firms. The sharp rise in deposits from these industries continued in 2022. Growth in most other industries slowed in 2022 and bank deposits relative to current liabilities fell back to pre-pandemic levels.
Bank deposits as a percentage of current liabilities. Percent
Number of bankruptcies still low, but some increase in payment problems in 2023
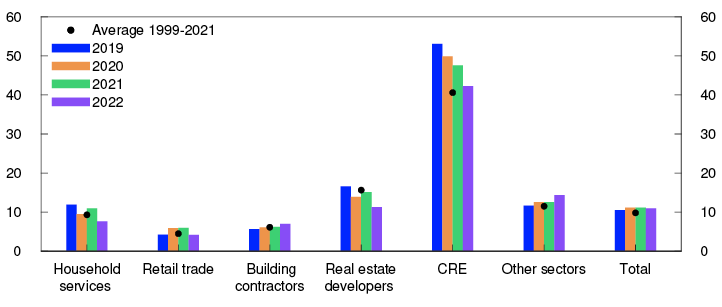
Owing to solid economic developments in recent years, the share of corporate bankruptcies is relatively low (Chart 3.6). The number of corporate bankruptcies has risen since autumn 2022 but the share of corporate bankruptcies is not higher than before the pandemic. During the pandemic, bankruptcies fell considerably among consumption-oriented firms (ie retail trade and household services), which saw the largest increase in bankruptcies over the past year. Most of the firms that have gone bankrupt are relatively small. Bankrupt firms’ bank debt as a share of total corporate debt is still lower than before the pandemic.
Share of firms that have gone bankrupt over the past 12 months. Percent
In 2023, growth in the Norwegian economy has slowed, and low growth is expected ahead (see Monetary Policy Report 3/2023). Profitability among listed firms declined somewhat in the first half of 2023.
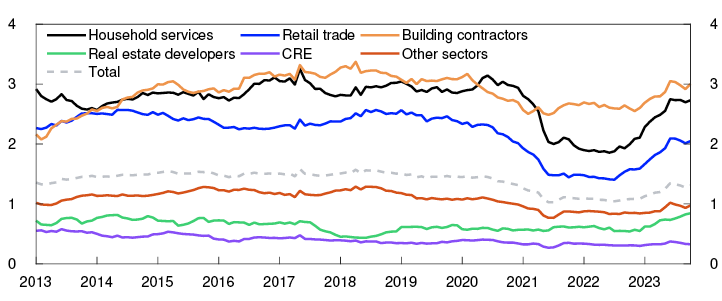
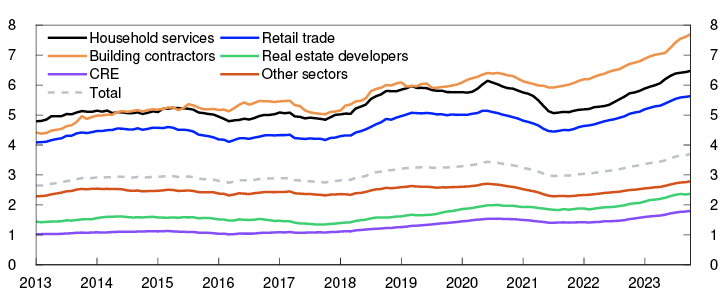
It takes some time for financial problems to feed through to bankruptcies. Developments in reports of firms’ past-due payments is an indicator of future bankruptcy developments. The share of firms facing a newly reported past-due payment has increased steadily since 2022 (Chart 3.7). In all sectors, a larger share of firms is now facing debt collection than before the pandemic, but the increase is relatively greater in the vulnerable sectors than in other industries. This may be a sign that the number of bankruptcies will continue to edge up in these sectors.
Monthly share of firms with new collection cases. 12-month moving average. Percent
Normally, few real estate developers face debt collection or file for bankruptcy. This is, however, the sector that has experienced the largest relative increases in both the share of firms facing debt collection and in bankruptcy rates. It is also the sector with the weakest financial performance in 2022.
Among consumption-oriented businesses and construction firms, debt collection cases and bankruptcies are normally more common than in other sectors. This reflects these sectors’ typically small profit margins and low capitalisation which therefore makes them less resilient to temporary declines in demand. Higher costs put further pressure on these sectors. If consumption and construction activity were to fall more than anticipated (see the projections in Monetary Policy Report 3/2023), payment problems could quickly escalate and bankruptcies could pick up further. The risk of substantial bank losses is nevertheless limited by the fact that these sectors account for a relatively small part of total exposures (Chart 3.2). However, consumption-oriented sectors and building contractors account for almost half of private sector employees. Problems in these sectors have large spillovers to the wider economy and pose a risk to CRE firms’ rental income.
3 The financial statement analysis covers Norwegian non-financial limited companies that have submitted annual financial statements for the applicable year. Firms in oil and gas extraction, and power companies are omitted from the analysis owing to substantial earnings volatility that has a disproportionately large impact on overall developments. Bank exposure to such firms is relatively small.
4 Period: 2000–2022.
Equity ratio is the book value of equity as a percentage of total capital (equity and debt).
5 Period: 2019–2022.
Operating margins are earnings (EBITDA) as a percentage of revenue.
6 For a further discussion of developments in corporate bank deposits, see Hjelseth, I.N. and S.J. Kirkeby (2023) “Hvorfor økte foretakenes bankinnskudd mye under og etter pandemien?”. [Why did firms’ bank deposits increase substantially during and after the pandemic?] Blog post published on the Bankplassen blog, 8 November 2023. Norges Bank.
7 Period: 2019–2022.
Current liabilities refers to debt and liabilites with a maturity of less than one year.
8 Period: January 2013 – October 2023.
The share of companies that have gone bankrupt over the past 12 months is the sum of bankruptcies over the past 12 months as a percentage of the total number of companies in the sector over the past 12 months.
9 Period: January 2013 – October 2023.
The monthly share of firms with new collection cases is the number of firms with at least one new reported past-due payment per month as a percentage of the total number of firms in the sector.
3.2 CRE firms particularly affected by higher interest rates
Higher interest rates are weakening CRE firms’ earnings
Overall, CRE firms’ debt-to-earnings ratios are high, and these firms are therefore vulnerable to higher interest expenses. Since winter 2022, the rise in interest rates and credit premiums have led to a marked increase in CRE firms’ financing costs.
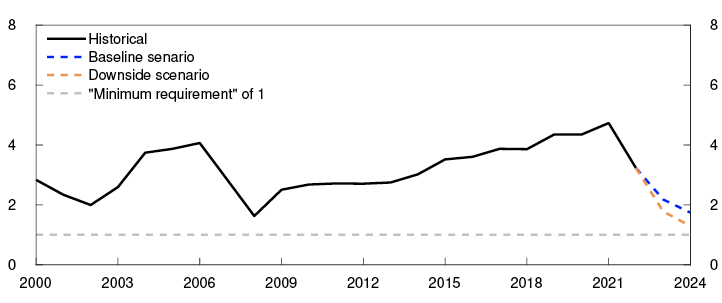
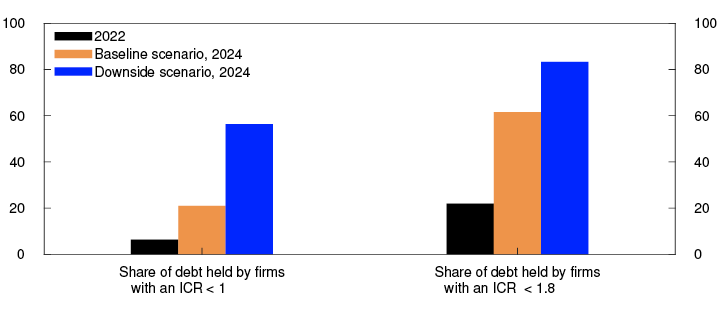
The interest coverage ratio (ICR), a measure of a firm’s current earnings (EBITDA) relative to interest expenses,10 rose in the years preceding and during the pandemic for CRE firms overall, driven by both solid earnings and low interest rates. In 2022, the ICR fell close to its average value over the past 20 years (Chart 3.8). Estimates based on consolidated financial statements11 show that almost all CRE groups were able to cover interest expenses with current earnings in 2022. At that time, 6% of the total debt in CRE groups was held by groups with an ICR below 1 (Chart 3.9).
Scenarios for ICR
Share of CRE debt with ICR below 1 and 1.8. Percent
For CRE firms, interest expenses are assumed to increase by approximately two-thirds in the period between 2022 and 2024. Higher interest expenses are gradually phased into firms’ cash flows, since portions of their debt are at a fixed rate, and higher credit premiums do not normally affect cash flows until the debt is rolled over.
High employment is driving up demand for office space. Rental income for CRE firms is expected to increase by approximately 10% between 2022 and 2024. As rent inflation over the past few years has been high, it will be more likely that new leases will be entered into at higher rents than expiring leases, even if there are weak developments in market rents. CPI adjustment of rents under existing leases will also boost rental income.
The projections for interest expenses and rental income show that most firms are still able to cover higher interest expenses with current earnings. In the baseline scenario, the ICR is projected to fall to slightly below 2 in 2024 (Chart 3.8). Debt held by CRE groups with an ICR below 1 is projected to rise to approximately 20% of total debt for CRE groups (Chart 3.9).
In a downside scenario, where average interest rates rise more than projected, and rental income is markedly weaker than expected, the ICR for CRE firms as a whole could fall to just over 1 (Chart 3.8). In such a scenario, just over half of the total debt is held by CRE groups where interest expenses exceed current earnings in 2024 (Chart 3.9).
Increased refinancing risk for CRE firms
Even though most firms are expected to be able to service higher interest expenses with current earnings, Norges Bank’s analyses indicate that the share of CRE firms breaching loan covenants will increase somewhat in the next few years. This alone could weaken debt-servicing capacity. Many banks set requirements for ICR. Breaching such a requirement could, among other things, lead to even higher interest rates on existing loans. For firms that rely on bond financing, some credit rating agencies require an ICR above 1.8 to qualify for an investment-grade credit rating. If the ICR falls below this threshold, the bonds may be downgraded, with a marked rise in yields on new and existing bonds. In the baseline scenario, the share of the total debt held by CRE groups with an ICR below 1.8 increases from just above 20% in 2022 to slightly more than 60% in 2024 (Chart 3.9).
The rise in financing costs and lower equity ratios due to lower CRE prices may pose challenges to CRE firms that need to refinance their debt. Bank debt accounts for the largest share of CRE firms’ debt, but bond debt has increased substantially over the past decade. Over the past year, bond issuance volumes by CRE firms have been low (Chart 3.10). Life insurance companies are important investors in real estate bonds. Their demand for these bonds has fallen over the past year, likely reflecting the higher yields and higher returns on the safest securities. Falling demand from the largest real estate bond investors may have made it more costly for CRE firms to raise capital in the bond market. Much the bond debt will mature in the coming years, and some CRE firms may find it difficult to issue new bonds. Norwegian banks’ exposures to firms with the lowest equity ratios and with substantial bond debt that will soon mature are low (see Financial Stability Report 2023 H1).
Domestic credit to the CRE sector. Twelve-month change. Percent
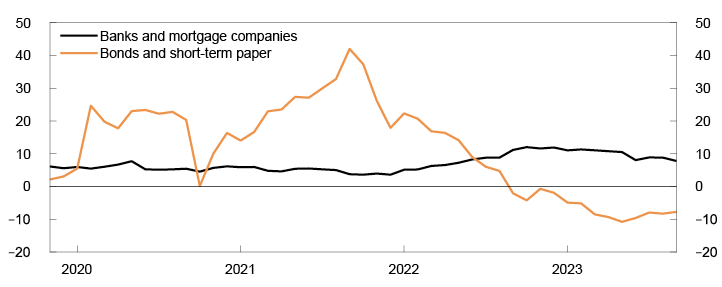
Banks in Norges Bank’s lending survey reported tighter credit standards for CRE firms over the past year. In this period, most banks reported tightening equity and debt-servicing capacity requirements for new loans to CRE firms. Furthermore, most banks reported an increased risk that borrowers will breach the terms of loan covenants related to equity and interest coverage ratios. Nevertheless, growth in banks’ CRE lending has remained steady (Chart 3.10), reflecting the fact that CRE firms have issued few bonds over the past year and a half. Norges Bank’s analyses show that CRE firms give considerable weight to financing costs when choosing between bank and bond financing.15
Firms struggling with profitability or refinancing must draw on financial buffers, sell off property or raise more equity in order to continue operating. Fire sales of properties could amplify the decline in commercial property prices.
Commercial property prices fall on the back of higher interest rates
Commercial property prices have fallen over the past year after rising over a fairly long period (Chart 3.11). Selling prices are calculated as rental prices divided by a yield. The yield depends on developments in long-term interest rates and risk premiums. Since last autumn, the rise in interest rates has resulted in markedly higher yields and a fall in selling prices. However, the yield has increased less than long-term interest rates over the past few years.
Prime office space in Oslo. Estimated selling prices. In thousands of NOK per square metre
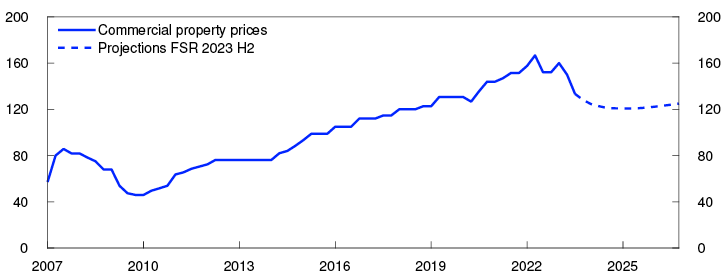
An increase in the yield is expected over the next two years, so that the gap between long-term interest rates and the yield normalises. A moderate rise in rents is also expected as economic activity slows, while high employment helps sustain demand for office space. Overall, the projections for the yield and rent inflation imply that commercial property selling prices will fall somewhat further into next year before levelling off (Chart 3.11). Since the fall in prices is mainly driven by higher interest rates, it is likely to be broad-based across segments.
Commercial property prices may fall more than currently envisaged. Renewed periods of market stress may lead to a higher risk premium and yield than assumed. If long-term interest rates rise further, this may push up the yield more than expected. Furthermore, higher financing costs may force many firms to sell properties quickly to improve their financial position, which may amplify a price fall.
Developments in rents largely depend on developments in employment and the level of economic activity. A more pronounced-than-expected slowdown in the economy may result in lower-than-projected rental and selling prices. Structural changes as a result of extensive remote working have led to a marked increase in office vacancy rates in many countries. In Norway, there are so far no signs that the use of remote working arrangements has significantly weakened demand for office space, but if this changes, rental and selling prices may fall markedly.
Lower commercial property prices are lowering CRE firms’ equity ratios
Reduced property values are putting pressure on the equity of CRE firms. If the price fall leads to lower collateral values than the carrying amount of loans, banks may incur losses if the debt is defaulted on.
Even though losses have historically been low in normal times, during severe crises, CRE is the sector where bank losses have been highest. During the banking crisis between 1988 and 1993, banks incurred losses on approximately one-third of their CRE exposures. During the financial crisis in 2008, commercial property prices were almost reduced by half, while bank losses remained at moderate levels. A rapid recovery of commercial property prices likely contributed to dampening losses. CRE firms have higher equity ratios now than they did prior to the financial crisis (see box on "Many CRE firms’ equity is higher than shown in their financial statements"). Furthermore, surveys of market participants regarding bank lending practices indicate that banks have over several years increased the equity requirement for loans to CRE firms.
Losses on CRE loans have risen slightly over the past year but remain at low levels. The expected fall in prices will likely lead to somewhat higher losses on banks’ CRE exposures. A simple solvency exercise shows that if all CRE firms reduce the carrying amount of their properties by 30%, which is equivalent to a somewhat greater-than-expected price fall, almost one-fourth of exposures will be to CRE firms with negative equity (Chart 3.12). The equity ratio of the CRE sector is, however, better than what book equity would suggest. The carrying amounts of many Norwegian CRE firms’ properties reflect purchase prices, which are often lower than fair value (see box on "Many CRE firms’ equity is higher than shown in their financial statements"). When more realistic assumptions are made about buildings’ actual impairment, the vast majority of firms are found to still have positive equity, even in the event of a steeper-than-expected price fall.
Percent

A number of factors may result in a far steeper price fall than assumed in this exercise. If rental income developments are markedly weaker than expected, both earnings and property values will fall. The stress test in Financial Stability Report 2022 shows that in a sharp economic downturn where commercial property prices are reduced by nearly half, banks’ losses on loans to this sector may be substantial.
10 An ICR equal to 1 means that earnings (EBITDA) cover interest expenses exactly. This may be viewed as a minimum requirement for what earnings must be over some time.
11 Consolidated financial statements provide a broader picture of the financial situation than those at the firm level and are therefore better suited for micro-level analyses. The sample of consolidated financial statements for CRE groups represents total interest-bearing debt of just over NOK 460bn by the end of 2022. By comparison, total interest-bearing debt of all Norwegian CRE firms amounts to just over NOK 850bn at this point.
12 Period: 2000–2024.
Projections from 2023 from FSR 2023 H2.
Interest coverage ratio (ICR) is earnings (EBITDA) relative to interest expenses.
In the baseline scenario, the average interest rate is assumed to increase by 2.5 percentage points in the period between 2022 and 2024. It is further assumed that revenue and operating expenses will rise by 10% and 4%, respectively, in the same period. Interest-bearing debt is also assumed to rise by 9% in the period between 2022 and 2024.
In the downside scenario, the average interest rate is assumed to increase by 3.3 percentage points in the period between 2022 and 2024. It is further assumed that revenue will fall by 2% and operating expenses will rise by 4% in the same period. Interest-bearing debt is also assumed to rise by 9% in the period between 2022 and 2024.
Legal entities in commercial real estate.
13 Interest coverage ratio (ICR) is earnings (EBITDA) relative to interest expenses.
In the baseline scenario, the average interest rate is assumed to increase by 2.5 percentage points in the period between 2022 and 2024. It is further assumed that revenue and operating expenses will rise by 10% and 4%, respectively, in the same period. Interest-bearing debt is also assumed to rise by 9% in the period betweem 2022 and 2024.
In the downside scenario, the average interest rate is assumed to increase by 3.3 percentage points in the period between 2002 and 2024. It is further assumed that revenue will fall by 2% and operating expenses will rise by 4% in the same period. Interest-bearing debt is also assumed to rise by 9% in the period betweem 2022 and 2024.
CRE groups with interest-bearing debt.
14 Period: November 2019 – September 2023.
Twelve-month growth in credit (domestic credit C2) to CRE firms from various credit sources.
15 See Bjørland, C. (2023) “CRE firms’ refinancing and cash flows at a time of high inflation”. Staff Memo 11/2023. Norges Bank.
16 Period. 2007 Q1 – 2026 Q4.
Projections from 2023 Q4 from FSR 2023 H2 for commercial property prices.
17 Share of CRE firms' interest-bearing debt within each equity threshold.
Simple solvency exercise assuming a 30% fall in property values. The blue line shows the distribution of debt and equity if property value carrying amounts are reduced by 30% for all groups. The orange line shows the distribution if property value carrying amounts are reduced by 30% for groups applying IFRS and 10% for those applying the Norwegian accounting Act.
CRE groups with interest-bearing debt.
3.3 Lower revenues and higher costs for real estate developers
The rise in construction costs over the past years has led to a rapid increase in new home prices (Chart 3.13). Together with higher interest rates and uncertainty about further house price developments, this has resulted in a sharp fall in new home sales, in turn leading to lower residential construction activity. The latest projections in Monetary Policy Report 3/2023 suggest that housing investment will continue to fall slightly further before picking up again (Chart 3.14). Commercial building construction activity is also at a low level.
Index. 2019 Q1 = 10018
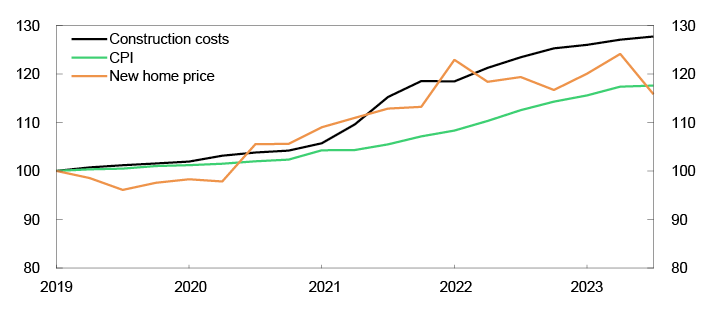
Seasonally adjusted. In billions of NOK
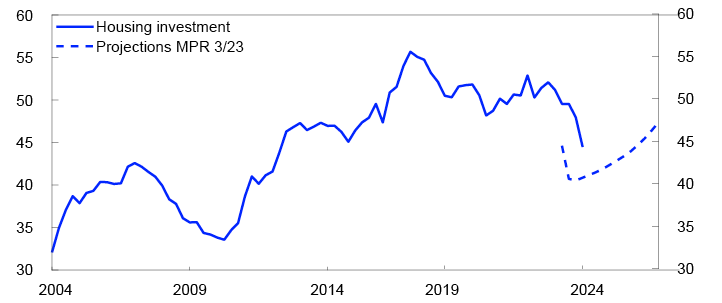
Lower construction activity means lower income for both real estate developers and building contractors, but real estate developers are particularly vulnerable as the sector has far higher debt to service and is therefore more sensitive to higher interest rates. In Norges Bank’s lending survey for 2023 Q3, most banks report a somewhat higher risk that real estate developers will breach the terms of loan covenants relating to both debt-servicing capacity and equity ratios.
In 2022, real estate developers’ interest expenses increased somewhat, while earnings fell slightly. This resulted in a decline in the ICR (Chart 3.15). Simple estimates show that the ICR may fall markedly in 2023 and 2024. The extent of the fall will primarily depend on how high interest rates rise, how much revenues decline and whether real estate developers are able to maintain margins.
Scenarios for ICR
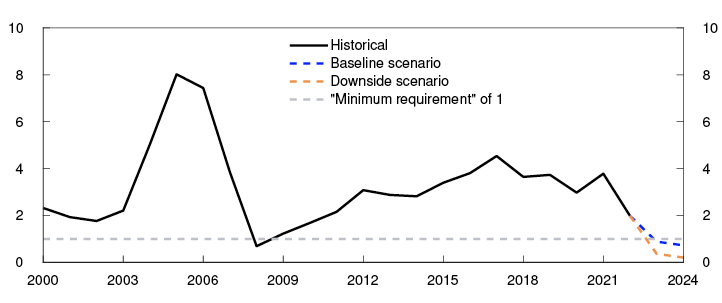
In the baseline scenario, the ICR is reduced by half from 2 in 2022 to a little below 1 in 2023 and further to 0.7 for the sector as a whole (Chart 3.15). That is, all earnings in 2023 will go to servicing higher interest expenses, while interest expenses in 2024 will exceed total earnings. In the baseline scenario, it is assumed that revenue will fall as much as housing investment and that interest expenses will double between 2022 and 2024.
There is a risk that the cost level will be higher than assumed in the baseline scenario. Another risk is that many of the homes now being completed will remain unsold for some time.21 In a downside scenario, we assume a marked decline in earnings resulting from either a higher cost level, a higher-than-normal stock of unsold homes, or a combination of the two. This means that current earnings will be very low. In the scenario, the ICR falls to well below 1 in 2023 and to 0.2 in 2024.
To assess the consequences of a decline in the overall ICR, the Bank has analysed the financial statements of a sample of corporate groups,22 covering just above 40% of banks’ total exposures to real estate developers. The analysis shows that 12% of exposures were to corporate groups with an ICR below 1 in 2022 (Chart 3.16). In the baseline scenario, this share rises to just below 50% in 2023 and to just below 60% in 2024. In the downside scenario, the share rises to over 60% in 2023 and to 75% in 2024.
Share of loans to real estate developers in groups with an ICR below 1. Percent
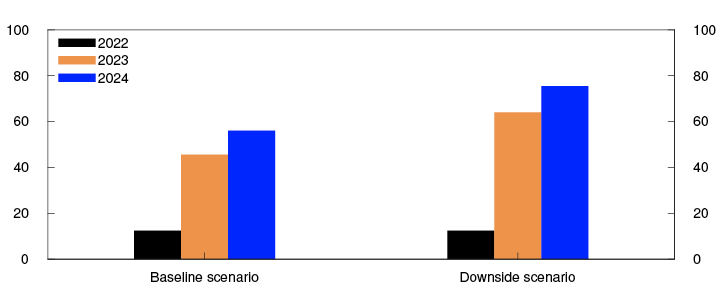
The estimates suggest that it will become more difficult to service interest expenses out of current earnings. When earnings become insufficient to cover interest expenses, firms must draw on their financial buffers. Many firms are likely to have sufficient liquidity to face a period of losses. It may be necessary for firms without sufficient liquidity available to sell land and property development projects or raise more capital.
Groups with solid equity ratios are better positioned to meet challenges. In the sample, just over 20% of real estate development exposures are to groups that had equity ratios below 20% in 2022 (Chart 3.17). This share was approximately 10% among the groups in the baseline scenario with an ICR below 1 in 2024. This suggests that the groups that will likely face challenges servicing debt out of current income have more equity to draw on than other groups.
Percent
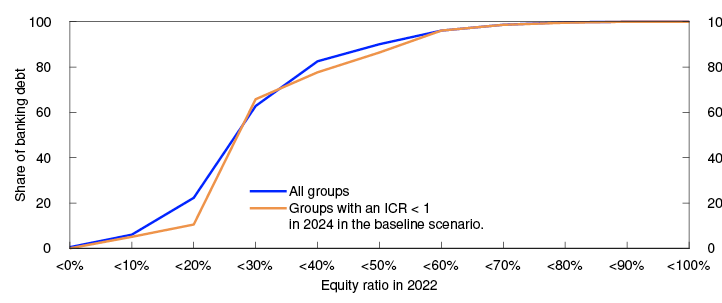
Given property developers’ financial situation, banks may expect somewhat higher losses on loans to this sector (see Section 1). If there is a sharper reduction in property developers’ earnings than expected and a significant fall in equity, losses may be much larger. Nevertheless, property development accounts for only 10% of banks’ corporate exposures. This limits the possible size of losses on these loans relative to the total corporate loan portfolio.
18 Period: 2019 Q1 – 2023 Q3.
19 Period: 2004 Q1 – 2026 Q4.
Projections from 2023 Q3 from MPR 3/23 for housing investment.
20 Period: 2000 – 2024.
Projections from 2023 from FSR 2023 H2.
Interest coverage ratio (ICR) is earnings (EBITDA) relative to interest expenses.
In the baseline scenario, the average interest rate is assumed to rise in pace with the average change in the policy rate path in MPR 3/23. Incomes decline by 14% in 2023 and 5% in 2024. Operating expenses fall by 90% of the decline in 2023, and by an equal percentage in 2024. This produces a fall in the operating margin from 11.3% in 2022 to 9.8% in 2023 and 2024. In the downside scenario, the same rise in interest rates is assumed, although income (costs) fall more (less) than the baseline scenario so that the operating margin falls to 4% in 2023 and 2.8% in 2024. Debt growth is assumed to be zero in 2023 and 2024 in both scenarios.
Legal real estate developer entities.
21 In that case, developers must pay the dwelling’s construction costs, at the same time as they do not receive revenues until the dwelling is sold. Nevertheless, given that the level of residential construction has been moderate and banks often have pre-sale requirements for residential projects they finance, the number of dwellings that can remain unsold is limited.
22 As for the CRE sector, consolidated financial statements provide a broader picture of the financial situation than those at the firm level. Many real estate developers are part of larger corporate groups that often may have their main activities in other sectors. The sample comprises corporate groups where real estate development accounts for at least 30% of the groups’ bank loans.
23 Interest coverage ratio (ICR) is earnings (EBITDA) relative to interest expenses.
In the baseline scenario, the average interest rate is assumed to rise in pace with the average change in the policy rate path in MPR 3/23. Incomes decline by 14% in 2023 and 5% in 2024. Operating expenses fall by 90% of the decline in 2023, and by an equal percentage in 2024. In the downside scenario, the same rise in interest rates is assumed, although income (costs) fall more (less) than in the baseline scenario. Debt growth is assumed to be zero in 2023 and 2024 in both scenarios.
Groups where real estate development accounts for at least 30% of their loans.
24 The share of banks’ lending to real estate developers within each equity threshold.
Groups where real estate development accounts for at least 30% of their loans.
Many CRE firms’ equity is higher than shown in their financial statements
The amount of impairment charges in the event of a fall in property prices largely depends on the accounting standards applied by the firm. Under the Norwegian Accounting Act, properties are carried at historical cost, while under International Financial Reporting Standards (IFRS), investment property may be carried at fair value.1 Since commercial property prices have risen over many years, the fair value of a building may be considerably higher than the carrying amount for firms applying the Norwegian Accounting Act. For the year that a CRE group transitioned from the Norwegian Accounting Act to IFRS, the median balance sheet increased by about 50%, which suggests a sharp upward revaluation of property assets. By comparison, the balance sheets of groups that have not changed accounting standards have increased by about 5% per year.
All Norwegian firms are permitted to apply IFRS. Listed firms and firms with debt securities listed on Oslo Børs are required to apply IFRS. Nevertheless, most CRE groups, especially the smaller ones, apply the Norwegian Accounting Act, and their properties may be carried at historical cost.2 Over time, a number of groups have transitioned to IFRS. The share of equity and interest-bearing debt in CRE groups applying IFRS has risen from below 10% to around 50% in 2022 (Chart 3A).
Chart 3.A Share of equity and liabilities held by firms that apply fair value accounting has increased over time3
Share of equity. Percent Share of interest-bearing debt. Percent
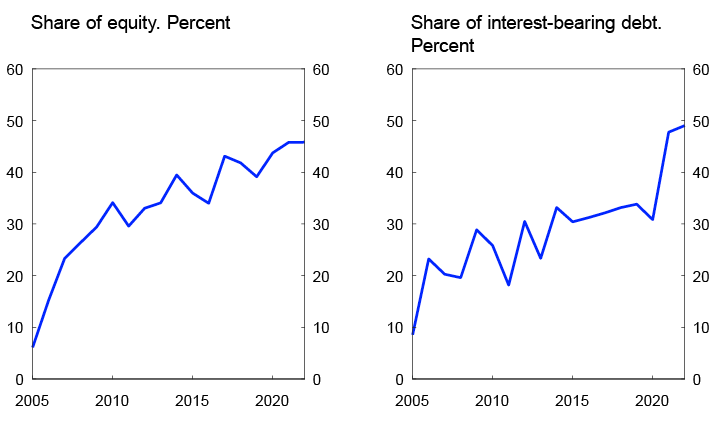
Sources: Brønnøysund Register Center, Dun & Bradstreet and Norges Bank
Since under the historical cost principle, the carrying amount often reflects the purchase price from many years ago, a large fall in fair value will not necessarily trigger an impairment loss on investment properties. Our estimates indicate that a typical CRE firm that applies the Norwegian Accounting Act may have to reduce the carrying amount of its properties by around 10% if market prices fall by 30%. A reduction in the carrying amount of only 10% instead of 30% for groups applying the Norwegian Accounting Act will significantly cushion the decline in the firm’s equity in the event of a price fall (Chart 3.16).
Since 2007, the book equity of CRE groups has risen (black lines in Chart 3.B). Some of this increase reflects restatement to fair value by CRE firms when they transitioned from the Norwegian Accounting Act to IFRS. At the same time, some of the increase in book equity has been driven by an increase in actual equity, as illustrated by the fact that the equity ratios of CRE groups applying the Norwegian Accounting Act are higher in 2022 than in 2007 (orange lines in Chart 3.B).
Chart 3.B CRE firms have become more resilient since previous downturns4
Percent
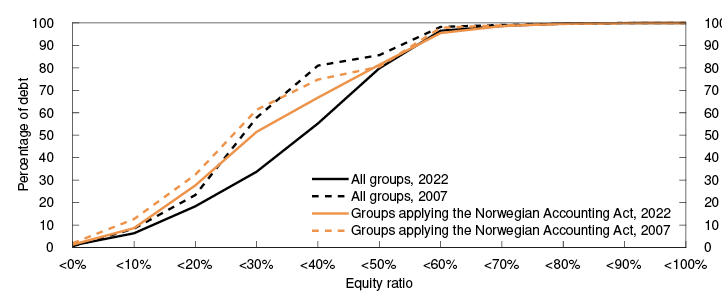
Sources: Brønnøysund Register Central, Dun & Bradstreet and Norges Bank
1 The accounting treatment of investment property under IFRS is in accordance with IAS 40. Under this standard, an entity may apply either a fair value model or a cost model when accounting for investment properties.
2 IFRS is an extensive set of rules. It is far less resource-intensive than the Norwegian Accounting Act as an accounting standard.
3 The share of equity and interest-bearing debt held by groups that apply fair value accounting.
CRE groups with interest-bearing debt.
4 The share of firms’ debt within each equity threshold.
CRE groups with interest-bearing debt.