Monetary policy assessment
Inflation has risen rapidly over the past months and has been far higher than projected. Inflation is markedly higher than the target, and there are prospects that it will remain high for longer than projected earlier. The labour market is tight, but there are clear signs of a slowdown in the Norwegian economy. Easing pressures in the economy will contribute to curbing inflation further out.
The Committee assesses that a higher policy rate is needed to bring inflation down towards the target. A faster rate rise now reduces the risk of inflation becoming entrenched at a high level and of a sharper tightening of monetary policy further out.
Norges Bank’s Monetary Policy and Financial Stability Committee decided to raise the policy rate from 1.75% to 2.25% at its meeting on 21 September. Based on the Committee’s current assessment of the outlook and the balance of risks, the policy rate will most likely be raised further in November.
Weaker global growth outlook
High energy prices, strong demand and supply constraints have led to a sharp rise in global consumer prices. Inflation has hit a multi-decade high in many countries, with a rapid rise in prices for both goods and services. Gas and electricity prices have risen sharply recently owing to the decline in Russian gas supply to Europe, and futures prices indicate continued high prices ahead. The surge in gas and electricity prices is pushing up business costs and could also lift underlying inflation. On the other hand, freight rates and oil, metals and food prices drifted down over summer, and global supply chain disruptions appear to have eased. This could dampen the rise in consumer prices ahead. The projections for underlying inflation among Norway’s trading partners overall have been revised up since the June 2022 Monetary Policy Report.
Chart A Sharp rise in gas and electricity prices1 Øre/kWh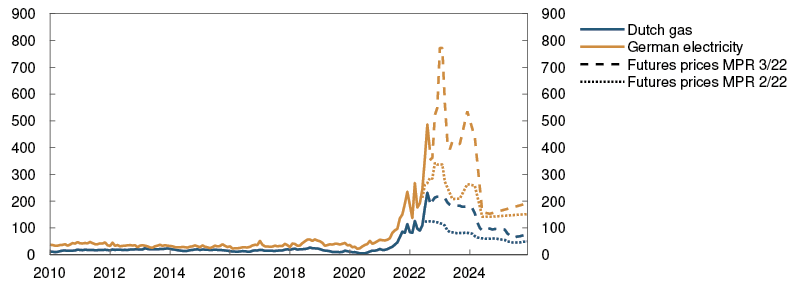
Source: Refinitiv Datastream
Central banks in many trading partner countries have responded to the surge in inflation by rapidly raising their policy rates. The labour market is tight, and wage growth is on the rise in many countries. Overall, economic activity among trading partners has increased slightly more than projected in June, while the growth outlook has weakened substantially, especially for Europe. Consumption growth is expected to slow on the back of high inflation and rising interest rates. The high level of gas prices may also induce many firms to scale back production.
Chart B Rapid rise in policy rates in many countries2 Policy rates and estimated forward rates in selected countries. Percent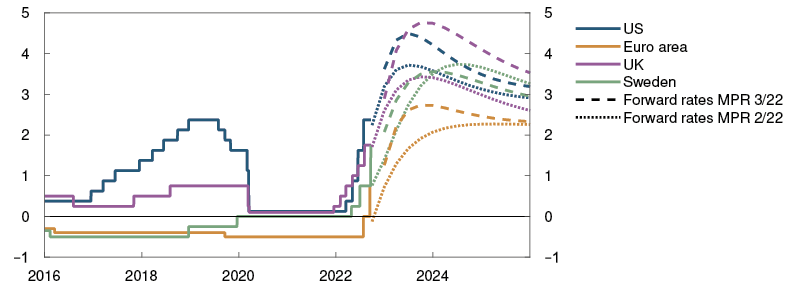
Sources: Bloomberg, Refinitiv Datastream and Norges Bank
Considerable financial market volatility
There has been considerable financial market volatility since the June Report. Market-implied expectations of policy rates have risen globally since the June Report and indicate further rate rises over the next year. Long-term interest rates have also increased recently and are a little higher than in June. The global equity market has advanced, and corporate bond risk premiums have decreased in some countries.
The Norwegian krone has been stronger than projected in the June Report but has depreciated somewhat recently. Norwegian market rates have moved up, indicating expectations of additional rate rises going forward. The rise in residential mortgage rates has been broadly as expected.
High activity in the Norwegian economy, but clear signs of a slowdown
Economic activity is high in Norway, but there are now clear signs of a cooling economy. After expanding rapidly, mainland GDP showed a slight fall in the latter part of spring and over summer and was lower in July than projected in the June Report. High inflation has curbed household purchasing power, and consumption growth slowed more than expected over summer. Card transaction data indicate that goods and services consumption fell in August. The household saving ratio has decreased somewhat, but overall household savings are still high owing to the savings accumulated during the pandemic. Existing home sales have been high, and house prices have increased more than projected. New home sales have fallen to a low level.
Chart C High level of activity in the Norwegian economy3 GDP for mainland Norway. Seasonally adjusted. Index. February 2020 = 100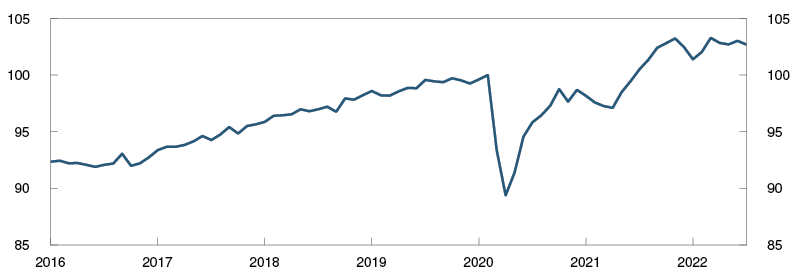
Source: Statistics Norway
The labour market is tight. Employment has continued to rise, and unemployment is very low. The seasonally adjusted, registered unemployment rate was 1.6% in August, as projected in the June Report. The high employment level reflects a lower number of unemployed, but also an increase in labour force participation. The high number of job vacancies indicates that labour demand remains strong. At the same time, there are signs that labour shortages may be easing. A large share of Norges Bank’s Regional Network contacts reported in August that labour shortages are limiting output, but the share is smaller than in the previous survey.
Chart D Regional Network contacts report high capacity utilisation4 Capacity utilisation and labour shortages according to the Regional Network. Percentage shares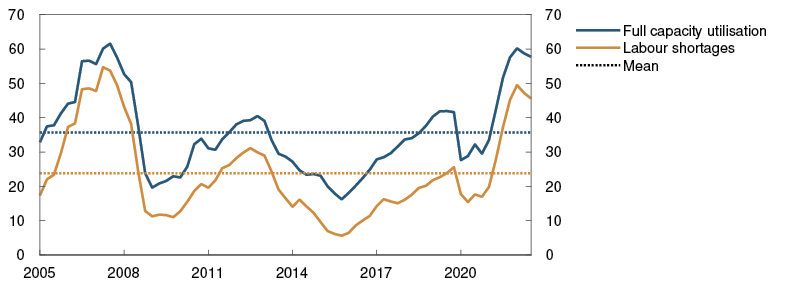
Source: Norges Bank
Regional Network contacts have lowered their output growth expectations and overall, now expect a small decline over the next half-year. They expect higher price and cost inflation and rising interest rates to curb demand ahead, particularly in the household sector and contractors in the construction industry.
Economic activity is projected to be broadly unchanged in the period ahead, edging down thereafter in 2023. Household consumption is expected to slow next year, before rising modestly thereafter. Solid growth in petroleum and business investment is projected to lift activity over the coming years.
Higher-than-projected inflation
Inflation has risen substantially in Norway over the past year. Prices for energy products have climbed to historically high levels and have contributed to driving up consumer price inflation to the current high level. In August, the 12-month rise in consumer prices was 6.5%, markedly higher than projected in the June Report.
Underlying inflation has also moved up. The 12-month rise in the consumer price index adjusted for tax changes and excluding energy products (CPI-ATE) climbed to 4.7% in August, which was far higher than projected. Food prices have been a main driver of inflation over summer, but a faster-than-normal rise in prices for a range of other goods and services has also pushed up inflation. Prices for both imported goods and domestically produced goods and services are rising at a rapid pace. Other underlying inflation indicators have also increased. The surge in energy prices will likely push up goods and services prices further going forward.
Inflation expectations for the next years, as measured by Norges Bank’s Expectations Survey, have increased recently. Long-term inflation expectations continued to rise in Q3 and are above the 2% target.
The tight labour market has gradually pushed up wage growth over the past few years. Annual wage growth reached 3.5% in 2021. Norges Bank’s Expectations Survey indicates that wage growth will be higher in 2022 than projected in June. Annual wage growth is now projected at around 4% in 2022. The Expectations Survey shows that wage growth expectations for 2023 have also increased since the June Report.
Chart E Inflation markedly above the 2% target5 CPI and CPI-ATE. Twelve-month change. Percent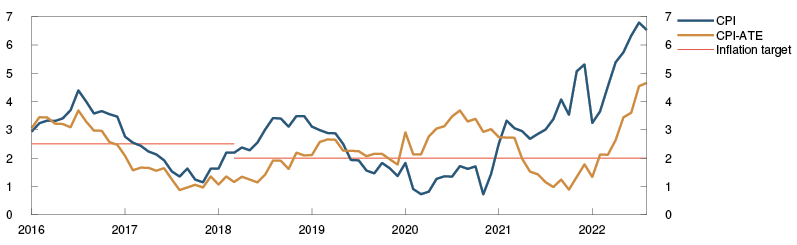
Source: Statistics Norway
Need for higher interest rates in the Norwegian economy
The operational target of monetary policy is annual consumer price inflation of close to 2% over time. Inflation targeting shall be forward-looking and flexible so that it can contribute to high and stable output and employment and to countering the build-up of financial imbalances.
Inflation has risen rapidly in recent months and has been far higher than projected. Inflation is markedly above the target, and there are prospects that inflation will remain high for longer than projected earlier. The labour market is tight, but there are clear signs of a slowdown in the Norwegian economy. Easing pressures in the economy will contribute to curbing inflation further out.
The Committee assesses that a higher policy rate is needed to bring inflation down towards target. A faster rate rise now reduces the risk of inflation becoming entrenched at a high level and of a sharper tightening of monetary policy further out.
Chart F A higher policy rate helps to achieve the objectives of monetary policy6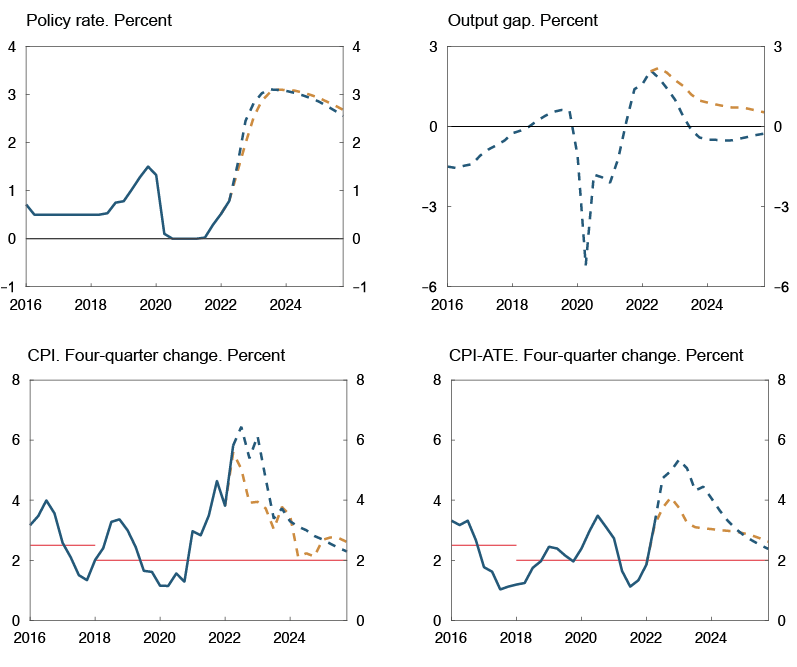
Sources: Statistics Norway and Norges Bank
The policy rate has been raised from a very low level over the past year and monetary policy is starting to have a tightening effect on the Norwegian economy. This may suggest a more gradual approach to policy rate setting ahead. The projections in this Report are based on a rise in the policy rate to around 3% in the course of winter. Inflation is projected to slow and approach target in the medium term. The output gap is expected to fall and lie slightly below normal in the coming years. Unemployment will then increase somewhat, albeit from a low level.
The projections for the Norwegian economy are more uncertain than normal. The Committee was concerned with the rapid and broad rise in inflation over a short period. If there are prospects that inflation will remain higher for longer than currently projected, there may be a need for a higher policy rate. On the other hand, there is a risk of a more pronounced slowdown in both global and domestic activity. If inflation and the output gap decrease faster than projected, the policy rate may be raised less than envisaged in this Report.
The Committee decided unanimously to raise the policy rate by 0.50 percentage point to 2.25%. Based on the Committee’s current assessment of the outlook and the balance of risks, the policy rate will most likely be raised further in November.
Ida Wolden Bache
Pål Longva
Øystein Børsum
Ingvild Almås
Jeanette Fjære-Lindkjenn
21 September 2022
1 Period: January 2010 – December 2025. Futures prices at 17 June 2022 for MPR 2/22 and at 20 September 2022 for MPR 3/22.
2 Period: 1 January 2016 – 31 December 2025. Daily data through 16 September 2022. Quarterly data from 2022 Q3 for MPR 2/22 and 2022 Q4 for MPR 3/22. Forward rates at 17 June 2022 for MPR 2/22 and at 20 September 2022 for MPR 3/22. ECB’s deposit facility rate for the euro area.
3 Period: January 2016 – July 2022.
4 Period: 2005 Q1 – 2022 Q3. Share of contacts that will face some or considerable difficulty meeting increased demand and share of contacts citing labour shortages as a constraint on production. The question about labour is asked only of the enterprises reporting full capacity utilisation, but the series shows the share of all contacts included in the interview period. The local government and hospital sector is omitted from the capacity utilisation series, but is included in the labour force series.
5 Period: January 2016 – August 2022. CPI-ATE: CPI adjusted for tax changes and excluding energy products.
6 Period: 2016 Q1 – 2025 Q4. Projections from 2022 Q2 for MPR 2/22 and 2022 Q3 for MPR 3/22 for the policy rate, CPI and CPI-ATE. The output gap measures the percentage deviation between mainland GDP and estimated potential mainland GDP. CPI-ATE: CPI adjusted for tax changes and excluding energy products.
Assessment of the countercyclical capital buffer requirement
In March, the decision was made to raise the countercyclical capital buffer rate to 2.5%, effective from 31 March 2023. At its meeting on 21 September, Norges Bank’s Monetary Policy and Financial Stability Committee decided to maintain this requirement.
The countercyclical capital buffer is intended to strengthen banks’ solvency and mitigate the risk that banks’ lending standards amplify an economic downturn. According to the capital framework, the countercyclical capital buffer should, in principle, be set between 0% and 2.5%. The countercyclical capital buffer rate should normally be in the higher part of this range. If cyclical vulnerabilities reach a particularly high level, the rate may be set above 2.5%. If a downturn will or could cause a marked reduction in credit supply, the countercyclical capital buffer rate should be lowered.
The labour market is tight but there are clear signs of a slowdown in the Norwegian economy. Norwegian households are highly leveraged. Credit growth has slowed over the past year. Property price inflation has also slowed from a high level during the Covid-19 pandemic. Property prices are expected to edge down ahead and credit growth to slow further. Creditworthy households and firms appear to have ample access to credit.
Bank losses are expected to be low ahead but there is substantial uncertainty surrounding the economic outlook. Rising interest rates and high inflation may result in a sharper fall in property prices and a more pronounced slowdown in the economy than currently envisaged. Considerable volatility in global energy and financial markets may lead to shocks that spill over to the Norwegian financial system. Owing to financial system vulnerabilities, shocks may have a stronger impact on the Norwegian economy, which may result in higher bank losses.
Norwegian banks have ample capacity to absorb losses. They are highly profitable and satisfy the capital and liquidity requirements. The countercyclical capital buffer rate of 2.5% strengthens banks’ solvency and thus increases their resilience to shocks.
The Committee unanimously decided to keep the countercyclical capital buffer rate at 2.5%.
Ida Wolden Bache
Pål Longva
Øystein Børsum
Ingvild Almås
Jeanette Fjære-Lindkjenn
21 September 2022
1 The global economy
Consumer price inflation has continued to move up in many countries, and the projections for underlying inflation have been revised up. In addition, European gas and electricity prices have surged. High inflation is reducing household purchasing power and increasing business costs. GDP growth among trading partners is expected to be low in 2023. The projection has been revised down considerably since the June 2022 Monetary Policy Report. Global financial markets have been highly volatile since June. Market rates imply higher policy rate expectations for the year ahead compared with the June Report.
Very high gas and electricity prices are dampening activity
Following a marked post-pandemic recovery, GDP growth for Norway’s trading partners as a whole slowed between 2022 Q1 and Q2. The level of activity in China showed a marked fall in 2022 Q2 owing to lockdowns in response to the Omicron wave in spring and lower activity in the property sector. In the US, activity fell for the second consecutive quarter, while the euro area and Sweden recorded solid growth. For Norway’s trading partners as a whole, GDP increased more than expected between 2022 Q1 and 2022 Q2.
Gas and electricity prices in Europe have risen markedly since the June Report (Chart 1.1 and "Very high gas and electricity prices"). Russian gas supply to Europe almost came to a complete halt at the end of August. Gas and electricity prices are assumed to remain high in the years ahead, in line with futures prices. It is difficult to estimate the economic impact of gas and electricity market developments on the economy. The surge in gas prices will likely compel some European firms to scale back production due to higher energy costs. Many will likely seek to reduce their energy intensity or find alternative sources of energy, but such a readjustment will take time. Households in many countries are receiving financial support from the authorities, but energy costs will still be very high in the coming quarters.
Chart 1.1 Marked rise in European gas prices1 USD/BOE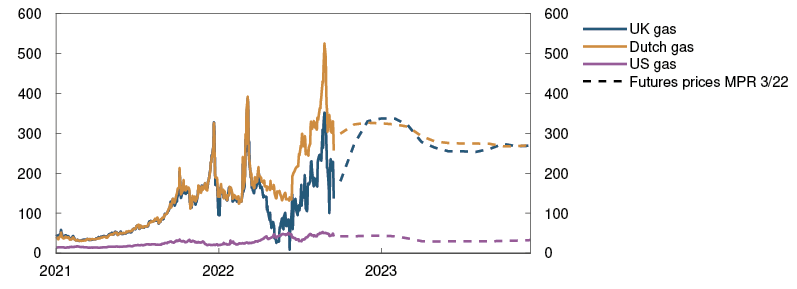
Source: Refinitiv Datastream
Other consumer and producer prices are rising at a rapid pace. In addition, a number of central banks have raised their policy rates since spring, and market policy rate expectations indicate further increases in the coming year both in Europe and the US. It is assumed that households will draw on savings accumulated during the pandemic, but the high cost of living is expected to contribute to falling consumption in Europe over the coming quarters. Investment growth is also expected to be weak ahead. Together, these factors imply that economic activity in Europe is likely to decline through autumn and winter. The projections for trading partner GDP growth in 2023 have been revised down considerably from the June Report (Chart 1.2).
Chart 1.2 Weaker growth outlook2 GDP for trading partners. Quarterly change. Percent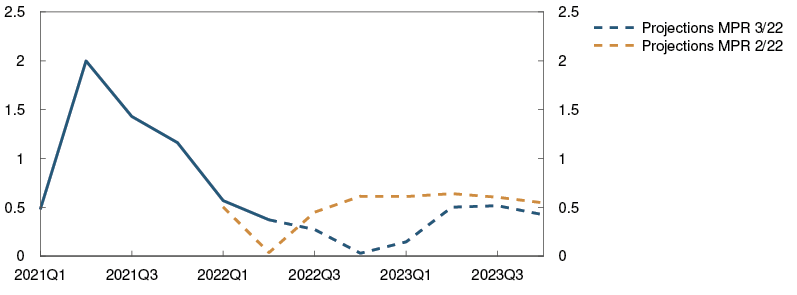
Sources: Refinitiv Datastream and Norges Bank
Monetary policy is assumed to be tightened in line with market policy rate expectations and commodity prices to move in line with futures prices. Higher European defence and energy investment is likely to lift activity further out in the projection period. Growth in China is expected to be lower in the period ahead than in the pre-pandemic years as a result of the reorientation of policy towards more balanced growth, with lower credit growth and higher domestic demand. Trading partner GDP growth is projected to slow from around 3% in 2022 to about 1% in 2023, then pick up again in 2024 (Annex Table 1). Trading partner imports are projected to increase by close to 7% in 2022 and about 1% in 2023.
High consumer price inflation
Pandemic-related supply and demand conditions and the war in Ukraine have contributed to a marked rise in inflation among Norway’s main trading partners since autumn 2021. The 12-month rise in the consumer price index (CPI) was about 9% in the euro area and just over 8% in the US in August (Chart 1.3). The rise in energy and food prices made up over half of the 12-month rise in the euro area, and underlying consumer price inflation was 4.3% in August. In the US, underlying consumer price inflation was 6.3% in August. In recent months, underlying inflation among trading partners has been higher than projected in June, particularly in the US and Sweden.
Chart 1.3 Very high consumer price inflation3 Consumer prices. Twelve-month change. Percent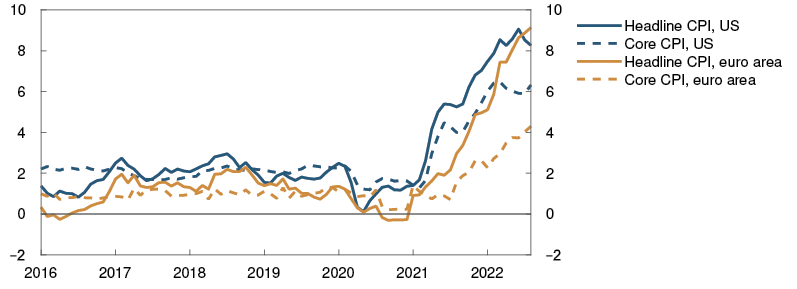
Source: Refinitiv Datastream
Goods freight rates continued to fall through summer. The cost of shipping goods from China to the US decreased most, and freight rates have now fallen to the same level as at end-2020. Food and metals prices also fell markedly in summer, which will relieve some of the price pressure on consumer goods further out. On the other hand, the considerable rise in energy prices will push up business costs, with some expected pass-through to prices for goods and services.
Labour markets are tight in many countries. In the euro area and Sweden, unemployment is lower than before the pandemic. Wage growth among Norway’s main trading partners is projected to remain above 4% in 2022 and 2023, then gradually decline. Long-term market-based inflation expectations are little changed since the June Report and are close to the inflation targets of both the US and the euro area. Underlying consumer price inflation is expected to be around 6% in the US in 2022 and close to 4% in the euro area. Underlying inflation for trading partners as a whole is projected to slow from 4.6% in 2022 to 3.6% in 2023, gradually drifting down to around 2%. The projections for 2022 and 2023 have been revised up from the June Report.
Producer price inflation for consumer goods imported to Norway (Norges Bank’s IPK index), in foreign currency terms, has been higher than expected. In recent months, the 12-month rise has continued to move up for all sub-indexes (Chart 1.4). In the projections, the fall in commodity prices for food and metals over summer has a dampening impact on inflation ahead, but higher gas and electricity prices pull in the opposite direction. The projections have been revised up from the June Report (Annex Table 1).
Chart 1.4 Strong external inflationary pressures4 IPK. Twelve-month change. Percent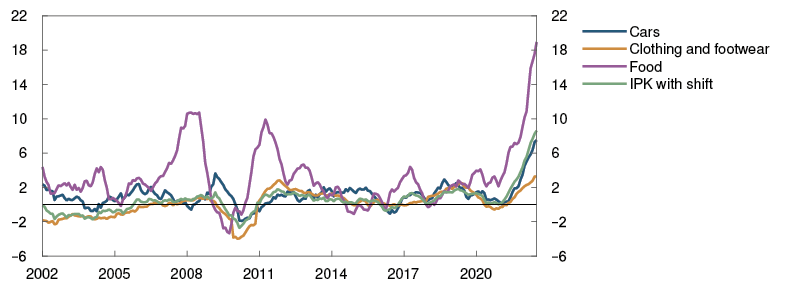
Sources: Refinitiv Datastream and Norges Bank
Larger and faster increase in policy rates abroad
Global financial markets have been highly volatile since the June Report. In response to the continued rise in inflation, central banks have tightened monetary policy more than envisaged by market participants in June. Since the June Report, the central banks in the US, euro area, UK and Sweden have raised their policy rates. At the same time, the market’s policy rate expectations for the coming year among Norway’s main trading partners have risen a little further. Long government bond yields are little changed since June (Chart 1.5).
Chart 1.5 High volatility in long-term interest rates5 Yields on 10-year government bonds in selected countries. Percent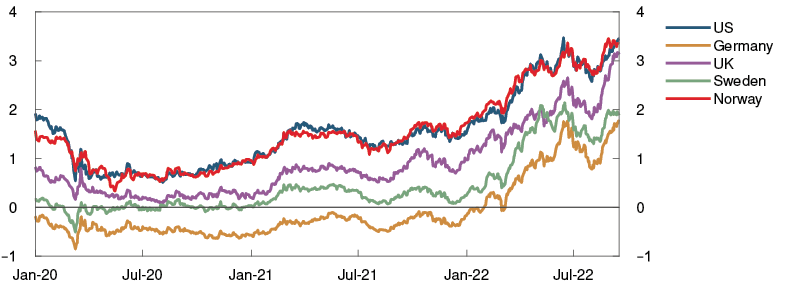
Source: Bloomberg
Global equity indexes have advanced since the June Report, particularly in the US. Together with the decline in corporate bond risk premiums, this has in isolation eased corporate financing conditions for US firms. In the euro area, risk premiums are little changed since June. The weaker developments in European equity and credit markets reflect the marked rise in energy prices in Europe.
Uncertainty surrounding the economic outlook
The ongoing war in Ukraine is having substantial economic repercussions both in Europe and globally and is adding to the uncertainty about developments ahead. There is a risk that the higher cost of living for households and higher business costs could lead to even weaker consumption and investment than currently envisaged. Consumer price inflation could then fall more rapidly. Energy supply constraints may also dampen activity more than envisaged. If the authorities were to compensate for higher energy costs by introducing additional support schemes for households and businesses, growth could be higher than projected. In China, housing market activity has already fallen, but there is a risk of a further decline and weaker developments in overall activity than currently envisaged. Moreover, further pandemic-related lockdowns may also be implemented. The projections assume that wage earners will not be fully compensated for the high rate of inflation, but if they were to be compensated, price and wage inflation could remain high for longer than currently expected.
1 Period: 1 January 2021 – 31 December 2023. Futures prices at 16 September 2022.
2 Period: 2021 Q1 – 2023 Q4. Projections from 2022 Q2 for MPR 2/22 and from 2022 Q3 for MPR 3/22. Export weights. 13 trading partners.
3 Period: January 2016 – August 2022. Core CPI is consumer prices excluding energy and food in the US and consumer prices excluding energy, food, tobacco and alcohol in the euro area.
4 Period: January 2002 – July 2022. Prices for consumer goods imported to Norway. Foreign currency.
5 Period: 1 January 2020 – 16 September 2022.
Very high gas and electricity prices
Cuts in Russian gas supply to Europe combined with hot, calm and dry weather in Europe have led to a surge in gas and electricity prices. A weaker outlook for the global economy is pushing down prices for oil, metals and agricultural products.
European gas prices are now around USD 250 per barrel of oil equivalent. This is considerably higher than in June (Chart 1 A) 1 and is largely the result of Russia’s suspension of gas deliveries to several European countries. Demand for gas has increased as the hot, calm and dry weather has reduced other energy production while energy consumption for cooling has increased. EU countries have also purchased large amounts of gas to fill gas storage facilities before the winter season. If Russian gas exports remain at today’s low levels, gas storage levels could be considerably reduced in winter, particularly if temperatures are low. Futures prices indicate that gas prices may remain high through winter, then edge down further out. Gas futures prices are nonetheless far higher than they were at the time of the June Report (Table 1.A).
Chart 1.A Marked rise in gas prices2 USD/BOE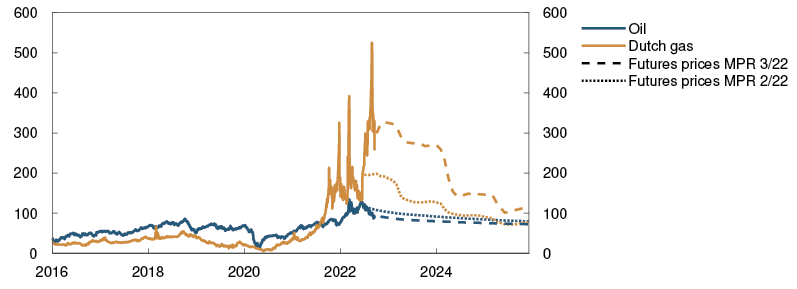
Sources: Refinitiv Datastream and Norges Bank
Electricity prices in southern Norway are now around 400 øre/kWh (Chart 1.B).3 This is markedly higher than in the June Report and reflects historically low reservoir levels in southern and south-eastern Norway and a rise in electricity prices on the continent. High electricity prices on the continent reflect high prices for gas, coal and emissions allowances as well as this summer’s weather conditions. A substantial reduction in the production of nuclear power in France has also played a role. Electricity prices in northern Norway are lower owing to high reservoir levels and limited transmission capacity between northern and southern Norway. Futures prices for the individual price regions in Norway indicate that electricity prices in southern Norway are expected to be markedly higher in the years ahead than assumed in June, while prices in northern Norway may remain relatively low.
Chart 1.B Very high electricity prices on the continent and in southern Norway4 Øre/kWh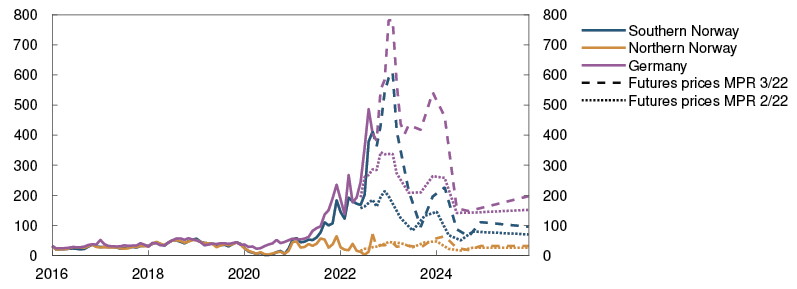
Sources: Bloomberg, Refinitiv Datastream and Norges Bank
The very high prices for gas and electricity reflect substantial supply shortages. The EU is considering measures to reduce gas and electricity prices, including improving energy efficiency and energy saving and increasing gas supply from countries other than Russia, and measures to dampen the impact on retail prices for households and businesses. Setting price caps for wholesale gas and electricity prices below current market prices could exacerbate the energy shortage by further reducing supply and supporting consumption. The possibility of direct supply rationing could then increase. Gas and electricity prices in Europe have fallen from record-high levels at the end of August, probably because of the EU’s plan to restock gas storage facilities earlier than usual and prospects for lower energy usage owing to high prices, energy saving and weaker economic developments.
Oil prices have fallen since the June Report and are now around USD 90 per barrel (Chart 1.A), partly reflecting a weaker outlook for the global economy (see Section 1). Russian oil exports have at the same time been cut less than expected. The release of strategic oil reserves by many countries through summer has increased the supply of oil. On the other hand, the current high gas prices may lead to increased oil demand. In addition, OPEC+ decided at the beginning of September to cut production again. EU sanctions to ban Russian oil will be fully implemented at the beginning of 2023. OPEC has limited spare production capacity and oil inventories in OECD countries are low. Futures prices nonetheless indicate lower oil prices in the years ahead. Futures prices for 2025 are around USD 75 per barrel, which is around 10% lower than at the time of the June Report (Table 1.A).
Industrial metals prices have continued to fall since June. This also reflects the weaker outlook for the global economy. Economic developments in China, such as lower activity in the property sector, are likely having a particular impact. Futures prices have also fallen compared with the June Report but still indicate higher prices in the coming years than in the pre-pandemic years.
Prices for global agricultural products and fertilisers have also fallen in recent months from very high levels (Table 1.A), partly due to the resumption of grain exports from Russia and Ukraine. Prices for agricultural products are still considerably higher than at the same time in 2021, with extreme weather events reducing crop yields for many agricultural products in the past year.
Table 1.A Energy and commodity prices
|
Percentage change from projections in Monetary Policy Report 2/22 in brackets |
Average price (2010–2019) |
Actual prices and futures prices1 |
|||||
|
2020 |
2021 |
2022 |
2023 |
2024 |
2025 |
||
|
Oil, USD/barrel |
80 |
42 |
71 |
102 (-6) |
84 (-14) |
78 (-12) |
74 (-10) |
|
Gas, USD/barrel |
40 |
18 |
87 |
246 (36) |
287 (100) |
177 (73) |
119 (52) |
|
Petroleum2, USD/barrel |
63 |
34 |
85 |
175 (20) |
184 (53) |
128 (33) |
98 (21) |
|
Coal, EUR/tonne |
66 |
44 |
102 |
293 (9) |
292 (31) |
273 (37) |
261 (38) |
|
Emission allowance prices, EUR/tonne |
10 |
25 |
53 |
80 (-3) |
75 (-11) |
79 (-11) |
84 (-11) |
|
German electricity, Øre/kWh |
36 |
36 |
106 |
331 (35) |
524 (110) |
250 (39) |
197 (30) |
|
Nordic electricity, Øre/kWh |
32 |
12 |
64 |
176 (45) |
174 (79) |
79 (30) |
63 (26) |
|
Electricity in southern Norway, Øre/kWh |
31 |
10 |
78 |
276 (61) |
261 (95) |
122 (43) |
95 (36) |
|
Electricity in northern Norway, Øre/kWh |
32 |
10 |
40 |
26 (3) |
37 (-4) |
34 (25) |
31 (21) |
|
Aluminium, in thousands of USD/tonne |
1.9 |
1.7 |
2.5 |
2.7 (-3) |
2.3 (-7) |
2.4 (-4) |
2.5 (0) |
|
Copper, in thousands of USD/tonne |
6.8 |
6.2 |
9.3 |
8.8 (-7) |
7.7 (-14) |
7.7 (-14) |
7.7 (-14) |
|
Wheat, USD/tonne |
210 |
202 |
258 |
338 (-9) |
323 (-17) |
310 (-16) |
- |
|
Maize, USD/tonne |
183 |
143 |
227 |
273 (-5) |
260 (-6) |
238 (-3) |
216 (-3) |
1 Futures prices at 16 September 2022.
2 An estimated Norwegian petroleum export price. The price has been estimated based on the share of oil and gas in historical export figures. For futures prices, oil and gas have equal shares.
Sources: Refinitiv Datastream and Norges Bank
1 The Dutch gas price is used as the benchmark. Historically, this price has correlated closely with the UK gas price. However, the Dutch price has been considerably higher than the UK price in 2022 (Chart 1.1) as prices on the continent are affected more by cuts in Russian gas exports. The UK price has been influenced to a greater extent by an increased supply of liquid natural gas from the global market. In addition, gas transmission capacity from the UK to the continent is limited. A relatively large share of Norwegian gas exports has been sold to the continent in the past year with the Dutch price as the benchmark.
2 Period: 1 January 2016 – 31 December 2025. Futures prices at 17 June 2022 for MPR 2/22 and at 16 September 2022 for MPR 3/22. Oil price is for Brent Blend.
3 The electricity price in southern Norway is the average of the prices in the price regions Østlandet (NO1), Sørlandet (NO2) and Vestlandet (NO5). The price in northern Norway is the average of the prices in the regions Midt-Norge (NO3) and Nord-Norge (NO4). Electricity prices here are the average of weekday prices in the week up to and including Friday 16 September.
4 Period: January 2016 – December 2025. Futures prices at 17 June 2022 for MPR 2/22 and at 16 September 2022 for MPR 3/22.
2 Financial conditions
Banks have raised interest rates on residential mortgage loans in response to the rise in the policy rate over the past year. Firms’ financing costs have also increased. A further tightening of financial conditions is expected in response to additional policy rate hikes.
The krone has moved in line with developments in the interest rate differential against other countries, petroleum prices and global equity indexes. The krone is projected to appreciate through the projection period.
2.1 Household and corporate lending rates
Higher residential mortgage rates
Household borrowing costs have increased in response to the policy rate hikes over the past year. The average interest rate on outstanding mortgages was 2.4% at the end of July, as projected in the June Report. Following the policy rate hikes in June and August, large banks have announced that mortgage rates would be raised further by up to 1 percentage point. Banks’ quoted rates indicate that the interest rate on new floating-rate residential mortgages has risen by a little less than 1 percentage point since the June Report.
The average deposit rate for households was around 0.5% in 2022 Q2. The pass-through from the policy rate to deposit rates has thus been substantially lower than to lending rates.
In the projections, residential mortgage rates increase in response to further increases in the policy rate. With the current path of the policy rate, the average residential mortgage rate rises to around 4.3% in the course of 2023 (Chart 2.1). The rise in residential mortgage rates is somewhat smaller than the rise in the policy rate. This is because the pass-through to deposit rates is expected to be weaker than to lending rates. In isolation, banks will therefore not have to increase residential mortgage rates to the same extent to maintain profitability.
Chart 2.1 Prospects for larger increase in lending rates1 Percent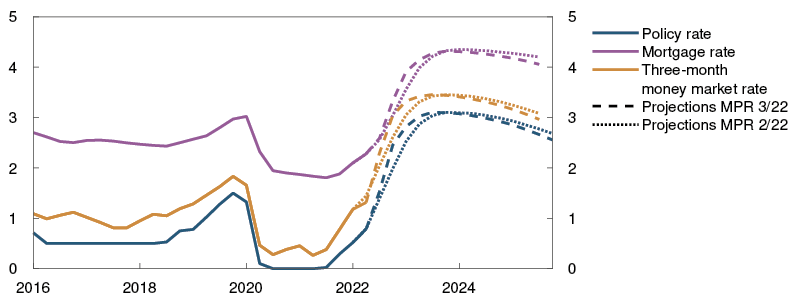
Sources: Refinitiv Datastream, Statistics Norway and Norges Bank
Longer-term interest rates have also risen since the June Report. This is of importance for households who choose to fix their mortgage rate. The share of outstanding fixed-rate mortgages remains low, so that residential mortgage rates overall are little affected by changes in fixed rates.
Increased corporate financing costs
Banks’ corporate lending rates are largely tied to the money market rate three-month Nibor. Three-month Nibor reflects market policy rate expectations over the next three months and a risk premium. Since the June Report, money market rates have risen, primarily reflecting a higher policy rate and higher policy rate expectations.
So far in 2022 Q3, the money market premium has averaged around 0.30 percentage point (Chart 2.2), somewhat lower than expected in June. Further ahead, the premium is projected to rise somewhat from the current level before stabilising around the long-term projection of 0.35 percentage point.
Chart 2.2 Small changes in money market premium2 Percentage points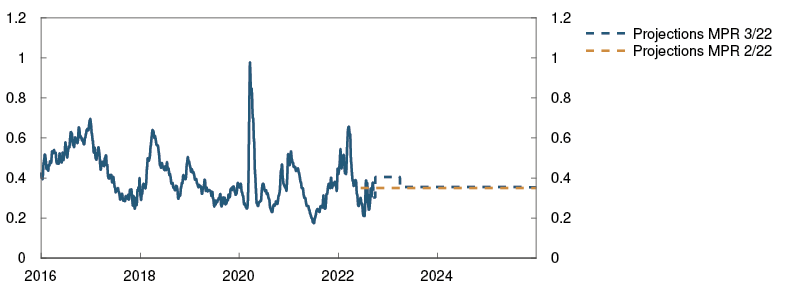
Sources: Refinitiv Datastream and Norges Bank
The rise in money market rates will also affect firms’ floating-rate market financing. The interest rate on market financing includes a risk premium in addition to Nibor. This risk premium will affect the cost of new bond issues and has risen since June. The most pronounced rise has been on bonds issued by commercial real estate companies, which is primarily due to higher premiums for foreign real estate companies. The rise in longer-term interest rates has pushed up financing costs for corporate borrowers who choose fixed-rate loans.
The Oslo Børs Benchmark Index has fallen somewhat since the June Report, across most sectors, with the exception of energy and commodity-related sectors, where developments have been broadly unchanged.
1 Period: 2016 Q1 – 2025 Q4. Projections from 2022 Q2 for MPR 2/22 and from 2022 Q3 for MPR 3/22. The mortgage rate is the average rate on outstanding mortgage loans to households from the sample of banks and mortgage companies included in Statistics Norway’s monthly interest rate statistics.
2 Period: 1 January 2016 – 31 December 2025. Five-day moving average. Latest observation on 16 September 2022. Projections from 2022 Q2 for MPR 2/22 and 2022 Q3 for MPR 3/22. The premium in the Norwegian money market rate is the difference between the three-month money market rate and the expected policy rate.
2.2 Krone exchange rate
Slightly stronger krone
The krone exchange rate, as measured by the import-weighted exchange rate index I-44, has been stronger than expected in the June Report. The movement in the krone has followed the movement in the interest rate differential against other countries. The appreciation has also coincided with a rise in gas prices and advances in the global equity market, while lower oil prices have likely pulled in the opposite direction.
The krone has recently depreciated and is projected to stay close to today’s level before gradually appreciating over the projection period (Chart 2.3). The appreciation reflects a falling risk premium. At the same time, the outlook remains highly uncertain. If the interest rate differential widens more than assumed, the krone may appreciate faster than projected. On the other hand, heightened uncertainty in global financial markets may lead to a depreciation of the krone.
Chart 2.3 Stronger krone exchange rate in the coming years3 Import-weighted exchange rate index (I-44). Difference between three-month money market rate in Norway and among trading partners. Percentage points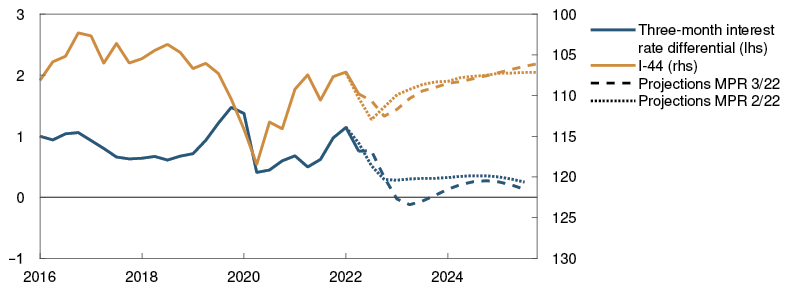
Sources: Refinitiv Datastream and Norges Bank
3 Period: 2016 Q1 – 2025 Q4. Projections from 2022 Q2 for MPR 2/22 and 2022 Q3 for MPR 3/22. A rising index value for I-44 indicates a depreciating krone. The right-hand scale is inverted. Interest rate differential between Norway and its main trading partners.
3 The Norwegian economy
Activity in the Norwegian economy is high, and unemployment is very low. At the same time, there are clear signs that the output gap is declining.
Inflation has increased considerably over the past year and is far higher than the inflation target. Rapidly rising prices for energy products have driven up consumer price inflation, but prices for other goods and services are also rising faster than normal.
High energy prices are pushing up business costs and will likely push up underlying inflation. Inflation is expected to slow and move close to the inflation target further out on the back of weaker external inflationary pressures, lower electricity prices and easing pressures in the economy.
In the projections, high prices and rising interest rates curb demand ahead. Economic activity declines from 2022 to 2023 and increases thereafter. Employment moves down over the next two years. Unemployment is projected to edge up, albeit from a low level.
3.1 Output and demand
Mainland economic growth is slowing
After the Government lifted all pandemic-related restrictions last winter, mainland economic activity picked up quickly (Chart 3.1). Growth slowed through spring and summer, and mainland GDP was lower in July than in March. The slowdown in the mainland economy partly reflects a marked decline in retail trade, but services output has also edged down recently.
Chart 3.1 Slowing growth ahead1 GDP for mainland Norway. Constant 2019 prices. Seasonally adjusted. In billions of NOK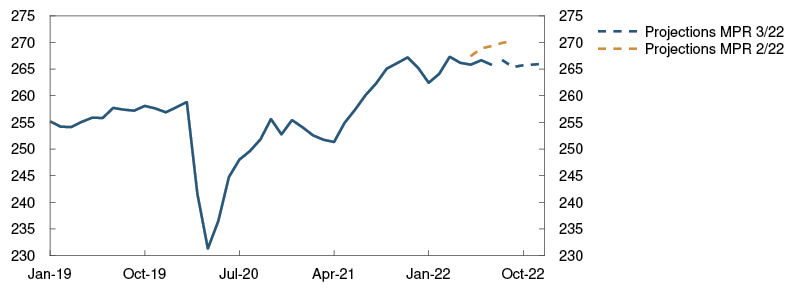
Sources: Statistics Norway and Norges Bank
Norges Bank’s Regional Network contacts expect activity to fall through autumn and winter (Chart 3.2). Household services contacts expect sharply rising prices and higher interest rates to curb household demand ahead. The construction industry expects a marked fall in activity in autumn partly owing to higher building costs. At the same time, many firms still report that output is being constrained by labour shortages and limited spare capacity.
Chart 3.2 Weaker prospects in most sectors2 Reported and expected growth according to the Regional Network. Annualised. Seasonally adjusted. Percent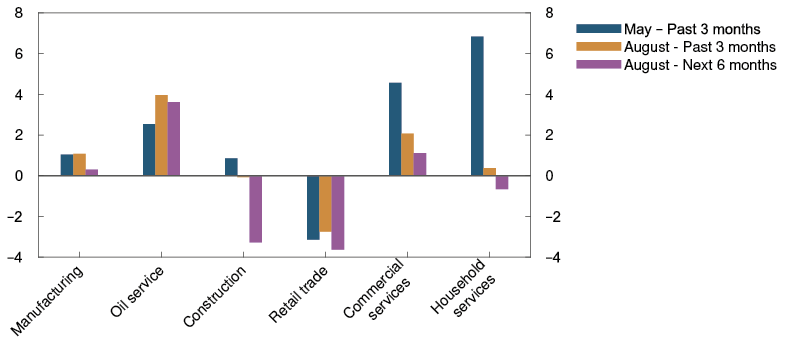
Source: Norges Bank
Close to zero growth in economic activity is expected in the period to year-end. The overall growth picture for the Norwegian economy in 2022 is marked by the post-pandemic recovery. Private consumption is the main driver of growth, followed by exports (Chart 3.3). Overall, mainland GDP is projected to rise by 2.8% in 2022. Looking ahead, higher inflation and rising interest rates are projected to curb activity and push down household consumption in 2023. In the projections, climate transition and petroleum sector investment push up growth in the years ahead. Mainland GDP contracts in 2023, and activity then picks up gradually further in the following years. The projections have been revised down compared with the June Report.
Chart 3.3 Fall in activity in 20233 GDP for mainland Norway. Annual change. Contribution to annual change. Percentage points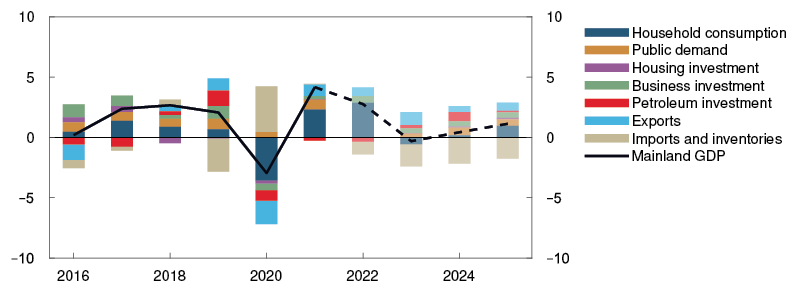
Sources: Statistics Norway and Norges Bank
Fall in consumption in 2023
The pandemic greatly constrained household consumption opportunities, which contributed to high savings and a shift in household demand away from spending abroad, and from services to goods. Consumption has since gradually normalised, and since February 2022 services consumption has again been higher than goods consumption. Household purchases abroad have also picked up but are still lower than pre-pandemic levels. Overall household consumption declined in July following a period of strong growth. Reduced purchasing power has likely contributed to the recent decline in consumption. Developments in household consumption and real disposable income have been weaker than projected in the June Report.
Card transaction data for debit and credit cards indicate that the level of goods and services consumption fell further in August. Total household purchases of goods and services is expected to continue falling into autumn. This is in line with information from Regional Network contacts, where in August household-oriented firms expected demand to decline over the next six months. The shift away from consumption in Norway to consumption abroad is projected to continue through autumn, although it will likely take time for spending abroad to return to pre-2020 levels.
There are prospects that inflation will rise further into 2023. While wage growth is pushing up incomes, disposable real income is projected to decline by approximately 2% in 2023 owing to high inflation and increased interest expenses (Chart 3.4). In 2024 and 2025, solid real wage growth is expected to contribute to a rise in real household disposable income.
Chart 3.4 Decline in real disposable income4 Real household disposable income. Annual change. Contribution to annual change. Percentage points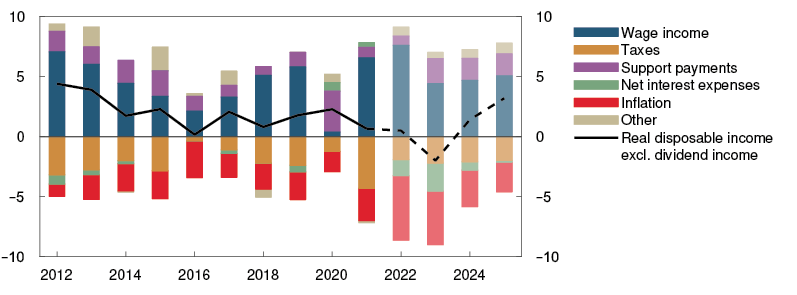
Sources: Statistics Norway and Norges Bank
Owing to weaker household purchasing power, consumption is expected to fall by 1.1% in 2023, picking up gradually thereafter as a result of higher real disposable income (Chart 3.5). Households will likely save less and will be able to draw on accumulated savings so that consumption falls less than might be implied by the decline in real disposable income alone. In the projections, the saving ratio falls in 2023, before picking up towards the end of the projection period.
Chart 3.5 Lower consumption growth ahead5 Household consumption. Constant 2019 prices. Seasonally adjusted. In billions of NOK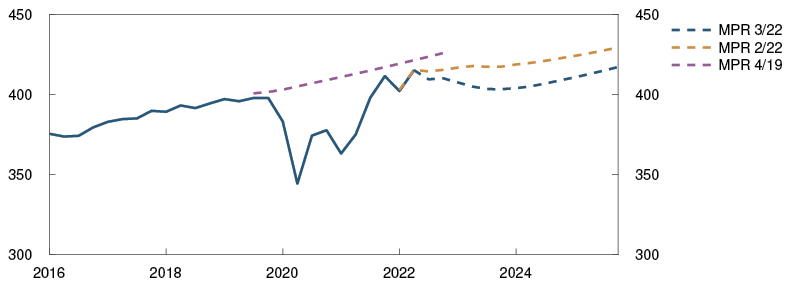
Sources: Statistics Norway and Norges Bank
Weaker growth in housing investment
House price inflation was sustained by high demand and few unsold homes in the first half of 2022 but declined in summer. House prices are expected to fall in 2023 owing to rising interest rates, before picking somewhat up again further out in the projection period. The projections for house price inflation have been revised down compared with the June Report. For more on the housing market, see Section 5.
Housing investment has been weaker than projected (Chart 3.6). Prices for materials such as wood and steel have declined but remain at high levels. Regional Network contacts report that labour shortages and high building costs are having a dampening effect on residential construction. At the same time, new home sales have declined to a low level and indicate a lower level of residential construction ahead. In conjunction with weaker house price inflation, housing investment is projected to be lower ahead than in the June Report.
Chart 3.6 Weak growth in housing investment6 Housing investment. Annual change. Percent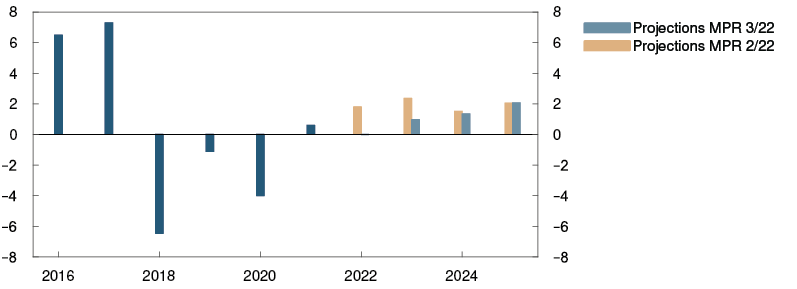
Sources: Statistics Norway and Norges Bank
Continued high business investment
Following solid growth in 2022 Q1, mainland business investment fell in Q2, particularly in services. Business investment has been weaker than expected.
In August, Regional Network contacts reported plans to increase investment in the coming year, but the planned increase was lower than in May. Electricity and investment goods prices have increased substantially over the past year, and a growing number of contacts report that the high prices are restraining investment. See "Electricity prices are pushing up underlying inflation and dampening investment" for a further discussion of how high energy prices are impacting investment.
In the projections, rising interest rates, weak growth prospects and elevated electricity and investment goods prices restrain investment growth ahead. However, the climate transition both in Norway and abroad is boosting business investment aimed at reducing emissions, and investment in batteries, hydrogen, the power sector and CCS is expanding rapidly. Investment in the power sector will likely also pick up ahead on the back of high electricity prices. Overall, mainland investment is projected to increase by 3–4% annually in the years ahead (Chart 3.7). The growth projections have been revised down compared with the June Report.
Chart 3.7 Higher mainland business investment7 Business investment in mainland Norway. Annual change. Contribution to annual change. Percentage points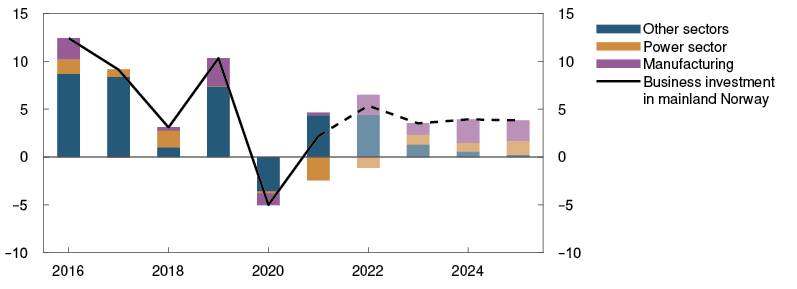
Sources: Statistics Norway and Norges Bank
Oil and gas investment has declined in recent years. As a number of large projects are nearing completion, petroleum investment is expected to fall further in 2022. More development projects will be launched towards the end of the year, stimulated by the temporary tax changes for oil companies introduced in 2020. This will contribute to a marked rise in investment in the years ahead (Chart 3.8), which will be amplified by high projected oil and gas prices ahead and prospects for increased European demand for Norwegian gas in the coming years.
Chart 3.8 Higher petroleum investment in the years ahead8 Petroleum investment. Constant 2022 prices. In billions of NOK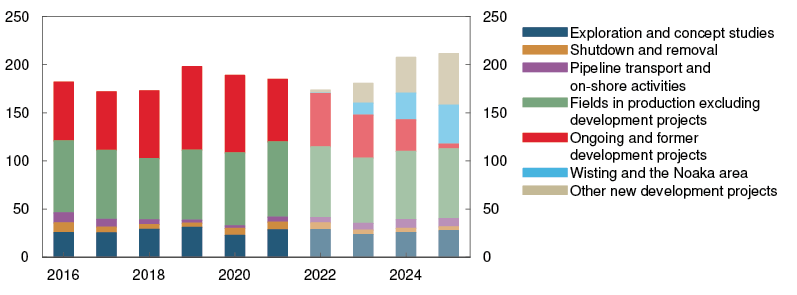
Sources: Statistics Norway and Norges Bank
Higher petroleum investment will boost exports and imports
Overall mainland exports have decreased so far in 2022 owing to lower exports of seafood and refined oil products. The decline has been cushioned by increased inbound tourism. While tourism is expected to continue rising, export growth is dampened by lower purchasing power among trading partners. In 2023, oil service exports are expected to increase appreciably, driven by the upturn in the global petroleum industry. Weak growth prospects for Norway’s trading partners pull down on growth in other mainland exports. The appreciation of the krone over the projection period also weighs on export growth ahead. The projections for exports are lower than in the June Report.
Import growth is expected to be strong in 2022, largely driven by increased outbound tourism, and is then expected to decline somewhat. High mainland and petroleum investment is projected to boost imports in the coming years.
Higher public demand ahead
In 2022 Q2, public demand was weaker than expected and is projected to be slightly lower in 2022 than assumed in the June Report (Chart 3.9). With prospects for a faster slowdown in the Norwegian economy, growth in public demand is assumed to be higher from 2023 than projected in June.
Chart 3.9 Higher public demand in 20239 Public demand. Annual change. Percent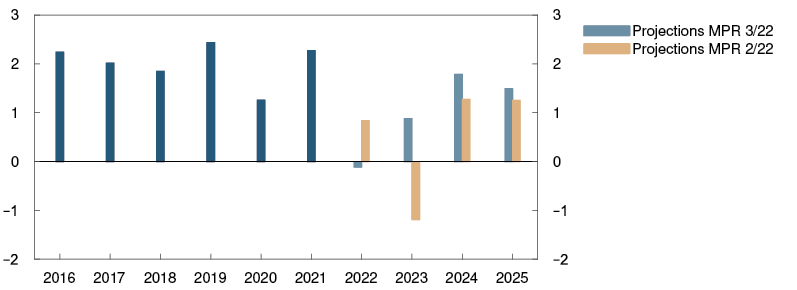
Sources: Statistics Norway and Norges Bank
Public spending is high following a period of fiscal accommodation during the pandemic. In 2022 and 2023, government support for electricity bills and measures relating to the war in Ukraine will keep public spending at a high level.
The withdrawal of extraordinary pandemic-related measures will on the other hand contribute to lower spending next year.
The projections are uncertain
The degree of uncertainty surrounding the projections for the Norwegian economy is higher than normal. The future evolution of energy and commodity prices is highly uncertain. If energy prices rise higher than assumed, business profitability may decline by more than expected and push inflation higher, which could result in lower business investment and consumption than projected. At the same time, high energy prices entail an increase in government revenues, which may result in higher government transfers than assumed, and thereby lift household purchasing power.
1 Period: January 2019 – December 2022. Projection from May 2022 for MPR 2/22 and from August 2022 for MPR 3/22.
2 Period: May 2022 – February 2023. Growth past three months and expected growth next six months.
3 Period: 2016 – 2025. Projections from 2022. Petroleum investment includes investment in international shipping.
4 Period: 2012 – 2025. Projections from 2022. Income and expenditures as share of household disposable income. Growth in real household disposable income is growth in household disposable income minus inflation.
5 Period: 2016 Q1 – 2025 Q4. Projections from 2019 Q4 – 2022 Q4 for MPR 4/19. Projections from 2022 Q2 for MPR 2/22. Projections from 2022 Q3 for MPR 3/22.
6 Period: 2016 – 2025. Projections from 2022.
7 Period: 2016 – 2025. Projections from 2022.
8 Period: 2016 – 2025. Projections from 2022. Data for 2016–2021 from Statistics Norway’s investment survey and deflated by the price index for petroleum investment in the national accounts. The price index is projected to increase by 4% from 2021 to 2022 and by 2% from 2023.
9 Period: 2019 – 2025. Projections from 2022.
3.2 Labour market
The labour market is tight
Unemployment is low, and the employment rate is high. Employment has increased substantially over the past year, with nearly 150 000 more people employed in 2022 Q2 than at the same time in 2021. This is somewhat higher than projected in the June Monetary Policy Report. Preliminary figures suggest that employment continued to increase in July. Employment has shown a rise in 2022, despite weak GDP growth in the same period. In the first two quarters of 2022, employment rose by 1½%, whereas GDP only rose by ¼%, which means that productivity has fallen.
The rise in employment reflects a lower number of unemployed, but also an increase in labour force participation. In the recent period, the number of temporary foreign workers in Norway has risen markedly and at a faster pace than assumed in June (Chart 3.10).
Chart 3.10 Number of temporary foreign workers has increased10 Number of non-resident wage earners. In thousands. Seasonally adjusted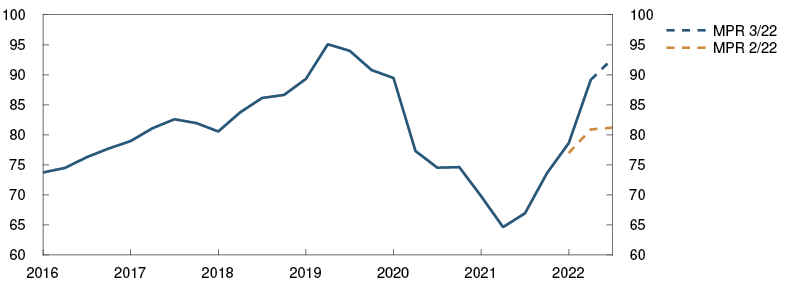
Sources: Statistics Norway and Norges Bank
In addition, more unemployed residents have entered the labour market (Chart 3.11). All population groups seem to be represented, but the increase in employment among immigrant residents is particularly high. Immigrants and temporary workers have accounted for approximately half of the growth in employment over the past year.
Chart 3.11 Higher employment rate11 Employed as a share of the population aged 15–74. Percent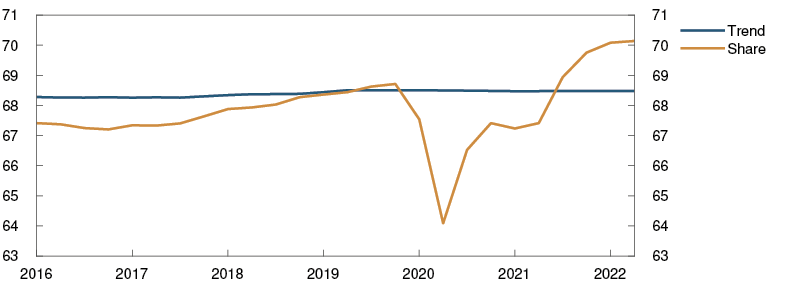
Sources: Statistics Norway and Norges Bank
At the end of August, 47 900 persons were registered as fully unemployed. Adjusted for normal seasonal variations, this accounts for 1.6% of the labour force, as projected in the June Report. This is the lowest unemployment rate recorded since 2008. The decline in unemployment is mainly attributable to changes in long-term unemployment. At the same time, the inflow of fully unemployed job seekers has recently increased according to the Norwegian Labour and Welfare Administration (NAV), and the number of those unemployed for less than six months has risen slightly. This may suggest a rise in unemployment ahead.
Labour shortages have eased
Labour demand is strong, and the number of job vacancies is at its highest since Statistics Norway first started its sample vacancy survey in 2010. The number is particularly high in the hospitality sector, but also when excluding this sector, the number of vacancies is high (Chart 3.12). At the same time, NAV statistics show that although the number of new job vacancies is high, the trend in new job vacancies has declined in recent months, which may indicate that labour demand is declining.
Chart 3.12 High number of job vacancies12 Job vacancy rate. Percent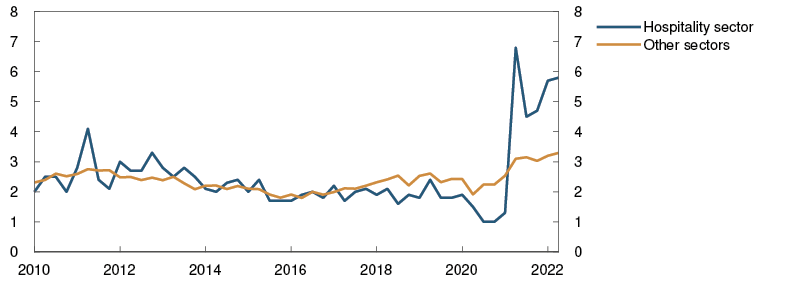
Source: Statistics Norway
In August, 46% of Regional Network contacts reported that production is being constrained by labour shortages. This share was smaller than in May.
Unemployment projected to edge up
Employment is projected to show little change in the months ahead. In August, Regional Network contacts expected employment to rise less over the next three months than in recent months. Norges Bank’s Expectations survey also indicates weaker employment growth in the period ahead.
In the projections, the economy has passed a cyclical peak, implying that employment growth will continue to slow ahead. The number of employed is projected to decline over the next two years before increasing slightly thereafter (Chart 3.13).
Chart 3.13 Projected fall in employment13 Employed. In thousands. Seasonally adjusted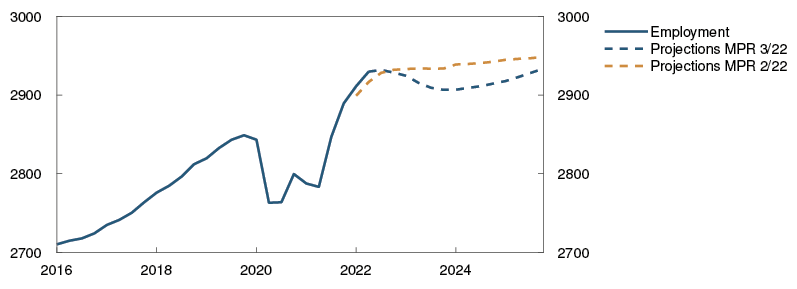
Sources: Statistics Norway and Norges Bank
The number of temporary foreign workers is expected to continue to move up ahead. With rising unemployment in many eastern European countries, the number of foreign workers seeking jobs in Norway is expected to increase. The war in Ukraine has led to a rise in the number of refugees coming to Norway, some of whom are expected to enter the Norwegian labour market in the coming years. In isolation, this contributes to easing labour market pressures. On the other hand, lower economic activity dampens labour supply somewhat in the coming years.
Unemployment is expected to rise gradually ahead, peaking in 2024 at around the level prevailing just prior to the pandemic. (Chart 3.14). The projections for unemployment are slightly higher than in the June Report.
Chart 3.14 Somewhat higher unemployment ahead14 Registered unemployed as share of the labour force. Seasonally adjusted. Percent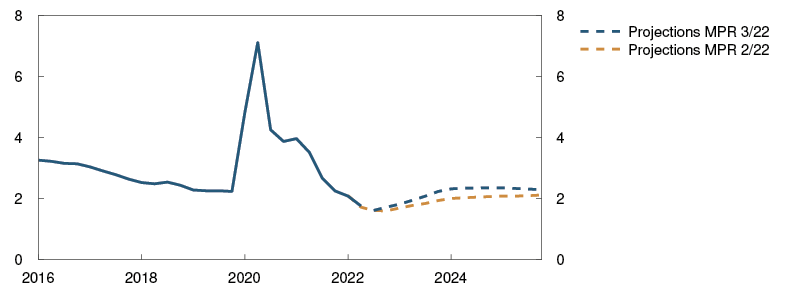
Sources: Norwegian Labour and Welfare Administration (NAV) and Norges Bank
10 Period: 2016 Q1 – 2022 Q3. Projections from 2022 Q2 for MPR 2/22. Projections from 2022 Q3 for MPR 3/22.
11 Period: 2016 Q1 – 2022 Q2.
12 Period: 2010 Q1 – 2022 Q2.
13 Period: 2016 Q1 – 2025 Q4. Projections for employment from 2022 Q2 for MPR 2/22 and from 2022 Q3 for MPR 3/22.
14 Period: 2016 Q1 – 2025 Q4. Projections from 2022 Q2 for MPR 2/22 and 2022 Q3 for MPR 3/22.
A slowdown in the Norwegian economy
Output is assessed to be above potential, but the output gap is now declining. The slowdown in the economy has come somewhat faster than envisaged in the June Report and appears to be more pronounced. Output is expected to fall below potential in the latter half of 2023, remaining below potential to the end of the projection period.
The output gap is a measure of the difference between actual output (GDP) and potential output. Potential output is determined by trend productivity and trend employment.
Potential output and the output gap cannot be observed and must therefore be estimated. The Bank’s output gap estimates are based on an overall assessment of various indicators and models. Particular weight is given to labour market developments.
Output is assessed to have reached potential in autumn 2021. Activity continued rising through the year and into 2022. In 2022 Q2, unemployment fell and employment was somewhat higher than expected, while labour supply also increased somewhat more than envisaged. Our overall assessment is that the output gap in Q2 was just above 2%, as projected in the June Report.
There are clear signs that the output gap started to decline into Q3. Mainland GDP fell in July. The inflow of new fully unemployed job seekers has risen recently, as has the number of short-term unemployed. The stock of job vacancies remains high, but the number of new job vacancies has declined in recent months. Owing to the higher number of short-term unemployed and a lower number of new vacancies, the number of short-term unemployed per job vacancy has risen recently (Chart 3.A), which may indicate that unemployment will also increase further out.
Chart 3.A Signs of a change in the labour market1 Unemployment as a percentage of the labour force. Seasonally adjusted.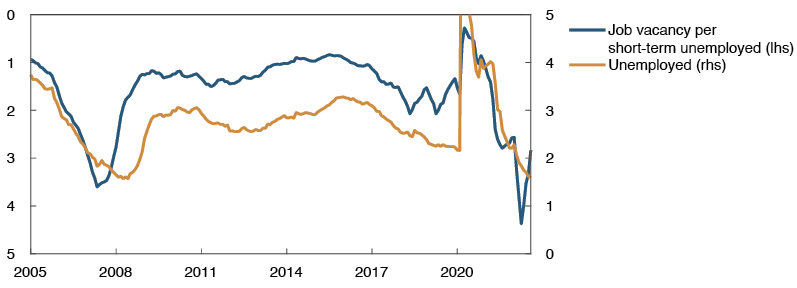
Sources: Norwegian Labour and Welfare Administration (NAV), Statistics Norway and Norges Bank
In August, Regional Network contacts reported that capacity utilisation was high but still a little lower than in May. Labour shortages were still substantial, according to contacts, but not as large as in May. Regional Network indicators point to a decline in capacity utilisation in Q3 (Chart 3.B). Overall, the output gap is projected to have declined to somewhat below 2% in Q3, which is lower than projected in the June Report (Chart F in "Monetary policy assessment").
Chart 3.B Lower capacity utilisation for firms2 Percent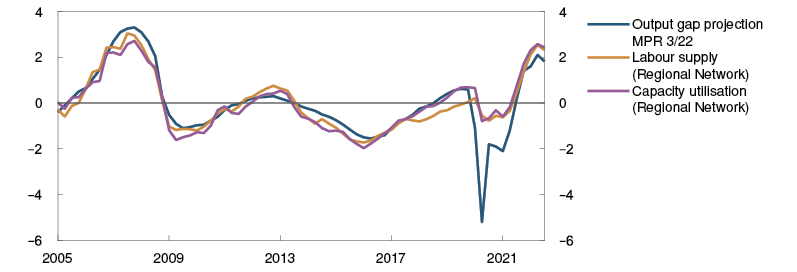
Source: Norges Bank
Growth in the mainland economy is expected to be weak in the period ahead. The output gap is projected to decline, with output falling below potential in the latter half of 2023, remaining somewhat below potential at the end of 2025.
Since the June Report, the estimate of potential output has been revised down, reflecting developments in productivity growth, which have again been weak and weaker than expected (Chart 3.C, left panel). Productivity growth in Norway has been trending downwards for some time but has been particularly low in recent years. Trend productivity growth3 has fallen from a high level prior to the financial crisis to its current rate of 0.6% (Chart 3.C, right panel). Information from the national accounts and the Regional Network and assessments of GDP and employment growth indicate that productivity growth will be 1.3% lower at the end of 2022 than projected in the June Report. Against this background, productivity growth is now projected to be lower in the coming years too.
Chart 3.C Weak productivity growth4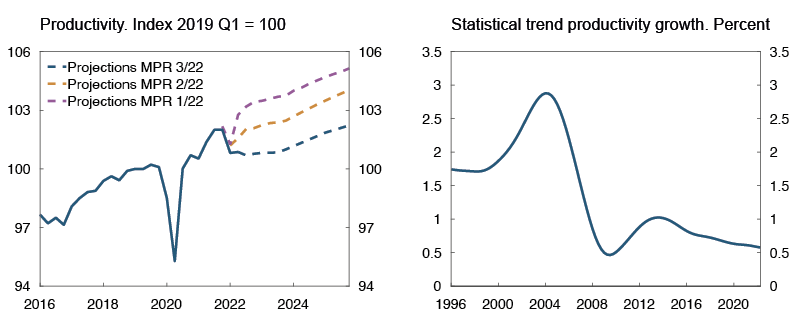
Sources: Statistics Norway and Norges Bank
At the same time, the projection for potential employment has been revised up, as the inflow of temporary foreign workers appears to be higher than expected. In isolation, this has lifted the projection for potential output.
Overall potential output is projected to grow by just above 1% annually, given trend employment growth of ½% and trend productivity growth of a little above ½%. The trend growth projections are slightly lower than in the June Report.
1 Period: January 2005 – August 2022. Short- term unemployed are job seekers that have been unemployed for less than 26 weeks. Job vacancies are composed of a NAV (Norwegian Labour and Welfare Administration) -series trend for new job vacancies estimated by Norges Bank, Statistics Norway's job vacancy -survey and the historical job vacancy statistics. For more details, see Chart 3.B in MPR 2/22.
2 Period: 2005 Q1 – 2022 Q3. Regional Network capacity utilisation indicators have been converted to output gaps by a simple model calculation.
3 Measured by the rise in the trend component using a Hodrick-Prescott filter with lambda = 1600.
4 Period: 2016 Q1 – 2025 Q4 for productivity level. Projections from 2022 Q1 for MPR 1/22, 2022 Q2 for MPR 2/22 and 2022 Q3 for MPR 3/22.
Period: 1996 Q1 – 2022 Q2 for the productivity growth trend. Trend using a Hodrick-Prescott filter. Lambda = 1600.
3.3 Prices and wages
High inflation
Consumer price inflation is now rising rapidly and faster than projected in the June Report. Following a 3.5% annual rise in the consumer price index (CPI) in 2021, 12-month inflation has risen in 2022. In August, CPI inflation was 6.5% higher than in August 2021. An important reason for the rise is the pronounced increase in energy prices (Chart 3.15).
Chart 3.15 Sharp rise in prices for energy products1 Energy price index in the CPI. Twelve-month change. Percent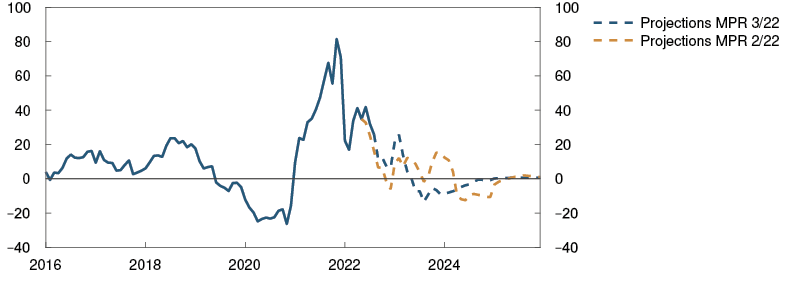
Sources: Statistics Norway and Norges Bank
The rise in CPI adjusted for tax changes and excluding energy products (CPI-ATE) has also accelerated. The 12-month rise in the CPI-ATE has accelerated from about 1% in autumn 2021 to 4.7% in August 2022. Other underlying inflation indicators have also increased over the past year and are well above the 2% inflation target (Chart 3.16).
Chart 3.16 Consumer price inflation has risen2 CPI and underlying inflation indicators. Twelve-month change. Percent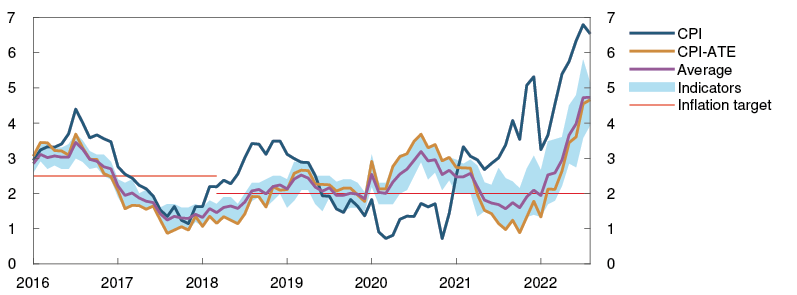
Sources: Statistics Norway and Norges Bank
The rise in prices has gained momentum for most product and service groups, and particularly for food and non-alcoholic beverages. There has also recently been a sharp rise in prices for accommodation and restaurant services, likely reflecting high demand, elevated labour costs and rising food prices. The rise in prices for non-air transport products and services likely reflects higher fuel prices and stronger travel demand following the pandemic. House rents have also risen slightly faster recently, but at a slower pace than CPI-ATE inflation.
Prices for domestically produced goods and services have recently risen at a faster pace and more than projected in the June Report (Chart 3.17). The 12-month rise in prices for domestically produced goods and services was 4.7% in August. Looking ahead, some of firms’ electricity costs are expected to be passed on to selling prices (see "Electricity prices are pushing up underlying inflation and dampening investment"). Together with higher costs for labour and intermediate goods, this is expected to fuel a continued rise in prices for domestically produced goods and services in the period ahead. Weak productivity growth is also likely to push up inflation. Further out, lower capacity utilisation and a fall in energy prices will contribute to curbing the rise in prices for domestically produced goods and services.
Chart 3.17 Higher than expected inflation3 Domestically produced goods and services and imported goods in the CPI-ATE. Four-quarter change. Percent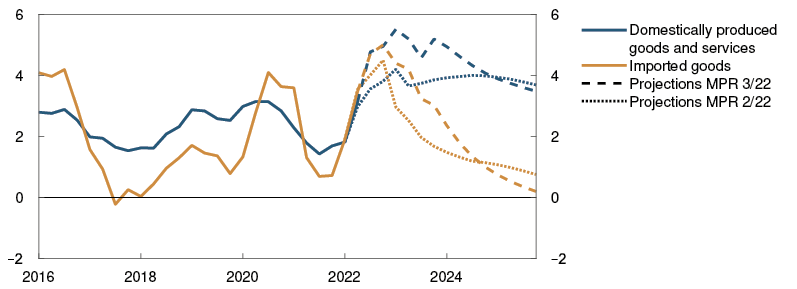
Sources: Statistics Norway and Norges Bank
The 12-month rise in prices for imported consumer goods was 4.7% in August. Stronger external inflationary pressures (Chart 3.18) reflect the global rise in energy and commodity prices, but also continued high freight rates. From 2023, external inflationary pressures are projected to ease owing to prospects for lower producer price inflation and an expected decline in freight rates. Together with a somewhat stronger krone, this is expected to dampen imported consumer goods inflation.
Chart 3.18 Strong external inflationary pressures4 Producer prices for imported consumer goods incl. freight rates. Annual change. Percent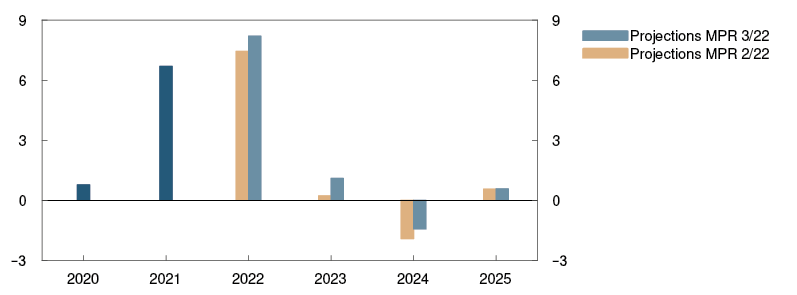
Sources: Refinitiv Datastream and Norges Bank
The four-quarter change in the CPI-ATE is projected to increase to 5.3% in 2023 Q1, before declining gradually to 2.4% at the end of 2025.
The inflation projections for the next few years are markedly higher than in the June Report, but little changed at the end of the projection period.
The energy futures prices underlying the projections indicate that both electricity and fuel prices will drive up CPI inflation through winter. The rise in energy prices is expected to slow markedly thereafter. The electricity bill support scheme for households is dampening the impact on electricity prices in the CPI. The projections assume that the scheme will be retained for the entire projection period. The four-quarter change in the CPI is expected to remain elevated until 2023 Q1 and decline thereafter. At the end of 2025, four-quarter CPI inflation is projected at 2.3%.
Higher wage growth, but weak real wage growth
The tightening of the labour market has contributed to the gradual rise in wage growth over the past few years.
Annual wage growth in 2021 was 3.5%. In the June Report, wage growth was projected to rise further to 3.9% in 2022. Register-based wage statistics indicate that wage growth in the first half of 2022 may have been slightly higher than projected in June. At the same time, wage growth expectations for 2022 have risen slightly. According to Norges Bank’s Expectations Survey, the social partners overall expect wage growth of 4.1% in 2022 (Chart 3.19). Norges Bank’s Regional Network contacts expect wage growth of 4.0%. The projection for annual wage growth has been revised up to 4.0%.
Chart 3.19 Expectations of higher wage growth5 Annual wage growth. Percent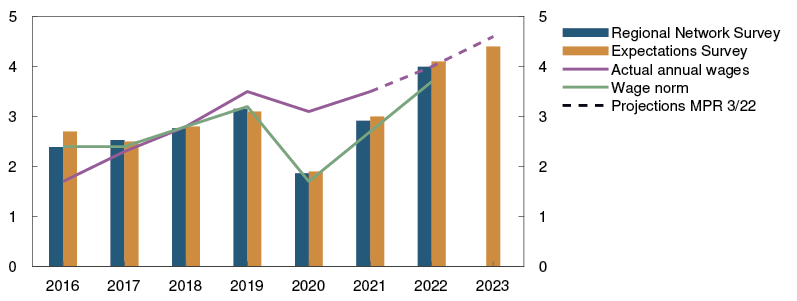
Sources: Epinion, Ipsos, Confederation of Norwegian Enterprise (NHO), Norwegian Confederation of Trade Unions (LO), Opinion, Statistics Norway and Norges Bank
Wage growth expectations for 2023 have risen according to the Expectations Survey, with the social partners now expecting overall wage growth of 4.4% in 2023.
Wage growth is projected to be higher in 2023 than in 2022, driven by prospects for high consumer price inflation. At the same time, the Expectations Survey and Regional Network Survey indicate weakened business profitability (Chart 3.20). In addition to the recent weak growth in productivity, this likely reflects the inability of firms to fully pass on costs for electricity and other intermediate goods to prices. Combined with a gradual rise in unemployment, lower profitability alone is expected to dampen wage growth.
Chart 3.20 Weakened business profitability6 Change in operating margins according to the Regional Network and the Expectations Survey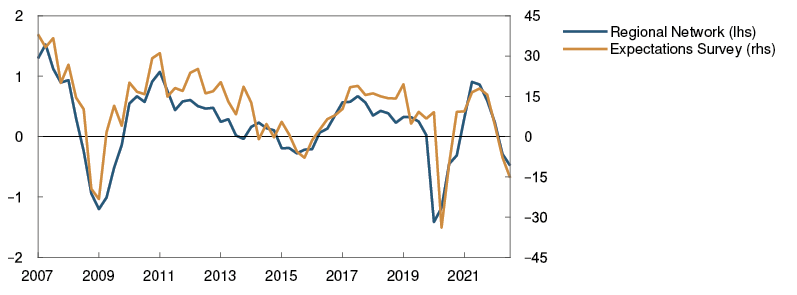
Sources: Epinion, Ipsos, Opinion and Norges Bank
Norway’s terms of trade have improved considerably on the back of high gas prices. Historically, improved terms of trade have fuelled wage growth, partly because higher oil prices have resulted in increased petroleum investment and improved profitability in the oil service industry. The rise in gas prices is not expected to boost activity to the same extent in the near term, but further out in the projection period, increased oil revenues lift activity and raise mainland business profitability. A decline in electricity prices further out in the projection period will also reduce business costs and provide room for higher wage growth.
Wage growth is projected at 4.6% in 2023, before moving down in 2024 and 2025 (Chart 3.21). The projections are little changed from the June Report.
Chart 3.21 Weak real wage growth7 Annual change. Percent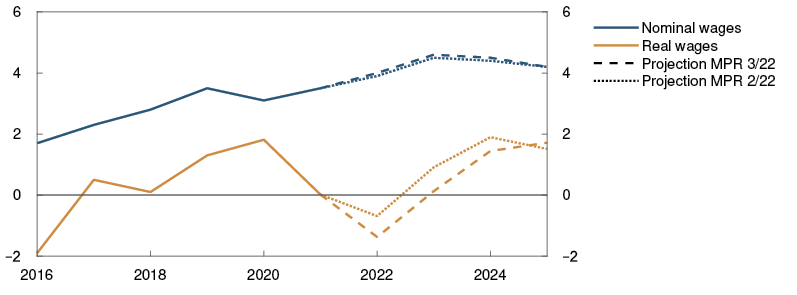
Sources: Statistics Norway and Norges Bank
Real wages remained unchanged in 2021, but a marked decline in real wages appears likely in 2022. In the Bank’s projections, real wage growth is close to zero in 2023. From 2024, wages are projected to rise faster than consumer prices again. Average annual real wage growth is projected to be around 0.5% in the period 2022–2025, which is lower than in the June Report.
There is unusually high uncertainty about movements in price and wage inflation ahead. Energy futures prices have recently been highly volatile and may prove to be considerably higher or lower than indicated by current futures prices and assumed in the projections. At the same time, the impact that historically high electricity prices will have on wage formation and firms’ price-setting behaviour is highly uncertain. There is little experience to draw on.
High electricity prices provide considerably higher central and local government revenues, while generating higher costs for the private sector and households despite the electricity bill support schemes. In the projections for price and wage inflation, costs are assumed to be borne partly by employees, who will experience weak real wage growth, and partly by firms, whose profitability will weaken. The burden sharing between firms and employees could differ from that envisaged, in which case wage and price inflation would also differ.
If employees negotiate higher pay increases than envisaged, inflation might also turn out to be higher. On the other hand, if firms pass a smaller share of the energy costs on to prices, inflation and profitability will decline, which will contribute to restraining wage growth.
The substantial energy revenues may also lead to higher government transfers or support schemes. On the one hand, support schemes may restrain price and wage inflation. On the other hand, they may fuel demand, which in isolation may push up price and wage inflation.
1 Period: January 2016 – December 2025. Projections from June 2022 for MPR 2/22 and September 2022 for MPR 3/22. Energy price index in the CPI includes electricity, fuel and lubricants.
2 Period: January 2016 – August 2022. CPI-ATE: CPI adjusted for tax changes and excluding energy products. Average: Average value of 12 -month change for other underlying inflation indicators (CPIM, CPIXE, 20 percent trimmed mean, weighted median, CPI-XV and CPI-common) and CPI-ATE. Indicators: Highest and lowest 12-month change for other underlying inflation indicators.
3 Period: 2016 Q1 – 2025 Q4. CPI-ATE: CPI adjusted for tax changes and excluding energy products. Projections from 2022 Q2 in MPR 2/22 and 2022 Q3 in MPR 3/22.
4 Period: 2020 – 2025. Projections from 2022. Measured in foreign currency.
5 Period: 2016 – 2023. Annual wages: Actual wage growth from Statistics Norway. Norges Bank’s projections for 2022. Norges Bank’s Expectations Survey: Social partners’ wage growth expectations for the current year as measured by Norges Bank’s Expectations Survey in Q3 each year. Regional Network survey: Expected annual wage growth for 2022 as reported in Q3 each year.
6 Period: 2007 Q1 – 2022 Q3. Regional Network: Change in operating margins compared with same period a year earlier. Index from –5 (large fall) to +5 (large rise). Expectations Survey: Profitability next 12 months. Share of enterprises that report prospects for improved profitability minus the share that report prospects for lower profitability.
7 Period: 2016 – 2025. Projections from 2022. Real wages: Nominal annual wage growth adjusted for CPI inflation.
Expectations of higher inflation
Inflation expectations have increased recently. Inflation expectations tend to rise when inflation deviates substantially from the target.
Inflation expectations, as measured by Norges Bank’s Expectations Survey, have increased recently (Chart 3.D). Inflation expectations are the highest one year ahead, but inflation expectations further out have also risen and are above the 2% target.
Chart 3.D Higher inflation expectations1 Inflation expectations. Percent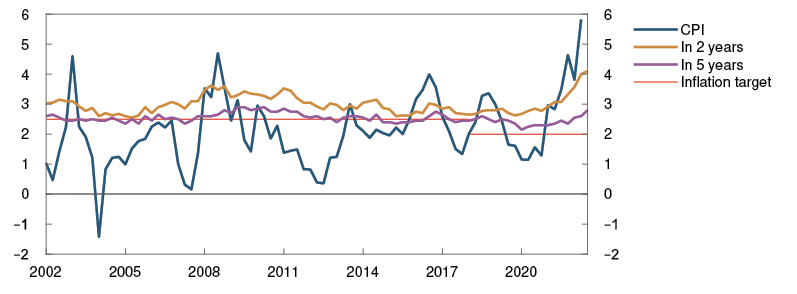
Sources: Epinion, Ipsos, Opinion and Statistics Norway
Expectations of future inflation may have a bearing on many economic decisions, such as wage and price setting. When medium- and long-term inflation expectations show little reaction to new information and remain close to the inflation target, inflation expectations are said to be anchored. Anchored inflation expectations in and of themselves have a stabilising effect on price and wage formation. Provided there is confidence in low and stable inflation, fluctuations in inflation around the 2% target are not likely to engender any significant economic costs. Monetary policy will then also be able to promote stable developments in the real economy.
In the Expectations Survey, the social partners and economists in the financial industry and academia are asked to estimate consumer price inflation one year ahead, two years ahead and five years ahead. Households and business leaders are also asked about their inflation expectations one year and two to three years ahead. Inflation expectations have been moving higher for all groups since spring 2021. Actual consumer price inflation has been rising over the same period.
Recent developments may suggest that the unusually high inflation has led to a rise in inflation expectations. Over a long time frame, the correlation between CPI inflation and long-run inflation expectations increases a little in periods when inflation deviates substantially from the target, but it has varied widely over time (Chart 3.E).
Chart 3.E Inflation expectations have increased when inflation has been high2
CPI. Percent.
Correlation between CPI and long-term inflation expectations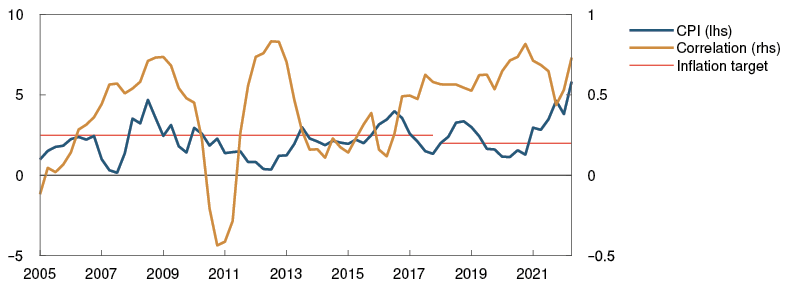
Sources: Epinion, Ipsos, Opinion, Statistics Norway and Norges Bank
1 Period: 2002 Q1 – 2022 Q3. Inflation expectations two years ahead are the average of expectations among households, business leaders, economists and social partners. Inflation expectations five years ahead are the average of expectations among economists and social partners.
2 Period: 2005 Q1 – 2022 Q2. Twelve-quarter rolling correlation between CPI and five-year inflation expectations among economists and social partners.
Electricity prices are pushing up underlying inflation and dampening investment
Very high electricity prices are increasing costs for Norwegian firms outside the power sector. These firms are expected to pass on part of this cost increase to their selling prices, but the cost increase is also expected to weaken their profitability. Lower profitability leads to lower investment and output, at the same time as high electricity and gas prices push up investment in power supply and the petroleum industry.
For most firms outside of energy-intensive manufacturing, electricity expenses vary in pace with electricity spot prices (Chart 3.F, left panel). Historically, however, volatility in electricity prices has been relatively transitory, and electricity expenses have accounted overall for a small share of the operating expenses of Norwegian firms. We find little empirical evidence that volatility in electricity costs has been of material importance for firms’ price-setting and investment behaviour, and the effects of electricity prices have not been incorporated into our models.
Chart 3.F Higher electricity prices are affecting firms’ costs1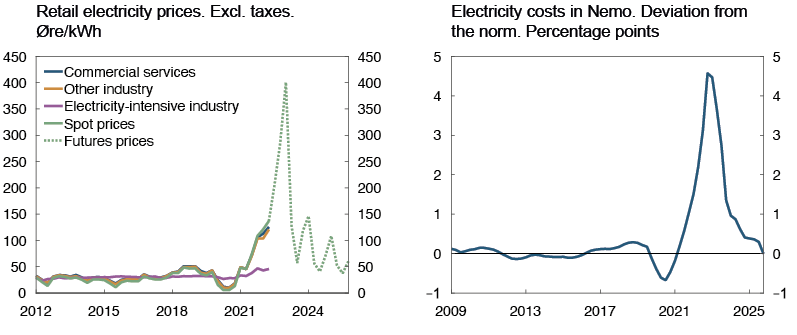
Sources: NordPool, Statistics Norway and Norges Bank
Electricity prices have surged since summer 2021, and futures prices also indicate high prices in the years ahead.2 The increase in electricity expenses will likely have such a strong impact on business costs that the Bank’s modelling system must now take this into account.
Effects on business costs and consumer prices
It is assumed that firms increase their selling prices in response to high electricity costs. The rise in electricity prices will thus not only impact energy prices in the CPI but also affect prices for other goods and services in the CPI-ATE.
In the analyses in this Report, we have introduced electricity costs in NEMO and used the model to quantify the effect of higher electricity prices on CPI-ATE inflation. The new variable in NEMO is based on an estimated cost index that seeks to measure how electricity prices have historically affected firms’ operating expenses (Chart 3.F, right panel).3 The new electricity costs in NEMO push up the projections for annual CPI-ATE inflation by just over ½ percentage point in 2023. As in the case of other cost types in this analytical framework, we assume that it will take some time for all firms to adjust their selling prices and that the cost increases will not be fully passed on to consumer prices in the near and medium term.
Effects on investment and output
Given that firms do not fully pass on higher costs to selling prices, higher electricity prices will weaken profitability. High electricity expenses will mean that some businesses will close down or reduce production, but the effect on overall economic activity is expected to be modest.
There has historically been a close relationship between firms’ profitability and their investment plans (Chart 3.G, left panel). Weaker profitability impairs firms’ ability to invest and dampens the expected profitability of investment projects. Higher electricity prices have pushed down the projection for business investment, excluding the power sector (Chart 3.G, right panel).
Chart 3.G Lower profitability is dampening investment4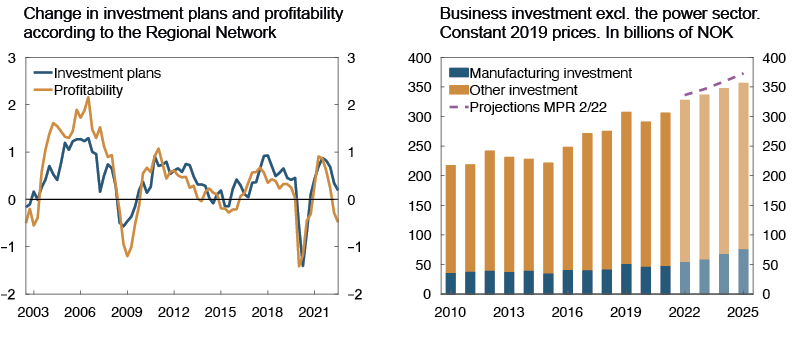
Sources: Statistics Norway and Norges Bank
On the other hand, high energy prices entail higher investment in Norwegian and global energy production. Owing to high electricity prices, the projections for investment in Norwegian electricity supply are higher than in the June Report. Prospects for persistently high electricity prices improve expected profitability of investment in new electricity production, but investment is associated with low price sensitivity in the short term, because of long lead times for new investment projects. Power investment is expected to fall in 2022 and then increase substantially in the coming years (Chart 3.H, left panel). Large-scale off-shore wind farms are expected to make a strong contribution to growth in power investment in the latter half of the 2020s.
High gas prices are boosting investment in the petroleum sector. However, the effect is expected to be limited, given that much of the potential for higher investment on the shelf has been realised as a consequence of the temporary tax changes from 2020. Oil and gas investment is projected to rise markedly towards the middle of the decade, before falling substantially in the period to 2030 (Chart 3.H, right panel).
Chart 3.H Strong growth in energy investment5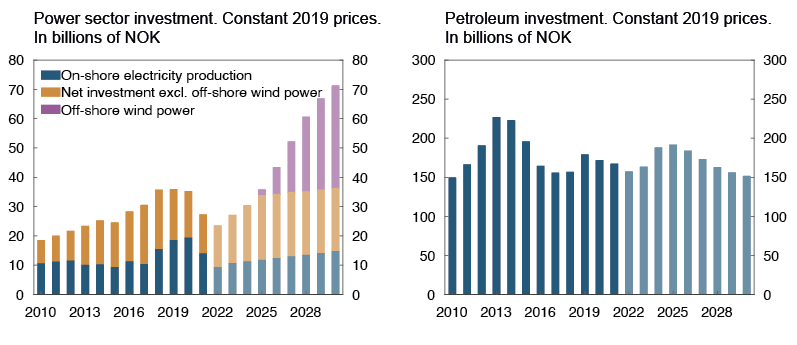
Sources: Statistics Norway and Norges Bank
The projections for oil services exports have been revised up, partly reflecting expectations of higher investment in oil, gas, off-shore wind farms and other energy production internationally.
Overall, high energy prices are expected to have a negative effect on investment in the period to 2025. There is considerable uncertainty about how the rise in prices affects firms’ behaviour. Without a historical basis of comparison and given the substantial uncertainty about future electricity price movements, the electricity situation has heightened the uncertainty surrounding the inflation projections. There is also uncertainty about the associated effects on investment and output.
1 Period: 2012 Q1 – 2025 Q4 for retail electricity prices. Spot and futures prices for Norwegian electricity. Futures prices at 16 September 2022.
Period: 2009 Q1 – 2025 Q4.
The energy price index is calculated as a real cost index deflated by the CPI, using historical system prices and futures prices from NordPool. We assume that 2019 was a normal year, with electricity costs making up about 1% on average of consumer-oriented firms’ operating costs.
2 The government electricity bill support scheme for firms will reduce the rise in electricity costs a little and relieve some of the impact on the most vulnerable firms.
3 The estimates of firms’ electricity expenses are based on figures from Eika, L. (2022) Moderate strømsjokk for de fleste i næringslivet [Moderate electricity shocks for most businesses]. SSB.no.
4 Period: 2003 Q3 – 2022 Q3 for Regional Network. Investment plans are defined as expected changes in investment over the next twelve months and change in operating margins past three months compared with the same period one year earlier. Index from – 5 (large fall) to + 5 (large rise). Period: 2010–2025 for business investment. Projections from 2022–2025.
5 Period: 2010 – 2030. Projections from 2022.
4 Monetary policy analysis
The policy rate was raised from 1.75% to 2.25% at the Committee meeting on 21 September. Based on the Committee’s current assessment of the outlook and balance of risks, the policy rate will most likely be raised further in November. The projections in this Report are based on a rise in the policy rate to around 3% in the course of winter.
Inflation is markedly higher than the target, and there are prospects that it will remain high for longer than projected earlier. The Committee assesses that a higher policy rate is needed to bring inflation down towards the target. A faster rate increase now reduces the risk of inflation becoming entrenched at a high level.
The projections are more uncertain than normal. The projections for inflation, the output gap and the policy rate have been revised considerably over the past year. If the outlook or the Committee’s assessment of economic relationships changes, the policy rate path will also be adjusted.
4.1 Objectives and recent developments
The primary objective of monetary policy is low and stable inflation. The operational target is annual consumer price inflation of close to 2% over time. Between the introduction of the inflation target in 2001 and March 2018, the target was 2.5%. A moving average of annual consumer price inflation has been close to 2% since 2001 (Chart 4.1). However, since the beginning of 2021, average CPI inflation has been above the target.
Chart 4.1 Average inflation close to the 2% target1 CPI. Four-quarter change. Percent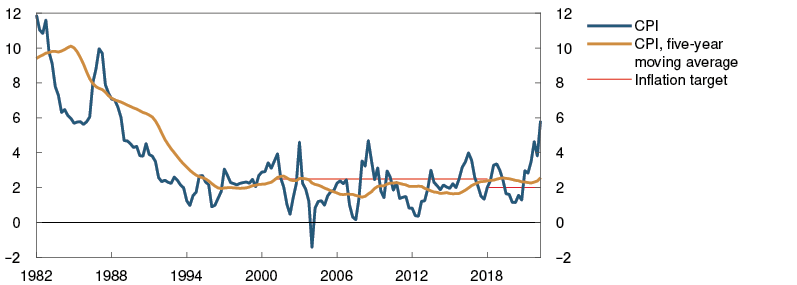
Sources: Statistics Norway and Norges Bank
Inflation targeting shall be forward-looking and flexible so that it can contribute to high and stable output and employment and to countering the build-up of financial imbalances. The monetary policy strategy is discussed further in "Norges Bank’s monetary policy strategy".
To help stabilise inflation around the target, the policy rate has been raised several times over the past year. The forecast in the June 2022 Monetary Policy Report implied a rise in the policy rate to 1.5% in August and a further rise to around 3% in the period to summer 2023. Owing to higher-than-expected inflation, the policy rate was raised to 1.75% in August.
1 Period: 1982 Q1 – 2022 Q2.
4.2 New information and new assessments
Model-based interpretation of new information
To shed light on how new information influences the economic outlook, new information and assessments are incorporated into the modelling system, while conditioning on the policy rate path in the June Report. In this exercise, the main focus is on the outlook for the output gap and inflation, two important considerations to which the Committee gives weight in the conduct of monetary policy.
Underlying inflation measured by the CPI-ATE has moved up recently. Higher energy futures prices indicate that business costs will continue rising faster than expected. This is expected to lead to higher prices for goods and services going forward. In addition, external inflationary pressures are projected to be stronger in the first part of the projection period than previously assumed. In the exercise with new information and an unchanged policy rate path, the inflation projection has been revised up substantially for the next two years but is a little lower in the latter part of the projection period (Chart 4.2).
Chart 4.2 Higher inflation2 CPI-ATE. Projections conditioned on new information concerning economic developments and the policy rate projection in MPR 2/22. Four-quarter change. Percent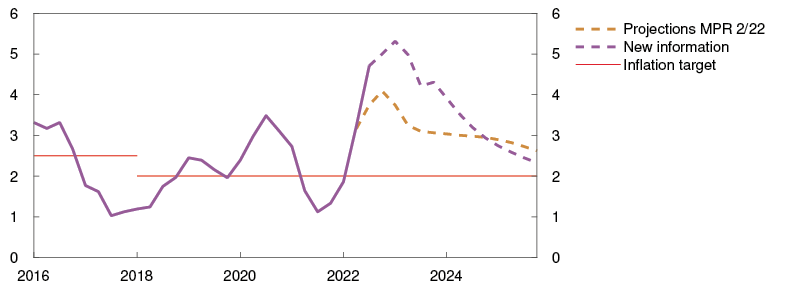
Sources: Statistics Norway and Norges Bank
The output gap is higher than normal but is now assessed as being somewhat lower than in the June Report. Higher-than-expected price and cost inflation is dampening real household disposable income and business profitability. This pulls down the projections for consumption and investment. At the same time, weaker-than-expected demand from Norway’s trading partners will contribute to reducing mainland exports. In the exercise with new information and an unchanged policy rate path, the output gap falls faster than projected in the June Report and will reach a level that is around 1 percentage point lower in the course of 2023 (Chart 4.3).
Chart 4.3 Prospects for a lower output gap3 Estimated output gap. Conditioned on new information concerning economic developments and the policy rate projection in MPR 2/22. Percent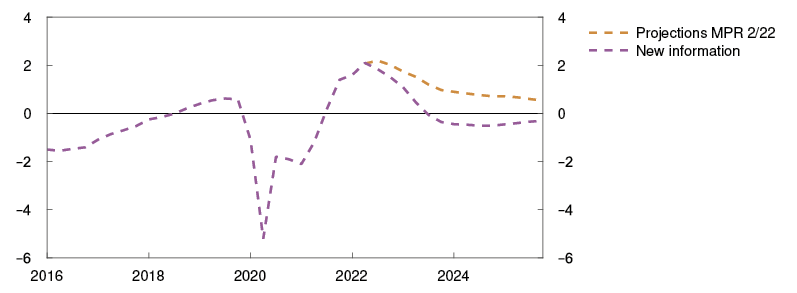
Source: Norges Bank
The model exercise illustrates the trade-offs the Committee faces when determining the orientation of monetary policy. The inflation outlook indicates a need for a tighter monetary policy than envisaged in June. This will curb inflation and bring it down further from a high level than if the policy rate path remains unchanged. Prospects for lower output and employment indicate in isolation that the policy rate should be set somewhat lower than warranted by inflation alone.
A simple rule indicates a higher policy rate
A simple estimated rule based on Norges Bank’s previous policy rate setting summarises the historical pattern of monetary policy reactions (see Monetary Policy Report 2/22). Combining this rule with the change in the output gap and inflation projections provides an indication of how monetary policy has normally reacted to corresponding information.
Given the upward adjustment of the inflation projection, the simple rule now indicates a higher policy rate in the coming quarters than implied by the rule in the June Report (Chart 4.4).
Chart 4.4 Simple rule implies a higher policy rate4 Money market rate. Percent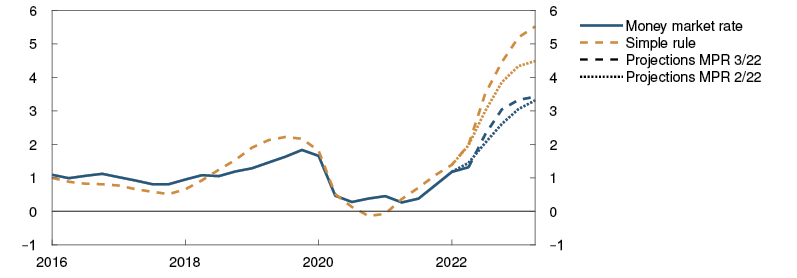
Source: Refinitiv Datastream and Norges Bank
Forward rates indicate a higher policy rate path
Market rates provide an indication of how market participants interpret new information and how they believe Norges Bank will respond.
The market’s policy rate expectations are higher than in June for the entire projection horizon, and the increase is particularly strong in the first half of the period (Chart 4.5). Forward rates indicate that the policy rate peaks at around 3.5% in the course of 2023, before drifting down to around 3% towards the end of the projection period.
Chart 4.5 Market policy rate expectations have risen5 Policy rate. Percent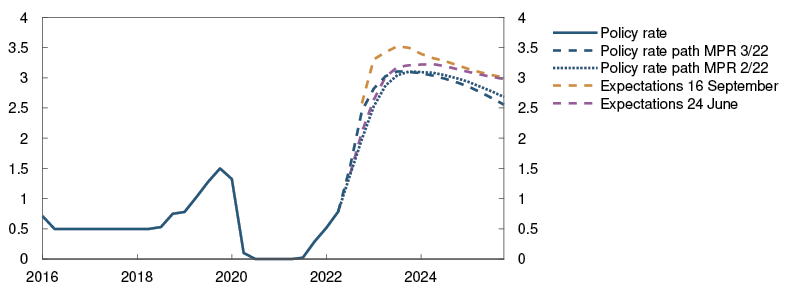
Sources: Refinitiv Datastream and Norges Bank
Policy rate to be raised further
The projections are based on the policy rate path in this Report. The policy rate path indicates a somewhat faster rise in the policy rate than in the June Report (Chart 4.6). The projections in this Report are based on a rise in the policy rate to around 3% in the course of winter.
Chart 4.6 Rise in the policy rate6 Interest rates. Percent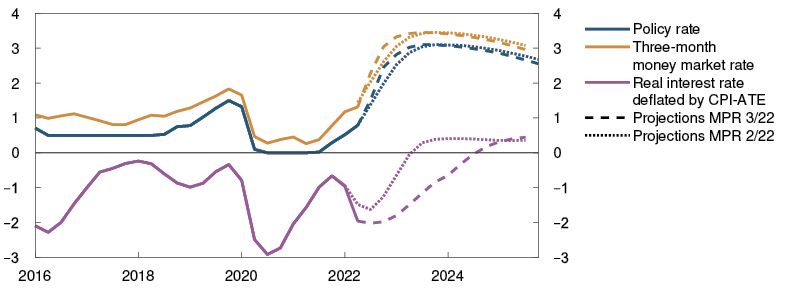
Sources: Statistics Norway and Norges Bank
There are signs that inflation will remain higher for longer than projected earlier. This suggests that a tighter monetary policy is now needed. A faster rate rise is expected to reduce the risk of inflation becoming entrenched at a high level and of a sharper tightening of monetary policy further out.
A tighter monetary policy is also likely to weigh more heavily on growth in the real economy. A higher policy rate dampens consumption and investment and restrains demand for labour. Owing to prospects for below-potential output and lower inflation later in the projection horizon, the policy rate path flattens gradually and moves down somewhat.
Even though the policy rate is now projected to rise faster than in the June Report, higher inflation means that the real interest rate will be lower than projected earlier. The real interest rate is expected to be lower than the neutral rate in the period ahead (Chart 4.6).7 Nevertheless, it is assumed that monetary policy will contribute to dampening inflation and growth in the real economy as in the June Report. Even though a lower real interest rate may stimulate the economy by inducing households and firms to bring forward consumption and investment, a higher nominal rate will restrain economic activity by reducing household disposable income. Real disposable income has been revised down. Many households will have to cover higher interest payments and higher prices for goods and services by reducing consumption. This applies especially to those unable to draw on bank deposits or reduce their principal payments. Overall, the monetary policy stance is expected to have a tightening effect on the economy.
If the economic outlook, the balance of risks or the assessment of the functioning of the economy changes, the policy rate may prove to be different from the one now indicated by the policy rate path. The Bank’s forecasts have been revised substantially over the past year, and it is unusually difficult to project inflation and output ahead. It is particularly uncertain how high energy and commodity prices will rise and what the pass-through to firms’ price-setting behaviour and wage formation will be.
2 Period: 2016 Q1 – 2025 Q4. Projections from 2022 Q2 for MPR 2/22 and from 2022 Q3 for MPR 3/22. CPI-ATE: CPI adjusted for tax changes and excluding energy products.
3 Period: 2016 Q1 – 2025 Q4. The output gap measures the percentage deviation between mainland GDP and projected potential mainland GDP.
4 Period: 2016 Q1 – 2023 Q2. Projections from 2022 Q2 for MPR 2/22 and 2022 Q3 for MPR 3/22.
5 Period: 2016 Q1 – 2025 Q4. Projections from 2022 Q2 for MPR 2/22. Projections from 2022 Q3 for MPR 3/22. Expectations 24 June 2022 for MPR 2/22 and 16 September 2022 for MPR 3/22.
6 Period: 2016 Q1 – 2025 Q4. Projections from 2022 Q1 for MPR 2/22 and 2022 Q2 for MPR 3/22 for the real interest rate using the money market rate and CPI-ATE. Projections from 2022 Q2 for MPR 2/22 and 2022 Q3 for MPR 3/22 for the policy rate and money market rate.
7 The neutral real rate of interest is the rate consistent with balanced developments in the economy in the medium term. The neutral real interest rate is normally assumed to be around 0% (see box in Monetary Policy Report 2/22).
4.3 Decomposition of changes in the rate path
The decomposition shown in Chart 4.7 illustrates some of the main drivers behind the change in the rate path from the June Report. The bars show contributions to changes in the rate path based on our main model NEMO, and the broken black line shows the sum of the bars. The solid line shows the actual change in the rate path.
Chart 4.7 Higher inflation pulls up the policy rate path8 Cumulative contributions. Percentage points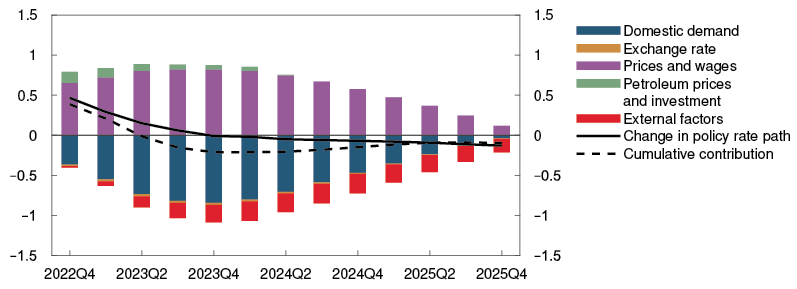
Source: Norges Bank
The inflation projection is substantially higher than in the June Report and is higher than implied in isolation by the output gap. The increase in energy costs for firms is expected to result in higher prices for domestically produced goods and services than previously anticipated. Import prices are also projected to increase more than previously expected in the coming months, but these price impulses are weaker from 2023. Thus, factors relating to prices and wages contribute overall to an upward revision of the rate path (purple bars).
There are now signs that the Norwegian economy is slowing earlier than projected in the June Report, and demand is projected to be weaker ahead. Factors relating to domestic demand therefore pull down the rate path in the coming years (dark blue bars). This is partly due to the assumption that higher-than-expected price and cost inflation will reduce consumption and investment, and to a greater extent than what is captured by our main model.9 In the decomposition this is captured by larger dark blue bars than would otherwise have been the case.
Oil futures prices are somewhat lower than in the June Report, while gas futures prices are far higher. On balance, these price movements are projected to contribute to somewhat higher activity in petroleum-related industries and to higher investment in this sector. Improved terms of trade also pull up wage growth further out. Petroleum prices and investment therefore pull up the rate path somewhat until the start of 2024 (green bars).
Growth among trading partners is now projected to be lower than in the June Report, which pulls down demand for Norwegian goods abroad and hence mainland exports. Owing to a narrower interest rate differential against other countries, the krone is now projected to be somewhat weaker than anticipated in the June Report. In isolation, this leads to an increase in import prices in NOK terms and pushes up the projection for net exports. Overall, however, external factors pull down the rate path (red bars).
The krone exchange rate is somewhat stronger than changes in petroleum prices and the interest rate differential against other countries would imply. Exchange rate factors in isolation pull down the rate path, but the contribution from these factors is small (orange bars).
The policy rate path expresses an overall assessment of new information as well as the Committee’s trade-offs between monetary policy objectives. The decomposition shows the contributions to the change in the policy rate path since the June Report, as interpreted by the Bank’s main model NEMO. The change in the policy rate path will normally deviate from the change in the model-based path. In this Report, the policy rate path is revised up approximately to the same extent as the model-based path at the beginning of the projection period and revised down approximately to the same extent towards the end of the horizon. The policy rate path is somewhat higher than the model-based path in 2023 and 2024.
8 Period: 2022 Q4 – 2025 Q4. Projections. The contributions are based on model estimates from the NEMO model, but there is no mechanical link between news and changes in the bars. The effects of news feed through with a lag and the interaction between economic variables may result in a reversal of the effects over time. In addition, projected contributions for the near term may be either positive or negative. The effect on the rate path is therefore shown most clearly by the cumulative contribution.
9 The Bank’s main model NEMO indicates a weaker consumption response from lower real income than other models in our modelling system. See the box on the effects of interest rate changes on consumption in Monetary Policy Report 2/22.
Norges Bank’s monetary policy strategy
The Bank’s monetary policy strategy describes the Committee’s interpretation of the monetary policy mandate and provides a framework for the Committee’s assessment of how monetary policy will respond to different shocks. The strategy is summarised below, and the full text is published on Norges Bank’s website.
The operational target of monetary policy is annual consumer price inflation of close to 2% over time. Inflation targeting shall be forward-looking and flexible so that it can contribute to high and stable output and employment and to countering the build-up of financial imbalances.
Low and stable inflation
When setting the policy rate, Norges Bank aims to stabilise inflation, as measured by the annual rise in the consumer price index (CPI), around the 2% target. Provided there is confidence in low and stable inflation, variations in inflation around the target are not likely to engender any significant economic costs. How quickly the Bank seeks to return inflation to target will depend on the shocks that have occurred and whether there are conflicts between achieving the target and other monetary policy considerations. In interest rate setting, the Bank gives weight to avoiding large and persistent deviations from the inflation target, whether above or below the target.
High and stable output and employment
Monetary policy can contribute to stabilising output and employment around the highest level that is consistent with price stability over time.
The economic costs of cyclical fluctuations are asymmetrical. High unemployment involves direct costs for both society and those unable to find employment. Very low unemployment, on the other hand, does not involve any direct costs, but only indirect costs potentially in the form of excessively high wage and price inflation. The Bank will therefore not aim to quickly close a positive output gap as long as there are prospects that inflation will remain within a range close to 2% and there are no signs of financial imbalances accumulating.
By preventing downturns from becoming deep and protracted, monetary policy can contribute to keeping unemployment from becoming entrenched at a high level so that the average level of employment over time is as high as possible.
Mitigating the build-up of financial imbalances
If there are signs that financial imbalances are building up, the consideration of maintaining high and stable output and employment may, in some situations, suggest keeping the policy rate somewhat higher than otherwise. This can to some extent mitigate the risk of a severe downturn further out. Nevertheless, the regulation and supervision of financial institutions are the most important tools for cushioning shocks to the financial system.
Response pattern
The policy rate influences inflation and the real economy with a lag, and the effects are uncertain. To reduce the risk of monetary policy contributing to economic instability, Norges Bank will normally respond less forcefully to shocks than if there had not been uncertainty about the transmission of monetary policy. Furthermore, the policy rate is normally changed gradually to make monetary policy more predictable and to reduce the risk of undesirable financial market volatility and unexpected reactions of households and firms. In situations where the risk of particularly adverse outcomes is pronounced, or if there is no longer confidence that inflation will remain low and stable, it may be appropriate to react more forcefully than normal in interest rate setting.
5 Decision basis for the countercyclical capital buffer
Norges Bank’s Monetary Policy and Financial Stability Committee has decided to keep the countercyclical capital buffer rate at 2.5%.
Norwegian households are highly leveraged, but credit growth has slowed over the past year. Property price inflation has also slowed from a high level during the Covid-19 pandemic. Property prices are expected to edge down ahead, and credit growth to slow further. Creditworthy households and firms appear to have ample access to credit.
Bank losses are expected to be low ahead, but there is substantial uncertainty surrounding the economic outlook. Owing to financial system vulnerabilities, shocks may have a stronger impact on the Norwegian economy, which may result in higher bank losses. Norwegian banks are highly profitable and satisfy the capital and liquidity requirements. The countercyclical capital buffer rate strengthens banks’ solvency and thus increases their resilience to shocks.
Framework for decisions on the countercyclical capital buffer
Decisions on the level of the countercyclical capital buffer are based on assessments of four main areas: (i) cyclical vulnerabilities, (ii) access to credit, (iii) banks’ capacity to absorb losses, and (iv) effects of a change in the rate on banks and the economy. See Norges Bank Papers 4/2022 for more information about Norges Bank’s framework.
An updated set of charts with all the indicators included in the framework is published on Norges Bank’s website.
5.1 Access to credit
Creditworthy firms appear to have ample access to credit. Banks have sufficient capacity to meet credit demand. Bond market risk premiums on new corporate issues have increased in 2022 (Chart 5.1). However, there are no signs that creditworthy firms have lost access to the bond market. The rise in risk premiums has been most pronounced in commercial real estate (CRE). Higher risk premiums have likely contributed to reducing bond issuance so far this year. At the same time, growth in lending by Norwegian banks has increased.
Chart 5.1 Bond market risk premiums have risen1
Investment grade. Five-year maturity. Percentage points over three-month Nibor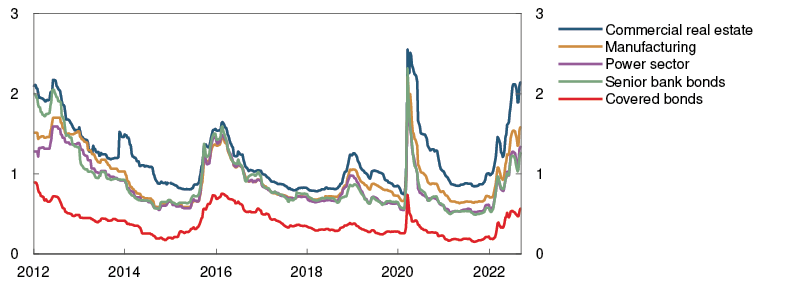
Sources: DNB Markets and Nordic Bond Pricing
Households also appear to have ample access to credit. The banks included in Norges Bank’s August Survey of Bank Lending reported unchanged credit demand and credit standards for households and firms in 2022 Q2 and expected no changes in Q3.
1 Period: Week 1 2012 – week 37 2022.
Indicative risk premium on senior five-year bonds issued by investment-grade banks and enterprises (BBB- or better).
There is a change in the data source in August 2015 from DNB Markets to Nordic Bond Pricing, which constitutes a break in the series.
5.2 Cyclical vulnerabilities and risks in the financial system
Experience shows that economic downturns are usually amplified if they follow a period of sharp rises in credit and asset prices. Partly owing to low interest rates, property prices rose sharply during the pandemic, and growth in household debt accelerated before slowing over the past year. On the whole, the assessment of cyclical vulnerabilities in the financial system is approximately the same as before the pandemic. Property prices are expected to edge down ahead, and credit growth to slow further. This may mitigate financial system vulnerabilities further out.
At the same time, there is now substantial uncertainty surrounding the economic outlook. Higher interest rates and high inflation may lead to a sharper fall in property prices and a more pronounced slowdown in the economy than currently envisaged. Uncertainty about the outlook for global growth and inflation has resulted in considerable financial market volatility, and European energy prices have risen sharply recently. Considerable global market volatility may lead to shocks that spill over to the Norwegian financial system. Owing to financial system vulnerabilities, shocks may have a stronger impact on the Norwegian economy, which may result in higher bank losses.
Rising household interest burdens
Household credit growth has moved down gradually in recent quarters, in line with more moderate housing market developments (Chart 5.2). Since the June 2022 Monetary Policy Report, growth has been somewhat lower than expected. Household credit growth is projected to continue to edge down through the projection period on the back of higher lending rates and low house price inflation.
Chart 5.2 Lower credit growth ahead2
Four-quarter change. Percent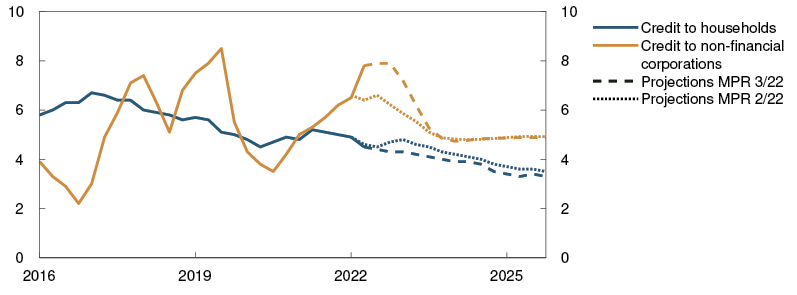
Sources: Statistics Norway and Norges Bank
Household debt-to-income (DTI) ratios are high and have risen substantially over a long period (Chart 5.3). High income growth, especially in the form of increased dividend income, contributed to the decline in DTI ratios towards the end of 2021. DTI ratios are expected to increase slightly towards the end of 2023 before moving lower. At the end of the projection period, DTI ratios are projected to return to 2017 levels.
Chart 5.3 Rising household interest burden3
Percent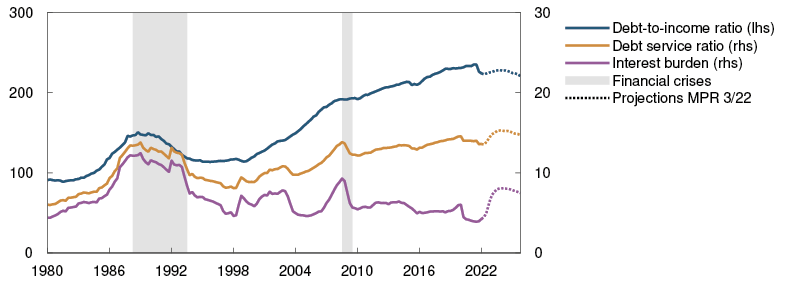
Sources: Statistics Norway and Norges Bank
Owing to the high level of debt and rising lending rates, households will have to spend a larger share of income on interest payments ahead. The interest burden is projected to approximately double in the period up to 2024, edging down thereafter. The household debt service ratio, which includes both interest and estimated principal payments, is expected to rise to a historically high level.
There is uncertainty regarding households’ response to markedly higher interest rates. If many households reduce consumption substantially at the same time, firms’ earnings and debt servicing capacity could be reduced and in turn lead to higher losses on banks’ loan portfolios and amplify a downturn in the Norwegian economy.
In recent years, the pandemic has severely limited household consumption opportunities and boosted saving. The household saving ratio has declined, but households’ stock of savings accumulated during the pandemic is still substantial. These excess savings better equip households to face higher expenses.
Growth in corporate debt from domestic sources has been higher than projected in the June Report (Chart 5.2) and was lifted by higher bank lending growth. Manufacturing and services made the main contributions to higher overall corporate credit growth. These developments may reflect higher investment in manufacturing in 2022 Q2. In line with investment projections, corporate credit growth is expected to remain elevated until the end of the year, before declining and stabilising at a lower level. See Section 3 for a further discussion of business investment.
The debt of Norwegian listed companies, excluding financial companies and companies engaged in oil and gas production, has increased in line with profitability over the past six years as a whole. In 2019 and 2020, corporate profitability was low, resulting in a temporary rise in debt burdens.4 In 2022 Q2, return on equity was somewhat above the average for the past six years. The recent high energy prices will push up corporate costs and likely weaken profitability for companies outside the energy sector ahead (see "Electricity prices are pushing up underlying inflation and dampening investment").
Household sector vulnerabilities
High household debt and high house price inflation through the pandemic are key household sector vulnerabilities (see discussion in Financial Stability Report 2021). Household debt is dominated by residential mortgage loans, and debt developments are closely associated with changes in house prices. A sharp and abrupt fall in house prices will therefore reduce housing wealth for many households. Periods of persistent high house price inflation and credit growth increase household sector vulnerabilities. If house prices and household debt rise faster than incomes, households become more vulnerable to income loss and higher interest rates.
Prospects for lower house prices
House prices rose more than income through the pandemic, and housing market vulnerabilities increased. In the course of 2021, house price inflation slowed (Chart 5.4), likely reflecting higher lending rates and a normalisation of household consumption patterns. House prices rose markedly in many countries during the pandemic, but they have recently levelled off or fallen in a number of countries.
Chart 5.4 House price inflation is slowing5
Percent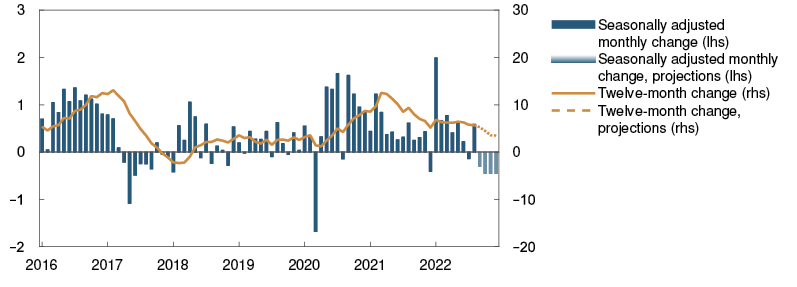
Sources: Eiendomsverdi, Finn.no, Real Estate Norway and Norges Bank
High demand and the low number of unsold homes in Norway contributed to sustaining house price inflation at the beginning of 2022, but inflation slowed in summer. Since the June Report, house price inflation has nonetheless been slightly stronger than expected. Even though turnover was higher than normal in August, the substantial addition of existing homes listed for sale led to an increase in the stock of unsold homes in the market.
In the market for new homes, sales of detached and semi-detached homes fell in 2021 when timber prices rose considerably (Chart 5.5). Relatively healthy sales of new flats sustained overall new home sales, but since May, sales of new flats have also fallen to a low level. This reflects the cooling of the market for existing homes and the decline in the number of new homes listed for sale likely owing to higher construction costs for flats. The low sales of new homes will likely dampen residential construction activity ahead (see also Section 3). Residential construction activity over the past three years has been lower than household formation and is expected to stay lower in the coming years.
Chart 5.5 Low level of new home sales6
Turnover. In hundreds of new homes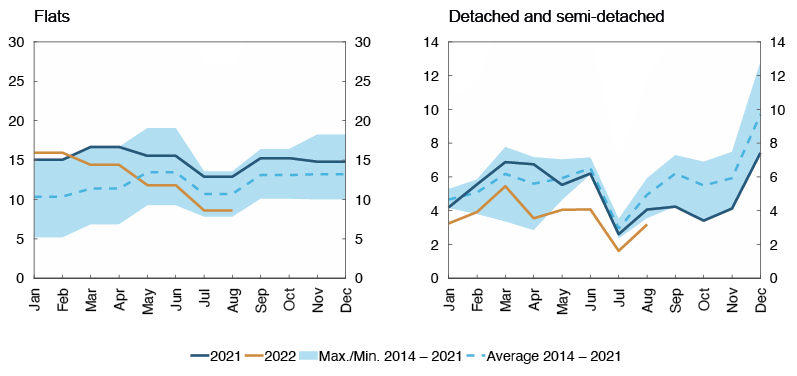
Sources: Norwegian Homebuilders’ Association, ECON Nye boliger, Economics Norway and Norges Bank
House prices are expected to fall by about 4% in the coming year on the back of rising lending rates (Chart 5.6). House price inflation is projected to pick up again somewhat further out in the projection period. House price projections have been revised down since the June Report, partly owing to a faster rise in the policy rate and a cooling of the labour market ahead. Expectations of somewhat lower residential construction activity ahead, in isolation, pushes up house prices.
Chart 5.6 Lower house price inflation ahead7
Four-quarter change. Percent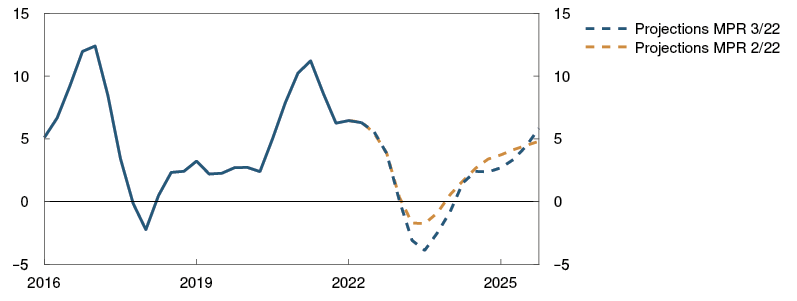
Sources: Eiendomsverdi, Finn.no, Real Estate Norway and Norges Bank
Following a period of very low lending rates and high household debt ratios, there is uncertainty regarding households’ response to a marked increase in consumer prices and interest rates. For example, demand for housing may be more sensitive to interest rate increases than assumed in this Report. Changes in house price expectations may also result in a sharper fall in house prices than projected, for example if many households bring forward home sales and postpone home purchases.
Prospects for lower CRE prices
CRE selling prices have risen markedly over a long period (Chart 5.7). In 2022 Q2, selling prices for prime office space in Oslo levelled off and fell in several other European capitals. Selling prices are estimated as rental prices divided by a yield.
Chart 5.7 Commercial property prices are expected to decline8
Estimated selling prices. In thousands of NOK per square metre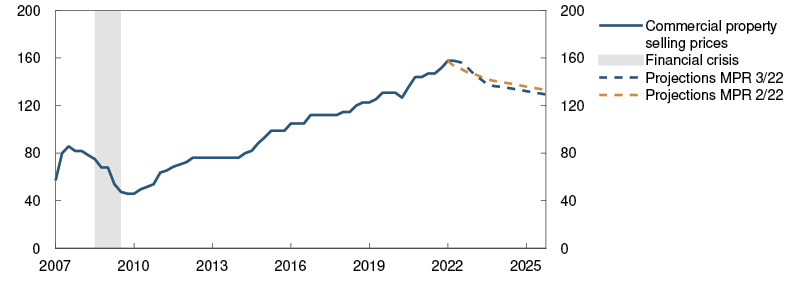
Sources: JLL and Norges Bank
The rise in selling prices in Oslo since mid-2021 reflects markedly higher rents. Owing to the low supply of new office buildings and high employment, rents are expected to continue to rise rapidly until the end of the year. A moderate rise in rents is expected thereafter, reflecting a slowdown in the Norwegian economy.
The yield depends on developments in long-term interest rates and risk premiums. The observed yield for prime office space in Oslo has remained at a record-low level since the end of 2020 despite the rise in long-term interest rates. However, market participants report that the yield has recently increased in most CRE segments in Norwegian towns. The yield has also risen in a number of European capitals. A gradual rise in the yield is expected ahead.
Overall, the projections for a rise in rents and yields indicate that CRE selling prices will decline in the years ahead, and at the end of the projection period, the prices are projected to return to pre-pandemic levels. Projections for selling prices have been revised down a little since the June Report.
Commercial property prices are particularly vulnerable to higher interest rates or risk premiums when yields are low. An abrupt rise in the yield can lead to a sharper fall in selling prices. In view of the high debt-to-revenue ratios of many CRE firms, higher interest rates would mean that a larger share of revenue will have to be used to service debt. In the event of a more pronounced slowdown than currently envisaged, the rise in rents may be weaker, which will lead to a fall in selling prices and impair CRE firms’ debt-servicing capacity. The rise in CRE prices in recent years has not been matched by corresponding borrowing. As a result, their equity ratios have increased, better equipping them for a price fall.
Some CRE firms may find it difficult to refinance their bond debt if CRE prices fall markedly. The bond market has become an important source of funding for many CRE firms, and the yields facing firms in the market have increased substantially in 2022. CRE firms have issued relatively large volumes of bonds that will mature in the coming years.
In line with the projections in this Report, banks’ losses on CRE exposures are expected to be low ahead. However, the experience of Norway and other countries has been that losses in this sector can be substantial in sharp downturns.
Increase in margin calls in financial energy trading markets
Recently, the rise in energy prices has posed major challenges for power producers and other participants in the financial energy market in the Nordic region. Financial derivatives are cleared by central counterparties, and market participants are required to post margins, often in the form of deposits, as security for obligations upon final settlement. The sharp rise in energy prices has led to high margin calls. In such situations, one market participant’s liquidity problems may spill over to the financial system. To prevent solvent power producers from defaulting on such contracts due to liquidity problems, the Swedish and Finnish governments have established guarantee schemes for loans to power producers. These measures are helping to promote financial stability across the Nordic region. Norwegian authorities are closely monitoring the situation, and so far, there has been no need for Norwegian measures.9
CRE sector vulnerabilities
Banks’ high CRE exposures and low yields are key financial system vulnerabilities (see discussion in Financial Stability Report 2021). Within the CRE market, the office segment is especially important for financial stability since banks’ exposure to this segment is substantial. A relatively large share of the stock of office buildings is in Oslo, and selling prices for prime office space in Oslo are an important indicator of CRE sector vulnerabilities.
2 Period: 2016 Q1 – 2025 Q4. Projections from 2022 Q2 for MPR 2/22 and 2022 Q3 for MPR 3/22. Non-financial corporations in mainland Norway.
3 Period: 1980 Q1 – 2025 Q4. Projections from 2022 Q3. Debt-to-income ratio is debt as a percentage of disposable income. Disposable income is income after taxes and interest payments. Debt service ratio is interest and estimated principal payments as a percentage of after-tax income. Interest burden is interest payments as a percentage of after-tax income.
4 Debt burden is defined here as the ratio of interest-bearing debt less cash and cash equivalents to ordinary profit before tax.
5 Period: January 2016 – December 2022. Projections from September 2022.
6 Period: January 2014 – August 2022. Flats data are from the database ECON Nye Boliger and only include projects with more than 15 units. The statistics have been transformed from bi-monthy to monthly frequencies with the same distribution. Data on detached and semi-detached homes are from the Norwegian Homebuilders’ Association.
7 Period: 2016 Q1 – 2025 Q4. Projections from 2022 Q2 for MPR 2/22 and 2022 Q3 for MPR 3/22.
8 Period: 2007 Q1 – 2025 Q4. Projections from 2022 Q2 for MPR 2/22 and 2022 Q3 for MPR 3/22. Prime office space in Oslo.
5.3 Banks
Norwegian banks are profitable, and their current profitability is their first line of defence against higher losses. Return on equity for the large Norwegian banks was 12% in 2022 Q2 and is in line with pre-pandemic levels. Higher net interest income boosted profitability, while weaker developments in other operating income had a dampening effect.
Credit losses as a share of gross lending for all Norwegian banks were close to zero in Q2. Banks have reversed earlier impairment losses, reflecting more favourable economic developments than expected by banks. Cumulative impairment losses on banks’ balance sheets are close to pre-pandemic levels, indicating a limited scope for further reversals among large banks. In addition, losses on loans to customers with weak debt-servicing capacity will likely increase somewhat owing to higher interest rates and high inflation. Overall, credit losses are expected to normalise ahead.
Norwegian banks are solvent. Large banks already satisfy the capital requirements effective from the end of March 2023, including a countercyclical capital buffer rate of 2.5% (Chart 5.8), and together with solid profitability, banks are well equipped to absorb higher losses. The Common Equity Tier 1 (CET1) capital ratio for the seven large banks in the aggregate rose by 0.1 percentage point in Q2, after falling by 0.8 percentage point in Q1. The EU banking package entered into force in Norway on 1 June 2022 and included amendments that reduce banks’ capital requirements for lending to small and medium-sized enterprises. The reduction in the capital requirements for such lending is estimated by Finanstilsynet (Financial Supervisory Authority of Norway) to raise CET1 capital ratios for Norwegian banks in the aggregate by between 0.3 and 0.5 percentage point.
Chart 5.8 Banks are well equipped to meet the approved buffer requirements10
Percent. At 2022 Q2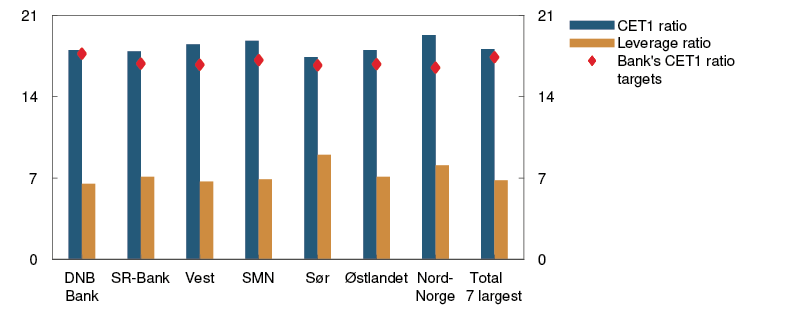
Sources: Banking groups’ quarterly reports and Norges Bank
Norwegian banks have ample access to wholesale funding. The risk premiums on new senior bonds and covered bonds have continued to rise a little since the June Report (Chart 5.1). Banks meet the requirements for liquidity reserves and long-term funding by ample margins and are well equipped to weather financial market stress.
10 Largest Norwegian-owned banking groups. Total seven largest banks is a weighted average of the seven banks shown in the chart. Capital targets are defined here as regulatory requirements at 31 March 2023 with the addition of a capital margin requirement.
Annex
Detailed tables of projections
Table 1 International projections
|
Change from projections in Monetary Policy Report 2/22 in brackets |
Weights1 Percent |
Percentage change from previous year |
||||
|
2021 |
2022 |
2023 |
2024 |
2025 |
||
|
GDP |
||||||
|
US |
9 |
5.7 (0) |
1.7 (-0.6) |
1.2 (-0.6) |
1.7 (0.1) |
1.9 (0.2) |
|
Euro area |
35 |
5.2 (-0.1) |
3.2 (0.5) |
0.2 (-1.9) |
1.5 (-0.2) |
2.1 (0.7) |
|
UK |
11 |
7.4 (0) |
3.4 (-0.2) |
0.4 (-0.5) |
1.1 (-0.1) |
1.7 (0.3) |
|
Sweden |
13 |
4.8 (-0.1) |
2.8 (0.9) |
0.5 (-1.2) |
1.8 (0.1) |
1.8 (0.1) |
|
China |
7 |
8.1 (0) |
2.6 (-0.8) |
5 (-0.1) |
4.8 (-0.2) |
4.5 (-0.4) |
|
13 trading partners1 |
100 |
5.8 (0) |
3.1 (0.1) |
1.1 (-1.1) |
2 (-0.1) |
2.3 (0.3) |
|
5 trading partners2 |
5.9 (-0.1) |
2.9 (0.1) |
1 (-1.2) |
1.9 (-0.1) |
2.3 (0.4) |
|
|
Prices |
||||||
|
Underlying inflation3 |
2 (0) |
4.6 (0.3) |
3.6 (0.6) |
2.2 (-0.1) |
2.1 (0.1) |
|
|
Wage growth4 |
4 (0) |
4.3 (0.1) |
4.2 (0.2) |
3.5 (0.1) |
2.8 (0) |
|
|
Prices for consumer goods imported to Norway5 |
2 (0) |
7.6 (0.8) |
3.2 (0.9) |
1.2 (0.5) |
0.8 (0) |
|
1 The aggregate includes: Euro area, China, UK, Sweden, US, Brazil, Denmark, India, Poland, South Korea, Singapore, Thailand and Turkey. Export weights.
2 The aggregate includes: China, euro area, Sweden, UK and US. Export weights.
3 The aggregate for underlying inflation includes: Euro area, Sweden, UK and US. Import weights.
4 Projections for compensation per employee in the total economy. The aggregate includes: Euro area, Sweden, UK and US. Import weights.
5 In foreign currency terms. Including composition effects.
Sources: IMF, Refinitiv Datastream and Norges Bank
Table 2a Consumer prices. Twelve-month change. Percent
|
2022 |
|||||||
|
Jun |
Jul |
Aug |
Sep |
Oct |
Nov |
Dec |
|
|
Consumer price index (CPI) |
|||||||
|
Actual |
6.3 |
6.8 |
6.5 |
||||
|
Projections MPR 2/22 |
5.6 |
5.1 |
5.4 |
4.6 |
|||
|
Projections MPR 3/22 |
6.0 |
5.8 |
5.4 |
5.1 |
|||
|
CPI-ATE |
|||||||
|
Actual |
3.6 |
4.5 |
4.7 |
||||
|
Projections MPR 2/22 |
3.4 |
3.2 |
4.2 |
3.9 |
|||
|
Projections MPR 3/22 |
5.0 |
5.0 |
5.0 |
4.9 |
|||
|
Imported consumer goods in the CPI-ATE |
|||||||
|
Actual |
3.8 |
4.5 |
4.7 |
||||
|
Projections MPR 2/22 |
4.0 |
3.7 |
4.9 |
3.4 |
|||
|
Projections MPR 3/22 |
4.9 |
4.9 |
5.3 |
4.8 |
|||
|
Domestically produced goods and services in the CPI-ATE |
|||||||
|
Actual |
3.6 |
4.6 |
4.7 |
||||
|
Projections MPR 2/22 |
3.2 |
2.9 |
3.8 |
4.2 |
|||
|
Projections MPR 3/22 |
5.0 |
5.0 |
4.9 |
4.9 |
|||
Sources: Statistics Norway and Norges Bank
Table 2b House prices. Monthly change. Seasonally adjusted. Percent
|
2022 |
|||||||
|
Jun |
Jul |
Aug |
Sep |
Oct |
Nov |
Dec |
|
|
Actual |
0.2 |
-0.1 |
0.6 |
||||
|
Projections MPR 2/22 |
0.2 |
-0.2 |
-0.2 |
-0.2 |
|||
|
Projections MPR 3/22 |
-0.3 |
-0.5 |
-0.5 |
-0.5 |
|||
Sources: Eiendomsverdi. Finn.no. Real Estate Norway and Norges Bank
Table 2d GDP for mainland Norway. Monthly change. Seasonally adjusted. Percent
|
2022 |
|||||||
|
Jun |
Jul |
Aug |
Sep |
Oct |
Nov |
Dec |
|
|
Actual |
0.3 |
-0.3 |
|||||
|
Projections MPR 2/22 |
0.5 |
0.2 |
0.2 |
0.1 |
|||
|
Projections MPR 3/22 |
0.3 |
-0.5 |
0.1 |
0.1 |
0.1 |
||
Sources: Statistics Norway and Norges Bank
Table 2c Registered unemployment (rate). Percent of labour force. Seasonally adjusted
|
2022 |
|||||||
|
Jun |
Jul |
Aug |
Sep |
Oct |
Nov |
Dec |
|
|
Actual |
1.7 |
1.6 |
1.6 |
||||
|
Projections MPR 2/22 |
1.7 |
1.7 |
1.6 |
1.6 |
|||
|
Projections MPR 3/22 |
1.7 |
1.7 |
1.7 |
1.8 |
|||
Sources: Norwegian Labour and Welfare Administration (NAV) and Norges Bank
Table 2e GDP for mainland Norway. Quarterly change. Seasonally adjusted. Percent
|
2022 |
|||||||
|
Q1 |
Q2 |
Q3 |
Q4 |
||||
|
Actual |
-0.4 |
0.7 |
|||||
|
Projections MPR 2/22 |
1.0 |
0.8 |
0.2 |
||||
|
Projections MPR 3/22 |
-0.1 |
0.0 |
|||||
Sources: Statistics Norway and Norges Bank
Table 3 Projections for main economic aggregates
|
Change from projections in Monetary Policy Report 2/22 in brackets |
Percentage change from previous year (unless otherwise stated) |
|||||
|
In billions of NOK 2021 |
Projections |
|||||
|
2021 |
2022 |
2023 |
2024 |
2025 |
||
|
Prices and wages |
||||||
|
CPI |
3.5 |
5.4 (0.8) |
4.5 (0.9) |
3.1 (0.6) |
2.5 (-0.2) |
|
|
CPI-ATE |
1.7 |
3.7 (0.5) |
4.8 (1.5) |
3.5 (0.5) |
2.6 (-0.2) |
|
|
Annual wages |
3.5 |
4.0 (0.1) |
4.6 (0.1) |
4.5 (0.1) |
4.2 (0.0) |
|
|
Real economy1 |
||||||
|
Gross domestic product (GDP) |
4129 |
4 |
2.2 (-0.3) |
0.8 (-0.8) |
0.8 (-0.3) |
0.3 (0.1) |
|
GDP, mainland Norway |
3259 |
4.2 |
2.8 (-0.7) |
-0.3 (-1.4) |
0.4 (-0.5) |
1.1 (0.1) |
|
Output gap, mainland Norway (level) |
-0.4 |
1.7 (-0.3) |
0.2 (-1.2) |
-0.5 (-1.3) |
-0.4 (-1.0) |
|
|
Employment, persons, QNA |
1.2 |
3.5 (0.2) |
-0.4 (-0.9) |
-0.1 (-0.3) |
0.5 (0.3) |
|
|
Registered unemployment (rate, level) |
3.1 |
1.8 (0.0) |
2.0 (0.2) |
2.3 (0.3) |
2.3 (0.2) |
|
|
Demand1 |
||||||
|
Mainland demand |
3363 |
3.3 |
3.3 (-1.1) |
0.2 (-0.6) |
1.3 (-0.1) |
2.0 (0.3) |
|
– Household consumption |
1616 |
4.6 |
5.8 (-0.7) |
-1.1 (-2.4) |
0.3 (-0.5) |
1.9 (0.4) |
|
– Business investment |
353 |
2.2 |
5.4 (-2.4) |
3.5 (-0.1) |
3.9 (-0.4) |
3.8 (-0.5) |
|
– Housing investment |
206 |
0.6 |
0.0 (-1.8) |
1.0 (-1.4) |
1.4 (-0.1) |
2.1 (0.1) |
|
– Public demand |
1187 |
2.3 |
-0.1 (-0.9) |
0.9 (2.1) |
1.8 (0.5) |
1.5 (0.2) |
|
Petroleum investment |
179 |
-2.7 |
-6.0 (2.0) |
4.0 (-4.0) |
15.0 (0.0) |
2.0 (-2.0) |
|
Mainland exports |
719 |
4.5 |
3.4 (-1.2) |
5.0 (-0.6) |
2.2 (-0.9) |
3.0 (0.8) |
|
Imports |
1212 |
1.8 |
10.7 (3.5) |
3.3 (-0.7) |
3.6 (-0.8) |
1.1 (0.0) |
|
House prices and debt |
||||||
|
House prices |
9.1 |
5.5 (0.0) |
-2.4 (-1.4) |
1.3 (-0.7) |
4.1 (-0.2) |
|
|
Household credit (C2) |
5 |
4.3 (-0.4) |
4.0 (-0.3) |
3.4 (-0.4) |
3.3 (-0.2) |
|
|
Interest rate, exchange rate and oil price |
||||||
|
Policy rate (level) |
0.1 |
1.3 (0.1) |
3.0 (0.1) |
3.0 (-0.1) |
2.7 (-0.1) |
|
|
Import-weighted exchange rate (I-44) (level) |
108.7 |
110.0 (-0.5) |
110.1 (1.1) |
108.1 (0.3) |
106.6 (-0.6) |
|
|
Money market rates, trading partners (level) |
-0.2 |
1.2 (0.1) |
3.5 (0.5) |
3.1 (0.1) |
2.9 (0.0) |
|
|
Oil price, Brent Blend. USD per barrel |
70.7 |
102.0 (-6.0) |
83.6 (-13.3) |
77.8 (-10.2) |
74.0 (-7.9) |
|
|
Household income and saving1 |
||||||
|
Real disposable income excl. dividend income |
0.7 |
0.5 (-1.5) |
-2.0 (-1.1) |
1.4 (-0.5) |
3.2 (0.9) |
|
|
Saving ratio excl. dividend income (rate, level) |
6.9 |
1.8 (-0.8) |
0.9 (0.2) |
1.9 (0.1) |
3.0 (0.5) |
|
|
Fiscal policy |
||||||
|
Structural non-oil deficit as a percentage of GPFG2 |
3.2 |
3.1 (0.2) |
2.6 (0.3) |
2.4 (0.1) |
2.5 (0.2) |
|
|
Structural non-oil deficit as a percentage of trend GDP |
10.8 |
11.1 (0.8) |
9.4 (1.3) |
9.0 (0.8) |
9.4 (1.1) |
|
1 All figures are working-day adjusted.
2 Government Pension Fund Global measured at the beginning of the year.
Sources: Eiendomsverdi, Finn.no, Ministry of Finance, Norwegian Labour and Welfare Administration (NAV), Real Estate Norway, Refinitiv Datastream, Statistics Norway and Norges Bank