Financial stability outlook
The Norwegian financial system has weathered the pandemic well. The gradual reopening of society, along with government support measures, has helped keep bank losses low. Financial system vulnerabilities in Norway persist, but have been met by measures to increase resilience. At the same time, the risk of shocks, particularly from abroad, represents a threat to financial stability. Uncertainty regarding the further evolution of the pandemic has diminished since Financial Stability Report 2020, but banks are resilient and have ample capacity to absorb losses.
The recovery is contributing to financial stability
The pandemic resulted in a less pronounced economic downturn and lower bank losses than widely feared last year. Extensive government support measures, good welfare arrangements and an expansionary monetary and fiscal policy have dampened the economic impact of the pandemic. Nevertheless, some households and firms have been hit hard. Bank losses have been limited, thanks to both the support measures and banks’ low exposures to the hardest-hit industries. A resilient banking sector has been crucial for maintaining a well-functioning financial system, and a lower countercyclical capital buffer rate gave banks greater space to extend credit through a period of considerable uncertainty. Norges Bank’s extraordinary liquidity measures and foreign exchange market interventions helped dampen the turbulence so that financial markets functioned better. The measures also eased bank funding and countered an undesirable credit tightening, which could have amplified the downturn. Against the background of the recovery over the past year, Norges Bank now assesses the overall financial stability outlook as little changed since before the pandemic hit.
The reopening of society has resulted in a marked upswing in the Norwegian economy, and activity is now higher than before the pandemic. A gradual rise in Norges Bank’s policy rate has begun, and increases in the countercyclical capital buffer have been announced. The extraordinary liquidity measures were unwound on the back of an improvement in the functioning of money and credit markets. The last extraordinary loan to banks matured in August 2021. Fiscal policy measures are also being phased out as the economy normalises.
Risk of shocks
Uncertainty about the future evolution of the pandemic is lower than at the time of the 2020 Report. Even so, a resurgence of the pandemic may dampen the economic upturn, weaken business profitability and push up bank losses.
During the years prior to the pandemic, global interest rates were historically low. The pandemic resulted in even more expansionary monetary policy, and extensive fiscal policy measures were introduced. This has supported the economic recovery, but has also reduced many countries’ fiscal and monetary policy space. Persistently low interest rates abroad can also induce market participants to assume greater risk. Global vulnerabilities have built up in the form of increased debt and higher asset prices. Policy rate expectations and long-term interest rates have risen markedly through autum. Expectations of higher inflation and possible monetary tightening globally have likely pushed up market interest rates. Higher interest rates could restrain debt accumulation and asset inflation. This may reduce the build-up of vulnerabilities. A sudden rise in interest rates and risk premiums can lead to stress in the Norwegian financial system, owing to its close interconnectedness with the global economy and financial markets. This interconnectedness came into evidence during the market turbulence at the beginning of the pandemic.
Financial system vulnerabilities persist, but have been met with measures
Financial system vulnerabilities in Norway can lead to shocks having more serious consequences for financial stability. Overall vulnerabilities are assessed as being broadly at the same level as prior to the pandemic.
High household debt has long been the main financial system vulnerability in Norway. Leverage is high both historically and compared with other countries. High debt makes households vulnerable to a loss of income, higher lending rates and a fall in house prices. The risk that many households tighten consumption at the same time constitutes a threat to financial stability. Banks’ high commercial real estate exposures are also a vulnerability that can lead to substantial credit losses if commercial property prices fall, as shown by the stress test in this Report. In addition, banks’ interconnectedness, partly owing to their cross-exposures, can propagate and amplify shocks.
Credit and property and financial asset prices have often shown a pronounced rise ahead of financial crises. Residential and commercial property prices fell during the first phase of the pandemic, but have since risen sharply, as have financial asset prices. Low interest rates over a long period have driven down yields, and risk premiums are now at very low levels. Unexpected events can therefore result in considerable corrections in asset prices. Property price inflation has recently been more moderate. Credit growth picked up somewhat through the pandemic, but has recently levelled off.
Regulations, such as requirements for banks’ capital, liquidity and credit standards, increase bank resilience and reduce vulnerabilities. This helps dampen the impact of shocks and downturns.
In autumn, Norges Bank was given decision-making responsibility for the countercyclical capital buffer and formal advisory responsibility for the systemic risk buffer. These two buffer requirements constitute a significant part of banks’ total capital requirements. The Committee decides on the countercyclical capital buffer rate each quarter and is to advise on the systemic risk buffer at least every other year, for the first time in 2022. In line with Norges Bank’s new areas of responsibility, the Committee will prepare a framework for its advice on the systemic risk buffer in 2022.
Bank resilience has not weakened during the pandemic
The Norwegian banking sector is solvent and well-equipped to withstand shocks. Bank profitability is solid, and banks’ have ample access to funding. Solid underlying profitability has resulted in earnings sufficient to cover the losses incurred during the pandemic, while increasing lending. In addition, restrictions on dividend distribution have compelled banks to retain more earnings than normal during the pandemic. This has increased equity and thus loss-absorbing capacity. Higher interest rates ahead will improve bank profitability. Losses on corporate loans have declined as the economy improved. There are no signs that the business sector has drawn substantially on its financial buffers, and credit losses are expected to remain low. Even so, owing to the uncertainty about the further evolution of the pandemic, loss prospects are somewhat more uncertain than normal.
It is difficult to identify and assess the risk of new shocks, of which the pandemic is an example. The stress test in this Report shows that if the Norwegian economy is hit by a renewed sharp downturn, the capital buffers in the largest Norwegian banks as a whole are sufficient to absorb the losses. The implications for banks’ capital situation depends on which industries are affected. The stress test shows that weak developments in commercial real estate and other sector-specific shocks can induce banks to tighten lending, which can amplify an economic downturn. Banks can dip into their capital buffers to avoid tightening lending. Banks can also use freed-up capital if the countercyclical capital buffer rate is lowered. Analyses show that a number of Norwegian banks will have limited scope to dip into other capital buffers, such as the systemic risk buffer, without breaching the minimum requirement for own funds and eligible liabilities (MREL). This may reduce the effectiveness of the buffers in a crisis. Banks preferring to maintain the flexibility that capital buffers provide can issue enough non-preferred senior bonds so that MREL does not hinder the use of capital buffers. If the buffer requirements are reduced in a sharp downturn, the most binding MREL requirement will be reduced accordingly and the buffers will be able to function as intended.
Liquidity measures and market stress
Extraordinary loans to banks during the market stress in spring 2020 ensured banking sector liquidity and the transmission of the policy rate to money market rates. At the same time, there was an increased need for liquidity by investment funds and other asset managers when the value of their securities fell and the krone depreciated. Fire sales to meet this need amplified the market stress. There is a discussion internationally and in Norway about whether central banks should have instruments that can be aimed directly at securities markets and non-bank market participants in periods of market stress.
Norges Bank’s liquidity policy instruments are aimed directly at banks. Banks create and receive deposits and thus play a key role in payment and credit intermediation. This is the reason they are Norges Bank’s counterparties and receive liquidity support if Norges Bank deems it necessary. Norges Bank’s risk is contained by the fact that banks’ liquidity and credit risk is strictly regulated, loans are extended against collateral and the terms and conditions for support are intended to give banks incentives to use market solutions first.
Instruments aimed directly at securities markets or non-bank market participants may entail a greater risk to the central bank. Asset purchases entail a higher risk than secured lending. Other market participants may face less strict regulation than banks, and their importance for payment and credit intermediation may be less critical. Loans to these counterparties may thus increase the central bank’s risk and can to a lesser extent be justified on the grounds that they are critical to the financial system. Such use of instruments also increases the risk that the central bank contributes to socialisation of potential losses, while the risk taker keeps any gains. This could give rise to excessive risk-taking and market adjustments that are detrimental to long-term financial stability. The central bank should therefore be cautious in resorting to such extraordinary measures. In line with the principle that risk should be borne as much as possible by financial market participants, loans to banks are Norges Bank’s preferred instrument in periods of market stress.
Resilient market participants must always be the first line of defence against market stress. Banks and other financial market participants are responsible for managing their own liquidity risk and cannot rely on support from the central bank. Strict criteria and terms and conditions for central bank measures are meant to help ensure this. Systemic risk connected with derivatives contracts, which played out at the beginning of the pandemic, have prompted a number of asset managers to make changes to their risk management. These changes may make them better positioned in periods of market stress.
The Norwegian financial system is vulnerable to cyber attacks
Cyber attacks are a potential threat to financial stability. Extensive digitalisation and interconnectedness make the financial system vulnerable. Financial institutions report more and increasingly sophisticated attacks. A more aggressive threat landscape is amplifying cyber risk.
The potentially systemic ramifications of cyber attacks entail a need for strengthened regulation and expanded collaboration between various authorities and financial system participants. A number of new regulatory initiatives have been proposed to increase financial sector cyber resilience. In September, Norges Bank’s Executive Board approved the introduction of a framework for testing entities’ capabilities in detecting and responding to cyber attacks (TIBER-NO). TIBER-NO has been prepared in collaboration with Finanstilsynet (Financial Supervisory Authority of Norway). This will help strengthen financial sector cyber resilience and provide additional knowledge about how cyber attacks can impact the financial system.
Identifying key financial and operational dependencies in the financial system known as cyber mapping, is useful for ascertaining how cyber attacks can threaten financial stability. This is also a prerequisite for system-wide monitoring of cyber risks and proper incident management in the event of a cyber attack. In Norway, such cyber mapping work is underway in view of the new Security Act. This work is laying an important foundation for greater understanding of and new measures to address systemic cyber risk in Norway.
Other societal trends have implications for financial stability
The financial system is evolving in pace with technological innovation. Norway is at the technological forefront, and the payment methods we use have undergone extensive changes in recent years. An efficient and secure payment system is essential to financial stability. Norges Bank is studying whether the introduction of a central bank digital currency (CBDC) will promote an efficient and secure payment system and safeguard confidence in the payment system. In the coming two years, Norges Bank will conduct experimental testing of technical solutions.
In recent years, the prevalence and market capitalisation of crypto-assets have increased substantially. Crypto-assets are not considered a threat to financial stability yet, either globally or in Norway, but this can change in the future. A number of international regulatory initiatives can help ensure that developments do not pose a threat to financial stability. Central banks and other authorities should monitor developments and assess whether further regulations are needed that can reduce risks associated with crypto-assets.
Climate change and the climate transition affect all segments of society, also the financial system. The longer one waits to implement measures to make the necessary adaptations, the faster substantial changes will have to be made. Adapting suddenly and quickly may entail a risk to financial stability. The transition to lower greenhouse gas emissions and new regulations entail a transition risk for the Norwegian economy in the coming years, which is amplified by the importance of the oil and gas industry for Norway. Climate risk also relates to the physical consequences of climate change. Banks should ensure that they are well equipped to manage climate risk. The analyses in this Report show that Norwegian banks’ direct exposure to higher prices for greenhouse gas emissions is moderate. For now, Norwegian banks’ exposure to “known” physical climate risks is small, but the ramifications of climate change may be far more extensive than currently assumed.
Within their mandates, central banks and financial supervisory authorities can promote financial stability by ensuring that all risks are backed by sufficient capital and by encouraging the financial sector to include and communicate climate risk in their risk assessments and financial reporting. The ability of banks and other financial institutions to price climate risk correctly is crucial for the ability of borrowers to make good investment decisions. A sound information basis and transparency regarding exposures to climate risk also provide a solid basis for market participants to compare banks. Reporting standards are under development internationally. It is important to continue to develop climate reporting to obtain the most accurate picture of the climate risks facing Norwegian banks.
Øystein Olsen
Ida Wolden Bache
Øystein Børsum
Ingvild Almås
Jeanette Fjære-Lindkjenn
3 November 2021
1 Financial system vulnerabilities and risks
Vulnerabilities in the financial system can have more serious consequences for financial stability in the face of shocks. The uncertainty surrounding the pandemic has abated, but high global risk appetite has driven up asset prices. The most important structural vulnerabilities in the Norwegian financial system are high household debt, high bank exposures to commercial real estate and the close interconnectedness of banks. Overall cyclical vulnerabilities are at pre-pandemic levels, but clearly lower than in the years preceding the financial crisis. House prices in particular have risen through the pandemic, and low yields have resulted in higher prices for commercial property and financial assets. Measures such as requirements for bank capital, liquidity and credit standards have addressed these vulnerabilities, increasing the resilience of the financial system.
1.1 Risk of shocks
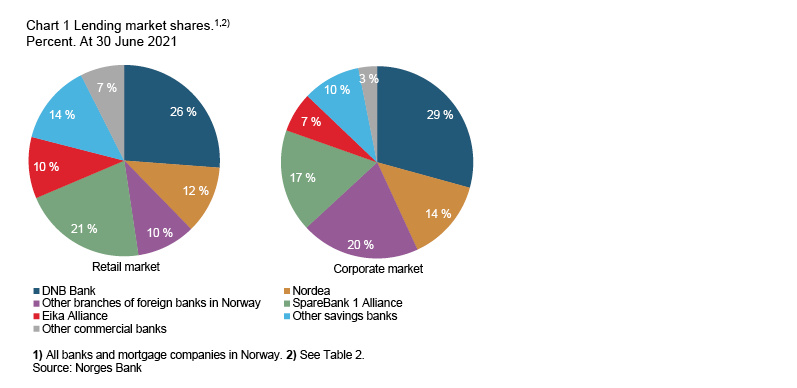
Shocks that can threaten financial stability can come from different parts of the economy and financial markets. Such shocks may be difficult to foresee. Shocks often spread to Norway from abroad since the financial system largely operates across borders. Cross-border integration is particularly close in securities markets. Large Norwegian banks obtain substantial funding abroad, and foreign banks account for over a quarter of loans in Norway. This integration provides opportunities for diversification of risk, but also enables contagion from global turbulence and uncertainty to the Norwegian financial system.
The Covid pandemic is an example of a shock that was difficult to foresee, but that had considerable consequences for the real economy and immediately led to substantial financial market stress. Extensive government measures stabilised markets quickly and later limited the pandemic’s impact on banks and their customers. This helped banks to weather the pandemic well. There has been little turbulence in global financial markets this past year, and the Norwegian economy has recovered. Uncertainty about the pandemic is lower than at the time of Financial Stability Report 2020.
High global risk appetite
Prior to the pandemic, global financial markets were characterised by low yields and high risk appetite. This pushed down risk premiums and pushed up prices for assets, such as property and equities. The pandemic triggered a sharp downturn and heightened fears about the future, which partly reversed these trends. Extensive government measures, including an expansionary monetary policy, eased financial conditions. Considerable progress in fighting the pandemic has also contributed to the economic recovery.
Risk appetite is high again. According to the International Monetary Fund’s (IMF) aggregate index, financial conditions in most advanced economies are now as they were prior to the pandemic (Chart 1.1). In the US, similar financial conditions have not been seen since before the financial crisis. Developments especially reflect lower interest rates, higher equity prices and higher house prices. High merger and acquisition activity, a growing number of initial public offerings and increased high-yield debt issuance also indicate high risk appetite.
Chart 1.1 Greater stimulus from financial conditions over the past year1 IMF’s aggregate financial condition index. Standard deviation from the mean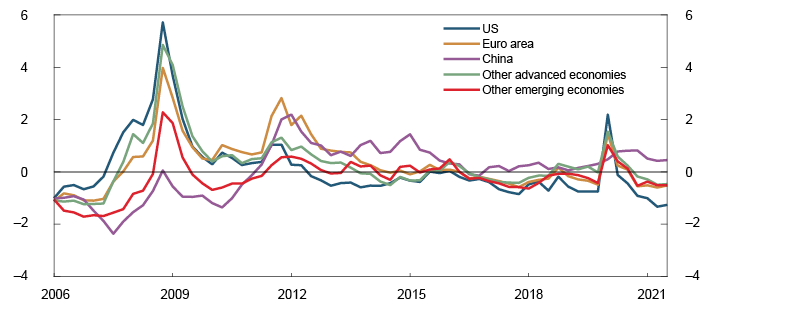
This autumn, global equity prices have varied more, and long-term interest rates have edged up. At the same time, global economic growth has slowed somewhat, and the outlook is more uncertain. This may reflect bottlenecks in global and domestic distribution chains on the back of the rapid recovery after the pandemic. The bottlenecks and higher energy prices have pushed up inflation. Policy rate expectations have risen in a number of countries, and some central banks have raised their policy rates. This may be favourable for financial stability in that it restrains debt accumulation and the rise in asset prices.
Sudden shifts in inflation or interest rate expectations can reduce risk appetite substantially and lead to higher riskpremiums and repricing in global financial markets, with a related decline in asset prices and higher financing costs and contagion to the Norwegian financial system.
High indebtedness increases the risk of financial stability in the event of a sudden and pronounced tightening of financial conditions. Global non-financial sector debt now accounts for around 250% of GDP, up from around 180% prior to the financial crisis in 2008. This means that vulnerabilities to an interest rate increase are historically high. Both public and private debt-to-GDP ratios have risen sharply through the pandemic. Some of this reflects the fall in GDP. In the private sector, the increase in debt is strongest for non-financial corporates, where debt-to-GDP ratios are also clearly higher than prior to the financial crisis (Chart 1.2). However, advanced economies’ total household debt is lower than it was prior to the global financial crisis.
Chart 1.2 Corporate debt has risen in many countries2 Non-financial corporate debt as a share of GDP. Percent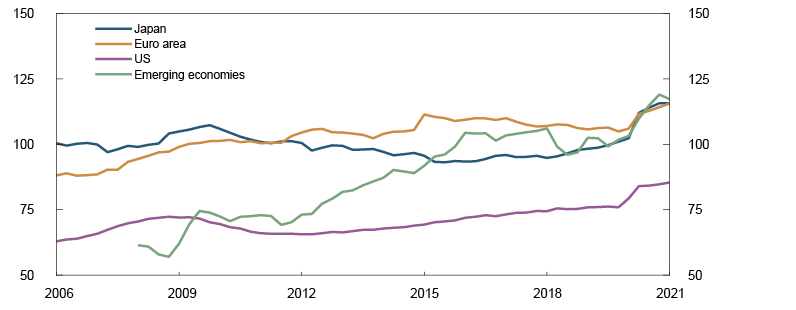
Growing complexity due to more market-based financing and increasing role of non-banks
Globally, firms’ market-based financing has increased over the past 10 years, and this continued during the pandemic. The market share of non-bank financial institutions has increased. Globally, there is now more capital under management by such entities than by banks (Chart 1.3). Growth in various types of investment funds has been particularly strong.
Chart 1.3 Banks losing market share globally3 Composition of the global financial sector. Capital under management in trillions of USD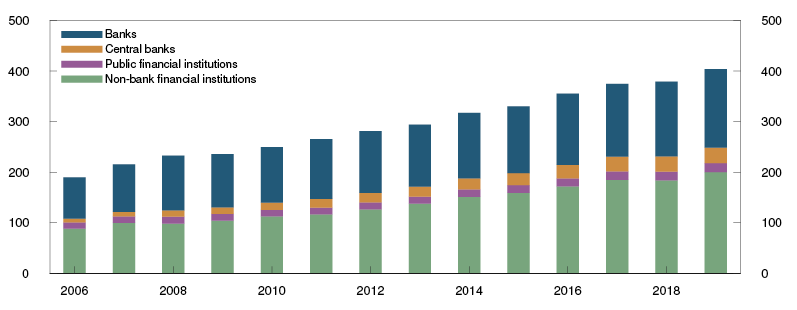
Increased market financing and a greater role for non-banks provide better opportunities for spreading risk between the banking sector and other financial system participants. This may reduce concentration risk but at the same time expose the system to other risks and new contagion channels in the event of market stress. The financial system may become more complex, which can result in other kinds of financial crises that call for different sorts of measures than previously.
Following the financial crisis in 2008, bank liquidity and solvency were strengthened owing to new international regulation. This made the banking sector more resilient to shocks and helped ensure that it largely functioned well during the pandemic. Stricter banking regulation also contributed to migration of risk to the less heavily regulated non-bank sector, likely for profitability reasons. The turbulence in spring 2020 revealed weaknesses in this portion of the global financial system. Therefore, an extensive worldwide effort is now underway to increase resilience in the non-bank sector.4
In Norway, the market turbulence in spring 2020 presented challenges to investment managers and also spread further to other parts of the financial system. Large movements in prices for financial assets and the sharp krone depreciation led to high margin calls for Norwegian asset managers.5 This subjected many managers to liquidity squeezes and also adversely affected other participants by pushing up bond market risk premiums. A number of Norwegian asset managers have made changes to their risk management, including greater use of repurchase agreements and increased collateral eligibility of bonds. These changes may make them better positioned in the event of renewed market stress and mitigate the risk of shocks spreading to the rest of the financial system.
1 Period: 2006 Q1 – 2021 Q3.
2 Period: 2006 Q1 – 2021 Q1. Data for emerging economies from 2008 Q1.
3 Period: 2006 – 2019. Non-bank financial institutions includes eg pension and insurance vehicles and various funds.
4 This is primarily under the auspices of the Financial Stability Board (FSB) (see FSB (2021) “Lessons Learnt from the COVID-19 Pandemic from a Financial Stability Perspective. Final Report”. October 2021.
5 See Financial Stability Report 2020, page 20 and Alstadheim, R., K.B. Nordal, O. Syrstad, S. Ter Ellen and M.-I. Walstad Wassås (2021) ”Bond market fire sales and turbulence in the Norwegian FX market in March 2020”. Staff Memo 2/2021. Norges Bank.
1.2 Structural vulnerabilities in the Norwegian financial system
Owing to vulnerabilities in the Norwegian financial system, negative shocks can have more severe consequences for financial stability. In the assessment of vulnerabilities, we distinguish between cyclical vulnerabilities, which typically vary over time (see Section 1.3), and vulnerabilities of a more structural nature (see "Financial system vulnerabilities in Norway and measures implemented"). The main structural vulnerabilities are high household debt, banks’ large commercial real estate exposures and bank interconnectedness. Extensive digitalisation also entails a vulnerability to cyber attacks (see Section 1.4).
A number of measures have addressed structural vulnerabilities. Several of these measures affect banks’ total capital requirements, such as requirements for the systemic risk buffer, risk-weighting and the leverage ratio, and a minimum requirement for own funds and eligible liabilities (MREL). There are also requirements for banks’ liquidity and credit standards. The level of the systemic risk buffer was raised from 3% to 4.5% with effect from end-2020.6 Norges Bank supported the increase in the buffer level.7 This autumn, Norges Bank was given formal advisory responsibility for the systemic risk buffer and will develop a framework for providing advice on the buffer rate in 2022.
Financial system vulnerabilities in Norway and measures implemented
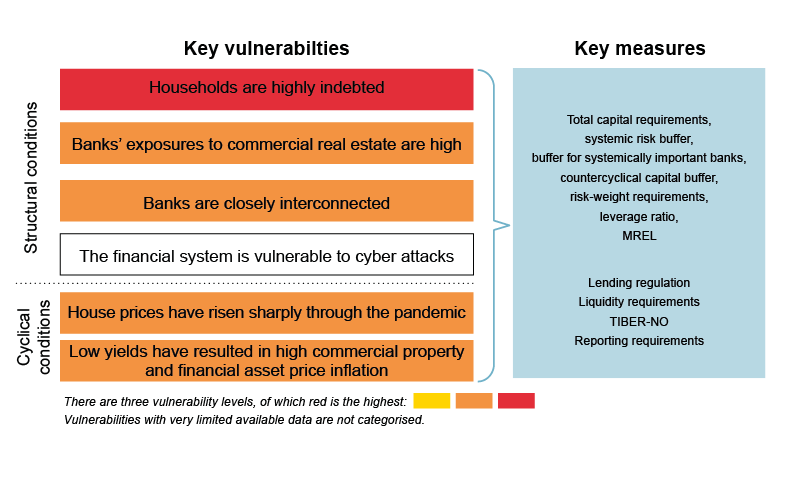
Vulnerabilities are identified to assess whether sufficient measures have been implemented. Since the financial crisis in 2008, the Norwegian authorities have introduced a number of rules to mitigate vulnerabilities and increase financial system resilience (see diagram above). For more detailed information about the measures, see "Important measures to mitigate financial system vulnerabilities in Norway".
The measures primarily help to increase financial system resilience, but can also mitigate vulnerabilities. Many of the measures contribute generally to increased resilience, and measures are often justified on the basis of a number of vulnerabilities, both those mentioned in the diagram and other financial system vulnerabilities. The countercyclical capital buffer is the only measure purely justified on the basis of cyclical vulnerabilities. High bank profitability and a robust bank funding structure also strengthen resilience (see Section 2).
Vulnerabilities will still exist even after a large number of measures are introduced. However, systemic risk is assessed after taking into account these measures and the resilience of the financial system and the wider economy. If necessary, Norges Bank will implement or advise the adoption of measures.
Households are highly indebted
High household debt has long been the main structural vulnerability in the Norwegian financial system. Household leverage is high both historically and compared with other countries. High household debt in Norway partly reflects elevated house prices and a large proportion of home ownership. High indebtedness makes households vulnerable to a loss of income, a rise in lending rates or a fall in house prices. The risk that many households tighten consumption at the same time represents a threat to financial stability. Such a tightening may amplify an economic downturn. This can reduce firms’ earnings and debt-servicing capacity, leading to increased losses on banks’ corporate exposures.
In recent years, debt growth has slowed somewhat but continues to rise a little faster than income, pushing up household leverage (Chart 1.4). Owing to low interest rates, households’ interest burden, ie the share of income spent on interest payments on loans, is low from a historical perspective, despite high household leverage. This is because nearly all debt is floating rate. Overall debt service ratios, which include both interest and estimated principal, are high and are expected to rise from 14.0% in 2021 Q2 to 15.3% at end-2024, primarily owing to higher lending rates (see Monetary Policy Report 3/21).
Chart 1.4 Household leverage is high and edging higher8 Percent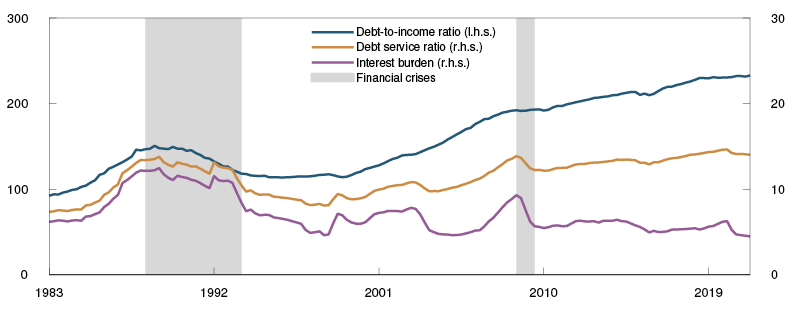
Data from pre-completed tax returns9 for 2020 make it possible to see the breakdown of debt across different groups and show that debt-to-(gross) income ratios increased for all age groups in 2020 (Chart 1.5). This reflects sustained debt growth through the pandemic, while income growth slowed. Among younger groups, average debt-to-income ratios fell in 2019, largely owing to relatively high income growth, though debt ratios picked up again in 2020.
Chart 1.5 Higher leverage in all age groups in 2020 Debt as a share of gross income. Percent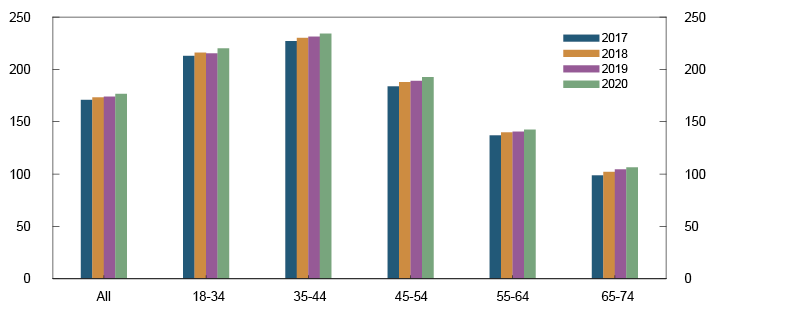
Even though household debt is rising somewhat faster than income, wealth has increased owing to high house price inflation and high household saving through the pandemic. Increased saving reflects limited consumption opportunities and greater uncertainty about the future. Much of the increased saving took the form of bank deposits, which are liquid and stable assets. Data from pre-completed tax returns show that the increase in bank deposits has been broad-based in the population.10 Both those with high and with low debt-to-income ratios increased their bank deposits substantially in 2020. The data also show that household financial assets excluding bank deposits increased in all age groups in 2020.
Unsecured debt, such as consumer credit, grew sharply over many years and accounts for around 3% of household debt. After the introduction of the consumer credit regulation in 2019 and the establishment of credit registers, the volume of consumer credit fell. The fall continued through the pandemic (Chart 1.6). There are substantially fewer borrowers with very high consumer debt than previously.
Chart 1.6 Consumer debt is falling11 Unsecured interest-bearing debt with an interest rate above 8 percent. In billions of NOK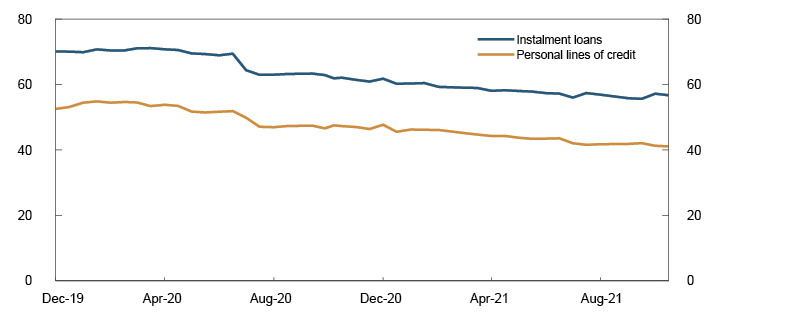
Measures by the authorities to limit borrowing, such as regulation of banks’ credit standards, have contributed to more moderate growth in total household debt since 2017. Requirements for banks’ credit standards limit in particular excessive borrowing by vulnerable households. The requirements are in force until 2024, but are to be evaluated in 2022. Moreover, banks’ requirement to hold a systemic risk buffer is warranted in part by the high level of household debt.
Older persons account for a growing share of the population. The pension reform has given people greater responsibility for their own pensions and how their pensions will be drawn. Life expectancy has also risen, which means having to stay on at work longer to receive the same pension as before. Individuals are also more exposed to return risk on their pension assets. Many older persons may experience a substantial fall in income after the transition from wage income to a pension in the years ahead. Combined with rising leverage, this can make older persons more vulnerable to higher interest rates or a fall in house prices, for example, or if they cannot remain at work as long as they like.12 Our assessment is that these trends overall do not represent a material threat to the financial system. Among other reasons, this is because older persons generally have solid finances and the most at-risk groups hold a relatively small share of household debt. Moreover, the financial sector and future pensioners have time to adjust to the changes.
Banks’ exposures to commercial real estate are high
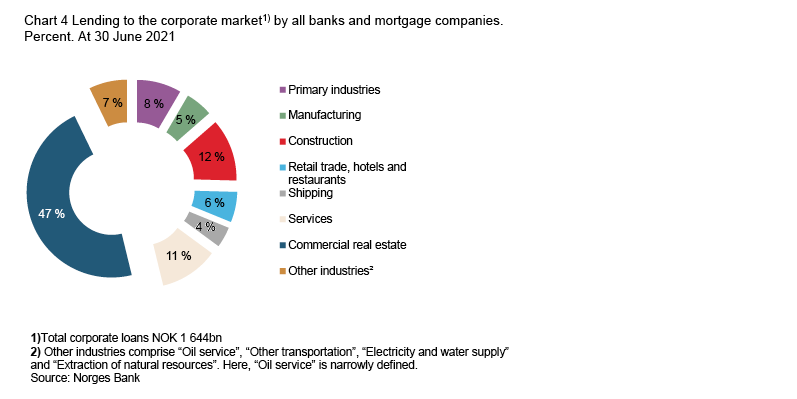
Another key structural vulnerability is banks’ high commercial real estate exposures, which reflect in part high commercial property prices. CRE exposures account for around half of total corporate lending (Annex Chart 4), and all large banks’ CRE exposures are high. Experience from Norway and other countries shows that losses in this sector can be substantial in sharp downturns.
CRE firms are more leveraged than other firms, making them vulnerable to interest rate increases or a fall in rental income. A majority of the banks in Norges Bank’s lending survey reported that the ordinary maturity of new commercial property mortgages over the past six months was under five years, little changed compared with prior to the pandemic. Short maturities expose CRE firms to refinancing risk. Rapid price rises in recent years (Chart 1.11) have not been matched by corresponding borrowing by CRE firms. This has boosted these firms’ equity ratios, making them better equipped for a price fall. In the lending survey, most banks report ordinary loan-to-value (LTV) ratios of between 60% and 80%. LTV ratios are little changed from pre-pandemic levels.
CRE firms’ income is assured in the short term by existing leases, as long as the tenants are able to pay rent. In the event of higher commercial property vacancy rates and a fall in rental prices, CRE firms’ income may gradually weaken as existing leases expire. In that case, loan defaults may increase, and banks may incur losses if the properties’ mortgage value is lower than the value of the loans. A marked fall in commercial property prices in a stress situation can lead to substantial bank losses, as shown in the stress test in Section 3. The level of the systemic risk buffer is warranted in part by banks’ substantial CRE exposures. In addition, minimum requirements for risk weights on CRE exposures have been introduced.
Banks are closely interconnected
Banks are directly interconnected through interbank exposures and indirectly through common or similar securities portfolios among other things. Close interconnectedness represents a key financial system vulnerability because shocks spread more easily. Nevertheless, a high level of interbank cooperation in the fixed income market is crucial for ensuring the distribution of liquidity and the effective transmission of monetary policy.
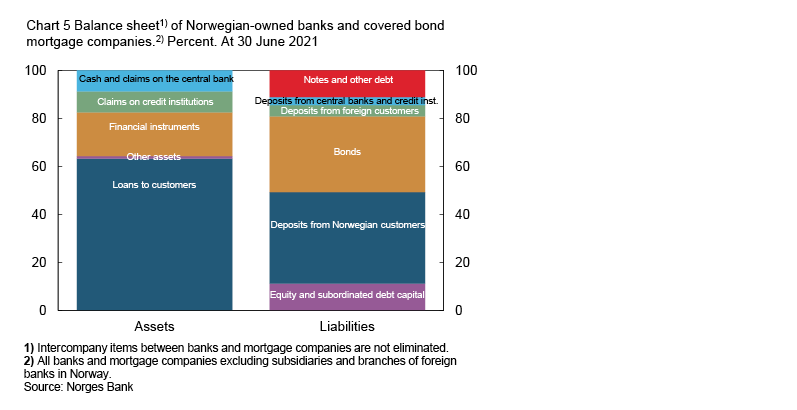
Bank interconnectedness through the covered bond market represents a particular vulnerability. Covered bonds account for two-thirds of banks’ wholesale funding, while banks own approximately 60% of covered bonds issued in NOK (Charts 1.7 and 1.8), which means they act both as issuers and investors in this market. Banks mainly hold covered bonds as part of their liquidity portfolios (see Section 2). The high ownership share reflects the view that covered bonds are safe securities that are used to satisfy liquidity requirements and as collateral for loans from Norges Bank. Banks’ share of covered bond holdings rose after the Liquidity Coverage Ratio (LCR) was introduced in 2014.
Chart 1.7 Banks’ covered bond funding is substantial13 Breakdown of bond funding outstanding. Percent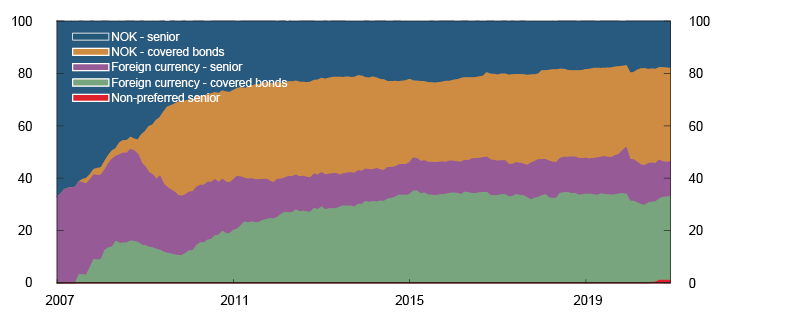
Chart 1.8 Banks’ hold the majority of covered bonds in NOK14 Ownership breakdown of bonds issued by Norwegian mortgage companies in NOK. Percent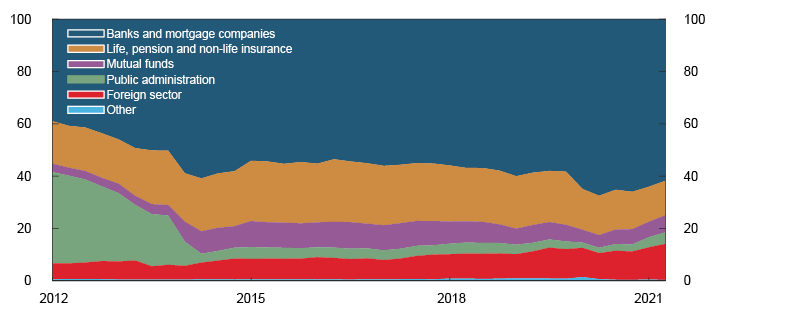
The purpose of the liquidity portfolio is to enable banks to sell or pledge securities if they have difficulty obtaining new funding. Simultaneous fire sales of covered bonds by a large number of banks can drive down the prices for these securities and thus the value of the liquidity portfolios. This can aggravate banks’ liquidity situation and make it difficult for them to raise new covered bond funding. A concurrent fall in house prices can further exacerbate funding problems and amplify the sell-off of both covered bonds and other securities banks hold to address liquidity problems.
Earlier analyses have shown that fire sales of securities can result in contagion effects that can lead to losses in the Norwegian banking sector.15 The losses are primarily due to the potential for a bank’s fire sales of securities to drive down prices for both the securities being sold and other similar securities. Other banks holding these securities then need to reduce the carrying amount to the new and lower price. The systemic risk buffer requirement is warranted in part by the ramifications of a closely interconnected financial system.
6 The increase effective from end-2020 applied to IRB banks, but for other banks, the increase applies from end-2022.
7 See Norges Bank’s høringsuttalelse om tilpasninger til kapitalkravene for banker [consultation statement on adjustments to banks’ capital requirements]. 30 September 2019 (in Norwegian only).
8 Period: 1983 Q1 – 2021 Q2. Debt-to-income ratio is loan debt as a percentage of disposable income. Disposable income is income after taxes and interest payments. Debt service ratio is interest and estimated principal payments as a percentage of after-tax income. Interest burden is interest payments as a percentage of after-tax income.
9 Ie the forms individual taxpayers receive for review in April each year.
10 See box on page 60 of Monetary Policy Report 3/21.
11 Period: 1 December 2019 – 16 October 2021.
12 See Reiakvam, L., H. Solheim and B.H. Vatne (2021) “De eldre har i dag en sterk finansiell stilling, men gjeldsgraden øker” [Older persons currently enjoy a strong financial position, but their leverage is increasing]. Blog post published on the Bankplassen blogg, 12 October 2021. Norges Bank (in Norwegian only).
13 Period: January 2007 – December 2020.
14 Period: January 2007 – December 2020.
15 See box on page 45 of Financial Stability Report 2019.
1.3 Cyclical vulnerabilities in the Norwegian financial system
Debt growth and asset price inflation have often been high prior to financial crises and are therefore indicators of cyclical vulnerabilities. Overall, cyclical vulnerabilities are assessed as little changed compared with before the pandemic. A broad set of indicators of cyclical vulnerabilities is now at a medium level from a historical perspective, while the indicators signalled high cyclical vulnerabilities prior to the financial crisis (see "A broad set of indicators indicates medium cyclical vulnerabilities"). The indicators in the analysis include changes in credit, house prices, commercial property prices and equity prices.
Banks should build and hold a countercyclical capital buffer when cyclical vulnerabilities are building up or have built up. In the event of a sharp downturn and markedly reduced access to credit, the countercyclical capital buffer rate can be reduced to increase banks’ lending capacity. In March 2020, the buffer rate was reduced from 2.5% to 1% to prevent tighter bank credit from amplifying the downturn. In June 2021, it was decided to increase the countercyclical capital buffer rate to 1.5% from 30 June 2022. In September, Norges Bank announced that based on its assessment of economic developments and the prospects for bank losses and lending capacity, the buffer rate will be raised to 2.0% in December, effective from 31 December 2022. Norges Bank has further stated that it expects the buffer rate to return to 2.5% somewhat further out.
House prices have risen sharply through the pandemic
High house price inflation over time increases the risk of price falls that can lead to a tightening of household consumption and thus to bank losses. Moreover, a sharp fall in house prices can create shocks to banks’ liquidity and covered bond funding.
After several years of rapid house price inflation, where prices rose faster than household income, house price inflation over the few years prior to the coronavirus outbreak was at a moderate level (Chart 1.9). At the start of the pandemic, house prices fell (Chart 1.10). However, house prices rose markedly through summer 2020, and the rise in prices was high in the period to spring 2021. The rapid rise reflects low residential mortgage rates and homebuyers’ preference for using a greater share of income on housing, among other reasons because remote working has increased and consumption opportunities have otherwise been limited. Growth in household debt accelerated through the pandemic owing to rapid house price inflation, but has now levelled off.
Chart 1.9 House prices have risen faster than income through the pandemic16 Index. 1998 Q4 = 100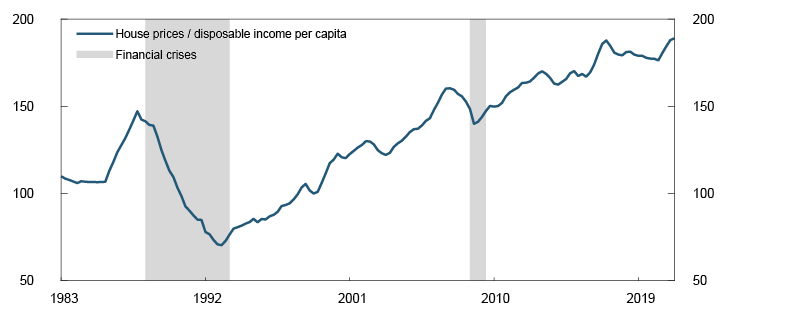
Chart 1.10 House price inflation has been moderate over the past half-year17 House prices. Percent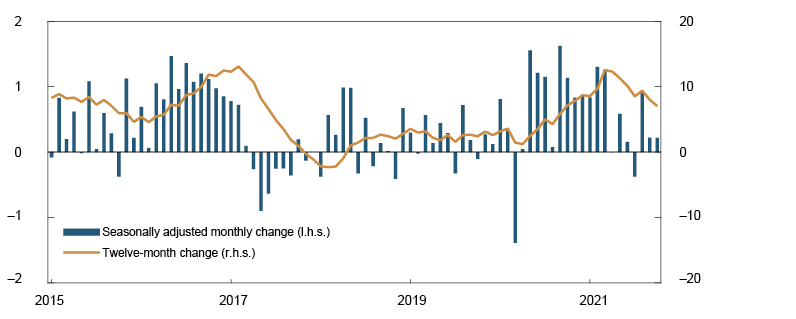
House price inflation has been more moderate in recent months. Moderate house price inflation is expected ahead (see Monetary Policy Report 3/21). This reflects higher lending rates, normalising household consumption patterns and an increase in residential construction.
Low yields have resulted in high commercial property price and financial asset inflation
Prices for commercial property and a number of financial assets, such as equities and bonds, have risen considerably through the pandemic. The swift rise reflects factors such as historically low interest rates, with low yields in a number of markets. This is an important global trend (see Section 1.1), but it also applies to Norway.
In the CRE sector, the office market is particularly important for financial stability since banks’ exposures to this segment are substantial. A large share of the stock of office buildings is located in Oslo, and prices for prime office space in Oslo is one of many indicators of cyclical vulnerabilities (see "A broad set of indicators indicates medium cyclical vulnerabilities").
Commercial property prices, measured as selling prices for prime office space in Oslo, have risen considerably in the years after the financial crisis (Chart 1.11). Selling prices fell somewhat at the start of the pandemic, but the fall was quickly reversed and prices continued to rise. Prices have levelled off during autumn. Selling prices are calculated as rents divided by yield.
Chart 1.11 Commercial property prices have risen considerably18 Estimated selling prices for prime office space in Oslo. In thousands of NOK per square metre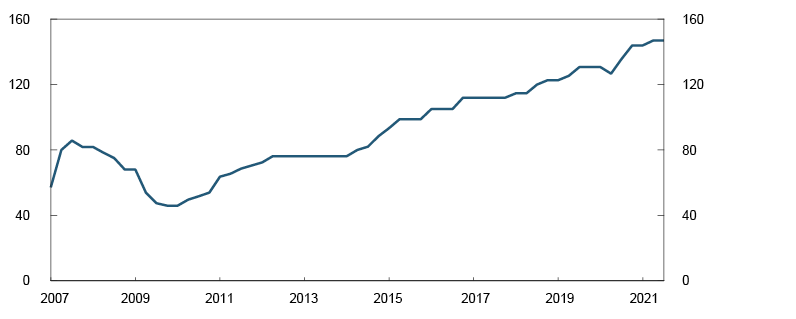
Lower yields in particular have pushed up commercial property prices through the pandemic. This largely reflects lower interest rates. The risk premium, measured as the difference between the yield and the five-year swap rate, rose during the pandemic, but is now close to its pre-pandemic level (Chart 1.12). The risk premium in Oslo is low compared with other European cities. Since the yield is at a low level, prices are sensitive to increases in risk premiums or long-term interest rates. A sharp fall in commercial property prices can lead to large bank losses (see Section 3). However, moderate commercial property price inflation is expected in the coming years (see Monetary Policy Report 3/21).
Chart 1.12 Risk premium in Oslo is low19 Yield less five-year swap rate. Percentage points 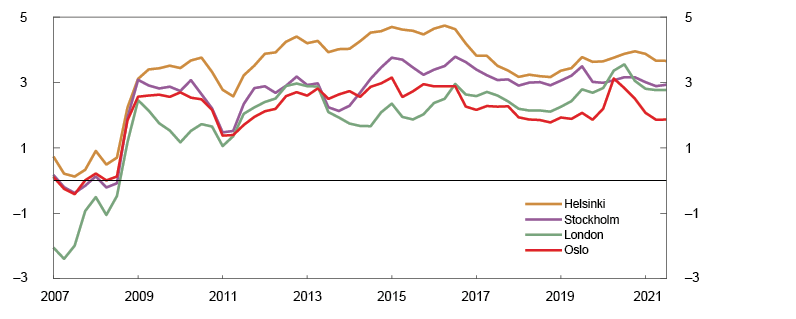
Rental prices fell weakly at the start of the pandemic but are now back to around their pre-pandemic level. Norges Bank has recently changed its provider of price statistics (see"New provider of commercial property price data"). The new data source is likely to give a more representative picture of developments in office rents in Oslo as a whole, since the new statistics include a broader set of office premises. The statistics show somewhat lower rents, and thus lower selling prices, than before. New price statistics and our recent access to microdata for most commercial buildings in Norway help to improve the basis for analyses of commercial property.20
New provider of commercial property price data
Norges Bank has recently changed provider of price statistics for prime office space from CBRE to Jones Lang LaSalle (JLL). The new statistics for prime office space in Oslo are based on a broader set of office premises. CBRE’s rents are closer to the most expensive leases for office space at Aker Brygge and Vika than JLL’s rents (Chart 1.A). The gap between the indexes widened considerably in 2017, when CBRE’s rents rose markedly. In this period, CBRE narrowed its definition of what is regarded to be prime office space, which has probably contributed to the wider gap. Differences in the providers’ information basis and assessments can also contribute to differences between the price indexes.
Chart 1.A New rental price index is more representative1 Annual office rents in Aker Brygge and Vika. NOK per square metre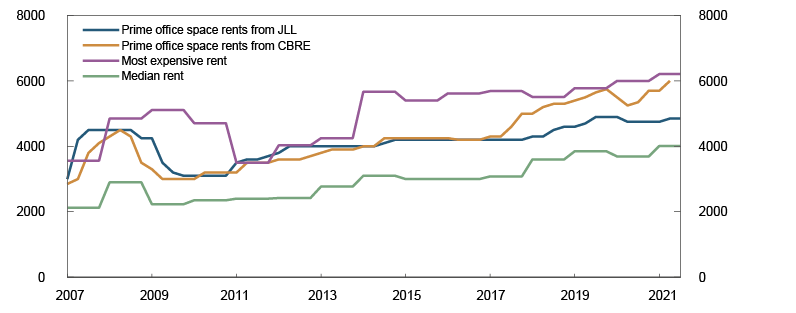
JLL’s rents are probably more representative of developments in rental prices for the office segment as a whole. The rental price index from JLL shows broadly the same developments as the quality-adjusted rental price index for Oslo as a whole and for Aker Brygge and Vika.2
Commercial real estate selling prices are calculated as rental prices divided by yield. The yield in JLL’s and CBRE’s statistics is fairly similar (Chart 1.B). Lower rents lead to a lower level of selling prices with JLL’s data, but both sets of statistics show high overall selling price rises through the pandemic.
Chart 1.B The yield is fairly similar3 Yield for prime office space in Oslo. Percent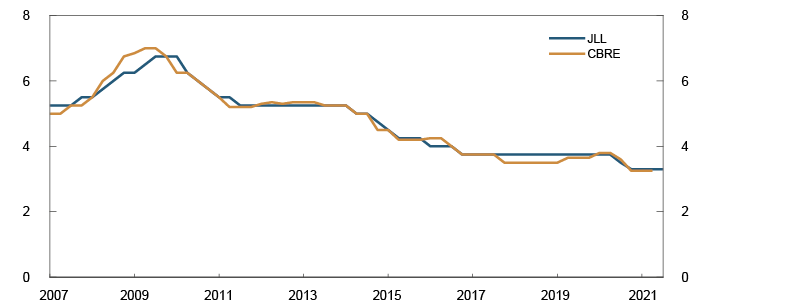
1 Period: 2007 Q1 – 2021 Q3. Data for the most expensive and median rents are at annual frequency.
2 Se Financial Stability Report 2019 for a comparison of the quality-adjusted rental price index with CBRE’s rental index.
3 Period: 2007 Q1 – 2021 Q3.
Lower yields and increased risk appetite have also fuelled high financial asset inflation. Equity prices have made strong advances through the pandemic (Chart 1.13). The Oslo Børs Benchmark Index has risen by 27% so far in 2021, and the index is now 32% higher than at the beginning of 2020. Price-to-earnings and price-to-book ratios for Norwegian listed equities now appear to be high, compared with averages for the past 15 years (Chart 1.14). In the corporate bond market, issuance volumes have been high so far in 2021, and risk premiums are close to pre-pandemic levels.
Chart 1.13 Equity prices have made strong advances21 Oslo Børs Benchmark Index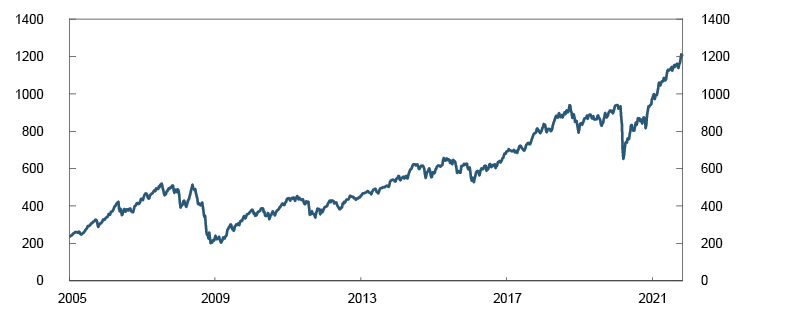
Chart 1.14 Equity valuations are high22 Market capitalisation-to-earnings and price-to-book ratios. Sample of Norwegian listed companies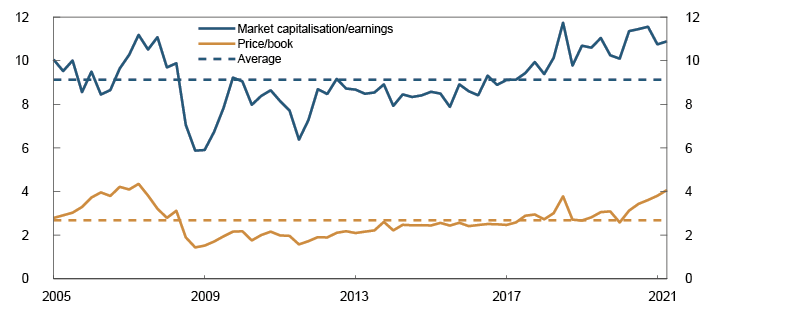
A sharp fall in financial asset prices can threaten financial stability through a number of channels. Pension funds can incur large losses since portions of their benefit obligations are fixed. Banks’ liquidity portfolios, and thus banks’ liquidity, will also be impaired by a price fall. A substantial fall in financial asset prices can also adversely impact a number of other financial institutions, such as investment firms and insurance companies. In addition, many households own financial assets, even though their primary residence and other real estate account for most of household wealth. Households’ financial assets increased through the pandemic, which has bolstered households’ resilience. However, the increase in household financial assets increases the risk that a substantial fall in financial asset prices can lead to a tightening of consumption and bank losses, if firms default on their debt.
A broad set of indicators indicates medium cyclical vulnerabilities
Empirical analyses show that financial crises hit harder when cyclical vulnerabilities are high prior to a crisis. With the aid of quantile regressions, we have linked the risk of sharp falls in GDP to measures of cyclical vulnerabilities.1
We use a broad set of cyclical vulnerability indicators. They include five-year changes in credit, house prices and household debt service ratio and three-year changes in commercial property prices and equity prices. Each indicator is normalised based on its historical distribution in the period, so that all indicators are scaled the same. Historical observations indicate that the estimated risk of a fall in GDP (vertical scale) rises with the level of cyclical vulnerabilities (horizontal scale) (Chart 1.C). Possible falls in GDP are measured at the 5th percentile, which means that five out of 100 cases of possible GDP growth are expected to be lower than this. The 5th percentile will be much lower than expected growth and provides a good starting point for quantifying possible crisis depth in stress tests (see Section 3).
Chart 1.C Linkages between cyclical vulnerabilities and GDP growth2 Cyclical vulnerabilitiy indicators (normalised) on the horizontal scale and 5th percentile projections for GDP growth on the vertical scale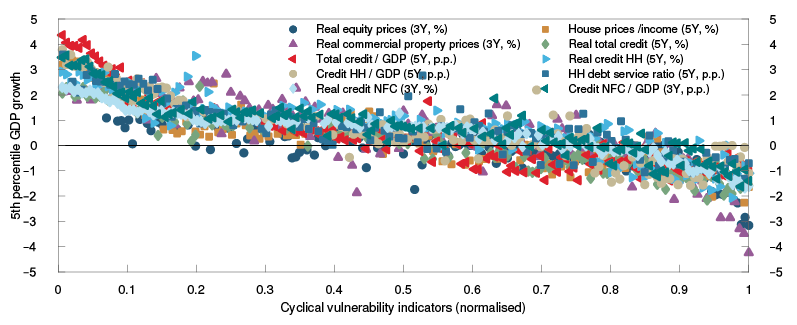
Overall, this analysis indicates that cyclical vulnerabilities are at a medium level relative to the indicators’ historical distribution. The vulnerability indicators are spread from low to high, but most lie at a medium level (Chart 1.D). Most indicators were also at a medium level prior to the coronavirus pandemic, while they were at high levels prior to the financial crisis. The two indicators showing the highest vulnerabilities for 2021 Q2 are growth in household and corporate credit as a share of GDP. High values for these two indicators largely reflect the fall in GDP through the pandemic, and the indicators will decline as GDP normalises. The projections in Monetary Policy Report 3/21 for credit, house prices, commercial property prices and GDP suggest that the indicators of cyclical vulnerabilities will edge down ahead.
Chart 1.D The analysis indicates a medium level of cyclical vulnerabilities3 Cyclical vulnerability indicators (normalised) on the horizontal scale and 5th percentile projections for GDP growth on the vertical scale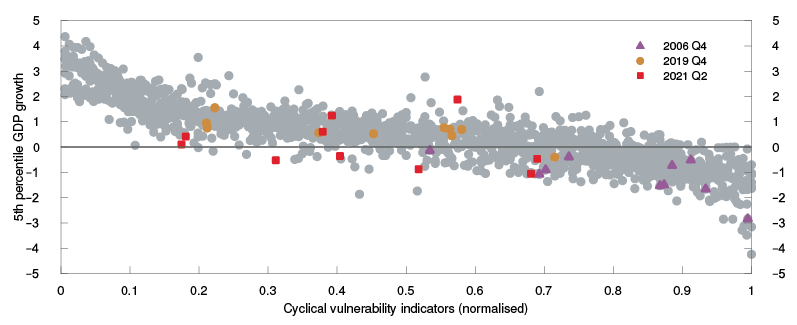
The analysis provides measures of cyclical vulnerabilities and appurtenant estimates of how far GDP can fall in the event of a sharp downturn (5th percentile). However, in the analysis, we do not have sufficient data to identify the importance of measures. Measures targeting banks, such as capital and liquidity requirements and risk management requirements, may help reduce vulnerabilities, but is the most important channel increasing banks’ resilience. This will better enable banks to absorb high credit losses and weak earnings without contributing to amplifying a downturn. Other requirements, eg mortgage requirements, can have a greater impact on household leverage and increase household resilience.
1 See Arbatli-Saxegaard, E.C., K.R. Gerdrup and R.M. Johansen (2020) “Financial imbalances and medium-term growth-at-risk in Norway”. Staff Memo 5/2020. Norges Bank.
2 Period: 1985 Q1 – 2021 Q2. HH stands for households and NFC stands for non-financial corporations. 3Y and 5Y stand for three- and five-year change, respectively.
3 Period: 1985 Q1 –2021 Q2.
16 Period: 1983 Q1 – 2021 Q2. Disposable income is income after taxes and interest payments.
17 Period: January 2015 – October 2021.
18 Period: 2007 Q1 – 2021 Q3.
19 Period: 2007 Q1 – 2021 Q3. Prime office space.
20 Norges Bank has previously recommended strengthening the statistical basis for commercial property (see Financial Stability Report 2018).
21 Period: Week 1 2005 – week 44 2021.
22 Period: 2005 Q1 – 2021 Q2. Market capitalisation is the market value of equity and interest-bearing debt less cash. Earnings are a four-quarter moving average of operating earnings before depreciation, amortisation and impairment. Price/book is the market value of equity in relation to the carrying amount of assets excluding intangibles. The sample is Norwegian listed companies excluding financial institutions, companies engaged in oil production etc, companies registered abroad, companies without interest bearing debt and companies presenting incomplete financial reports.
1.4 The Norwegian financial system is vulnerable to cyber attacks
Cyber attacks are a potential threat to financial stability and are thus a source of systemic risk in the financial system.23 Even though cyber attacks have affected individual institutions, so far, cyber attacks have not given rise to financial crises, either in Norway or globally. The lack of an empirical basis makes it a challenge to assess the level of this vulnerability in the financial system. At the same time, serious cyber attacks appear to be trending upwards, resulting in a need for greater attention to cyber risk and development of measures to address it.
Digitalisation and interconnectedness constitute vulnerabilities
Extensive digitalisation in the Norwegian financial system, particularly in the payment system, increases efficiency. At the same time, it entails a vulnerability to cyber attacks. Moreover, considerable financial assets, key infrastructure and large quantities of sensitive data make the financial sector an attractive target. Financial and operational dependencies mean that the consequences of cyber attacks can spread quickly and widely across the financial system.
The Norwegian financial sector has largely outsourced ICT operations and development to third-party providers. Critical functions in the financial infrastructure are dependent on a few key ICT providers (see Financial Infrastructure Report 2021). Such concentration raises the risk that a cyber attack can affect much of the financial system. Increased outsourcing of ICT services results in longer and more complex supply chains for financial institutions. Long digital supply chains provide a large number of attack surfaces, making it more difficult to monitor and manage cyber risk.
In order to perform its tasks, the financial system depends on the availability and integrity of the information in its possession. For example, payment system operators need to be able to trust account information to execute payments. This makes the system vulnerable to cyber attacks that encrypt or manipulate information. In addition, traditional contingency measures are usually also dependent on access to correct information.
A more aggressive threat landscape
The Norwegian National Security Authority (NSM) assesses the digital threat landscape as more aggressive.24 Cyber attacks on Norwegian entities are increasing in scope. Threat actors also appear to be more professional and specialised, so that the complexity of attacks is increasing. Financial institutions report to Finanstilsynet (Financial Supervisory Authority of Norway) that digital attacks by criminal actors are becoming increasingly sophisticated.25 The majority of attacks on the financial sector are economically motivated. At the same time, the security authorities point out that state actors represent a serious threat to Norwegian interests, including through digital mapping and possible sabotage of critical Norwegian infrastructure, including the financial system.26
NSM considers supply chain attacks to be a growing risk. Threat actors can have a wide-ranging impact by exploiting providers’ security holes. For example, the hacking of the software developer SolarWinds and weaknesses in Microsoft Exchange have shown supply chain attacks’ considerable potential for harm. In connection with these two cases, Finanstilsynet has received notifications from Norwegian financial institutions that have been exposed to the compromised software, but no signs have been found that the security hole has been exploited.27 Nevertheless, these incidents illustrate risks related to supply chains.
Use of ransomware is increasing. The attack on the Colonial Pipeline in the US show that such attacks can have serious societal ramifications if they target key infrastructure. In Sweden, Coop had to close all of its approximately 800 stores for several days owing to a ransomware attack on Kaseya, a subcontractor for its cash register system. A more recent feature of ransomware attacks is that in addition to demanding ransom for decrypting data, attackers also demand payment for not publishing or selling sensitive data obtained in the attack. A ransomware attack on a financial institution where sensitive data fall into the wrong hands can have negative consequences for the reputation of the affected institution, but also for trust in the entire financial sector. In its threat assessment, DNB refers to ransomware as the greatest digital threat to DNB.28
Resilience to cyber attacks must be strengthened
In Financial Infrastructure Report 2021, Norges Bank considers the financial infrastructure to be secure and efficient, but points out that testing for and identifying risks of cyber incidents in the banking and payment system can be improved. In its latest review of financial sector ICT use, Finanstilsynet considers overall risk relating to cybercrime to be high. Nevertheless, Finanstilsynet points to steady improvements in financial institutions’ cyber resilience work, with attacks largely averted before they have serious consequences.
There is broad agreement both internationally and in Norway that resilience to cyber attacks in the financial system must be strengthened. In 2020, the European Commission presented a draft Digital Operational Resilience Act (DORA). Existing Norwegian rules are already close to the requirements in the proposed EU regulation.29 An important new element of DORA is the introduction of a supervisory framework for ICT providers. Norges Bank has previously recommended further study of the best way to supervise key ICT providers and data centres.
In 2018, the European Central Bank (ECB) published a framework for testing entities’ ability to detect and respond to cyber attacks, Threat Intelligence-based Ethical Red Teaming (TIBER-EU). Its purpose is to strengthen the cyber resilience of financial sector entities and thus promote financial stability. Moreover, TIBER testing provides additional knowledge about how cyber attacks can affect the financial system. In collaboration with Finanstilsynet, Norges Bank has developed a framework for implementation in Norway (TIBER-NO), based on TIBER-EU.30 TIBER-NO was approved by Norges Bank’s Executive Board in September. Norges Bank will establish a Norwegian TIBER Cyber Team (TCT-NO) to administer and operationalise TIBER-NO. A steering group, of which Finanstilsynet is also a member, is tasked with ensuring that critical functions in the financial system are tested and with quality-assuring the tests. Testing under TIBER-NO is expected to be conducted in 2022 at the earliest.
Cyber attacks’ potential for systemic consequences requires a broader perspective than supervision and oversight of individual institutions and systems. It also requires expanded collaboration between various authorities and financial system participants. Cyber mapping identifies key financial and operational dependencies in the financial system, between financial institutions, the financial infrastructure and third-party providers. It provides useful insight into how a cyber incident can threaten financial stability and is also a prerequisite for monitoring systemic cyber risks and proper incident management in the event of a cyber attack.
In Norway, such work is underway to map fundamental national functions in the financial system in connection with implementing the new Security Act. Fundamental national functions are functions necessary for the government’s ability to protect national security interests.31 This mapping is to include sub-functions and the entities, systems and providers that are crucial or critical for performing these functions. This work is laying an important foundation for further management of systemic cyber risk in Norway.
23 Cyber incidents can also arise from unintended operational faults (see FSB (2018) Cyber Lexicon). Nevertheless, in a systemic risk context, the focus is often on cyber attacks, since it is considered more likely that malicious attacks can weaken trust in the financial system, even though both incident types can have serious consequences (see, eg, ESRB (2020) Systemic cyber risk).
24 See Norwegian National Security Authority (2021) Risiko 2021 [RISK 2021] (in Norwegian only).
25 See Finanstilsynet (2021) Risiko- og sårbarhetsanalyse (ROS) 2021 [Risk and vulnerability analysis (ROS) 2021] (in Norwegian only).
26 See Norwegian Police Security Service (2021) “Nasjonal trusselvurdering 2021” [National threat assessment 2021] (in Norwegian only).
27 See Finanstilsynet (2021) Risiko- og sårbarhetsanalyse (ROS) 2021 [Risk and vulnerability analysis (ROS) 2021] (in Norwegian only).
28 See DNB (2021) “Trusselvurdering 2021“ [Threat assessment 2021] (in Norwegian only).
29 See preliminary position memo on DORA in the Norwegian Government’s EEA database.
30 See Norges Bank’s press release of 21 October 2021 “Norges Bank and Finanstilsynet establish TIBER-NO framework for testing financial sector cyber resilience”.
31 More precisely, fundamental national functions are defined as “services, production and other types of activity which are of such importance that a complete or partial loss of the function would have consequences for the State’s ability to protect national security interests” (see Act relating to national security (Security Act)).
1.5 Other societal trends are important for financial stability
Climate change is creating considerable challenges in many areas, but banks are well positioned to manage the risks. Crypto-assets are not considered to be a threat to financial stability yet, either globally or in Norway. This can change in the future, but a number of regulatory initiatives can lessen the threat to financial stability.
Climate change is creating major challenges, but banks are well-positioned to address the risks
Average global temperatures have risen by around 1.1°C compared with the period 1850–1900. The UN Intergovernmental Panel on Climate Change has determined that anthropogenic greenhouse gas emissions to the atmosphere are the main reason for the increase in temperatures.32
Climate change, along with mitigation policies, will have global macroeconomic consequences in the coming years.33 Both the private and public sectors must make substantial investment to cut emissions and to prepare for changes in weather patterns owing to climate change that has already taken place. The longer one waits to take action, the more expensive it is assumed that this process will be. Growth in such climate investment must come at the expense of other investment or financed by reduced net financial investment or reduced consumption.34
Norway is relatively little exposed to the adverse effects of physical climate change.35 Norway produces substantial amounts of clean energy, and Norwegian firms and households have already come far in electrifying their energy consumption. On the other hand, Norway is a major producer of oil and gas. A quick transition to less use of fossil fuels globally will place considerable demands on the energy sector’s restructuring capabilities.
By virtue of their role in credit intermediation, banks have an important function in allocating capital to new projects. Banks must further develop their credit assessments to make them better able to evaluate firms’ exposure to climate change and increased climate risk. The authorities can contribute by requiring more standardised reporting.
At the same time, climate change can increase the risk of losses on existing exposures. This can be due to transition risk, ie firms are unable reduce emissions from their operations, and physical risk, ie losses resulting from damage caused by climate change. There is reason to believe that climate change will have a more profound impact on equity investments, which reflect firms’ long-term returns, than on loans, which normally have a shorter horizon and are secured with collateral. Our analyses show that Norwegian banks have moderate exposures to firms with large climate exposures (see "Norwegian banks’ exposure to climate risk"). Norwegian banks have limited exposures to carbon-intensive industries. In addition, climate change can affect regulation and market requirements, which may be of importance for bank funding (see "Forthcoming climate-related reporting").
Growing use of crypto-assets requires new regulations
Crypto-assets encompass a number of asset types. Besides the best known cryptocurrencies, such as Bitcoin and Ethereum, crypto-assets also include various digital representations of assets (“tokens”). Tokens use cryptocurrency systems as an infrastructure for issuance and trading. One type of crypto-asset is “stablecoins”, which aim for a stable value against a benchmark, normally a national currency, with the US dollar the most used. The use of cryptocurrency systems as financial services platforms is often referred to as decentralised finance.
The total market capitalisation of all crypto-assets has been relatively volatile during 2021 (Chart 1.15). Periodically, the market capitalisation has been over USD 2 000bn, of which Bitcoin accounts for just over 40%, while stablecoins account for around 5%. Bitcoin’s share of crypto-assets’ total market capitalisation has fallen so far in 2021, among other reasons because the volume of cryptocurrencies used as infrastructure for decentralised finance has risen.
Chart 1.15 Crypto-assets market capitalisation has fluctuated considerably in 202136 Total market capitalisation of crypto-assets and market shares of different crypto-assets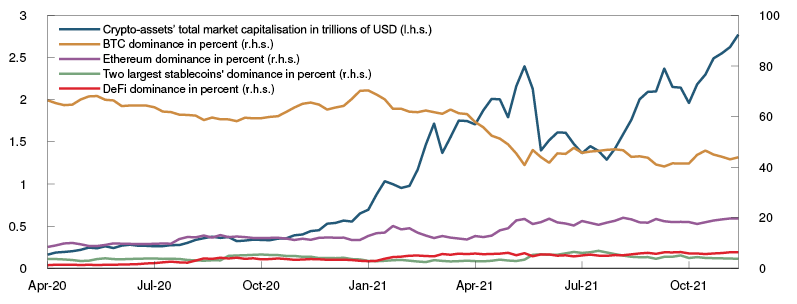
Cryptocurrencies began as an underground phenomenon for payments about 10 years ago, but quickly assumed a role as a speculative investment. The development of stablecoins has enabled greater use of crypto-assets for payments, but there are still few transactions other than crypto-asset trades. It is likely that speculation is still an important driver of valuations and the substantial swings in cryptocurrency values. Social media and tech platforms have fuelled market hype and simplified crypto-asset transactions. The IMF does not consider crypto-assets to be a risk to global financial stability yet, but recommends that developments should be monitored closely.37
Institutional investors have shown a growing interest in crypto-assets, both globally and in Norway. Surveys show that the possibility of substantial gains is also a key motivator for institutional investors.38 Internationally, banks and other traditional financial institutions are also considering the possibility of exposing their balance sheets to crypto-assets and of offering customers related services. To our knowledge, Norwegian banks and other Norwegian financial institutions do not have material exposure to crypto-assets.
Crypto-assets can fall sharply in value, and the falls in value can be sudden and unpredictable, eg, if the assumptions regarding the technology fail. A substantial fall in the value of crypto-assets can have ripple effects on the financial system, if banks and other systemically important institutions are significantly exposed. The Basel Committee has drafted a proposal for capital requirements for banks exposed to crypto-assets.39 This proposal mainly entails that if banks wish to hold unhedged crypto-assets on their balance sheets, the assets must be fully financed by equity. This substantially reduces the risk of ripple effects on the financial system caused by large price falls.
Global stablecoins may become systemically important if they become widespread. Stablecoins can be secured in various ways. Some are secured on more or less liquid assets, while others are secured on other crypto-assets. Stablecoins secured on securities share similarities with money market funds, and in the event of uncertainty regarding the cryptocurrency’s value, may be subject to large scale conversions to another currency by investors. In that case, the underlying securities need to be quickly liquidated to pay those wanting to convert. Such a fire sale of securities can have systemic effects. The Financial Stability Board (FSB) has formulated overall principles for regulating global stablecoins.40 In the EU there is work on extensive regulation of crypto-assets, which also includes regulation of stablecoin providers41. The regulation seeks to promote innovation, protect consumers and protect financial stability.
Crypto-assets can also affect financial stability by affecting payment system security. If crypto-assets are used for payments in sufficient volume, technical failures can have systemic effects. There may therefore be a need for special regulations that address risk related to the use for payments in the same way as traditional payment systems are regulated. Financial Infrastructure Report 2021 discusses such regulations in detail. The Committee on Payments and Market Infrastructures (CPMI) and the International Organization of Securities Commissions (IOSCO) are working on principles for stablecoins used for systemically important stablecoin arrangements.42 The principles are meant to address some of the challenges mentioned above and may mean, for example, that certain stablecoins cannot be used for systemically important transactions.
Crypto-assets can also lead to less use of national currencies,43 affecting the ability to conduct monetary policy, for example. This is primarily a challenge for countries with fairly inefficient payment systems, lack of trust in the monetary system and unstable currencies. This is therefore considered to be a small risk for Norway in the foreseeable future.
32 See IPCC (2021) Climate Change 2021: The Physical Science Basis. Contribution of Working Group I to the Sixth Assessment Report of the Intergovernmental Panel on Climate Change. Cambridge University Press.
33 See eg Pisani-Ferry, J. (2021) “Climate Policy is Macroeconomic Policy, and the Implications Will Be Significant”. PIIE Policy Brief 21-20.
34 See eg Fæhn, T., K.R. Kaushal, H. Storrøsten, H. Yonezawa and B. Bye (2020) “Abating greenhouse gases in the Norwegian non-ETS sector by 50 per cent by 2030”. Reports 2020/23. Statistics Norway.
35 Germanwatch, which compiles the Global Climate Risk Index, intended to measure risks of effects of extreme weather, ranks Norway as 149th out of 180 countries on its vulnerability index for 2000–2019 (see Eckstein, D., V. Künzel and L. Schäfer (2021) “Global climate risk index 2021”. Briefing Paper. Germanwatch, January 2021).
36 Period: Week 14 2020 – week 45 2021.
37 See International Monetary Fund (2021) “Covid-19, Crypto and Climate”. Global Financial Stability Report. IMF, October 2021.
38 See Fidelity Digital Assets (2021) “The Institutional Investor Digital Asset Study”. September 2021.
39 See BCBS (2021) “Prudential treatment of crypto-asset exposures”. Consultative Document. BIS, June 2021.
40 FSB (2020) “Regulation, Supervision and Oversight of ‘Global Stablecoin’ Arrangements”. FSB, October 2020.
41 Referred to as the Markets in Crypto Assets (MiCA) Regulation.
42 CPMI-IOSCO (2021) “Application of the Principles for Financial Market Infrastructures to stablecoin arrangements”. Consultative Report. BIS, October 2021.
43 See International Monetary Fund (2021) “Covid-19, crypto and climate”. IMF, October 2021.
Norwegian banks’ exposure to climate risk
Climate change has a range of consequences for Norway. Greenhouse gas (GHG) emissions must be reduced markedly, businesses must restructure and Norway must prepare for changes in weather patterns. For banks, this may result in higher losses. Climate risks are normally grouped into two categories: Transition risks may lead to increased bank losses owing to society’s adaptation to lower GHG emissions, while physical risks are potential losses owing to climate change. Norwegian banks’ direct exposure to transition risks appears to be moderate, and so far, exposure to known physical risks appears to be limited. In view of this, combined with their financial solidity, Norwegian banks are well positioned to meet the challenges of climate change.
Norwegian banks have moderate direct exposure to transition risks as a result of higher carbon prices
With higher carbon prices, the ability to reduce GHG emissions will be an important factor in cost management and profitability. As high-emission firms will need the most extensive restructuring, banks will be most exposed to transition risks from their lending to these firms. Assessment of GHG emissions and climate mitigation measures will be an important factor in assessing long-term profitability.
In recent years, the Task Force on Climate-related Financial Disclosures (TCFD)1 has established norms for the disclosure of climate-related information at firm level. The TCFD recommends that emissions should be reported in three so-called scopes:
•Scope 1 refers to all direct GHG emissions.
•Scope 2 refers to indirect emissions from consumption of purchased electricity, heat or steam.
•Scope 3 refers to other indirect emissions not covered in Scope 2 that occur in the value chain of the reporting company.
Firms are also required to report their plans to reduce GHG emissions. So far, companies complying with TCFD reporting requirements are primarily large listed companies. Norwegian banks’ exposures are mainly to small and medium-sized enterprises. For the time being, reporting does not provide an accurate picture of these firms’ emissions. Regulation of reporting standards is under development (see "Forthcoming climate-related reporting").
To obtain a picture of Norwegian banks’ exposure to high-emitting firms, Scope 1 emissions data by industry is linked to firms’ turnover data from Statistics Norway.2 Emissions measured in CO2 equivalents3 as a share of turnover across 45 different industries can then be calculated. For industries with high Scope 2 and 3 emissions, this will underestimate the emissions. For Norway as a whole, this applies to oil and gas extraction in particular, which has high Scope 3 emissions, but this industry accounts for less than 5% of Norwegian banks’ lending to the corporate sector.
Particularly vulnerable exposures are assumed to be in industries where carbon prices will increase most as a share of total turnover in the years ahead. Higher carbon prices do not in themselves entail financial risk. A firm can maintain its earnings if it is able to reduce emissions or increase prices. However, for these firms, carbon emission management will be an increasingly important factor to ensure continued solid profitability and debt-servicing capacity.
The current cost of GHG emissions varies widely across industries (Chart 1.E).4 Carbon prices are expected to increase, also in industries where carbon taxes are currently low. The Government’s climate action plan presented in 2021 set a target for the carbon tax of NOK 2 000 per tonne CO2 equivalents by 2030. The climate scenarios of the Network of Central Banks and Supervisors for Greening the Financial System (NGFS)5 show that it is necessary to have a global carbon price higher than this to meet the goal of the Paris Agreement6 to work toward limiting global warming to 1.5°C (Chart 1.F).
Chart 1.E Many industries continue to pay low carbon prices7 Carbon prices by cumulative share of emissions for 45 industries. Volume-weighted average by industry. NOK per tonne CO2 equivalents. Data for 2019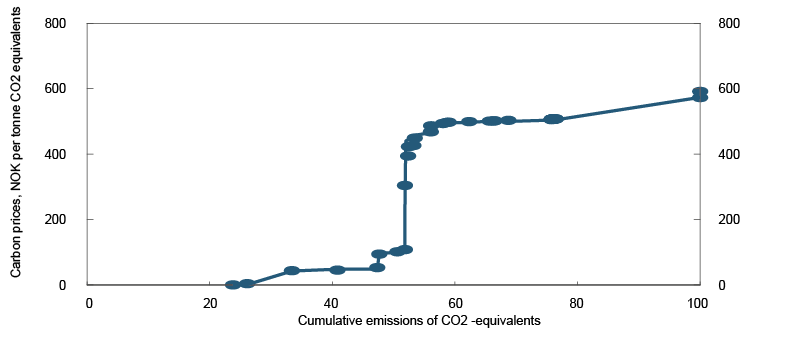
Chart 1.F Carbon prices to rise in the coming years8 Carbon prices in different model forecasts. EU-28. NOK per tonne CO2 equivalents 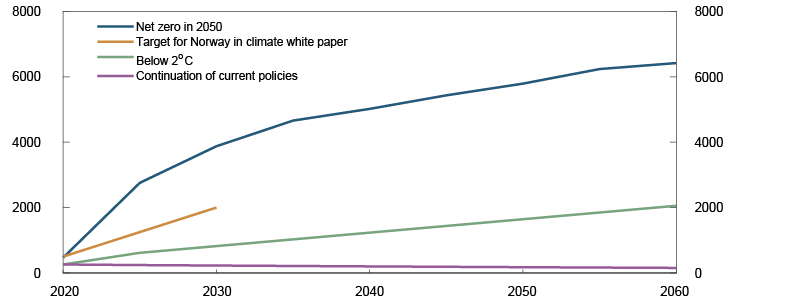
The impact at industry-level of a rise in the carbon price to NOK 2 000 for all industries has been assessed. In 31 of the 45 industries, the carbon price increase will be equivalent to less than 1% of turnover in 2008. The cost of the increase is highest in international shipping and agriculture, followed by the process industry, transport and oil and gas extraction.
Overall, the most exposed industries account for slightly more than 20% of banks’ total corporate lending9, about half of which is shipping loans. Banks with large shipping exposures are in relative terms most exposed to climate risk. The size of the exposures varies widely across the 11 banks (Chart 1.G). Some of the foreign banks operating in Norway have transferred the majority of their shipping exposures to their Norwegian branches, which therefore appear to have higher climate exposure than implied by the bank’s overall climate exposure.
Chart 1.G Considerable differences in banks’ exposures to high-emission industries10 Increased carbon taxes as a share of banks’ customers measured at industry level. Weighted by share of banks’ exposure to the industry. Eleven largest banks. Percent. Data for 2019 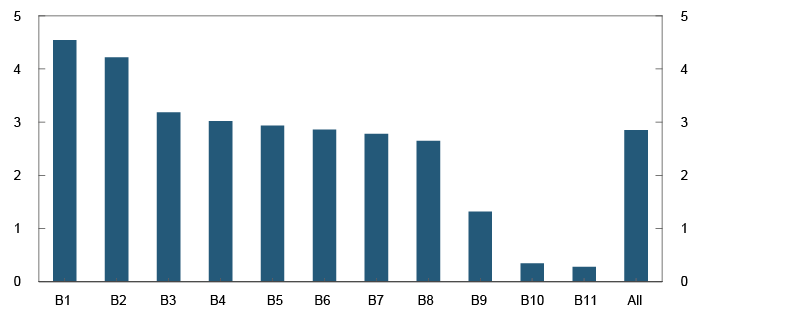
Even though shipping is a high-emission industry and may face a marked increase in price, the industry as a whole is in a good position to meet new climate policy requirements. The price sensitivity of shipping services demand is likely relatively low, and there may be considerable potential for reducing direct emissions from ships. On the other hand, close to half of Norwegian banks’ shipping exposures are related to either oil and gas transport or to ships used in connection with oil production, and the need for restructuring in these firms may be higher. We find that Norwegian banks submit climate-related disclosures in line with TCFD requirements for about 1/3 of their total lending to shipping.
Norwegian banks have little exposure to known physical climate risks
Physical climate risk is the risk of damage resulting from climate change such as extreme weather events, higher sea levels or generally higher temperatures. Climate change can have direct consequences, such as increased risk of flooding or forest fires, and indirect effects, such as changes to biological systems. In many cases, the consequences of physical climate risk can be reduced through preventative investment. Nevertheless, there is considerable uncertainty about the long-term effects of climate change.
Banks are exposed to physical climate risk through losses on exposures to firms that sustain damage. Damage can also affect the value of physical collateral used to back exposures. Banks’ risk is reduced if the collateral is insured. In Norway, property affected by natural disaster is protected by the Norwegian National Scheme for Natural Damage Assistance, which is a group insurance scheme with government contributions.11 Insurance under this scheme only covers the cost of restoring property to its pre-disaster condition. If the likelihood that the damage will recur is high, the value of the property may be permanently reduced. If physical risks increase, there is reason to expect natural disaster insurance premiums to increase over time.
It is possible to predict to some extent the areas that will be most vulnerable to direct damage. Storm surges affect coastal property. The risk of flooding is linked to terrain featuring waterways, while the risk of avalanches and landslides is mainly associated with ground conditions. These conditions have been mapped by the Norwegian authorities. Maps of vulnerable areas are available from the Norwegian Water Resources and Energy Directorate (NVE).12
With increased physical climate risk, it is more important for banks to be aware of properties in vulnerable areas. Property values in such areas will increasingly depend on whether preventative measures have been implemented. However, there are some reservations. Heavy rain can also result in damage in areas that are not vulnerable to flooding. On the other hand, changes in the composition of precipitation can affect the risk of flooding. For example, less snow and more rainfall may reduce the severity of the largest spring floods, which have traditionally been a major natural disaster risk in Norway.13
We have analysed commercial property used as collateral by the eleven largest banks. About 2% of the properties is currently in a 200-year storm surge risk zone (Chart 1. H). Given the expected sea level rise in the period to 2090, this figure will rise to about 6%. In the same banks, about 5% of the properties pledged as collateral are located within NVE’s flood susceptibility areas. The percentages vary across banks. Banks with the most surge-exposed collateral are less exposed to flood risk and vice versa, reflecting banks’ different geographical catchment areas.
Chart 1.H Share of commerical buildings exposed to extreme flooding can double given expected sea level rise in the period to 209014 Commercial buildings in the risk zone for estimated 200-year floods. Percent of commercial space in each banks’ loan portfolio. Eleven largest banks. Data for 2021 and estimates for 2090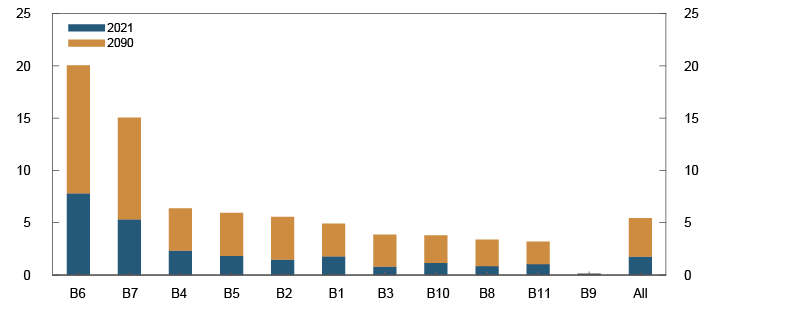
Physical risks shown by mapping are just a part of the potential consequences of climate change. Climate change may also affect factors that are far more difficult to measure. We already know that global warming is affecting biological diversity. The Arctic is particularly vulnerable, but it is difficult to predict the potential economic implications of such changes. Global warming may drive the spread of pests or changes in bacterial flora that could involve substantial costs. Further ahead, global warming might have more pronounced effects on the global weather system, which could result in a colder or a warmer climate in Norway in the long term. It is difficult for financial institutions to take such changes into account in their ongoing risk assessments. If we do not reduce GHG emissions in the years ahead, the consequences of climate change will likely result in higher bank losses.
2 The method and results are explained in further detail in Haug, K.D., L.K. Reiakvam, H. Solheim, L.-T. Turtveit and B.H. Vatne (2021) “Klimarisiko og bankers utlån til foretak” [Climate risk and banks’ corporate lending]. Staff Memo 7/2021. Norges Bank (in Norwegian only).
3 See table for conversion on the Ministry of Climate and Environment’s website (in Norwegian only).
4 Carbon prices have been calculated using the World Bank’s methodology, which only includes explicit carbon prices. Randen. T.B. Randen et al (Statistics Norway, 2021 – in Norwegian only) show effective carbon prices in Norway by sector, which include all fossil fuel taxes, regardless of purpose. For many industries, this will result in significantly higher carbon prices than we present here.
5 See Network for Greening the Financial System (2021): Scenario analysis resources.
6 See UNFCCC (2015): The Paris Agreement.
7 Prices for 2019. Volum weights are based on production numbers for 2018.
8 Period: 2020–2060
9 Based on the sector breakdown of banks’ exposures reported to Finanstilsynet (Financial Supervisory Authority of Norway).
10 Carbon price increases from its 2019 level to NOK 2 000 per tonne CO2-equivalents. No emissions cuts.
11 All buildings that are insured against fire damage will also have natural disaster coverage. All insurers providing fire cover contribute towards this type of coverage. The Norwegian government also has a scheme to cover natural disaster damage to property that is not included in private insurance policies (see Naturskadeerstatning (in Norwegian only)).
12 See for example the Norwegian Water Resources and Energy Directorate (NVE) website: Faresonekart (in Norwegian only).
13 Climate Analytics estimates that the median risk of flooding in Norway is not affected by higher global temperatures. On the other hand, flood risk uncertainty may increase.
14 Statistically, a 200-year storm flood will occur once every 200 years.
Forthcoming climate-related reporting
There is a lack of comparable and reliable information about climate risk, reducing financial market participants’ ability to manage climate risk. Authorities are working to improve the situation by introducing standards and regulation on the reporting of climate-relevant information. This may affect bank lending, climate risk and funding costs.
Climate change and climate change adaptation entail various forms of financial risk. The lack of comparable information about climate risk reduces market participants’ ability to address climate risk in their assessments and thereby their ability to channel capital towards profitable and sustainable projects. Efforts are therefore being made internationally to develop reporting standards for climate-related issues.
Forthcoming climate-related reporting standards are relevant for Norwegian banks
The Financial Stability Board (FSB) Roadmap for Addressing Climate-Related Financial Risks1 contains goals for financial disclosures, the availability of data, vulnerabilities analyses and supervision of climate-related risks. For financial disclosures, the goal is to etablish a global minimum standard for reporting of climate-related financial risks. The IFRS Foundation, an international organisation that develops accounting standards, has been tasked with facilitating the development of these standards. Standards are scheduled to be published in the second half of 2022. The EU body working on reporting standards is the European Financial Reporting Advisory Group (EFRAG). The EU Commission’s proposed Corporate Sustainability Report Directive (CSDR) aims, over time, to bring sustainability reporting on a par with financial reporting.2
The EU has established action plans and detailed strategies for sustainable finance. The objective is to steer capital flows towards sustainable projects, integrate sustainability into risk management, credit assessments and market analyses and contribute to increased transparency. An EU taxonomy, ie a classification system to define sustainable economic activities, has therefore been established. The taxonomy is intended to make it easier for investors to distinguish between sustainable and non-sustainable investment projects. The first technical criteria for sustainable activities will apply from 2022. In June, a bill on sustainable finance was submitted by the Government to the Storting (Norwegian parliament) that implements EU regulations on the taxonomy and related disclosure requirements.3
In July, the European Commission presented a new strategy4 for a more sustainable financial system, with finalised rules for the EU taxonomy that are also relevant for banks as from 2022. The deadline for banks to present detailed disclosure of their own exposures is, however, expected to be extended until 2024. The reporting will be used to calculate a green asset ratio (GAR), which shows the proportion of a bank’s taxonomy-aligned assets that are sustainable as defined by the taxonomy. The European Banking Authority (EBA) estimates5 show a GAR for EU banks of about 8%.
The disclosure obligation for bank lending activities is intended to channel capital flows towards sustainable activities. Banks’ disclosures provide investors with a better overview of the carbon footprint from activities financed by banks. Even though bank lending is not subject to climate-related requirements, the disclosure obligation will likely affect the composition of banks’ loan portfolios and funding costs.
Investors have in recent years shown increased interest in firms’ impact on global warming, biological diversity and sustainability. Research suggests that funding costs are lower for “green firms”, the so-called “greenium”.6
Level of green asset ratios for Norwegian banks uncertain
Norwegian banks will likely have access to more attractive funding conditions if they can report a high GAR. How the reporting requirements will affect banks in a Norwegian context is not yet clear, and the level of GARs for Norwegian banks is therefore uncertain. There is for example some uncertainty as to whether Norwegian schemes for energy labelling of property are aligned with the taxonomy.7
1 See the FSB Roadmap for Addressing Climate-Related Financial Risks, 7 July 2021.
3 See Proposition to the Storting 208 LS (2020–2021): Legislative proposal to implement sustainable finance regulations.
4 See European Commission: Strategy for financing the transition to a sustainable economy, 6 July 2021.
7 See Nye EU-regler: Boligbyggere vet ikke hvordan de skal bygge bærekraftig [New EU rules: Housing developers don’t know how to build sustainably] (in Norwegian only).
2 Bank resilience
Norwegian banks are resilient. They have ample access to funding and satisfy liquidity requirements by a good margin. Banks are solvent and fulfil capital requirements by a solid margin. In addition, banks’ profitability has normalised over the past year, primarily owing to lower credit losses.
Banks perform important tasks in the economy. They facilitate saving, channel capital, execute payments and redistribute risk (see Norway’s financial system 2021). Banks need to be resilient in order to perform these socially important tasks in periods of market turbulence and higher losses.
2.1 Funding and liquidity
Norwegian banks have ample access to funding
Norwegian banks have ample access to wholesale funding. After rising markedly in connection with the coronavirus outbreak, premiums in the Norwegian money market and risk premiums on banks’ long-term wholesale funding fell back quickly in 2020, owing in part to extraordinary measures by central banks and other authorities. Over the past year, the risk premiums banks pay on long-term bond funding declined further, and premiums are now somewhat lower than pre-pandemic levels (Chart 2.1). Profitable operations and solid capital adequacy help ensure that Norwegian banks have ample access to wholesale funding.
Chart 2.1 Risk premiums on banks’ long-term market funding are lower than pre-pandemic levels1 Risk premiums in the Norwegian bond market. Five-year maturity. Percentage points above three-month Nibor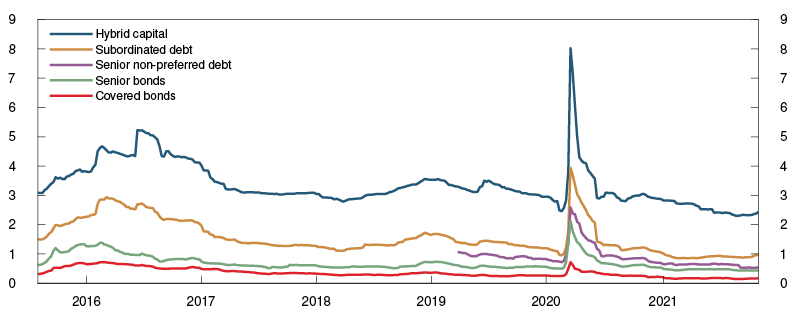
Up until the end of December 2020, Norges Bank offered extraordinary F-loans to ensure the transmission of the policy rate and promote well-functioning markets. At its highest, banks’ use of this facility totalled nearly NOK 200bn. A number of the guidelines for pledging collateral for loans from Norges Bank were also temporarily relaxed until the last extraordinary loan matured at the end of August 2021.
Customer deposits are the most important funding source for Norwegian banks. The deposit-to-loan ratio has increased somewhat over the past year. Both households and firms have increased deposits since the beginning of the pandemic (see Section 1 and Monetary Policy Report 3/21).
Banks fulfil applicable liquidity requirements by a good margin
Liquidity regulation is intended to help banks meet their obligations even if fresh funding should become temporarily unavailable. Doubt as to whether a bank is able to meet its obligations can result in a deposit runoff and a reluctance of lenders to issue new loans. This can happen as a result of, for example, large losses, cyber attacks on the bank or other events that cause a loss of confidence. The deposit guarantee scheme helps to counter bank runs by guaranteeing deposits up to NOK 2m per depositor per bank.2 In addition, banks’ access to funding can be affected by other financial system participants, of which the selling pressure in the bond market in spring 2020 is an example.3 Since banks play a special role in credit and payment intermediation, liquidity insurance from the central bank may be warranted if there is a threat to banks’ liquidity positions (see Section 4). Liquidity regulation helps better equip banks to weather a dry-up of funding without such liquidity support.
Liquidity regulation comprises two requirements, the Net Stable Funding Ratio (NSFR) and the Liquidity Coverage Ratio (LCR).4 The NSFR requires illiquid assets, such as loans, to be funded with stable, long-term financing, which makes banks less dependent on frequent refinancing. The NSFR is not yet a formal requirement in Norway, but is expected to be incorporated into Norwegian law as a part of the EU’s banking package in the course of 2022. The NSFR has increased somewhat in recent years, and Norwegian banks overall fulfil the upcoming requirement by an ample margin.
Under the NSFR, bond funding with a residual maturity of more than one year is considered stable. The average residual maturity of bank bonds outstanding is 2.5 years for senior bonds and 3.5 years for covered bonds. Overall, the maturity structure of banks’ bond debt is smooth, which reduces the risk that they will need to refinance a large part of their funding at the same time. Deposits covered by the deposit guarantee scheme are also considered very stable. Such deposits account for approximately 30% of Norwegian-owned banks’ and mortgage company funding.5
The LCR requires banks to hold sufficient liquid assets to meet their obligations in a stress scenario lasting 30 days with large withdrawals and financial market stress. At the end of 2021 Q2, all Norwegian banks satisfied the LCR requirements. Overall, the LCR has increased somewhat in both NOK and foreign currency compared with prior to the pandemic.
The LCR is a liquidity stress test with a 30-day horizon and does not measure banks’ liquidity in the event of more prolonged stress. An analysis conducted by Norges Bank shows that if the same stress scenario assumed for the LCR were to last 90 days, a majority of the largest Norwegian banks would become illiquid (Chart 2.2)6. The number of banks that become illiquid in this scenario is little changed compared with prior to the pandemic. This is a severe scenario, where it is also assumed that banks are unable to refinance any of their maturing wholesale funding. Banks have spare capacity in their mortgage companies that can be used to issue new covered bonds. If it is assumed in the analysis that banks make use of this potential source of funding, they will remain liquid through the period (Chart 2.3).
Chart 2.2 Few banks remain liquid in a 90-day period of severe liquidity stress7 Number of liquid banks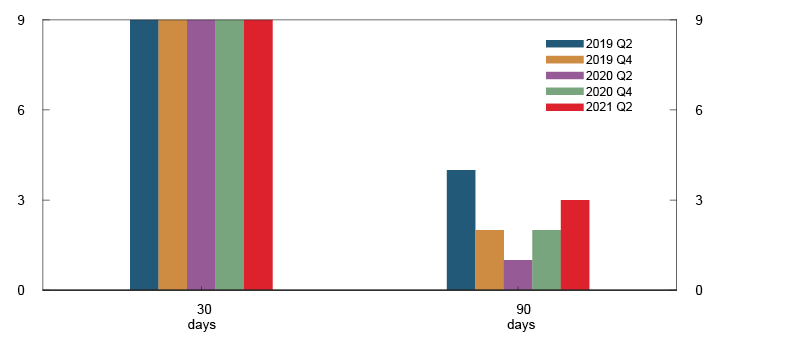
Chart 2.3 Banks remain liquid for 90 days if they can issue new covered bonds8 Number of liquid banks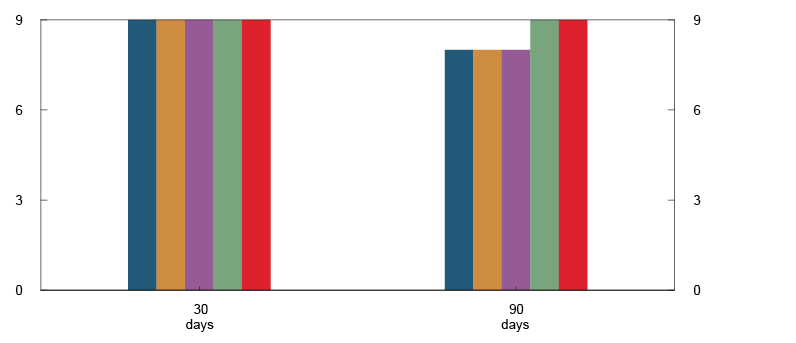
Banks are dependent on well-functioning covered bond markets
Both the LCR and the Bank’s analysis rest on the assumption that banks can sell their liquid assets in the market when faced with difficulties obtaining fresh funding. Banks’ liquidity portfolios primarily consist of covered bonds, central bank deposits and government securities. The Norwegian government securities market is small compared with other countries, which accounts in part for the high share of covered bonds in banks’ NOK-denominated liquidity portfolios. The LCR requirement in NOK is 50%, while the requirement for all currencies combined is 100%.9 The lower NOK requirement helps to limit the concentration of covered bonds in the portfolios overall. Marketability and value preservation in the covered bond market are nevertheless important for banks’ ability to sell from their liquidity portfolios.
There can be a considerable difference in the way the market functions in normal times and in times of market turbulence, as witnessed in spring 2020. Respondents to Norges Bank’s semi-annual market liquidity survey reported an improvement in liquidity in the Norwegian secondary market for covered bonds in the first half of 2021. Because of the greater interconnectedness of the banks that act as investors, issuers and market makers in the covered bond market, problems at one bank can more easily spread to others. This is a key financial system vulnerability in Norway (see Section 1).
Banks raise non-preferred senior debt
Banks that are particularly important to the financial system will not be wound up if they are failing. Instead, they will be recapitalised without recourse to taxpayer funds (see "New minimum requirement for own funds and eligible liabilities (MREL)"). Finanstilsynet has classified 14 Norwegian banks as particularly important in this context. To meet the minimum requirement for own funds and eligible liabilities (MREL), these banks now issue what are referred to as non-preferred senior liabilities, ie bonds with lower priority than ordinary senior liabilities but higher priority than subordinated debt. Under the new regulatory framework expected to be introduced in 2022, the requirement for non-preferred senior liabilities will be more lenient than the current Norwegian rules. By the beginning of 2024, for banks that are subject to these requirements, non-preferred senior debt must account for between 1.5% and 2% of their total balance sheets.10 Banks are well on their way to reaching this target. The amount of non-preferred senior debt held by banks will have an impact on how other capital requirements function during downturns (see "Relaxation of risk-weighted capital requirements and MREL from buffer requirement reductions").
Transition to new reference rates
From 2022, Libor will be replaced by new reference rates in several currencies. In Norway, the regulation of Nibor has strengthened over the past year, although important advances have been made for the introduction of Nowa, the alternative NOK reference rate (see "Transition to new reference rates". The fact that parties are well-prepared to use new reference rates promotes financial stability.
New minimum requirement for own funds and eligible liabilities (MREL)
The financial crisis showed the importance of the ability to deal with problem banks without recourse to taxpayer funds. This means that banks’ shareholders and creditors are to bear the cost of bank resolution, referred to as “bail-ins”. The authorities have therefore introduced requirements for banks to hold sufficient regulatory capital and liabilities that can quickly be written down or converted to new equity, which in Europe is called the minimum requirement for own funds and eligible liabilities (MREL). The purpose of MREL is to ensure that banks and the authorities are able to forestall or resolve crises efficiently and in a timely manner, without the taxpayers having to bear the losses. Timely intervention is intended to ensure that the resolution of important banks can proceed without operational disruption.
Smaller banks, which the bank resolution authorities intend to wind up if they fail, do not need to hold capital and liabilities that can be converted to new equity. For these banks, it is sufficient to satisfy the capital requirements.
The current Norwegian MREL rules entered into force on 1 January 2019 and are based on the original Bank Recovery and Resolution Directive (BRRD) from 2014 and a Commission Regulation from 2016. New MREL rules are being implemented in the EEA through the EU banking package from 2019. The new recovery and resolution directive, called BRRD II, will be introduced in Norway in the course of 2022.1 Finanstilsynet has decided that the MREL decisions for relevant Norwegian banks, to be taken at the end of 2021, will be based on BRRD II.
Under BRRD II, MREL depends on the banks’ size and systemic importance. Banks with total assets greater than EUR 100bn that are not globally systemically important (G-SIIs) are referred to as Top Tier banks. Banks with total assets less than EUR 100bn, but that nonetheless would pose a systemic risk if they fail, are referred to as Fished banks.
Subordinated MREL
BRRD II introduces rules for how much of MREL must be subordinated to ordinary senior liabilities, “subordinated MREL”. Since the bank’s shareholders and creditors bear the losses from a bail-in, it is an important principle that no creditor or shareholder is left worse off from a bank resolution than they would have been from an insolvency. This is referred to as the no creditor worse off (NCWO) principle. More subordinated liabilities make it less probable that the bank resolution authority will breach the NCWO principle.
The new rules contain a number of absolute minimum requirements for subordinated MREL. Subordinated MREL must at the outset be at least 8%2 of a bank’s total liabilities and own funds (TLOF), at least 5% of the leverage ratio exposure measure (LREM)3 and at least 13.5% of the total risk exposure amount (TREA). Leverage-based and TLOF-based subordinated MREL may be satisfied with all regulatory capital, including capital used to satisfy the buffer requirements, and liabilities that are subordinated to ordinary senior liabilities. Capital used to satisfy the buffer requirements may not be used to satisfy risk-based subordinated MREL of 13.5%.
For Fished and Top Tier banks, the bank resolution authorities may calculate subordinated MREL using a prudential formula that is two times the total minimum requirements under Pillars 1 and 2 plus all buffer requirements, that is:
Risk-based subordinated MREL (prudential formula) = 2 ˙ (P1 + P2) + CBR,
where P1 and P2 are Pillar 1 and Pillar 2 requirements, respectively, CBR is the combined buffer requirement (capital conservation buffer, systemic risk buffer, systemic importance buffer and the countercyclical capital buffer).
Unlike risk-based subordinated MREL of 13.5%, the prudential formula may be satisfied with buffer capital. In principle, the prudential formula may only apply to 30% of banks that are Fished or Top Tier, but the bank resolution authority is empowered to increase this percentage if it wishes to address country-specific conditions in the banking sector. Based on the Ministry of Finance’s consultation document for the EU banking package from 2020, between 30% and 100% of such banks in Norway will be subject to a requirement according to the prudential formula.4
Total required amount
In addition, the new rules continue to require that MREL is calculated as the sum of a loss absorbency amount and a recapitalisation amount, plus a market confidence buffer. These are referred to all together as the total required amount or total MREL. In most cases, total MREL will be higher than subordinated MREL. This means that most banks will be able to use some ordinary senior liabilities to satisfy total MREL.
Total MREL is calculated according to a risk-based method (risk-based total MREL) and a leverage-based method (leverage-based total MREL), which must both be satisfied at all times:
•Risk-based total MREL is calculated as two times the total minimum capital requirement under Pillars 1 and 2, plus the combined capital buffer requirement, less the countercyclical capital buffer (CCyB), ie:
Risk-based (total) MREL = 2 ˙ (P1 + P2) + CBR – CCyB,
In addition, the new rules introduce an absolute minimum risk-based total MREL for Top Tier and Fished banks5 of at least 13.5% of TREA.
•Leverage-based total MREL is calculated as two times the leverage ratio requirement. The absolute minimum leverage-based MREL under the new rules is 5% of LREM for Top-Tier and Fished banks.6
Since leverage-based total MREL and subordinated MREL, unlike risk-based total MREL, may be satisfied with capital used to meet the buffer requirements, banks’ ability to use buffer capital is subject to greater restriction if leverage-based MREL is binding (see "Relaxation of risk-weighted capital requirements and MREL from buffer requirement reductions").
1 See: “Directive (EU) 2019/879 of the European Parliament and of the Council of 20 May 2019 amending Directive 2014/59/EU as regards the loss-absorbing and recapitalisation capacity of credit institutions and investment firms and Directive 98/26/EC”, 20 May 2019.
2 The bank resolution authority may not draw on the bank resolution fund until at least 8% of TLOF has been subject to a bail-in. The 8% minimum subordination requirement may be reduced somewhat for some banks if certain criteria are met, including if it is unlikely that there will be problems with the NCWO principle. However, for a Top Tier bank, this 8% requirement shall not result in a total subordinated MREL that exceeds 27% of TREA.
3 The LREM is often greater than total assets, inter alia because it also includes off-balance sheet obligations, eg, unused credit commitments.
4 See Ministry of Finance (2020) “Consultation – Implementation of the banking package etc”, 6 January 2020 (in Norwegian only).
5 For global systemically important financial institutions (G-SIIs), the risk-based total MREL is 18% of TREA. There are no G-SIIs in Norway.
6 For global systemically important financial institutions (G-SIIs), the leverage-based total MREL is 6.75% of LREM. However, there are no G-SIIs in Norway.
1 Period: Week 32 2015 – week 44 2021. Premium on bonds issued by large banks and mortgage companies in the Norwegian market.
2 In addition, an unlimited guarantee applies for up to 12 months for certain types of deposit, certain life events, insurance payouts and certain forms of compensation (see Government’s website.)
3 See Financial Stability Report 2020, page 26.
4 In addition to additional liquidity monitoring metrics (ALMM), which is a detailed reporting standard.
5 As a share of total customer deposits and issued securities.
6 The liquidity stress test is a cash flow analysis of inflows and outflows from assets, liabilities and off-balance sheet items. The analysis is based on the stress scenario in LCR and banks are considered illiquid when expected outflows exceed the sum of expected inflows and sales from the liquidity portfolio. The analysis is conducted for nine of the largest Norwegian banks.
7 Nine of the largest banks in Norway. Stress scenario based on LCR.
8 Nine of the largest banks in Norway. Stress scenario based on LCR.
9 This applies to banks and mortgage companies with EUR or USD as significant currencies. Banks that do not have EUR or USD as significant currencies are not subject to a minimum LCR requirement in NOK. See Finanstilsynet’s webpage on liquidity for more information (Norwegian only).
10 See Andersen, H., C.H. Haugen, J. Johnsen, L. Turtveit and B. Vale (2021) “How do different bank capital requirements function in bad times?”. Forthcoming Staff Memo. Norges Bank.
2.2 Profitability
Profitability is banks’ first line of defence against losses. Bank profitability has normalised over the past year following a weakening at the beginning of the pandemic. In 2021 Q3, return on equity for the largest Norwegian banking groups was close to the average for the past decade (Chart 2.4), primarily owing to lower credit losses (Chart 2.5).
Chart 2.4 Bank profitability has normalised11 Return on equity. Percent 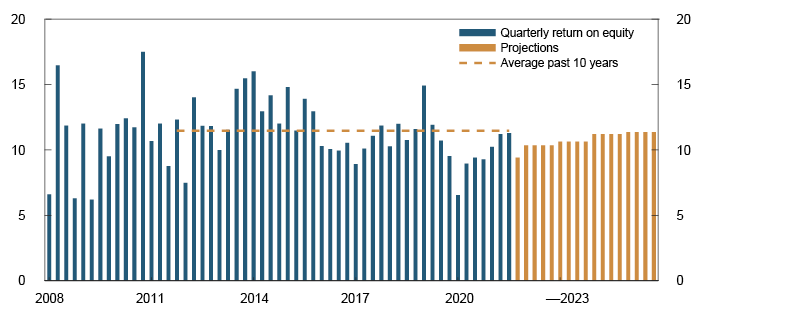
Chart 2.5 Improvement in bank profitability due to lower credit losses12 Contributions to change in return on equity. Four-quarter moving average. Percentage points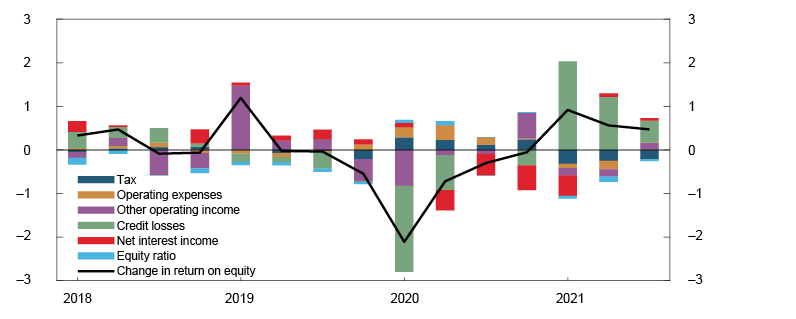
Higher interest rates will improve profitability
Weak developments in net interest income13, which is the most important income source for Norwegian banks, have lowered profitability during the pandemic. A historically low interest rate level reduces net interest income from the portion of the loans financed by equity and the portion financed by deposits. All loans are in part financed by equity. Since banks do not pay interest on equity, the reduction in income from lower lending rates will not be compensated for by lower interest expenses on this financing. On the other hand, the profitability of the portion of loans financed by deposits is largely influenced by the interest margin, ie the difference between lending and deposit rates. In spring 2020, when Norges Bank reduced the policy rate to 0% in response to the pandemic, banks reduced lending rates by more than deposit rates and the interest margin fell as a result (Chart 2.6).
Chart 2.6 Low interest rates weaken the interest margin14 Sample of banks and mortgage companies. Percent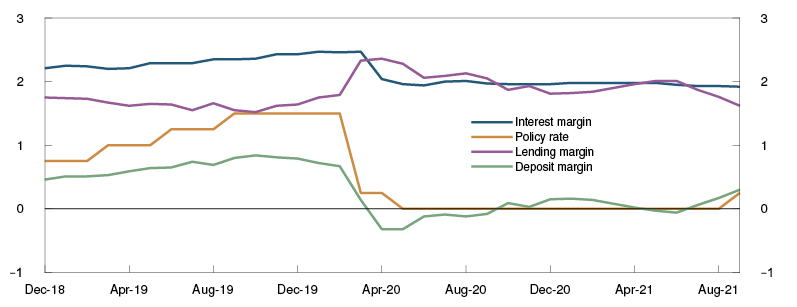
The fall in the interest margin reflects a lower deposit margin, ie the difference between deposit and money market rates (Chart 2.6). Banks are reluctant to set deposit rates below zero because depositors may prefer to withdraw their deposits if they are charged for keeping them in the bank. The low level of interest rates has therefore contributed to the smaller reduction in banks’ deposit rates than in banks’ lending rates.
The effect of low interest rates on net interest income has been dampened by lower wholesale funding prices. In addition, banks have compensated for some of the decline in deposit margins by increasing their lending margins. But lending margins have fallen back since June 2021 and are now broadly at pre-pandemic levels.
The competition for lending limits how far lending margins can be increased. An analysis conducted by Norges Bank also indicates that greater competition can reduce the correlation between the lending margin and the risk of loan losses.15 This can weaken banks’ first line of defence against losses.
There are a number of factors that may increase lending competition. Technological advances have simplified comparing loan conditions and changing banks, particularly for household loans. Bond market developments may have also put some pressure on corporate lending rates. Since corporate bond risk premiums are low, more firms may prefer bond funding to bank loans if banks raise lending margins. Pressures on lending margins and capital requirements for bank loans may also make it more profitable for banks to arrange bond issues than to extend corporate loans. In recent years, the volume of firms’ debt securities has increased more than their bank debt, and DNB and the other large Nordic banks have increased their market shares in arranging fixed income issues.
Looking ahead, banks’ net interest income is projected to increase in line with the projected rise in the policy rate in Monetary Policy Report 3/21. This will in isolation improve banks’ profitability. In August, DNB Markets conducted a survey among the 50 largest Norwegian banks. Of the banks in the survey, 72% expect their interest margin to increase in the coming year, primarily owing to a higher deposit margin. Certain calculations indicate that a 1 percentage point rise in the policy rate in isolation can increase banks’ net interest income by approximately 10% and return on equity by over 1 percentage point.16 In addition, credit growth is expected to hold up, which will increase net interest income.
Credit losses have fallen
Increased credit losses pulled down the return on equity of the large Norwegian banks in 2020, but lower losses have improved profitability in recent quarters (Charts 2.5 and 2.7).
Chart 2.7 Credit losses have fallen to low levels17 Credit losses as a share of lending. Annualised. Percent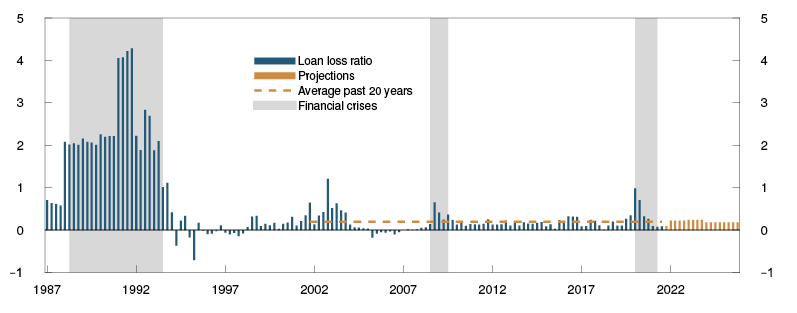
Credit losses so far in 2021 have been lower than what both Norges Bank and market participants had expected, with reversals of earlier impairment losses making a substantial contribution. An important reason for the reversals is probably that banks have revised up their macroeconomic forecasts. Accounting rules for impairment recognition, IFRS 9, require banks’ impairment losses to be based on more forward-looking assessments than under the previous standard (IAS 39). Under IFRS 9, banks must therefore adjust impairment recognition to changing economic prospects to a greater degree.
Credit losses ahead are expected to remain close to the average for the past 20 years (Chart 2.7). Financial reporting data for 2020 indicate that the corporate sector has drawn little on its financial buffers during the pandemic. In addition, oil and gas prices are now at a higher level than before the pandemic broke out. This dampens banks’ risk of losses on oil-related exposures. Moreover losses on exposures to other industries are not expected to be high. Banks’ exposures to industries that have been hard hit by the pandemic are modest. Banks also have modest corporate exposures owing to deferred direct and indirect taxes. The phasing out of pandemic-related support measures is unlikely to result in many bankruptcies ahead.18 Owing to uncertainty about the evolution of the pandemic, the outlook for losses is somewhat more uncertain than normal.
Norwegian banks’ operating costs are low
In recent decades, Norwegian banks have markedly reduced operating costs (Chart 2.8), in part by automating and digitalising operations.19 Pandemic-related restrictions may have led to increased digital customer contact and further accelerated digitalisation. For example, a survey conducted by the Finance Industry Authorisation schemes shows an increase in the share of new residential mortgage loans granted both wholly and partly online during the pandemic.20 In addition, banks’ travel, entertaining and training expenses have fallen. A number of Norwegian banks have also implemented other cost-cutting measures during the pandemic. This may reduce costs in the longer term, but in the short term they may be a source of restructuring costs, such as severance packages and investment in new technology. The results of DNB Markets’ survey show that most banks will not downsize or close branches in the year ahead. In addition, most expect to maintain or increase investment in digital solutions.
Chart 2.8 Norwegian banks’ operating expenses are low21 Banks’ operating expenses. Percent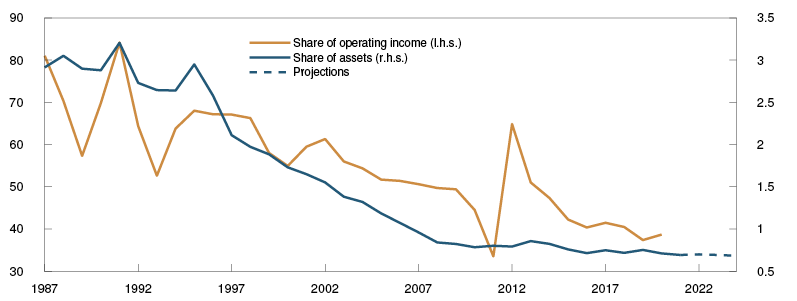
Looking ahead, banks’ cost-to-assets ratios are projected to increase slightly in 2022. A slight fall in cost-to-assets ratios is projected thereafter as banks reap the benefits of increased digitalisation.
11 Period: 2008 Q1 – 2025 Q4. Largest Norwegian-owned banking groups. Projections from 2021 Q4.
12 Period: 2018 Q1 – 2021 Q3. Estimated contributions. For the largest Norwegian-owned banking groups. Weighted moving average of annualised return after tax.
13 Net interest income is primarily interest income from lending less interest expenses from eg, deposits and wholesale funding.
14 Period: December 2018 – September 2021.
15 See Müller, C., H. Andersen and R. Juelsrud (2021) “Risk-based pricing in competitive Norwegian banking markets”. Working Paper (forthcoming). Norges Bank.
16 In the calculations, a 1 percentage point rise in the policy rate is assumed to increase lending and deposit rates by 0.8 and 0.6 percentage point, respectively. Average interest rates on other interest-bearing assets and liabilities are assumed to increase by 1 percentage point.
17 Period: 1987 Q1 – 2025 Q4. Preliminary data for 2021 Q3. Projections from 2021 Q4 for the macro bank, which is a weighted average of DNB Bank, SpareBank 1 SR-Bank, Sparebanken Vest, SpareBank 1 SMN, Sparebanken Sør, SpareBank 1 Østlandet, SpareBank 1 Nord-Norge, Sbanken and Sparebanken Møre. All banks and mortgage companies in Norway to 2021 Q3.
18 Norges Bank’s analyses indicate that discontinuation of the support scheme for deferred VAT payments will not lead to a higher number of bankruptcies than the historical average. See Hjelseth, I.N., B.H. Vatne and H. Solheim (2021) “Inndriving av utsatt merverdiavgift vil neppe utløse en konkursbølge” [Collection of deferred VAT will hardly trigger a wave of bankruptcies]. Blog post published on the Bankplassen blog, 17 June 2021. Norges Bank (Norwegian only)
19 See Andersen H. (2020) “The cost efficiency improvement of Norwegian banks can be explained by automation and digitalisation”. Staff Memo 9/2020. Norges Bank.
20 The Finance Industry Authorisation schemes (2021): “Forbruker- og finanstrender 2021” [Consumption and financial trends 2021] (Norwegian only).
21 Period: 1987 – 2024. Projections for 2021 - 2023.
2.3 Solvency
Norwegian banks are solvent and satisfy the capital requirements by a solid margin. This strengthens banks’ resilience to higher losses and gives them the flexibility to lend to creditworthy firms and households.
Banks have to meet both risk-based and leverage-based capital requirements. The authorities set risk-based capital requirements measured by Common Equity Tier 1 (CET1) capital, Tier 1 capital and regulatory capital. The risk-weighted requirements are intended to ensure that banks’ capital is sufficient relative to the risk of losses, so that banks with risky assets must hold more capital than banks with safer assets. This can improve banks’ risk management. If the underlying risk weights do not reflect the banks’ overall risk of losses, the risk-weighted requirements can give the impression of better loss absorbing capacity than is actually the case. The leverage ratio requirement is not dependent on the assets’ risk of losses and therefore functions as a backstop for the risk-based requirement. The leverage-based requirement will normally not be binding for banks. All Norwegian banks must meet a minimum leverage ratio requirement of 3% plus a leverage buffer requirement of at least 2%. Systemically important banks must have an additional buffer of at least 1%.
Following the financial crisis, tighter capital requirements have contributed to an increase in banks’ capital ratios (see Chart 2.9 and Norway’s Financial System 2021). Common Equity Tier 1 (CET1) capital ratios (risk-weighted) increased in 2019 in particular, when the removal of the Basel I floor in Norway occurred at the same time as the reduction in risk-weighted assets for exposures to small and medium-sized enterprises (SMEs), known as the SME discount. The reduced risk-weighted assets, ie the denominator in the capital adequacy ratio, contributed to a 2 percentage point increase in the CET1 ratio. The regulatory change did not affect loss-absorbing capacity or leverage ratios.
Chart 2.9 Banks’ capital ratios have risen22 All Norwegian banks. Percent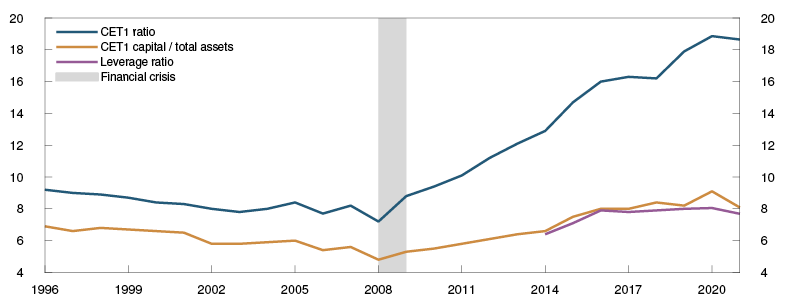
Capital requirements satisfied by wide margins
During the pandemic, restrictions on dividend distribution compelled banks to retain a large share of earnings, which has pulled up equity capital and thus capital ratios. Together with the reduction in the countercyclical capital buffer, this has enabled banks to meet their own capital targets by wide margins (Chart 2.10). Banks’ capital targets are in part based on risk-weighted CET1 capital ratio requirements and Finanstilsynet’s assessment that banks should hold a margin in the form of CET1 capital over and above the total CET1 requirement.
Chart 2.10 Banks satisfy their capital targets and capital requirements by an ample margin23 Largest Norwegian-owned banking groups. At 2021 Q3. Percent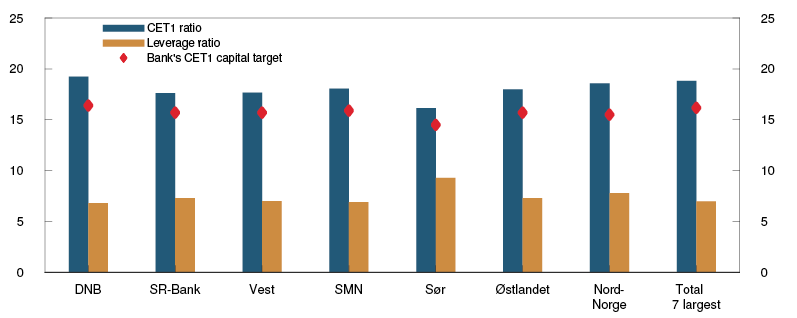
The leverage ratio has remained approximately unchanged in recent years. Banks are well above the leverage requirement, and Norwegian banks also have higher leverage ratios than the large Nordic banks. The leverage requirement will become less effective as a backstop when the EU’s Capital Requirements Regulation II (CRR II) is implemented in Norway because the leverage-based buffer requirements cannot be retained in their current form under CRR II.
Several factors are expected to contribute to a slight fall in risk-weighted capital ratios over the coming years (Chart 3.5). Dividend restrictions were lifted at the end of September 2021, which means that banks will likely distribute a larger share of profits. In isolation, this will pull capital ratios down. In addition, new requirements for internal ratings-based (IRB) models may reduce capital ratios.24 On the other hand, CRR II will reduce risk-weighted exposures to SMEs and infrastructure projects (see box below), which will limit the decline in capital ratios for most banks.
New capital adequacy regulations reduce banks’ risk-weighted assets
Banks must meet capital adequacy requirements. Banks’ capital adequacy is calculated as capital as a percentage of risk-weighted assets.

Capital adequacy regulations in Norway are subject to EU rules. Rules adopted by the EU with EEA relevance are incorporated into the EEA Agreement and implemented in Norwegian law. The EU has adopted a new capital framework (CRR II) that will likely apply to Norwegian banks in the course of 2022. CRR II introduces new capital requirement discounts for portions of banks’ exposures that reduce risk-weighted assets. The discounts increase reported capital ratios without improving actual solvency.
CRR II includes three capital requirement discounts:
•Risk-weighted exposures to infrastructure projects are reduced by 25%.
Risk-weighted exposures to small and medium-sized enterprises (SMEs)1 are reduced by two discounts.
•The existing discount reduces the capital requirement for exposures of up to EUR 1.5m by 23.81%. The new discount raises the maximum exposure limit to EUR 2.5m.
•A new and smaller SME discount of 15% will be introduced for exposures exceeding EUR 2.5m.
In the consultation document on the EU banking package, it was assumed that the expansion of the SME discount could increase Common Equity Tier 1 (CET1) capital by between 0.3 and 0.8 percentage point for larger banks.2
1 The capital adequacy regulations define SMEs as enterprises with a maximum of 250 employees, a maximum annual turnover of EUR 50m and/or a maximum balance sheet of EUR 43m.
2 See Ministry of Finance (2020) “Høring – gjennomføring av bankpakken mv.” [Consultation – implementation of banking package etc]. 6 January 2021 (in Norwegian only).
22 Period: 1996 – 2021. Preliminary data for 2021 Q3. Norwegian banks. Common Equity Tier 1 (CET1) capital ratio with Basel 1 floor 2007 - 2019. Leverage ratio from 2014. The highest level of consolidation is used.
23 Total 7 largest banks is a weighted average of the seven banks shown in the chart. Capital targets are defined here as regulatory requirements at 30 June 2022 with a 1 percentage point margin above the capital requirements.
24 See Finanstilsynet (2021): “Krav til IRB-modeller i banker, kredittforetak og finansieringsforetak” [Requirements for IRB models for banks, mortgage companies and finance companies]. Circular 3/2021 (in Norwegian only).
Transition to new reference rates
Libor will be replaced by new reference rates for several currencies from 2022. New reference rates abroad can result in greater use of Nowa as an NOK reference rate. Over the past year, the work to facilitate the increased use of Nowa has made considerable progress while the regulation of Nibor has been strengthened.
Libor will be discontinued from the beginning of 2022
The work to begin using new reference rates has continued both internationally and in Norway. From the beginning of 2022, the London Interbank Offered Rate (Libor) will cease to exist as a reference rate for GBP, CHF, EUR and JPY, and will be replaced with near risk-free overnight rates. For USD, Libor will continue to be published for certain maturities up until the end of June 2023.
In summer 2021, the European Commission decided to recognise the Norwegian Interbank Offered Rate (Nibor) as a critical benchmark under the EU’s Benchmarks Regulation. The Regulation lays down stricter requirements for administrators and panel banks that quote Nibor. Among other things, Finanstilsynet can require panel bank submissions during a transition period of up to two years. The regulation also requires an annual independent audit of the administrator. This may strengthen confidence in Nibor, which is currently the most important NOK reference rate. The transition to near risk-free overnight rates in other countries may nevertheless lead to reduced willingness among market participants abroad to be exposed to Nibor in derivatives, bonds and other financial contracts. Over the past year, important advances have been made for the transition to the Norwegian Overnight Weighted Average (Nowa), the alternative NOK reference rate.
Establishing market standards for Nowa
Nowa and the other new reference rates are typically near risk-free overnight rates.1 They differ from ibor rates, which are forward-looking rates quoted at different maturities. In order to replace ibor rates with overnight rates, it has been necessary to establish new common market standards for, inter alia, the calculation of periodic interest rates. In 2020, two working groups comprising members from the Norwegian financial industry were created that have assessed different aspects regarding the use of Nowa as a reference rate2. One of the working groups has, for example, drafted market standards for using Nowa in financial contracts. The working group submitted recommended standards in December 2020 and has since worked on incorporating these into new and existing contracts for bonds, derivatives and loan agreements.
The other working group’s focus is establishing an interest rate derivatives market with Nowa as the benchmark, known as an overnight index swap (OIS) market. A well-functioning market for interest rate derivatives enables participants to adjust their interest rate risk in contracts with Nowa as the benchmark. Participants also have the option to speculate on the level of the policy rate without being exposed to banks’ credit and liquidity risk. Over the past year, important work has been done to establish agreements and market makers in this market. In October, bilateral trades in small volumes began, and activity is expected to pick up when LCH will be ready to offer clearing of such OIS contracts in the first half of 2022.
Prospects for more robust reference rates
Substantial work has been done to facilitate both the transition to Nowa as a reference rate and the establishment of Nowa as the fallback rate in Nibor contracts. It provides more options and reduces risk for users of NOK reference rates. In addition to the ongoing efforts of the working groups, preparations for the use of Nowa must be made by individual users. It is up to market participants to use the rate.
1 See box on page 31 in Financial Stability Report 2020.
3 Stress test and the usefulness of banks’ capital buffers
Solvent banks are essential for financial stability. If the recovery in the Norwegian economy were to shift to a deep downturn, it is important that banks have sufficient capital that can be used to maintain lending standards so that banks do not amplify the downturn. Norwegian banks have available reserves in large capital buffers and satisfy the capital requirements by an ample margin, but the stress test shows that weak developments in commercial real estate (CRE) and other industry-specific shocks could result in banks tightening lending and amplifying a downturn.
3.1 Stress scenario
The purpose of the stress test is to assess whether banks’ capital ratios will be sufficient so that they do not amplify a macroeconomic downturn. The analyses are done with the help of a model framework where banks are affected by, and they themselves affect, economic developments.1 In order for banks to be able to meet credit demand and maintain other important functions in a downturn, banks must have sufficient capital. The stress test and the analyses on which the stress test is based are part of the basis for Norges Bank’s decisions and advice on banks’ capital buffer requirements.
Crisis depth depends on economic vulnerabilities
The stress test is based on the current situation and a normalising Norwegian economy in line with the baseline scenario (Chart 3.1). The baseline scenario for activity in the Norwegian economy reflects the projections in Monetary Policy Report 3/21.
In the stress test, the economy is exposed to large shocks that are amplified by vulnerabilities in the Norwegian financial system. Crisis depth in the stress scenario is calibrated given the Bank’s vulnerability assessment, which is partly based on the Growth-at-Risk framework (see "A broad set of indicators indicates medium cyclical vulnerabilities").
Overall vulnerabilities are now assessed to be broadly at the same level as before the pandemic and clearly lower than prior to the financial crisis in 2008 and the banking crisis at the end of the 1980s.
The stress scenario describes a pronounced, but not unlikely, downturn in the Norwegian economy. The downturn is assumed to be the outcome of lower growth abroad, global financial market stress and falling oil prices (Table 3.1). Norway is a small open economy and international developments contribute to a pronounced domestic downturn. Property prices are assumed to fall sharply, and the stress pushes up both the risk premium on the Norwegian krone and banks’ funding costs. The money market premium rises sharply in 2022 Q1 before gradually falling back. The macroeconomic downturn results in a substantial fall in commercial property rents. Heightened uncertainty and reduced risk appetite lead to a marked rise in the yield, which contributes to a near halving of commercial property selling prices2 in the stress period. A decline in income and house prices prompts households to tighten consumption, and domestic demand falls.
History has shown that the effects of deep economic downturns are generally uneven, and in the 2021 stress test, the Bank has chosen to highlight the petroleum-related shipping segment as an example of a sector that could be hard hit. This sector could face substantially lower demand in a deep global downturn with lower oil prices and an increased focus on climate change.
Vulnerabilities associated with high house prices amplify the downturn. In the stress scenario, it is assumed that house prices fall by a good 25%, partly as a result of reduced income expectations and higher lending rates. Since the policy rate is already very low, monetary policy can only to a limited extent contribute to lower lending rates. High debt ratios combined with a shortage of liquid assets make households vulnerable to a sharp fall in house prices, even though savings in the form of bank deposits rose during the pandemic. High leverage for many households amplifies the fall in consumption in the stress scenario. In addition, a weak housing and CRE market results in lower construction activity. Compared with the baseline scenario, the stress scenario implies a GDP level that is more than 8% lower at the end of 2024 (Table 3.1 and Chart 3.1).
Table 3.1 Macroeconomic aggregates in the stress scenario.1 Percentage change from previous year2
|
2021 |
2022 |
2023 |
2024 |
2025 |
|
|
Mainland GDP |
3.9 |
-1.6 |
-1.9 |
2.0 |
1.6 |
|
Private consumption |
4.0 |
-1.2 |
-0.6 |
1.1 |
1.6 |
|
Registered unemployment (rate, level) |
3.1 |
5.2 |
6.9 |
6.5 |
6.4 |
|
Three-month Nibor (level) |
0.5 |
1.0 |
0.8 |
0.7 |
0.5 |
|
Weighted premium above Nibor for covered bonds and senior bonds (level)3 |
0.5 |
0.8 |
0.9 |
0.8 |
0.8 |
|
House prices |
9.2 |
-15.0 |
-13.2 |
0.0 |
2.9 |
|
Selling prices for commercial property4,5 |
8.9 |
-27.9 |
-20.8 |
-9.5 |
2.8 |
|
Rents for commercial property4 |
-16.4 |
-17.1 |
-6.4 |
3.2 |
|
|
Credit (C2) to households |
4.8 |
-0.8 |
-0.4 |
-0.9 |
1.4 |
|
Credit (C2) to mainland NFCs6 |
4.9 |
-4.7 |
-0.4 |
-0.9 |
1.9 |
|
Credit losses (rate, level) |
0.0 |
1.5 |
2.0 |
1.5 |
1.2 |
|
Oil price (USD/barrel, level) |
69 |
58 |
51 |
54 |
56 |
1 As a technical assumption, the CCyB is kept at 1% in 2022–2025.
2 Unless otherwise stated. Level variables measured as annual averages. Projections for 2021 Q3–2021 Q4 for mainland GDP, unemployment, three-month Nibor, house prices, household credit (C2) and oil price taken from Monetary Policy Report 3/21.
3 It is assumed that a higher market premium will only affect new bonds.
4 Rents and selling prices for prime office space in Oslo.
5 Selling prices are calculated as rental prices divided by yield.
6 NFCs are non-financial corporations.
Sources: Eiendomsverdi AS, Entra, Finn.no, JLL, Norwegian Labour and Welfare Administration (NAV), Real Estate Norway, Statistics Norway and Norges Bank
Chart 3.1 Crisis depth reflects vulnerabilities3 GDP in the stress scenario and baseline scenario. Index. 2021 = 100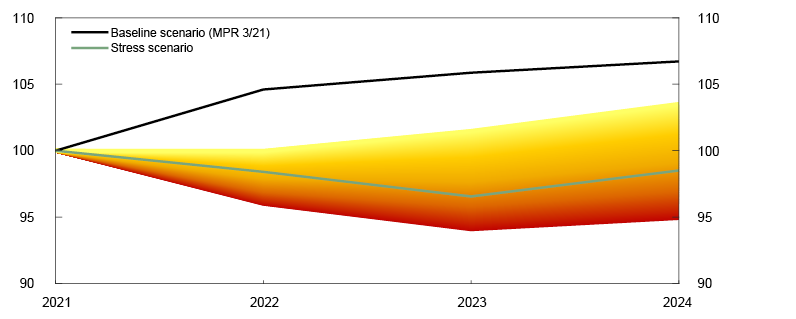
The stress scenario is not a forecast of how the economy will develop in the event of a pronounced downturn, but describes potential developments given Norges Bank’s assessment of vulnerabilities in the Norwegian financial system. As a technical assumption, the policy rate is set to 0% and remains at 0% until the end of the stress period, while it is assumed that extraordinary fiscal policy measures are not implemented.
1 Andersen, H., K.R. Gerdrup, R.M. Johansen and T. Krogh (2019) “A macroprudential stress testing framework”. Staff Memo 1/2019. Norges Bank.
2 Commercial property selling prices are estimated as rental prices divided by yield.
3 Yellow and red areas indicate potential GDP paths in the stress scenarios. Paths with a sharper fall in GDP (lower index) coincide historically with greater financial vulnerabilities (deeper red).
3.2 Banks’ credit losses
In the stress scenario, banks’ losses increase significantly, driven to a great extent by the fall in residential and commercial property prices. At their highest, total credit losses are at 2% of lending (Chart 3.2), which is lower than during the banking crisis at the beginning of the 1990s, but higher than during the financial crisis.
Chart 3.2 Losses depend on crisis depth4 Losses as a percentage of loans, total and by sector. Stress scenario and baseline scenario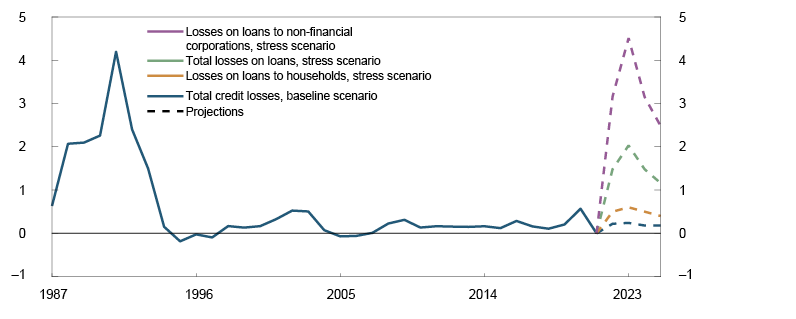
In the household sector, the fall in house prices and higher unemployment result in higher credit losses in line with historical experience. Estimated corporate credit losses are based on a combination of micro-level analyses of firms and historical relationships between weak growth and credit losses in Norway and globally.5 This results in total credit losses as a percentage of corporate lending of 4.5% in 2023 (Chart 3.2).
Particularly sharp falls in specific industries result in substantial losses on banks’ corporate loans
In order to estimate banks’ losses on corporate loans, the macro scenario from the stress test is incorporated into Norges Bank’s framework for expected losses.6 The framework differentiates between falls in activity across industries. Developments in earnings are then calculated for each firm, based on the relevant industry and given firm-specific data. Firms’ bank loans are linked to lender banks. Finally, we examine the impact of losses on these loans on the macro bank, which is a weighted average of nine large Norwegian banks.7 The framework makes it possible to take into account Norwegian banks’ actual exposures and link the loss projections to the specific downturn affecting the economy. If capital-intensive industries are severely affected, losses increase because firms in such industries typically borrow more than those in other industries from both banks and other sources. In the stress test, the fall in property prices and earnings problems in the shipping sector are important loss drivers (Charts 3.3 and 3.4).
Chart 3.3 CRE and construction dominate losses Share of total losses on corporate exposures. Stress scenario. Estimates for 2023. Percent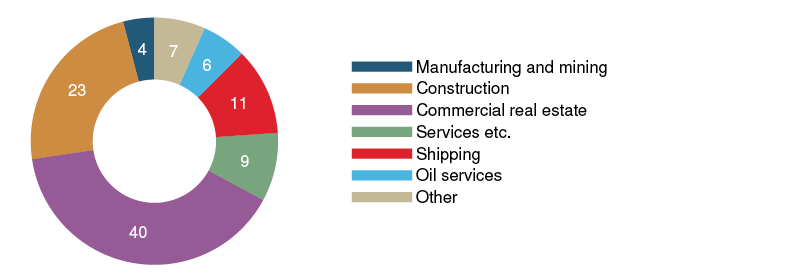
Chart 3.4 Loss rates have been high for several years8 Losses as a percentage of loans to the sector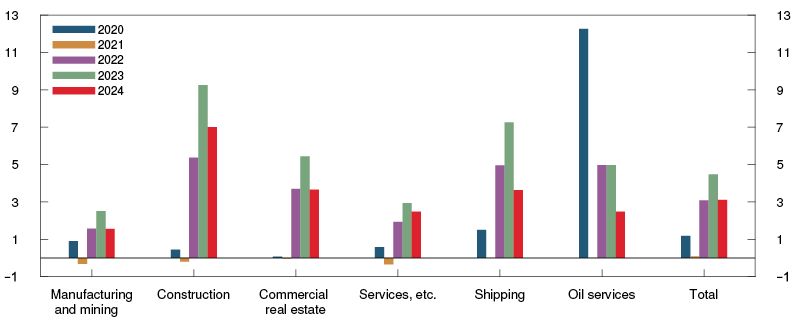
Defaults on CRE exposures increase owing to both a fall in turnover and a fall in property prices. The stress test uses information on loss given default (LGD) from Finanstilsynet’s database of banks’ corporate exposures, and this information is linked to each individual loan. As property prices remain low for a while, it is assumed in the scenario that banks’ LGD on CRE loans rises. The fall in commercial property prices dominates loss estimates in the initial years of the stress period. In the stress scenario, more than 60% of corporate credit losses in 2023 are related to CRE or construction exposures.
In addition, banks’ credit losses in the scenario increase because profitability in oil-related shipping segments gradually weakens. In the model, this is done by assuming that loans in this shipping segment are moved up one stage in the impairment assessment according to IFRS 99 during 2022. For example, loans in Stage 1 are moved to Stage 2. Later in the stress scenario, banks are assumed to place a majority of their loans in this shipping segment in Stage 3, which is the stage for loans with the highest risk of losses.
4 Period: 1987 – 2025. Projections for 2021 Q3 – 2025 Q4. Baseline scenario and stress scenario from 2022. Credit losses as a share of gross lending to sector. 1987–2020 for all banks and credit companies. 2021–2025 for the macro bank.
5 See Financial Stability Report 2019, page 36.
6 See Financial Stability Report 2020 and Hjelseth, I.N., E.A. Saxegaard, H. Solheim og B.H. Vatne (2020) “Anslag på bankenes tap på utlån til ikke-finansielle foretak” [Estimated bank losses on lending to non-financial corporations]. Staff Memo 10/2020. Norges Bank (in Norwegian only).
7 DNB Bank, SpareBank 1 SR-Bank, Sparebanken Vest, SpareBank 1 SMN, Sparebanken Sør, SpareBank 1 Østlandet, SpareBank 1 Nord-Norge, Sbanken and Sparebanken Møre. Our assumptions are based on banks’ consolidated financial reports from S&P Capital IQ in the period to 2021 Q1. We have taken account of DNB’s new group structure from 1 July 2021 only by adjusting down the level of our projections for the macro bank’s CET1 capital based on the level difference between the DNB Group and the DNB Bank Group at 30 June.
8 Period: 2020 – 2024. Projections for 2021 – 2024. Stress scenario from 2022. Losses in 2020 reflect projections of banks’ actual loss provisions in 2020. The low losses in 2021 reflect loss reversals in 2020 (see discussion in Section 2). Note that the sector breakdown of losses is based on model estimates. The stress test affects losses from 2022.
9 For more information on the stages in IFRS 9, see Financial Stability Report 2019, page 43.
3.3 Banks’ adjustment in the stress scenario
Banks’ loss-absorbing capacity is fundamentally sound. Extraordinary government measures during the pandemic have reduced banks’ credit losses, and dividend restrictions have contributed to lifting capital ratios. It is assumed that the macro bank in the baseline scenario will move to a capital target of about 17% in the long term, which is equivalent to a capital margin above total capital requirements of 1% if the countercyclical capital buffer (CCyB) is 2.5%. Capital ratios therefore fall somewhat in the baseline scenario (Chart 3.5).
Chart 3.5 Banks’ capital margin above total requirements disappears10 Macro bank’s capital requirements and CET1 ratio, baseline scenario and stress scenario. Percent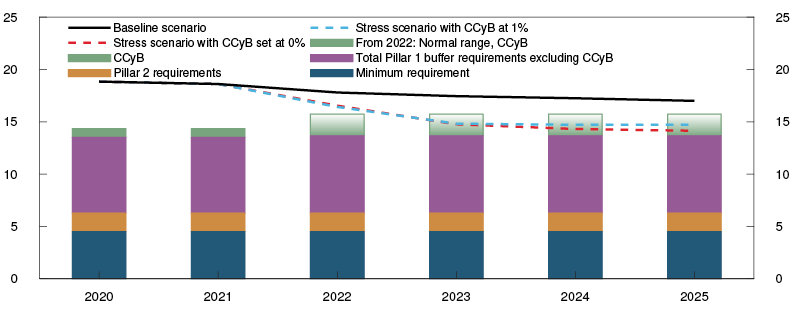
The current high capital margin above total requirements is drawn down to cover losses
Persistently weak economic activity in the stress scenario results in the loss of most of banks’ capital margin above total requirements (Chart 3.5). Credit losses are the main reason for this (Chart 3.6). Other factors also have an impact on banks’ capital ratios. Low yields are considered a key source of cyclical vulnerability (see Section 1). When the downturn affects the economy in 2022, the value of banks’ equity and bond holdings falls immediately by 40% and 5%, respectively.
Chart 3.6 Losses result in a fall in capital ratios11 Change in macro bank’s CET1 ratio and estimated contribution from different components. Percentage points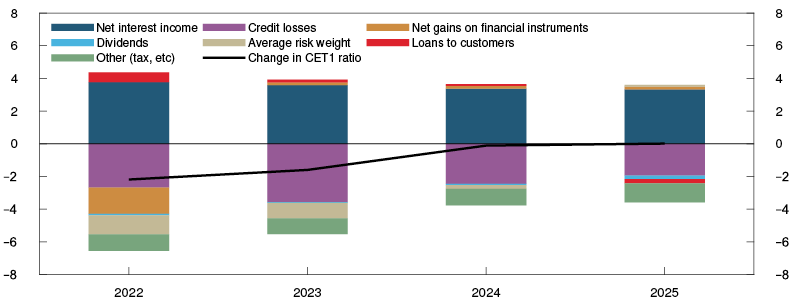
Banks will seek to maintain net interest income to curb the fall in capital ratios, and the interest margin is assumed to be roughly constant in the stress scenario. Most banks retain some profit from 2024, and it is assumed that banks will then pay out normal dividends given that their capital ratios are higher than the sum of the minimum requirements and buffer requirements.
Once the capital margin above total requirements has been used, lending standards are tightened
In the stress scenario, when losses increase and profitability falls, the macro bank responds by tightening lending standards to prevent its capital ratios from falling all the way to the minimum required. This may be because banks find that dipping into regulatory capital buffers is costly since restrictions will be triggered on dividend payments, bonuses and some other banking conditions. Initially, as a technical assumption, the CCyB is kept unchanged at the 2022 Q1 level (1%) throughout the period. Banks tightening of lending standards and lower credit demand then lead to negative credit growth from 2022 in the stress scenario (Chart 3.7).
Chart 3.7 Fall in credit growth depends on capital buffer requirements12 Credit growth in past four quarters in baseline scenario and stress scenario. Percent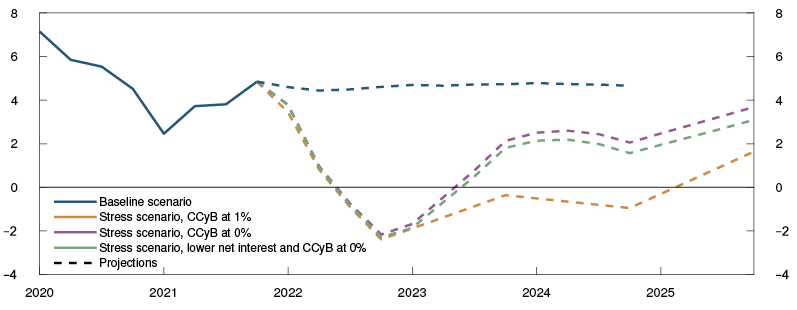
Reduced buffer requirements limit banks’ tightening of credit
The stress test shows that if the CCyB is set at 0% in 2022 instead of remaining positive throughout the period, credit growth rises (Chart 3.7). Banks can then draw on the capital to maintain lending standards without breaching the buffer requirement, and this dampens the economic downturn.
Banks’ profitability is the first line of defence against losses. The results of the stress test are therefore sensitive to net interest income assumptions. In the stress test, it is assumed that banks maintain interest margins and that this makes a positive contribution to capital ratios. However, a number of factors may make it difficult for banks to support interest margins and net interest income. For example, in the face of financial market turbulence, banks may be willing to pay more relative to the money market rate to retain deposits out of fear of liquidity problems, which will put pressure on the interest margin. If net interest income falls further through the crisis, banks’ CET1 capital ratios will fall further (Chart 3.8) and credit growth will be weaker than if interest margins are stable (Chart 3.7).
Chart 3.8 Banks dip into capital buffers if net interest income also falls13 Macro bank’s capital requirements and CET1 ratio, baseline scenario and stress scenario with lower net interest income. Percent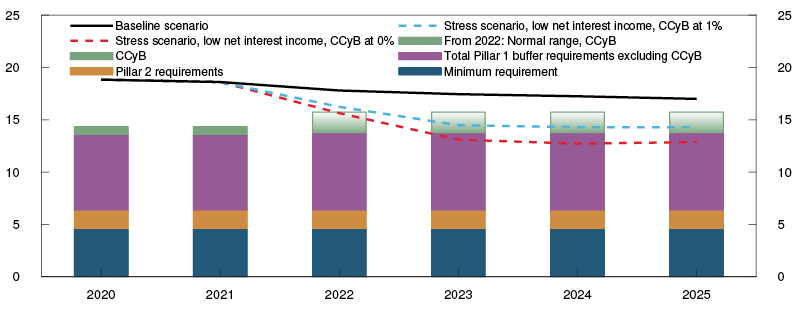
The stress test shows that banks need considerable capital buffers to maintain lending standards in the event of a downturn. The need is greater when the downturn is amplified by vulnerabilities in the Norwegian financial system. In a severe downturn, both the CCyB and the systemic risk buffer may be lowered to enable banks to maintain lending standards. The buffers can be reduced when other capital in the banking system is assessed to be sufficient to weather the downturn without threatening solvency.
Important that regulatory buffers are reduced if they are to play a useful role
Under the capital adequacy rules, capital used to satisfy regulatory buffer requirements that are not reduced may also be used in bad times. At the same time, other requirements may prevent banks from dipping into these capital buffers, particularly if the consequences of breaching other requirements are more serious than the consequences of breaching the buffer requirements. This is because the capital held by banks to satisfy the buffer requirements is also used to satisfy the leverage ratio requirement, and some of the minimum requirement for own funds and eligible liabilities (MREL) (see "Relaxation of risk-weighted capital requirements and MREL from buffer requirement reductions"). These requirements can therefore become binding if banks dip into their buffer capital. In the stress scenario, the macro bank’s leverage ratio is kept well above the forthcoming minimum requirement of 3%. This suggests that this requirement is not very close to being binding. MREL, on the other hand, might be binding. If we assume that banks adjust to MREL by a small margin14, calculations show that some of the banks in the stress scenario must use all remaining capital buffers and some of the surplus capital to satisfy MREL. Capital buffers will then not necessarily function as intended because banks must maintain capital or reduce risk-weighted assets to satisfy MREL. Banks that wish to maintain the flexibility provided by capital buffers should issue sufficient subordinated debt so that MREL does not prevent banks from using the buffers. If capital buffer requirements are reduced instead, rather than banks only being able to dip into them, the most binding MREL requirement will be reduced correspondingly and the buffers can function as intended.
10 Period: 2020–2025. Projections for 2021–2025. Stress scenario starts in 2022. Pillar 1 and Pillar 2 requirements for the banks in the stress test are weighted by their risk-weighted assets. The macro bank in the baseline scenario is assumed in the long run to adjust further to a capital target of around 17%, which corresponds with a capital margin above the overall capital requirement of 1% with the CCyB at 2.5%. Capital requirements do not include capital margin requirements.
11 Period: 2022 – 2025. Projections from 2021 Q3 – 2025 Q4. Stress scenario with CCyB at 1% in the period 2022–2025.
12 Period: 2020 Q1 – 2025 Q4. Projections for 2021 Q3 – 2025 Q4.
13 Period: 2020–2025. Projections for 2021–2025. Stress scenario starts in 2022. Pillar 1 and Pillar 2 requirements for the banks in the stress test are weighted by their risk-weighted assets. Captial requirements do not include capital margin requirements.
14 In our calculations, we assume as a starting point that before the downturn occurs, banks issue sufficient subordinated debt to satisfy the most binding MREL requirement by a margin equal to 1% of the total risk exposure amount. We also assume that banks maintain this stock of subordinated debt during the downturn.
Relaxation of risk-weighted capital requirements and MREL from buffer requirement reductions
Banks can satisfy leverage ratio (LR) requirements and much of the minimum requirement for own funds and eligible liabilities (MREL) with the same Common Equity Tier 1 (CET1) capital that they use to satisfy the risk-weighted capital adequacy and buffer requirements. If banks use more CET1 capital to satisfy the minimum LR requirement or MREL than the risk-weighted capital requirements, banks cannot dip into their capital buffers without breaching LR or MREL. This can prevent banks from using capital buffers in bad times, especially if the consequences of breaching other requirements are more serious than the consequences of breaching buffer requirements. Norges Bank has performed calculations for the largest Norwegian banks, which indicate that a number of banks can only breach some of the buffer requirements without breaching MREL. If the countercyclical capital buffer (CCyB) and other buffer requirements are reduced, MREL will be reduced correspondingly, so that the buffers can function as intended. Banks can also dip into a larger share of their capital buffers without breaching MREL if they issue sufficient non-preferred liabilities.
Capital buffers are intended as shock absorbers
Following the global financial crisis in 2008, the authorities introduced a number of buffer requirements beyond the minimum requirements for bank capital. The capital buffers are intended to make banks more resilient and function as shock absorbers against higher losses, so that banks can maintain lending and other activities in bad times without breaching minimum requirements. This can mitigate the risk that banks will amplify a downturn by tightening lending
The capital adequacy rules enable banks to use capital buffers in periods of high losses. Breaches of buffer requirements lead to restrictions on dividend distributions and other payouts. In crisis periods, some of the buffers can also be reduced, so that banks can absorb higher losses and continue to extend credit without breaching buffer requirements.
Breaches of buffer requirements may entail breaches of other requirements
Other requirements for loss-absorbing capital can prevent capital buffers from functioning as intended. In addition to minimum risk-weighted capital requirements and buffer requirements, banks must satisfy a leverage ratio (LR) requirement and a minimum requirement for own funds and eligible liabilities (MREL). The various capital requirements can be satisfied with different types of capital (Chart 3.A). Banks can satisfy the LR requirement with the same CET1 capital used to satisfy the risk-weighted requirements. The same CET1 capital can also be used to satisfy a large portion of MREL. The exception is the risk-based total required amount of MREL, which cannot be satisfied with the same CET1 capital as used to satisfy capital buffer requirements (Chart 3.A).
Chart 3.A Illustration of capital and liabilities banks can use to satisfy different capital requirements1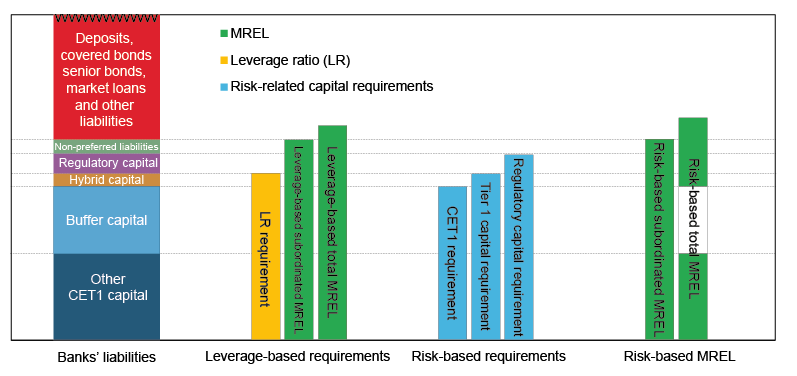
If banks use a considerable amount of CET1 capital to satisfy the minimum LR requirement and MREL, they run the risk that the capital buffers will not function as shock absorbers, because banks must maintain capital levels to satisfy LR and MREL. Chart 3.B illustrates such a situation, where banks can only reduce the purple portion of their buffer capital without breaching LR. The problem of overlap is most relevant if LR or leverage-based MREL is binding and the banks consider the consequences of breaching these requirements as more serious than the consequences of breaching buffer requirements. The same applies if risk-based subordinated MREL is binding and the banks satisfy this requirement with a narrow margin. An alternative for banks is to satisfy LR with hybrid capital and MREL with hybrid capital, subordinated debt capital or non-preferred liabilities. If banks opt to do this, LR and MREL will not prevent banks from dipping into their capital buffers.
Chart 3.B Styllised example of overlap between risk-weighted capital requirements and LR CET1 in NOK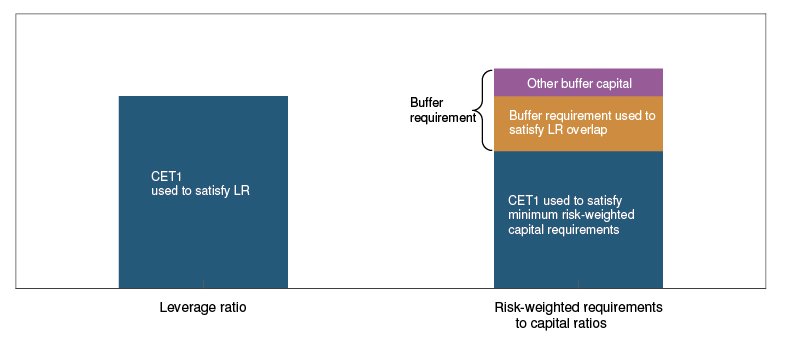
Norwegian banks can adjust so that they use a large portion of their capital buffers to satisfy MREL
Norges Bank has analysed how the different requirements for loss-absorbing capital function together and how they affect the ability of banks to use capital buffers in bad times.2 The analysis focuses on how LR and MREL will overlap with the capital buffers when the revised EU Bank Resolution and Recovery Directive (BRRD II) is fully implemented in 2024. Our starting point is banks’ balance sheets at year-end 2020. We assume that banks issue so much non-preferred liabilities that they satisfy the most binding MREL requirement with a margin equal to 1% of the total risk exposure amount (TREA). We further assume approved changes in buffer requirements, ie a CCyB rate of 1.5% and a systemic risk buffer rate of 4.5%. Moreover, we assume that banks consider the consequences of breaching MREL to be more serious than the consequences of breaching buffer requirements.
The buffer requirements are to be satisfied with CET1 capital. We therefore calculate how much CET1 capital banks use to satisfy LR and MREL. We compare this capital need with how much CET1 capital banks use to satisfy minimum risk-weighted capital requirements. If banks use more CET1 capital to satisfy LR and MREL than minimum risk-weighted capital requirements, an overlap with the buffer requirements arises. The calculations indicate a considerable overlap between the buffer requirement and MREL for the largest Norwegian banks. This means that a number of banks can only dip into a portion of their capital buffers without breaching MREL (Chart 3.C). There is also a small overlap between the buffer requirements and LR for four large Norwegian banks.
Chart 3.C Share of combined buffer requirements that can be reduced without breaching LR and MREL3 Norwegian-owned banking groups. Percent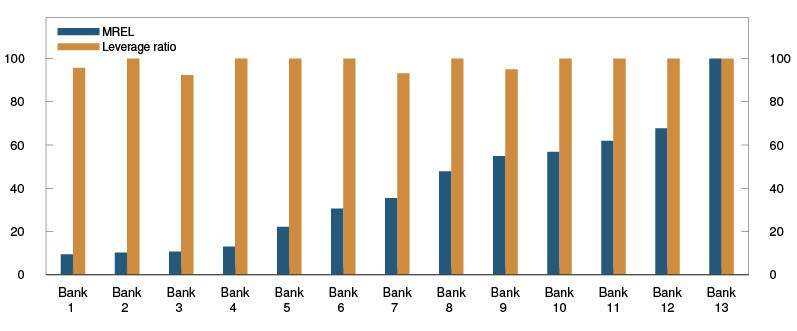
Analyses based on Norges Bank’s stress test show that the overlap between buffer requirements and MREL can increase in bad times, especially if risk weights and thus TREA increases. MREL calculated using the prudential formula accounts for a considerably larger share of TREA than the minimum risk-weighted capital requirements. When TREA increases, the stock of CET1 capital banks use to satsify the prudential formula increases more than the CET1 capital used to satisfy the minimum capital requirements, thus increasing the overlap.
Norwegian banks may benefit from reductions in buffer requirements
The effect of reductions in buffer requirements depends on whether banks also use their capital buffers to satisfy LR and MREL. If leverage-based MREL is binding and countercyclical buffer capital is used to satisfy MREL, this may prevent banks from benefiting from reductions in the CCyB requirement. The results show that risk-based subordinated MREL calculated using the prudential formula4 is the part of MREL that the largest banks will be using the most CET1 capital to satisfy. This requirement falls with reductions in the CCyB and other buffer requirements and therefore does not prevent banks from using the freed-up capital. The capital buffers are therefore able to function as shock absorbers. When the CCyB rate is reduced to 0%, the capital used to satisfy the remaining buffer requirements will be sufficient to satisfy MREL (Chart 3.D).
Chart 3.D Share of buffer capital used to satisfy LR and MREL if CCyB is reduced to 0%5 Norwegian-owned banking groups. Percent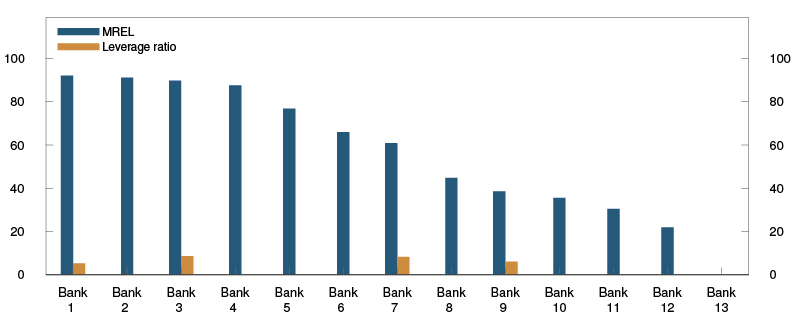
Banks should issue enough non-preferred liabilities to be able to draw on their capital buffers
MREL overlaps less with the capital buffers if banks apply a margin above MREL that is greater than 1% of TREA. If we change the assumption that banks adjust with a margin above MREL from 1% to to 6% of TREA and assume that the CCyB rate is reduced to 0%, banks can dip into a substantially larger share of the buffers without breaching MREL (Chart 3.E). This suggests that banks should issue enough non-preferred liabilities so that they can draw on the capital buffers without breaching MREL.
1 The chart illustrates banks’ funding in the far left-hand liabilities bar and banks’ capital requirements in the right-hand bars. The chart is not to scale and thus does not present an exact picture. The capital requirement bars show which types of capital can satisfy the requirement. Risk-related total MREL, at the far right, starts somewhere above the horizontal scale, to indicate that the CET1 capital used to satisfy the capital buffer requirements cannot be used to cover risk-related total MREL. Capital requirement bars extending up into the area for deposits, covered bonds and market debt can only be satisfied by the portion of the red area represented by senior liabilities.
2 See Andersen, H., C. H. Haugen, J. Johnsen, L. Turtveit and B. Vale (2021) “How do different bank capital requirements function in bad times?”. Forthcoming Staff Memo 8/2021. Norges Bank.
3 CCyB at 1.5% and margin above MREL at 1% of risk-weighted assets. Most binding MREL requirement.
4 See a further description of the prudential formula in "New minimum requirement for own funds and eligible liabilities (MREL)".
5 CCyB at 0% and margin above MREL at 1% of risk-weighted assets. Most binding MREL requirement.
4 Liquidity measures and market stress
Extraordinary loans to banks during the period of market stress in spring 2020 ensured banking sector liquidity and the transmission of the policy rate to money market rates. Nevertheless, liquidity needs increased for investment funds and other asset managers when securities prices fell and the krone depreciated. The question of whether central banks should have tools designed for securities markets and non-bank market participants for use in times of market stress is the subject of discussion internationally and in Norway.
Norges Bank’s liquidity policy instruments are aimed at banks because banks have a specific role in payment and credit intermediation. Liquidity support tools designed for securities markets and other market participants could increase the central bank’s balance sheet risk. The fundamental principles of Norges Bank’s liquidity policy and the experience gained in spring 2020 suggest that secured loans to the banking sector should continue to be the preferred instruments in periods of market stress.
4.1 Banks have a particular role in credit and payment intermediation
Banks play a key role in Norway’s financial system. Bank loans make up about 80% of all domestic credit to the private sector. Banks’ provision of credit to the private sector is matched by increased deposits by the private sector. Demand deposits are funds held in an account at a bank and are used by the general public as a means of payment. Banks are the only economic agents that can create and receive demand deposits, giving them a particularly important role in credit and payment intermediation. Demand deposits are liquid funds that are at the free disposal of depositors, while bank loans are less liquid. This exposes banks to liquidity risk. Bank lending also involves credit risk. Because they play such an important role in society, banks are strictly regulated and are subject to supervision by Finanstilsynet (Financial Supervisory Authority of Norway).
Regulatory minimum requirements with regard to capital, liquidity and stable long-term funding limit banks’ exposure to credit and liquidity risk. The motivation behind the minimum requirements is to ensure that banks are resilient to losses and remain liquid in periods of market stress without support from public authorities. The Norwegian deposit guarantee scheme that guarantees deposits up to a certain amount also dampens liquidity risk. In addition, liquidity risk can be limited by replacing deposits with fixed-term wholesale funding. Wholesale funding is normally more expensive than deposit funding and exposes banks to refinancing risk at certain times.
One of the core functions of a central bank is to provide liquidity insurance for the financial system by being lender of last resort. The aim of such liquidity insurance is to reduce the economic losses that can ensue from severe disruptions in the payment system or other financial services. Norges Bank offers liquidity insurance to banks in normal times through a standing overnight lending facility (D-loans). In addition, banks are offered loans over quarter-ends. The loans are provided against collateral in the form of high-quality securities, normally at a price higher than the policy rate. The terms for such liquidity insurance reflect the same principle as the regulatory requirements for banks. Risk must primarily be borne by banks themselves and be reflected in the pricing of bank lending and borrowing in the market. This will also limit risk on the central bank’s balance sheet.
In addition to the standing lending facilities, Norges Bank can provide liquidity to the banking system as a whole by offering extraordinary loans. Such liquidity insurance is only offered when deemed necessary by the central bank in order to ensure financial stability and to implement monetary policy. During both the 2008/2009 financial crisis and the period of market stress in spring 2020, Norges Bank offered extraordinary loans to the banking sector. The loans dampened the uncertainty surrounding banks’ liquidity situation and contributed to improving the policy rate pass-through to money market rates (Chart 4.1). The fundamental principles of liquidity management policy also apply in periods of financial turmoil.1 The terms for extraordinary loans are designed to promote the central bank’s objectives while minimising moral hazard, ie that the terms for such support do not contribute to excessive risk-taking. Banks are given incentives to manage risk without support from the central bank.
Chart 4.1 Extraordinary loans dampened uncertainty in the money market2 Outstanding volume of extraordinary F-loans and premium in three-month Nibor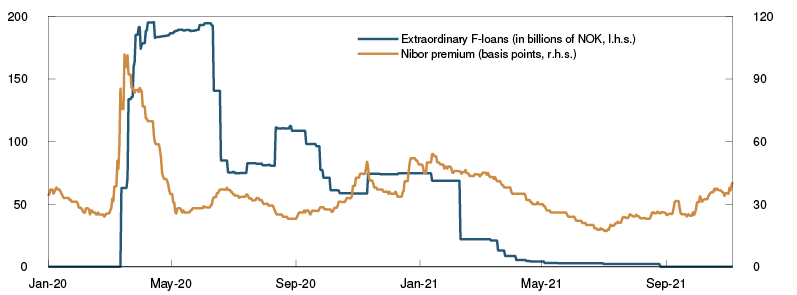
1 For a description of Norges Bank’s liquidity policy principles, see Norges Bank (2021) “Norges Bank’s liquidity policy: Principles and design” Norges Bank Papers 3/2021.
2 Period: 1 January 2020 – 5 November 2021.
4.2 Do central banks need other tools in times of market stress?
Internationally, market-based credit has grown in volume since the 2008/2009 financial crisis, and in many countries, well-functioning securities markets have become more important for financial stability (see Section 1.1). The Financial Stability Board (FSB) and others stress that the functioning of securities markets may be threatened at an earlier stage than previously in periods of financial turmoil. Stricter margining requirements for derivative positions between financial market participants may have increased the need for liquid funds in periods of high price volatility. Higher capital adequacy and leverage ratio requirements have increased banks’ resilience to losses. At the same time, stricter rules require banks to set aside more capital to cover both risky and risk-free assets on their balance sheets. This may have reduced banks’ willingness to act as market makers in securities markets. Selling pressures in securities markets may therefore arise more rapidly in periods of market stress if many participants need liquidity at the same time, signs of which were also observed in the Norwegian bond markets in spring 2020.
The Bank of England3 and others have proposed that central banks should consider liquidity policy tools specifically aimed at securities markets and non-bank market participants. One instrument could be that the central bank acts as market maker of last resort (MMLR) in situations where the traditional market makers – banks – do not have sufficient balance sheet capacity to act as intermediary between buyers and sellers in the market. Another instrument is providing access to central bank lending facilities for non-bank market participants. In Norway, the Norwegian Fund and Asset Management Association (VFF) has suggested that investment funds should be given access to the central bank’s lending facility in order to avoid fire sales in periods of market stress. VFF also suggests that Norges Bank should assume responsibility for the management of the Government Bond Fund to allow the central bank to provide direct support to securities markets.
Measures that bypass banks may have advantages …
MMLR means that the central bank buys and sells securities in securities markets in situations where private market makers are absent and markets are dysfunctional. The Bank of England’s asset purchase programme in the secondary market for UK corporate bonds4 is one of few examples of central banks acting as MMLR. The programme was introduced in 2009 as outright asset purchases, but was augmented in 2010 to include sales of bonds from the central bank’s holdings. The aim was to improve secondary market liquidity after banks had reduced their market making activities. The asset purchase programmes established by several other central banks following the financial crisis were initiated for a different purpose. With the central bank acting as MMLR, the objective is not to influence the general level of interest rates or asset prices but to improve the functioning of securities markets.5 The assets purchased by the central bank as MMLR will normally be sold back to the private sector as soon as possible.
MMLR may have advantages compared with supporting the functioning of securities markets indirectly by providing loans to banks. When the central bank provides liquidity support by offering banks loans against collateral, the effect on securities markets will depend on whether banks are willing and able to increase their balance sheet size and risk. Regulatory requirements, which are otherwise highly necessary and well-founded, can impose restrictions on banks’ capacity to use collateralised central bank funding to purchase securities. When the central bank provides a bank with loans against collateral, the bank’s deposits at the central bank increase on the asset side of its balance sheet corresponding to the borrowed amount on the liabilities side. This leads to a decrease in the bank’s leverage ratio, but has no effect on its risk-weighted capital ratio because deposits at the central bank have a risk weight of 0%. If a bank uses this funding to purchase securities from the general public, the bank’s securities holdings increase on the asset side and the general public deposits increase on the liabilities side. This leads to a further decrease in the leverage ratio. If the securities have a risk weight higher than zero, the bank’s risk-weighted capital ratio also falls. If the central bank purchases securities from the general public, either directly or through banks, banks’ risk-weighted capital ratios will not be affected as the risky securities are held on the central bank’s balance sheet. Such asset purchases also lead to a smaller decrease in banks’ leverage ratios than if banks finance asset purchases using collateralised central bank funding. Another possible advantage of MMLR is that it allows the central bank to decide which market segment to support and to what extent. Thus, MMLR may be a more accurate tool than loans to banks.
… but entail higher risk on the central bank’s balance sheet
The effect and accuracy of MMLR depends on the prices quoted by the central bank and the risk it takes on. When the central bank provides loans against collateral, risks are mitigated by adjusting the market value of the collateral on a daily basis and applying collateral haircuts. There is no such safety mechanism when the central bank purchases securities. To act effectively as MMLR, the central bank must purchase securities at prices other market participants are not willing to bid. It is unlikely that valuations made by the central bank are fundamentally better than those made by other investors in the market. This makes it difficult to assess whether the prices quoted by the central bank contribute to a well-functioning market and to assess the risk taken on by the central bank. Securities markets can be exposed to large shocks and still be functional. Large price fluctuations are not enough to warrant an MMLR intervention. This suggests that the central bank should be very wary of purchasing securities in such situations. As is the case for other central bank actions, MMLR will be associated with moral hazard. Market participants may to a lesser extent take full account of the risk associated with their investments if they expect the central bank to intervene in the market when price volatility is high. Thus MMLR can contribute to functional markets in the short term but weaken the market mechanism in the longer term. Incorrect pricing of risk can lead to a build-up of vulnerabilities in financial markets and a greater need for central bank interventions in the future.
One alternative to collateralised loans to banks and MMLR could be collateralised loans to other market participants, such as investment funds, insurance companies or other types of asset managers. Collateralised loans entail lower risk for the central bank than acting as MMLR. Nor will the effect of such loans be limited by banks’ balance sheet capacity, but may be limited by restrictions on participants’ borrowing.6 Market participants with a different function from banks in the financial system are regulated differently and to some extent less strictly. Loans to these counterparties therefore normally entail higher risk for the central bank than loans to banks. Furthermore, central bank provision of liquidity protection to non-bank participants may be difficult to justify. Less strict regulation reflects the fact that these participants are less critical to payment intermediation and the financial system than banks.
Banks had capacity to purchase securities in spring 2020
Norwegian banks fulfilled capital requirements by a solid margin at the beginning of the period of market stress in spring 2020. On average, the distance to the risk-weighted capital requirements was 1–1.5 percentage points and somewhat more to the leverage ratio. Banks’ capacity to purchase securities was therefore not constrained by capital requirements, even though the requirements may have constrained individual banks on certain days. In March 2020, Norges Bank provided banks with loans with maturities of up to one year at full allotment. Norges Bank reduced the countercyclical capital requirement by 1.5 percentage points at the same time. Norges Bank also decided to allow banks to use 100% of one security (ISIN) as collateral for a loan, as against the normal limit of 20%. This meant that banks could more easily buy back bonds financed by loans from Norges Bank, which probably contributed to the improvement in bond market liquidity. Banks borrowed approximately NOK 200bn from Norges Bank.
Banks increased their securities holdings between the end of February and the end of August 2020 by NOK 185bn (Chart 4.2), with most of the increase occurring in March and April. About half of the increase was banks’ purchases of new covered bonds from their own mortgage companies, but holdings of municipal bonds and other securities also increased. Banks also increased their own senior unsecured bond repurchases with short residual maturity in the same period, even though these bonds could not be used as collateral for loans from Norges Bank. The substantial increase in securities on banks’ balance sheets in March and April illustrates that the banks had capacity to increase their borrowing from Norges Bank and purchase securities from non-bank market participants in need of liquidity.
Chart 4.2 Banks expanded their securities holdings in spring 20207 Norwegian banks’ holdings of bonds and short-term paper by issuer sector. In billions of NOK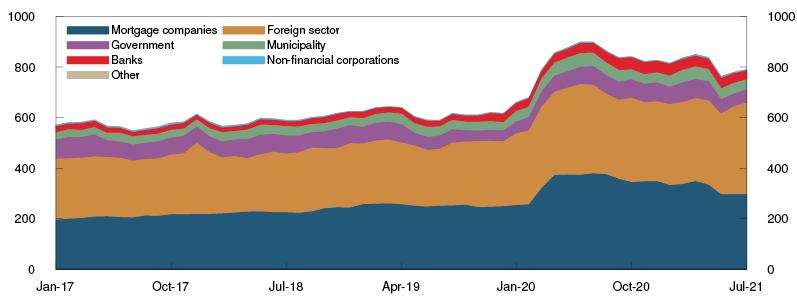
Risk should as far as possible be handled and priced in the market
Liquidity policy tools are used in periods of market stress to ensure policy rate transmission to market rates and to contribute to financial stability. The instruments are at the same time deployed in such a way that risk is as far as possible managed by private agents and priced in the market. Banks play a specific role in credit and payment intermediation and are therefore Norges Bank’s counterparties in the liquidity management framework. In periods of market stress, extraordinary measures aimed at banks can be a less effective means of influencing securities markets if banks are subject to capital or other regulatory constraints. Experience from the period of market stress in spring 2020 implies that banks had the capacity to increase balance sheet size and risk and that Norges Bank’s measures aimed at banks contributed to improving conditions in money and securities markets. In the light of this experience and the fundamental principles of the liquidity management policy, loans to banks are Norges Bank’s preferred instrument in periods of market stress. Public intervention in the markets should in any case not contribute to a socialisation of losses while the profits are retained by the risk-taker. Both banks and other financial market participants are responsible for managing their own liquidity risk without relying on support from the central bank. Regulations issued by the authorities and the central bank’s terms for liquidity insurance are designed to contribute to this.
3 See Hauser, A. (2021) “From Lender of Last Resort to Market Maker of Last Resort via the dash for cash: why central banks need new tools for dealing with market dysfunction”. Speech, 7 January 2021. Bank of England.
4 The Corporate Bond Secondary Market Scheme.
5 For a discussion of the situations in which an MMLR intervention by the central bank might be an appropriate instrument, see Tucker, P. (2014) "The lender of last resort and modern central banking: principles and reconstruction". In: Re-thinking the lender of last resort. BIS Papers No 79. BIS.
6 For example, there are restrictions on borrowing for UCITS investment funds, insurance companies and pension funds.
7 Period: January 2017 – July 2021.
Annex
Important measures to mitigate financial system vulnerabilities in Norway
|
Category |
Instrument |
First introduced |
Current level |
|
Credit standards requirements for mortgages |
Tolerate higher interest rate (stress test)1 |
20152 |
5 percentage points |
|
Loan-to-value (LTV) ratio |
20152 |
85% (60% for loans secured on secondary homes in Oslo) |
|
|
Principal repayment requirement |
20152 |
2.5% a year with LTV above 60% |
|
|
Debt-to-income (DTI) ratio1 |
2017 |
5 times gross income |
|
|
Flexibility quota (speed limit)3 |
2015 |
10% (8% or up to NOK 10m for loans secured on dwellings in Oslo) |
|
|
Credit standards requirements for consumer credit4 |
Tolerate higher interest rate (stress test) |
20192 |
5 percentage points |
|
Principal repayment requirement |
20192 |
Monthly principal repayment, maximum term 5 years |
|
|
Debt-to-income (DTI) ratio1 |
20192 |
5 times gross income |
|
|
Flexibility quota (speed limit)3 |
2019 |
5% |
|
|
Risk-based capital requirements5 (share of risk-weighted assets) |
Pillar 1 Minimum CET1 requirement |
20136 |
4.5% |
|
Pillar 1 Minimum Tier 1 requirement |
19917 |
6% |
|
|
Pillar 1 Minimum regulatory capital |
1991 |
8% |
|
|
Pillar 1 Combined buffer requirements: |
|||
|
Capital conservation buffer |
2013 |
2.5% |
|
|
Systemic risk buffer |
2013 |
4.5%8 |
|
|
Buffer for systemically important financial institutions (SIFIs) |
2015 |
1% for Kommunalbanken AS and 2% for DNB ASA9 |
|
|
Countercyclical capital buffer |
2015 |
1% |
|
|
Pillar 2 requirements |
2007 |
Varies across banks |
|
|
Risk weighting for risk-based capital requirements |
Minimum requirement for loss given default (LGD) in IRB banks’ mortgage models |
2014 |
20% |
|
Calibration requirement for IRB banks’ mortgage models for PD and LGD |
2015 |
||
|
Floor for average risk weights for mortgages |
2020 |
20% |
|
|
Floor for average risk weights for commercial property mortgages |
2020 |
35% |
|
|
Leverage-based capital requirements5 (share of exposure measure) |
Leverage ratio |
2017 |
3% minimum requirement + 2% buffer requirement + 1% buffer requirement for systemically important banks |
|
Liquidity requirements |
Liquidity Coverage Ratio (LCR) |
2015 |
100% |
|
LCR in individual currencies |
2017 |
100% |
|
|
LCR in NOK |
2017 |
50% (for banks with EUR/USD as significant currencies) |
|
|
Minimum requirement for own funds and eligible liabilities (MREL)10 |
Loss absorption amount |
2019 |
Minimum requirement for regulatory capital + Pillar 2 requirements + combined buffer requirements11 |
|
Amount necessary for recapitalisation12 |
2019 |
Minimum requirement for regulatory capital + Pillar 2 requirements + combined buffer requirements excluding countercyclical capital buffer requirement |
Footnotes
1 The requirement pertains to the customer’s total debt.
2 Prior to being laid down in a regulation, the requirements were issued as guidelines, for residential mortgage loans in 2010 and for consumer credit in 2017.
3 Up to a certain percentage of the total value of new mortgage loans/consumer credit granted each quarter may be loans in breach of one or more of the requirements.
4 Exemption for credit cards with credit limits below NOK 25 000 and exemption for loan refinancing as long as the value of the refinanced loan (and associated costs) does not exceed the value of the existing loan (and associated costs).
5 See explanation of capital requirements in Norway’s financial system 2021, pages 99–106.
6 From 2002, hybrid capital could account for up to 15% of Tier 1 capital.
7 In 2013, the minimum requirement increased from 4% to 6% when CRR/CRD IV were implemented in the Norwegian rules.
8 Applies to IRB banks from end-2020, while the 3% requirement applies to other banks until end-2022.
9 From the end of June 2022, Nordea Eiendomskreditt AS shall be classified as systemically important and be subject to a 1% buffer requirement.
10 Liabilities eligible for MREL must be lower in priority than senior debt. However, before 1 January 2024, ordinary senior bonds issued before 1 January 2020 may also be used to satisfy MREL.
11 The loss absorption amount requirement is the larger of the leverage-based Tier 1 capital requirements and total risk-based capital requirements (minimum requirement, Pillar 2 requirements and buffer requirements). In Norway, the risk-based requirement is the most binding.
12 Applies only to banks subject to resolution and not liquidation under public administration.
Sources: Ministry of Finance and Finanstilsynet
The Norwegian banking sector
See Norway´s financial system 2021 for a further description.