

At its meeting on 23 September, Norges Bank’s Monetary Policy and Financial Stability Committee judged that a somewhat tighter monetary policy stance is needed to return inflation to target within a reasonable time horizon. The Committee decided unanimously to raise the policy rate from 4.25% to 4.50%.
The Monetary Policy Statement provides the background for the monetary policy decision taken by the Monetary Policy and Financial Stability Committee on 23 September 2026 and the Committee’s assessment of the monetary policy outlook. A summary of the deliberations leading to the monetary policy decision is published at the same time as the decision on norges-bank.no.
Norges Bank is tasked with keeping inflation low and stable. The operational target is inflation of close to 2% over time. We are also mandated to help keep employment as high as possible and to promote economic stability.
Inflation has been above target for several years. Capacity utilisation in the Norwegian economy has drifted down and now appears to be slightly below a normal level. At the monetary policy meeting in June, the Committee judged that it would likely be necessary to raise the policy rate further at one of the forthcoming meetings. Since June, the Committee has noted the following:
- CPI inflation has been higher than projected, while underlying inflation measured by the CPI adjusted for tax changes and excluding energy products (CPI-ATE) has slowed and been lower than projected. The conflict in the Middle East is still creating uncertainty about the inflation outlook, and since June, prices for oil and gas and various other commodities have risen. At the same time, a stronger krone will contribute to dampening imported goods inflation. Market interest rates have increased both internationally and in Norway. Wage growth will likely be lower this year than in 2025 and broadly as projected in June.
- Mainland economic activity has increased largely as expected. Employment has risen further, while unemployment has shown little change in recent months. On the other hand, the share of Regional Network contacts reporting capacity constraints and labour shortages has fallen. Overall capacity utilisation in the Norwegian economy appears to be declining slightly less than projected in June.
The Committee gave special attention to the fact that inflation is still markedly above target. Underlying inflation has been lower than projected, but the inflation outlook somewhat further ahead does not appear to have changed materially. The rapid rise in business costs in recent years will likely contribute to keeping inflation elevated ahead. High inflation over time can lead households and firms to begin planning for persistently high inflation. Inflation may then become stickier and harder to bring down again. The Committee does not want to restrict the economy more than needed, but judges that a somewhat tighter monetary policy stance is needed to return inflation to target within a reasonable time horizon.
The Committee decided to raise the policy rate from 4.25% to 4.50%. The Committee’s assessment of the outlook implies that it will likely be necessary to keep the policy rate elevated for a time. The Committee is prepared to raise the policy rate further if warranted by the inflation outlook.
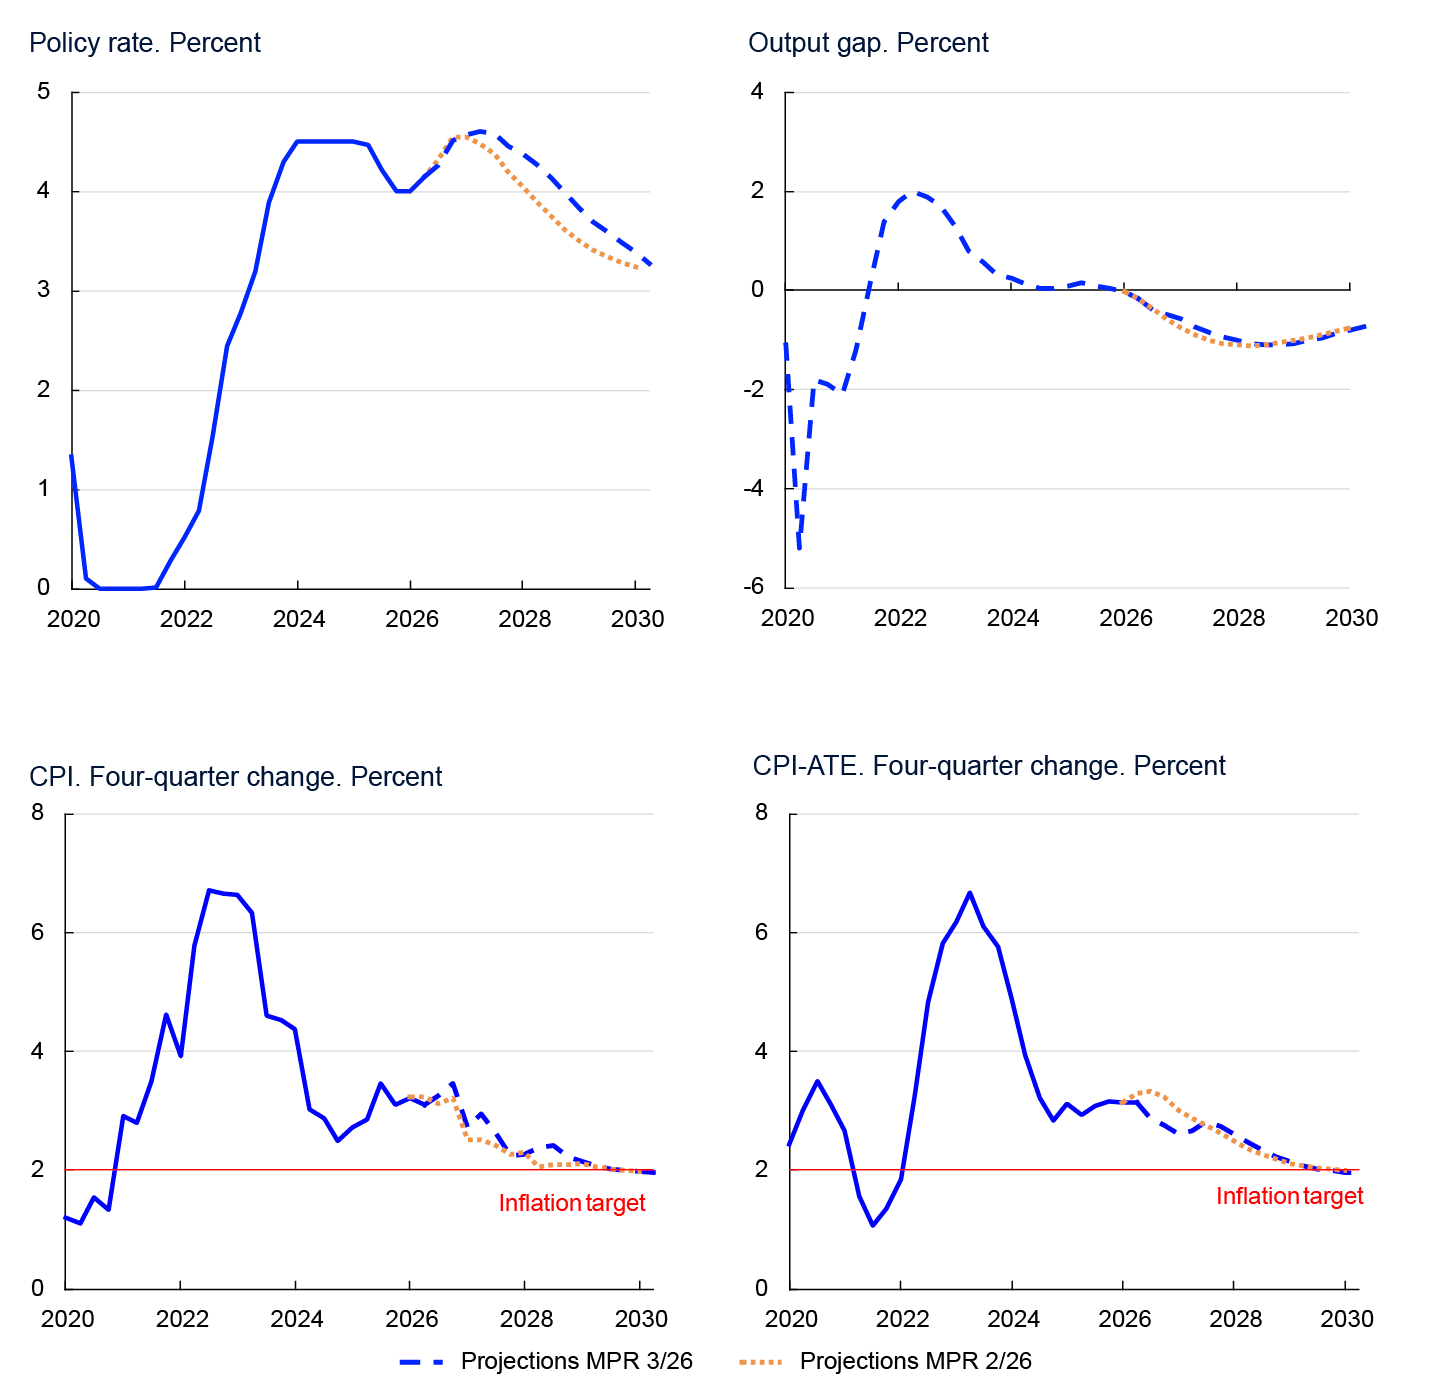
If the economic outlook changes, the monetary policy outlook will also change. The Committee will be particularly attentive to signs that inflation will remain elevated for longer than projected. If, for example, external price impulses prove stronger than currently assumed, a higher policy rate may be needed to return inflation to target within a reasonable time horizon. If the recent months’ inflation figures turn out to be the beginning of faster disinflation or the labour market proves weaker than projected, the policy rate may become lower than currently envisaged.
In the forecasts, the policy rate remains close to the current level for a period ahead before declining somewhat. The new policy rate forecast indicates that the policy rate will remain elevated somewhat longer than the June forecast. With the current policy rate path, inflation is projected to slow from next year and move down to 2% in 2029. The economy is expected to cool somewhat further, and registered unemployment is projected to edge up to slightly above pre-pandemic levels.
- 1 The output gap measures the percentage deviation between mainland GDP and estimated potential mainland GDP. CPI-ATE: the CPI adjusted for tax changes and excluding energy products. The forecasts from Monetary Policy Report 3/2026 extend to the end of 2030 Q2, while the forecasts from Monetary Policy Report 2/2026 extend to the end of 2030 Q1.
Ida Wolden Bache
Pål Longva
Øystein Børsum
Hilde C. Bjørnland
Steinar Holden
23 September 2026
The Government laid down a new regulation on monetary policy on 18 September. In the new regulation, the monetary policy objectives and considerations are described with the same wording as in the previous regulation. The new regulation does not entail any changes to the conduct of monetary policy.
1. Overall picture
This section presents the overall picture of the Norwegian economy and discusses Norges Bank’s assessment of economic developments, with particular weight on the current economic situation, the near-term outlook, the policy rate decision and forecast and finally the economic outlook in the light of interest rate developments. In the box at the end of this section, key uncertainty and risk factors are described that may result in different economic developments than projected in this Report.
Inflation is still above the inflation target and has been around 3% over the past two years. Our assessment is that there is now slightly more slack in the economy than normal. Over the past year, registered unemployment has shown little change. Higher prices for energy and various other commodities owing to the conflict in the Middle East are pushing up inflation both abroad and in Norway. At this monetary policy meeting, the policy rate was raised to 4.5%. In the forecasts, the policy rate remains close to that level for a period ahead before declining somewhat further out. Inflation is projected to move down to 2% in 2029 and registered unemployment to rise somewhat to slightly above pre-pandemic levels.
Higher energy prices drive up inflation and weaken economic growth abroad
At the end of 2025, inflation in a number of Norway’s trading partners approached their 2% targets. Economic activity had held up despite trade policy uncertainty. In 2026, the conflict in the Middle East has given rise to new shocks. Shipping through the Strait of Hormuz remains low, and military attacks in the region are ongoing. Prices for oil, gas and refined products are higher than in June, and prices for other commodities have also increased.
Shipping through the Strait of Hormuz remains low, and prices for oil, gas and refined products are higher than in June.
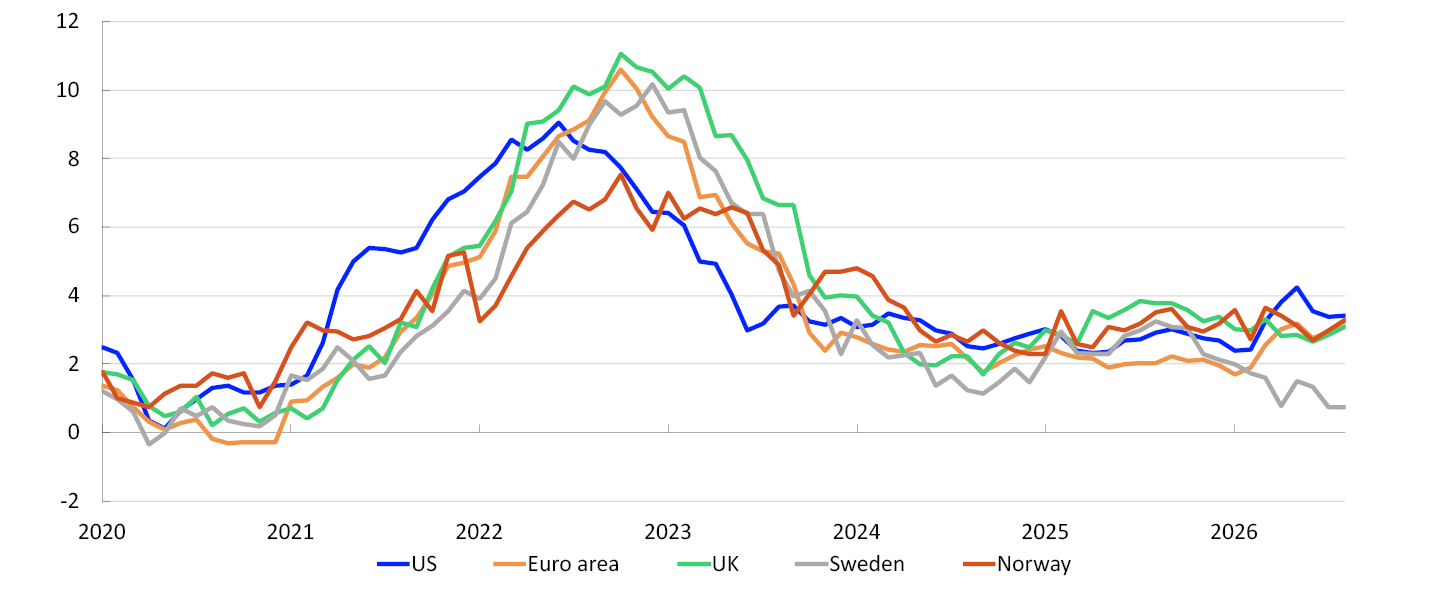
Higher commodity prices have pushed up consumer price inflation in a number of Norway’s trading partners, and inflation is likely to remain above their inflation targets in 2026 (Chart 1.1). Both the European Central Bank (ECB) and the Federal Reserve have recently raised policy rates. Market-implied rates indicate expectations of monetary policy tightening by both the ECB and the Federal Reserve and other central banks in the coming year. Long-term interest rates have also risen since the June Report.
CPI. Twelve-month change. Percent1
Higher prices for energy and other commodities are dampening economic activity abroad, albeit less than initially assumed. In the euro area, growth in 2026 is also being dampened due to the warm and dry summer. On the other hand, defence and AI-related investment is lifting growth in many countries and jurisdictions. Overall, economic growth among trading partners is expected to be a little lower in 2026 and 2027 than in 2025.
Inflation in Norway is still above target
After rapid disinflation from high levels, inflation in Norway has hovered around 3% over the past couple of years. In August, the 12-month rise in the consumer price index (CPI) was 3.3%, which was higher than projected. CPI inflation adjusted for tax changes and excluding energy products (CPI-ATE) was 3.0%. Through summer, CPI-ATE inflation was lower than projected. At the same time, an average of other underlying inflation indicators has been slightly higher than CPI-ATE inflation.
Inflation in Norway has hovered around 3% over the past couple of years.
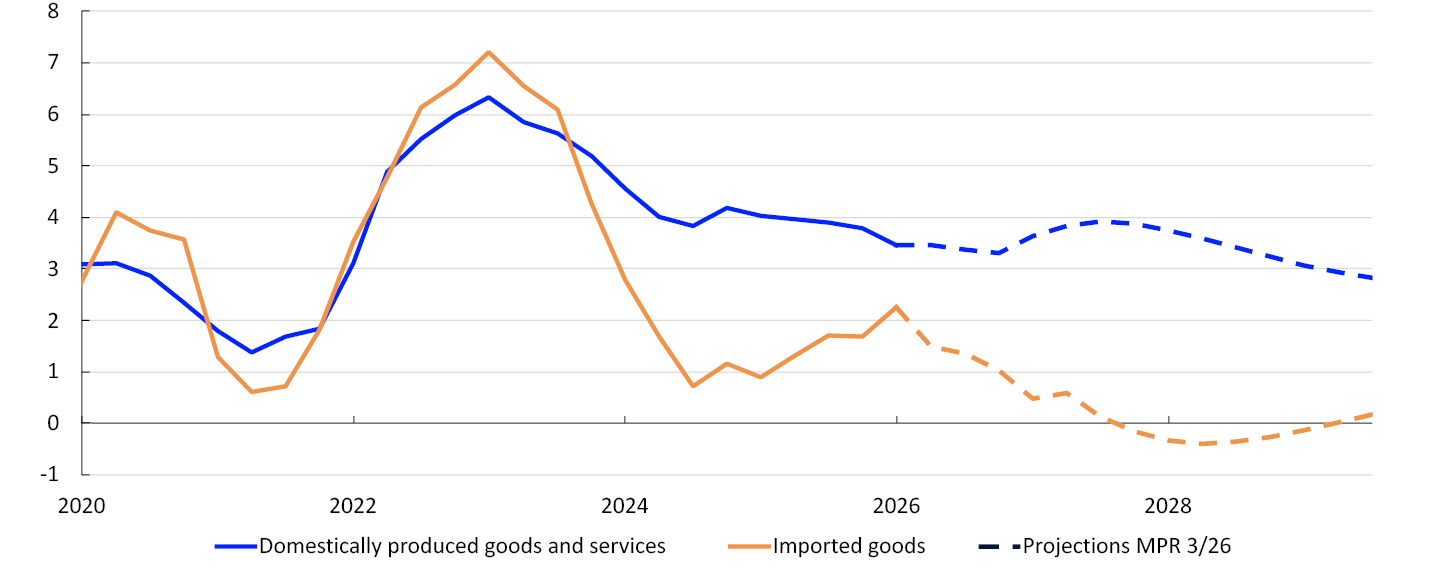
In recent years, a rapid rise in business costs has contributed to keeping domestically produced goods and services inflation elevated (Chart 1.2). At the same time, imported consumer goods inflation has edged up since the beginning of last year. Since June, the rise in prices for these goods has abated and been somewhat lower than projected. Imported consumer goods inflation is expected to continue to moderate ahead.
CPI-ATE. Four-quarter change. Percent2
Looking ahead, the global rise in prices for energy, agricultural products and other commodities will likely dampen the decline in imported goods inflation. The rise in prices could also raise domestic business costs. Electricity prices in Norway have also increased recently.
On the other hand, wage growth has moved down somewhat, and is expected to be 4.4% in 2026, in line with the wage norm set in the manufacturing wage settlement. In addition, the krone has appreciated through 2026 and is now stronger than projected in the June Report. A stronger krone will pull down inflation in Norway.
Underlying inflation is projected to be slightly below 3% in the coming months.
Slower economic growth this year
In recent years, monetary policy tightening has contributed to dampening mainland activity. Activity growth picked up slightly in 2025 but has remained low through 2026 H1, evolving broadly as expected.
Household consumption has slowed so far in 2026 after increasing through 2024 and 2025. At the same time, purchasing power continues to strengthen, and consumption is expected to increase ahead.
Vi venter at konsumet vil øke fremover, og at boliginvesteringene begynner å ta seg opp neste år.
Residential construction remains low, but the decline in housing investment has halted. Over the past year and a half, the rise in prices for existing homes has gradually slowed. House price inflation is expected to be lower this year than in 2025. While stronger purchasing power may lift demand for new homes, the price difference between new and existing homes will likely have a dampening effect. Housing investment is expected to begin picking up in 2027, albeit moderately.
A number of major development projects on the Norwegian continental shelf launched in response to the petroleum tax package have reached or are nearing completion, and petroleum investment is assumed to decline in 2026. Mainland export growth is expected to slow, while growth in public demand will likely be slightly higher than in 2025. Norges Bank’s Regional Network contacts expect moderate activity growth to the end of 2026.
Mainland GDP is projected to rise by 0.9% in 2026, which is lower than in 2025. The projection is unchanged from the June Report.
Mainland GDP is projected to rise less in 2026 than in 2025.
Unemployment little changed
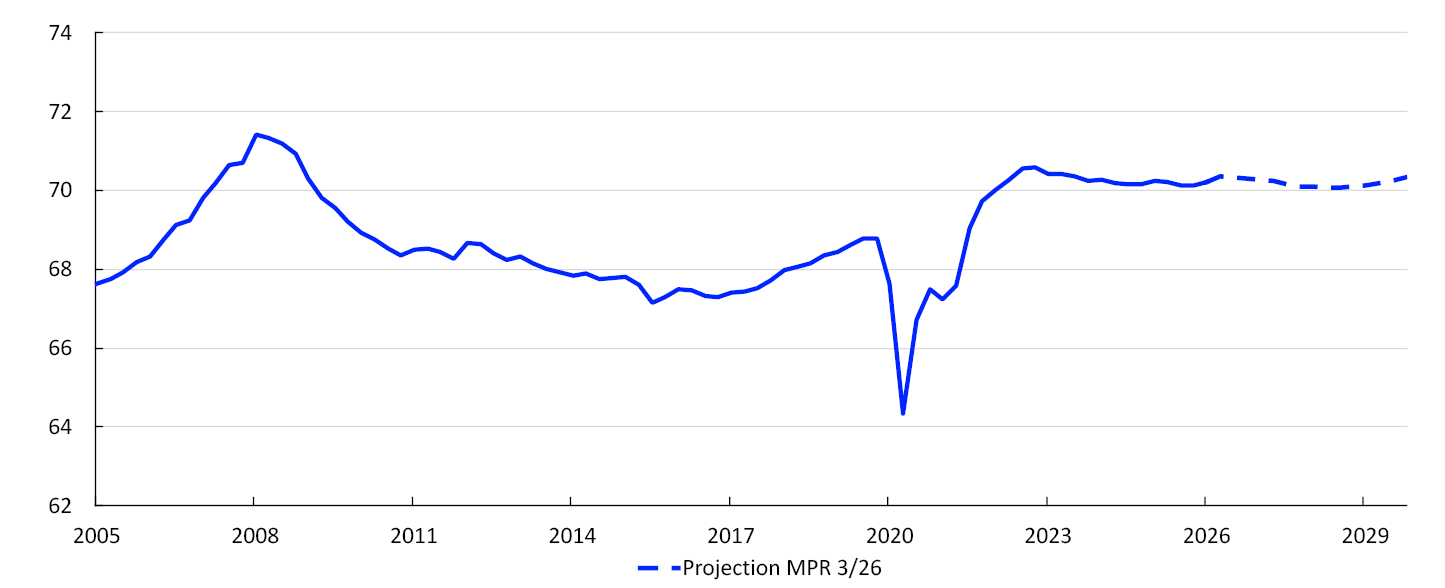
Since 2025, registered unemployment has shown little change and is still lower than pre-pandemic levels. Adjusted for normal seasonal variations, 2.1% of the labour force was registered as fully unemployed by the Norwegian Labour and Welfare Administration (Nav) in August, in line with expectations. The Labour Force Survey (LFS) shows a somewhat higher increase in unemployment over time but a slight decline so far in 2026. Employment has risen further, and the employment rate is higher than before the pandemic (Chart 1.3).
Employment to population ratio. Aged 15–74. Percent3
Capacity utilisation in the economy is currently assessed to be slightly below a normal level and is expected to decrease further, albeit slightly less than projected in June.
Capacity utilisation in the economy is currently assessed to be slightly below a normal level.
An elevated policy rate likely necessary for a time
Since May this year, the policy rate has stood at 4.25%. When the Monetary and Financial Stability Committee discussed the monetary policy stance in June, the assessment was that it would likely be necessary to raise the policy rate at one of the forthcoming meetings. At its meeting on 23 September, the Monetary and Financial Stability Committee decided to raise the policy rate from 4.25% to 4.50%.
The Committee’s assessment of the outlook implies that it will likely be necessary to keep the policy rate elevated for a time. The Committee is prepared to raise the policy rate further if warranted by the inflation outlook.
Prospects for lower inflation further out
In the forecasts, the policy rate is close to the current level over a period ahead, before declining somewhat further out. Inflation is projected to slow from next year and move down to 2.0% in 2029 (Chart 1.4). The economy is expected to cool somewhat further, and registered unemployment is projected to rise somewhat to slightly above pre-pandemic levels.
Inflation is projected to slow from next year and move down to 2.0% in 2029.
CPI-ATE. Four-quarter change. Registered unemployment. Percent4

External price impulses are expected to ease going forward. It is also likely that lower wage growth will push down inflation. At the same time, wages are expected to rise faster than prices ahead. Household purchasing power will likely continue to strengthen in the coming years, also when factoring in interest expenses. This will lift private consumption and also contribute to a gradual increase in housing investment. The average residential mortgage rate is expected to be just below 5% in 2029.
The number of employed is projected to increase in the years ahead, and the employment rate is expected to show little change through the projection period.
- 1 Figures for Sweden are CPIF (Consumer price index with a fixed interest rate).
- 2 CPI-ATE: the CPI adjusted for tax changes and excluding energy products.
- 3 Employment is the number of employed workers according to the quarterly national accounts (QNA) less non-resident workers (from the statistics on the number of jobs and wages).
- 4 CPI-ATE: the CPI adjusted for tax changes and excluding energy products.
Uncertainty and risk
The conflict in the Middle East has contributed to elevated uncertainty about future movements in oil and gas prices. The projections are based on futures prices, which indicate that oil and gas prices will decline but remain somewhat higher than before the military attacks started in the Persian Gulf. At the same time, the situation in the Strait of Hormuz remains unresolved, with repeated failed attempts at finding a solution.
Prices for key agricultural products are also based on futures prices in the projections. These prices have risen through summer, partly reflecting a warm and dry summer and El Niño weather shocks. The severity and consequences of El Niño are uncertain.
There is a risk that prices for both oil and gas and agricultural products could remain elevated for longer than currently indicated by market pricing. Higher prices will result in stronger cost pressures and may lead to higher consumer price inflation, both for domestically produced and imported goods. Inflation in Norway could then become higher than currently envisaged. On the other hand, a solution to the situation in the Middle East could result in a faster normalisation of production and transport of energy than currently assumed. El Niño may also prove milder than assumed. If so, domestic inflation could slow faster than expected.
Through summer, underlying inflation has been lower than expected. There is uncertainty regarding the relationship between inflation and the underlying driving forces. If the relationship is different from that assumed, the lower rate of inflation could be the beginning of faster disinflation than currently projected.
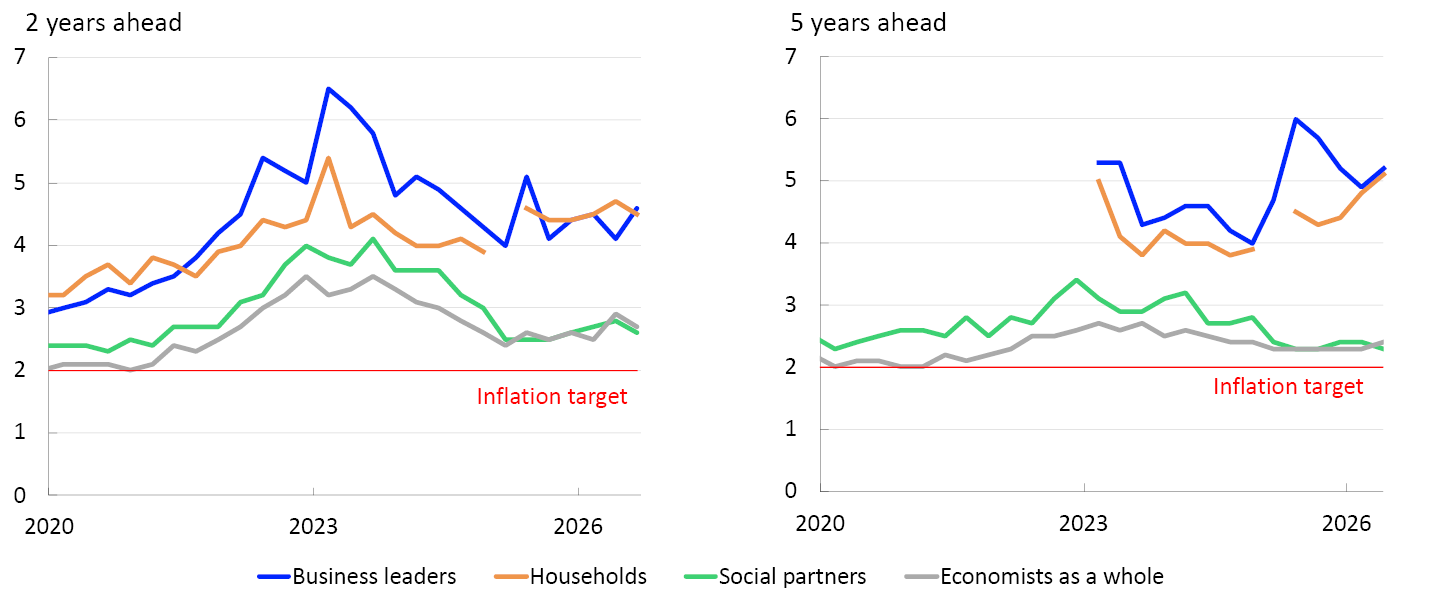
Two- and five-year ahead inflation expectations have decreased quite a bit since peaking in 2023 but have not fallen further over the past year (Chart 1.A). Economists’ and the social partners’ long-term inflation expectations are close to pre-pandemic levels, while households’ and business leaders’ expectations remain elevated. If firms assume that inflation will remain high going forward, inflation may remain elevated for longer than projected.
Twelve-month change. Percent1
There is substantial uncertainty associated with developments in the krone exchange rate. The krone can be influenced by a number of factors, such as the expected interest rate differential against other countries, oil and gas price developments and geopolitical uncertainty. For example, a decrease in oil prices could lead to a weaker krone than currently assumed. If oil prices rise further or remain elevated for longer than assumed, the krone could strengthen further. Movements in the krone exchange rate could partly offset the effect of higher energy prices on domestic inflation.
Household consumption accounts for a substantial share of aggregate demand. Recently, we have received slightly varying information about developments in consumption, creating some uncertainty about activity growth ahead. According to national accounts data, developments in both goods and services consumption have been weak, and the household saving ratio has risen. On the other hand, Regional Network contacts report solid household demand. The projections assume that consumption picks up through autumn. Consumption could turn out lower if households continue to save a larger share of their income than assumed.
There is considerable uncertainty as to how AI will affect the economy, but looking ahead, increased use of AI could influence variables such as employment, productivity, wages and price inflation. The overall effects are uncertain and may vary over time. In the short term, investment activity linked to the introduction of AI will lift aggregate demand and could thereby push up wage and price inflation. At the same time, the composition of labour demand may change, which in turn could impact unemployment and wage growth. The extent to which AI will affect productivity growth and how fast the effects become visible are uncertain. If the use of AI contributes to higher productivity growth over time, higher economic growth is possible without an increase in inflation.
- 1 In 2023 Q1, households and business leaders were asked for the first time about expected inflation 5 years ahead. The observation for households for 2025 Q1 is omitted due to a different set of questions in the survey for 2025 Q1.
2. Assumptions and projections
This section presents the key assumptions and projections underlying the policy rate decision and the monetary policy analysis. It also describes how new data, analyses and assessments have influenced the projections since the previous Report. The projection period in this Report is between 2026 Q3 and 2029 Q4. The underlying data is available in an independent dataset that is published separately.
International economy
Growth among Norway’s trading partners has held up well through 2025 despite international political tensions and substantial increases in tariffs on exports to the US. Inflation was moderate in most European countries and the US. However, the conflict in the Middle East and the closure of the Strait of Hormuz have driven up global inflation. At the same time, the conflict is dampening economic growth in many countries, even though growth among Norway’s trading partners has been stronger than expected in 2026 H1. High AI-related investment, particularly in the US and China, is supporting global growth.
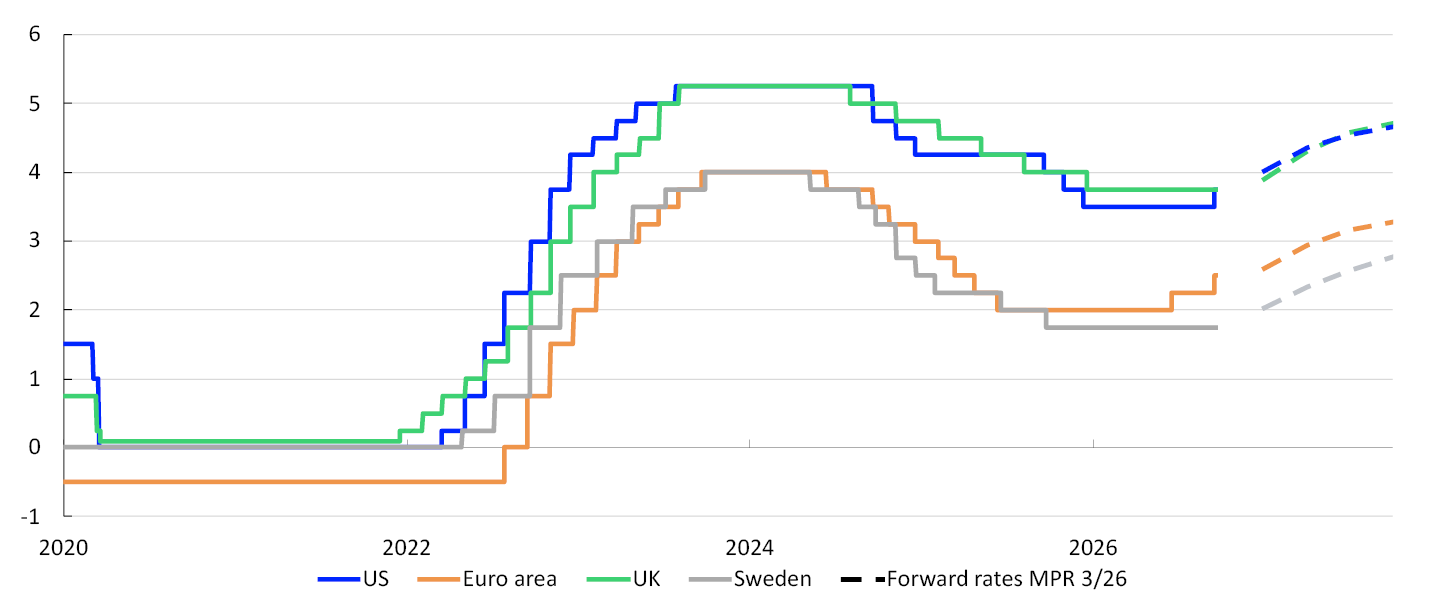
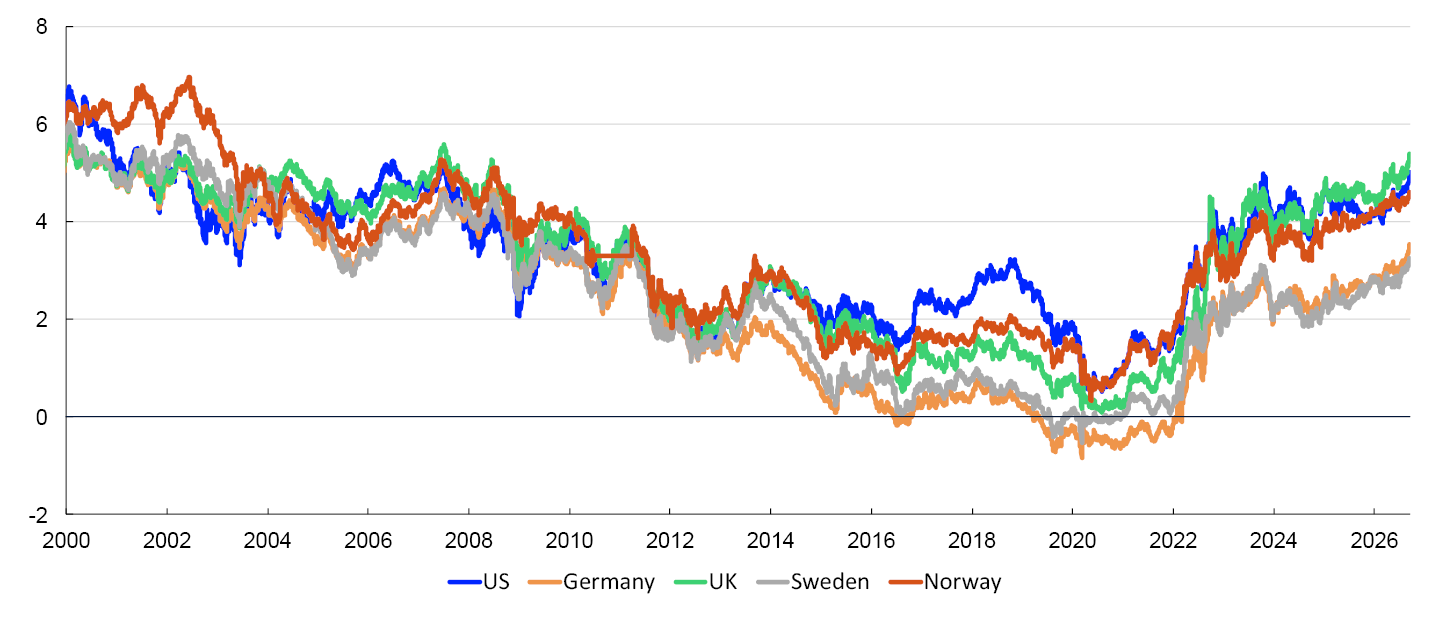
The European Central Bank and the Federal Reserve raised policy rates by 0.25 percentage point earlier this month and are expected to further raise rates ahead. Market pricing indicates that the Riksbank and the Bank of England will also raise policy rates over the coming months (Chart 2.1). Long-term interest rates have also risen since the June Monetary Policy Report, reaching the highest levels in two to three decades in a number of markets (Chart 2.2). The rise reflects policy rate hikes from a number of central banks and market expectations that these rates will remain high for longer than previously assumed. As long-term inflation expectations have been relatively stable, the increase in the ten-year yield likely primarily reflects higher expected real interest rates. Global equity prices have increased somewhat since the June Report. Credit premiums have changed little.
Policy rates and estimated forward rates. Percent1
Ten-year government bond yields for selected countries. Percent2
Overall economic growth among trading partners is expected to be a little lower in 2026 and 2027 than in 2025, although growth projections for 2026 are higher than in June. The projections are based on the following:
- The conflict in the Middle East has led to higher prices for energy and various other commodities. Oil prices are higher than in June, and the price of natural gas and some other refined energy products have risen more (see “Energy and other commodity prices”), which reduces households’ real income and pushes up business costs. This will likely curb economic activity among Norway’s trading partners in the rest of 2026 and into 2027.
- The negative effects of higher tariffs have been limited. On 24 July, the US imposed new tariffs of 10% and 12.5% on imports from 60 countries, including Norway and its main trading partners. This tariff replaces the temporary global 10% tariff that the US introduced in February 2026. At the end of August, the US increased tariffs on some Canadian exports. The average of US import tariffs is assumed to remain at the current level, broadly as assumed in the June Report.
- Higher long-term interest rates have contributed to tighter financial conditions among a number of Norway’s trading partners, which in isolation pulls in the direction of lower growth ahead.
- In the US, growth is projected to remain at around 2% throughout the projection period. Growth in domestic demand is solid. High energy prices could dampen household consumption, but as the US has become a net energy exporter in recent years, they may also have positive spillovers to the US economy. AI-related investment has increased substantially, and growth is expected to hold up, partly supported by the big tech companies’ investment plans.
- In the euro area and the UK, which depend on imports of both oil and gas, high energy prices are likely to dampen growth over the coming year. Near-term euro area growth is also being dampened by the hot and dry summer. On the other hand, factors such as expansionary fiscal policy related to defence and infrastructure investment are lifting growth. In the UK, defence expenditure is also set to rise, but overall, budget plans imply fiscal tightening. Higher private consumption and faster private investment growth are likely to boost growth further ahead. Lower energy prices pull in the same direction.
- In Sweden, growth is expected to remain firm in the coming years, and the projection for 2026 has been revised up since June owing to higher-than-expected growth in Q2. Household purchasing power has strengthened as a result of lower policy rates, real wage growth and fiscal support measures. Public spending on defence and infrastructure also lifts growth in the Bank’s projections.
- In China, growth is projected to be lower in 2026 than in 2025 and to fall further to about 4% towards the end of the projection period. Chinese high-tech exports are expected to continue to rise, albeit not as fast as so far in 2026. This will likely only be partly offset by stronger growth in domestic demand through housing investment and household consumption.
Consumer price inflation among Norway’s main trading partners was moderate before the war in the Middle East started. Owing to higher energy prices, inflation is expected to rise in the near term, before gradually declining further out in the projection period. Underlying inflation is expected to approach 2% towards the end of the projection period, but the projections are overall higher than in the June Report. The projections are based on the following:
- Consumer price inflation measured by the CPI will rise to 3.5% and 3.1% in the US and the euro area, respectively from 2025 to 2026, before slowing further out in the projection period, in line with developments in energy futures prices.
- In response to high energy prices and supply chain disruptions, input costs will be higher, and it will likely take time for non-energy inflation to decline to levels consistent with inflation targets.
- Long-term market inflation expectations in both Europe and the US are little changed due to the conflict in the Middle East. This reduces the risk of second-round effects on price and wage formation. Short-term inflation expectations in the euro area have risen and are around the high levels reached in April/May. Short-term inflation expectations in the US are lower than in April/May and around the same level as in the June Report.
- Second-round effects of higher energy prices and supply-side shocks are assumed to be moderate, and wage growth in the euro area, the UK and the US is projected to be a little higher in 2026 and 2027 than in the June Report. Overall wage growth among Norway’s advanced economy trading partners is projected to decline from just below 4% in 2025 to just above 3% towards the end of the projection period.
Energy and other commodity prices
Prices for energy and several other commodities have risen since the June 2026 Monetary Policy Report. Table 2.A shows developments in actual and futures prices. The Bank's price projections are based on futures prices, and these prices also show a broad rise since June. The rise reflects the conflict in the Middle East, the war in Ukraine and extreme weather in a number of regions. Over the coming quarters, higher energy and commodity prices are expected to push up international price impulses, which are then expected to decline further out in the projection period.
Table 2.A Energy and other commodity prices
|
Average price (2010–2019) |
Average price (2020–2024) |
Realised prices and futures prices1 Percentage change from projections in Monetary Policy Report 2/2026 in parentheses |
|||||
|---|---|---|---|---|---|---|---|
|
2025 |
2026 |
2027 |
2028 |
2029 |
|||
|
Oil, USD/barrel |
80 |
75 |
69 |
96 (8) |
83 (7) |
74 (0) |
72 (-1) |
|
Petrol, USD/barrel |
91 |
93 |
86 |
127 (9) |
116 (12) |
100 (2) |
98 (3) |
|
Diesel, USD/barrel |
93 |
96 |
91 |
157 (22) |
143 (33) |
115 (15) |
105 (9) |
|
Dutch gas, EUR/MWh |
20 |
51 |
36 |
57 (27) |
56 (58) |
35 (30) |
29 (21) |
|
Coal, EUR/tonne |
66 |
128 |
88 |
105 (4) |
116 (12) |
108 (7) |
108 (7) |
|
Carbon allowances, EUR/tonne |
10 |
61 |
74 |
80 (5) |
89 (13) |
93 (14) |
96 (14) |
|
German electricity, EUR/MWh |
42 |
107 |
89 |
124 (22) |
134 (40) |
100 (23) |
86 (16) |
|
Nordic electricity, Øre/kWh |
32 |
64 |
48 |
90 (22) |
74 (33) |
58 (20) |
54 (13) |
|
Electricity in southern Norway, Øre/kWh |
31 |
87 |
73 |
133 (32) |
101 (40) |
72 (21) |
66 (11) |
|
Electricity in northern Norway, Øre/kWh |
32 |
33 |
21 |
80 (27) |
53 (25) |
49 (22) |
46 (11) |
|
Aluminium, USD/tonne |
1945 |
2321 |
2629 |
3323 (-4) |
3243 (-3) |
3145 (-1) |
3090 (-2) |
|
Copper, USD/tonne |
6762 |
8430 |
9926 |
13699 (2) |
14531 (6) |
14561 (7) |
14566 (7) |
|
Steel, USD/tonne |
461 |
617 |
555 |
593 (1) |
620 (5) |
n.a. |
n.a. |
|
Wheat, USD/tonne |
210 |
248 |
197 |
231 (7) |
272 (15) |
275 (10) |
n.a. |
|
Maize, USD/tonne |
183 |
206 |
173 |
182 (6) |
212 (16) |
209 (12) |
203 (8) |
Oil prices have risen since the June Report as a result of new military attacks around the Persian Gulf and in the Red Sea that have reduced oil exports from the region. The rise in diesel prices has been more pronounced. Diesel and petrol prices are now approximately as high as at the peak in 2022 (Chart 2.A). Inventories were initially lower for refined petroleum products than for crude oil. Moreover, in addition to reduced exports from the Persian Gulf, exports from Russia and China have been limited. At the same time, demand for certain refined products appear to have been higher than expected.
USD per barrel2

European gas prices have risen further since the June Report, partly owing to low European gas inventories. At the same time, strategic gas reserves that can be released to compensate for the loss of supply are scarce. Alternative export and transport routes from the Persian Gulf have been fewer for gas than for oil, and a larger share of gas production capacity appears to have been affected by the conflict. Hot and dry weather has pushed up demand for gas in both Europe and Asia, partly due to an increased need for air conditioning and lower electricity production from other energy sources.
Electricity prices on the Continent have risen since the June Report, particularly as a result of higher gas prices. Electricity prices in Norway have also risen. In addition to the impact from electricity prices elsewhere in Europe, low hydropower reservoir levels are pushing up electricity prices in Norway.
Overall, industrial metals prices are little changed since June. Aluminium prices have edged down, partly reflecting the fact that the reduction in exports from the Persian Gulf is unlikely to be as large as previously expected. Copper prices have risen partly as a result of production problems in Chile, a key exporter, following severe weather and flooding. Demand for copper and other industrial metals will likely be sustained ahead by increased investment in the development of electricity grids, renewable energy and data centres.
Prices for a number of agricultural products have also risen since the June Report. Lower exports of for example wheat, maize and soybeans from the Black Sea region have pushed up grain and oilseed prices. Drought in key US farmland areas has weakened harvest prospects and boosted prices for important agricultural products. At the same time, El Niño has led to higher prices for products such as fish meal, coffee, cocoa and sugar. Higher energy prices have also pushed up food production costs.
Norges Bank’s indicators of international price impulses to imported intermediate goods used in production in Norway (IPI) and to imported consumer goods (IPK) have risen since the outbreak of the conflict in the Middle East. The IPI and IPK are composite indicators based on different producer price indices and aim to capture imported intermediate goods inflation and imported consumer goods inflation to Norwegian firms and households, respectively. Norges Bank’s IPI and IPK projections are based on actual and futures prices for the energy products and commodities mentioned above. Compared with assumptions from June, the recent rise in these prices will strengthen price impulses over the coming quarters and decline thereafter further out in the projection period (see discussion under Inflation in Section 2).
- 1 Futures prices at 18 September 2026.
Sources: LSEG Datastream, Macrobond and Norges Bank
- 2 Crude oil: Brent benchmark price traded on Intercontinental Exchange (the ICE exchange) Petrol: US benchmark price (RBOB petrol traded on the ICE exchange). Diesel: European diesel benchmark price (Low Sulphur Gasoil traded on the ICE exchange).
The krone exchange rate
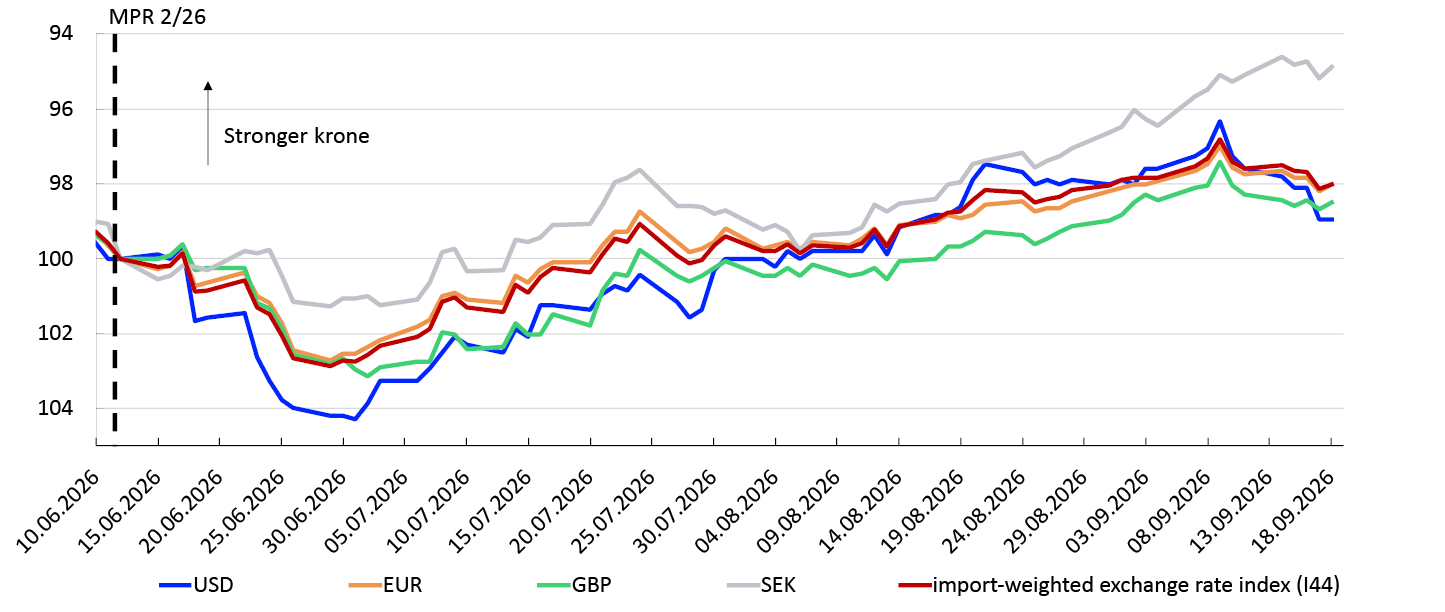
The krone exchange rate, measured by the import-weighted exchange rate index I-44, changed little upon publication of the June 2026 Monetary Policy Report. Movements in the exchange rate were also minor following the policy rate meeting in August.
The krone exchange rate also reacts to other news releases. The krone weakened immediately upon publication of the consumer price index for June on 10 July. The reaction reflects lower inflation for June than expected by market participants. These developments coincided with a fall in Norwegian market interest rates.
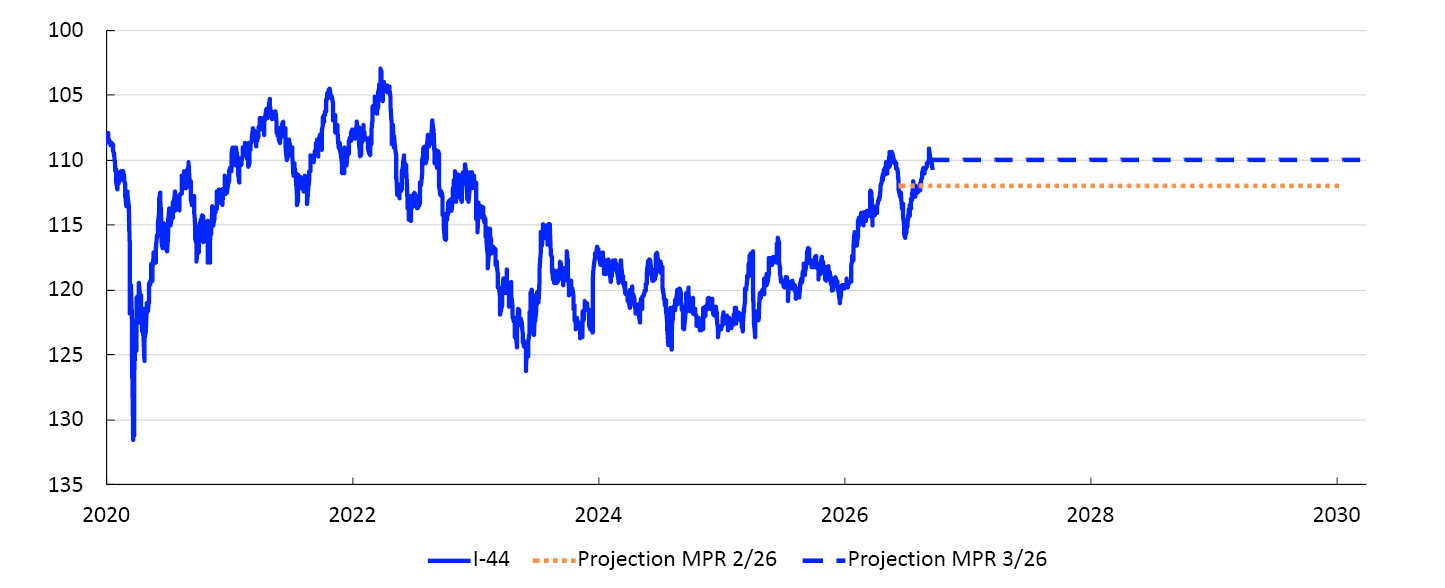
Nevertheless, since the June Report, the krone has broadly appreciated against the currencies of Norway’s main trading partners (Chart 2.B), reflecting the rise in oil and gas prices. On the other hand, market interest rates among trading partners have increased substantially and more than in Norway. This results in a lower interest rate differential, which in isolation pulls in the direction of a weaker krone (Chart 2.C). The krone exchange rate as measured by the I-44 is now slightly more than 1% stronger than projected in the June Report.
Index. 12 June 2026=1001
Policy rate differential against Norway’s main trading partners. Percent2
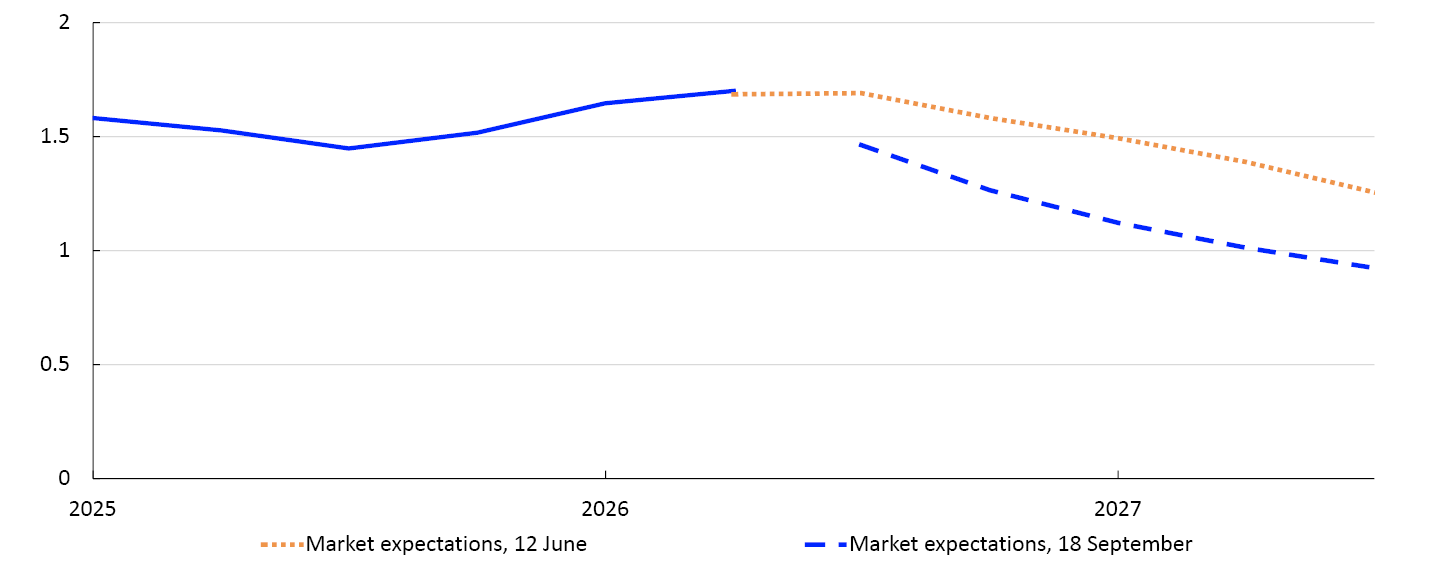
Near-term market policy rate expectations are close to the rate path presented in this Report. Movements in the krone exchange rate are therefore assumed to be small upon publication (Chart 2.D). For a more detailed discussion on how news affects the krone exchange rate, see the box “Krone exchange rate sensitivity to inflation news and monetary policy announcements”.
Import-weighted exchange rate index. I-443
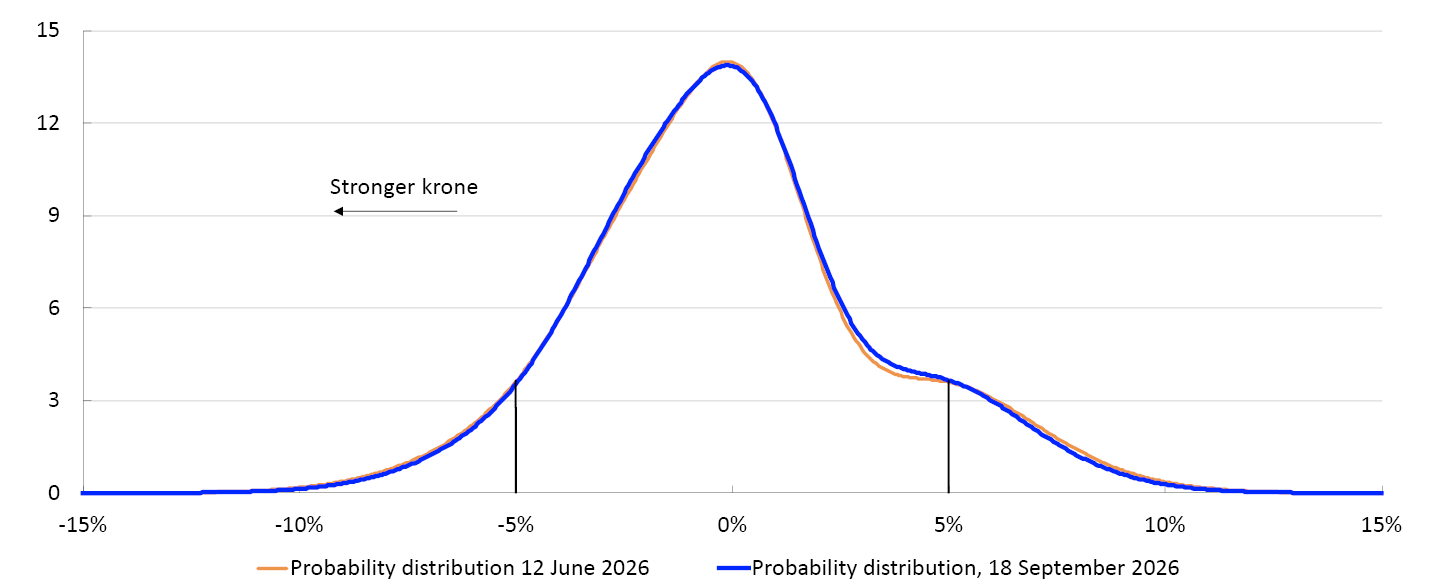
There is substantial uncertainty regarding developments in the krone exchange rate. Chart 2.E illustrates uncertainty based on options prices in the foreign exchange market.4 These prices are used to calculate an implied probability distribution of the krone exchange rate at a given point in time. The chart shows such a distribution of EUR/NOK three months ahead, expressed as a deviation from the forward price. By this measure, uncertainty about movements in the krone exchange rate is little changed since the June Report. The calculation also suggests that the probability of a krone exchange rate that is 5% weaker three months ahead is somewhat higher than the probability of a correspondingly stronger exchange rate, 19% and 13%, respectively (Chart 2.E).
3 months ahead. Percentage deviation from the forward rate5
- 1 For all currencies in the chart, the exchange rate is against NOK. 12 June 2026 = 100. A lower value means that NOK has appreciated against the foreign currency.
- 2 Policy rates abroad are trade-weighted averages of the policy rates of the Bank of England, Sveriges Riksbank, the Federal Reserve and the European Central Bank.
- 3 A lower value means that NOK has appreciated against the import-weighted index I-44. The NOK exchange rate projection is based on the level of the exchange rate at 17 September 2026.
- 4 See Opheim, V. Ø and J. Tendal (2026) "Exchange rate probability distributions derived from option prices". Staff Memo 2/2026. Norges Bank.
- 5 Market-based probability distribution for the krone exchange rate three months ahead, measured against euro. Deviation from futures prices. Positive values on the horizontal scale indicate a weaker krone. The distribution is estimated based on the pricing of options in the FX market. The data is not annualised.
Norwegian mainland GDP
Mainland economic growth picked up in 2025 after a few years of weak growth. Higher household income resulted in solid consumption growth. Growth in exports and petroleum investment remained high, while growth in public sector demand was moderate.
After weak growth around the turn of the year, mainland GDP growth was broadly as expected in 2026 Q2 (Chart 2.3). Growth from the preceding quarter was 0.3%. Certain temporary factors such as lower power production and a strike in accommodation and food services dampened activity somewhat in Q2. Moderate growth is expected in the coming quarters, broadly as projected in the June 2026 Monetary Policy Report. The projections are based on the following:
Constant 2023 prices. In billions of NOK

- Norges Bank’s Regional Network contacts expect moderate output growth through 2026 H2 (Chart 2.4, left panel). Improved household purchasing power, higher defence spending and data centre buildout are important growth drivers. At the same time, weak developments in construction are dampening activity.
Expected output. Quarterly change. Percent1

- According to Norges Bank’s System for Model Analysis in Real Time (SMART), which weights forecasts from a broad set of models, mainland GDP growth will pick up in the coming quarters (Chart 2.4, right panel).
- The conflict in the Middle East is still contributing to uncertainty surrounding economic developments. Energy and other commodity prices have risen further since the June Report (see “Energy and other commodity prices”). This may in isolation dampen household demand and mainland business investment, while potentially lifting petroleum sector investment. In recent months, refined petroleum product prices have risen more than crude oil prices. In isolation this suggests that the negative effects on the Norwegian economy may be slightly larger than assumed in June.
Mainland GDP growth is projected to slow from 1.7% in 2025 to 0.9% in 2026, before picking up slightly thereafter (Chart 2.5). Overall, projections for the period 2026 to 2029 are little changed since the June Report.
Annual change. Contribution to annual change. Percentage points2
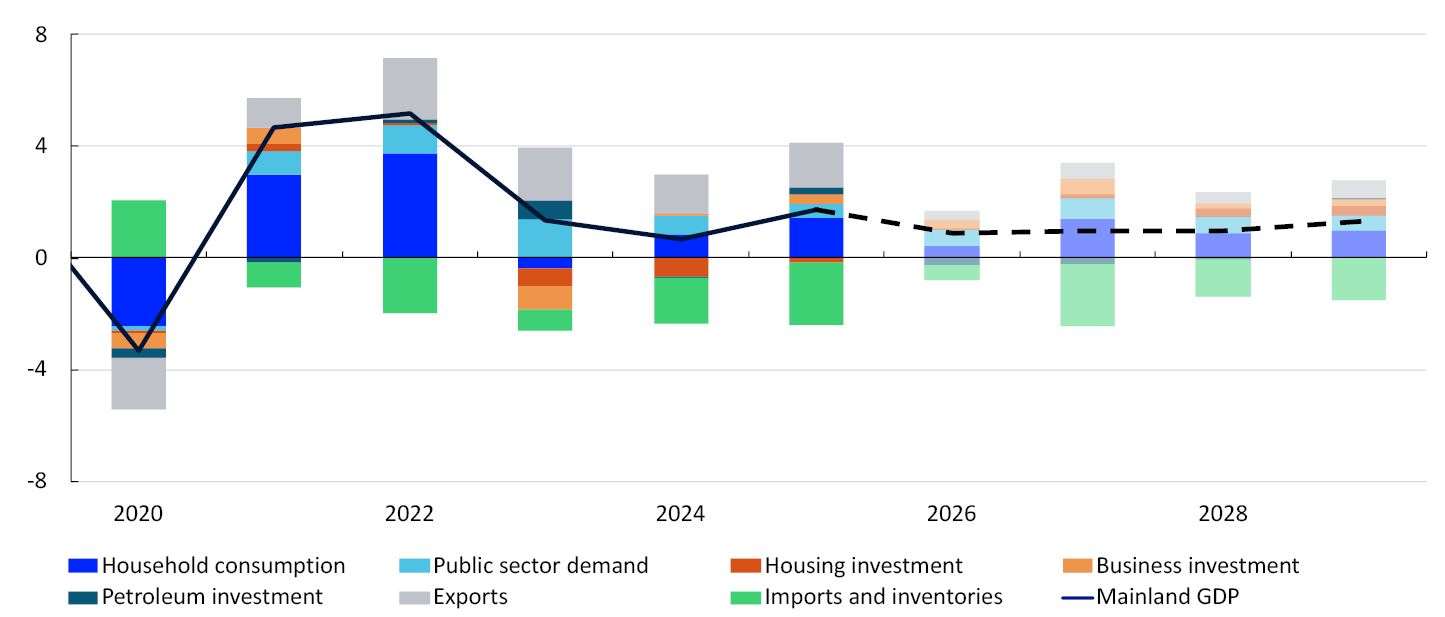
It appears that household consumption growth will be low in 2026, before annual growth likely picks up from 2027. Housing investment is projected to pick up from 2027 and growth in business investment to hold up ahead. Export growth will likely be moderate ahead. Petroleum sector investment is expected to decline as ongoing development projects reach completion. Growth in public sector demand is projected to increase in 2027, before drifting down thereafter. For detailed projections and changes from the June Report, see Annex Tables 2 and 3.
- 1 Regional Network survey 3/26. The SMART modelling system for short-term forecasting is based on historical relationships. It weights empirical models based on previous forecasting properties.
- 2 The data for petroleum investment in this chart include investment in international shipping. Public demand = public consumption + public investment.
Households
Household real disposable income increased markedly in both 2024 and 2025. Consumption also increased, albeit less than income. Together with higher pension saving, this has led to an increase in the saving ratio.
Both goods and services consumption changed little between 2026 Q1 and Q2 (Chart 2.6). Overall consumption fell in 2026 H1, and developments were weaker than projected in the June Report. Consumption is expected to grow in H2, but weak developments in H1 will pull down annual growth in 2026. Further out in the projection period, consumption growth is expected to pick up. The projections are based on the following:
Constant 2023 prices. In billions of NOK3

- Regional Network contacts in services and retail trade report relatively solid growth in 2026 H1. Developments appear stronger than shown by preliminary national accounts data for household consumption. Regional Network contacts expect higher household purchasing power to push up demand in H2. Some contacts believe that prospects for higher interest rates are dampening sales of consumer durables, although a number of contacts expect tax changes from January 2027 to boost car sales towards the end of 2026.
- Growth in household real disposable income is projected to be lower ahead than in the two previous years. Declining wage and employment growth and higher net interest expenses contribute to the decline. In addition, higher energy prices pull up consumer price inflation in 2026. For the projection period as a whole, income growth will likely be broadly in line with the average for the past decade, which contributes to sustaining projected consumption growth ahead.
- Household saving increased in 2026 H1. Pension saving is assumed to remain elevated ahead. In the projections, consumption increases on average less than household real disposable income in the period 2026–2029, which contributes to keeping the saving ratio elevated ahead.
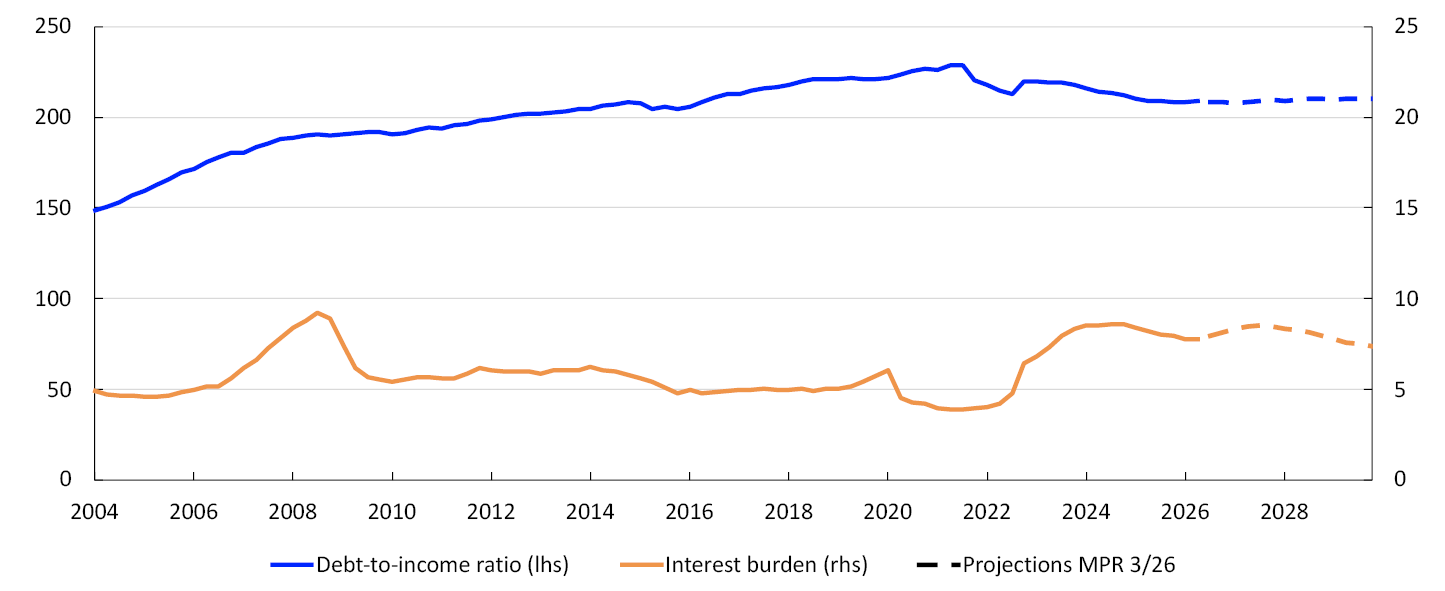
- Households are highly indebted, and in the period to 2024, the interest burden increased before falling slightly through 2025 (Chart 2.7). Higher interest rates are likely to contribute to a slight increase in households’ interest burden in 2027. Debt levels are expected to rise broadly in pace with household income, resulting in minor changes in debt-to-income ratios ahead.
Percent4
Housing market
Following a marked fall through 2023, housing investment has remained low, reflecting a sharp rise in material costs, higher labour costs and higher interest rates. Housing investment in 2026 H1 has been stronger than projected, but developments are expected to be weak in H2. Annual growth is projected to pick up further out in the projection period, albeit less than in the June Report. At the end of 2029, the level is expected to be lower than at the beginning of 2023 (Chart 2.8). The projections are based on the following:
Constant 2023 prices. In billions of NOK (investment). Index. January 2003 = 100 (prices)

- Activity among Regional Network construction contacts is low, with few new projects planned. A number of contacts nevertheless believe that residential construction has troughed, but many report that the upturn keeps getting delayed.
- Figures for housing starts and new home sales indicate that housing investment will change little in the near term (Chart 2.9). Continued high prices for new homes relative to existing homes may delay the rebound in new home sales.
Sales in units (thousands). Housing starts in thousands of square meters, 3-month moving average

- Compared with the previous Report, prospects for a higher policy rate will likely dampen housing investment.
- Over time, increased household purchasing power is expected to lead to somewhat higher demand for both new and existing homes.
- Further out in the projection period, lower interest rates and higher house prices will likely improve profitability in construction and lead to an increase in new builds.
Regulatory easing of equity requirements for house purchases and lower interest rates likely contributed to a sharper rise in existing home prices in 2025. So far in 2026, house price inflation has been low, but there are wide regional differences. Recently, developments have been particularly weak in the Oslo region, while growth is solid in a number of other major cities.
Existing home prices were lower in August than projected in the June Report. Higher house prices are expected ahead, but annual growth in 2026 will likely be quite a bit lower than in 2025. From 2027, the annual rise in house prices is expected to pick up. The projections are based on the following:
- Compared with the previous Report, prospects for a higher policy rate will likely dampen house price inflation.
- Household income growth will likely boost housing demand in the coming years.
- A low supply of new homes suggests higher house prices.
- Over time, lower interest rates will pull in the direction of higher house prices.
Firms
Higher interest rates and other costs are dampening mainland business investment. Following weak developments in the years 2022 through 2024, investment growth picked up in 2025 and is expected to remain at broadly the same level in 2026. In the projections, annual growth picks up to 5% in 2027, before falling to below 2% in 2028 (Chart 2.10). The annual growth projection for 2027 has been revised up since the June Report. The projections are based on the following:
Constant 2023 prices. In billions of NOK5

- On the whole, the firms in Norges Bank’s Regional Network are planning to increase investment in 2026 and 2027. Data centre buildout, technology investment and capacity expansion in tourism are boosting investment. At the same time, some firms are choosing to postpone or halt investment projects due to uncertainty about future profitability.
- According to the investment intentions survey from Statistics Norway, electricity supply investment will increase substantially in 2026 and 2027. The strong increase is primarily driven by investment related to power grid upgrades. Information from grid companies indicates that the investment will continue to increase in the coming years.
- The investment intentions survey indicates that investment in manufacturing and mining and quarrying is likely to increase in 2026 and 2027.
Petroleum sector investment has increased markedly over the past three years, reflecting the launch of a number of development projects in 2022 in response to the petroleum tax package and high oil and gas prices. Petroleum investment is expected to fall from 2026 to 2028, but less than projected in the June Report. The projections are based on the following:
- Investment in ongoing development projects is expected to fall by almost NOK 100bn between 2025 and 2028 as projects reach completion.
- Oil companies have announced a host of new development projects ahead. The new projects are expected to dampen the decline in petroleum investment in the coming years and contribute to increasing investment somewhat in 2029.
- The investment intentions survey indicates that the decline in oil and gas investment in 2026 and 2027 will be broadly as projected in the June Report.
- Constraints on shipping through the Strait of Hormuz have pushed up oil and gas prices. The price increases are expected to curb the decline in petroleum investment ahead.
Export growth has been high in recent years, partly reflecting the krone depreciation in the period to summer 2023, increased tourism, high aquaculture activity levels and higher investment in oil, gas and green technology abroad.
Export growth is expected to decline in these sectors ahead. In addition, low hydropower reservoir levels contribute to a decline in electricity exports in 2026. Mainland exports are projected to grow moderately from 2026 to the end of the projection period. The projections are based on the following:
- Export-oriented Regional Network contacts expect output to increase moderately this autumn. For example, higher global defence spending will boost growth for a number of export firms.
- The krone exchange rate has strengthened in 2026 (see “The krone exchange rate”) and is assumed to be stronger ahead than anticipated in the June Report. In isolation, a stronger krone will dampen Norwegian exports.
- Trading partner GDP growth will likely remain elevated ahead and boost demand for Norwegian exports.
- Global petroleum investment is likely to weaken ahead compared with the period between 2021 and 2025 and contribute to dampening Norwegian export growth.
- The increase in US import tariffs this summer is assumed to have little effect on overall mainland exports.
- 5 Goods and services exports from mainland Norway.
Fiscal policy
Growth in public sector demand has declined over the past two years. Public investment fell through parts of 2025 and in the beginning of 2026. Looking ahead, growth in public sector demand is assumed to be higher than mainland GDP growth (Chart 2.11). Overall, the projections for public demand growth for the years 2026–2029 are broadly in line with the June Report. The projections are based on the following:
Annual change. Percent6
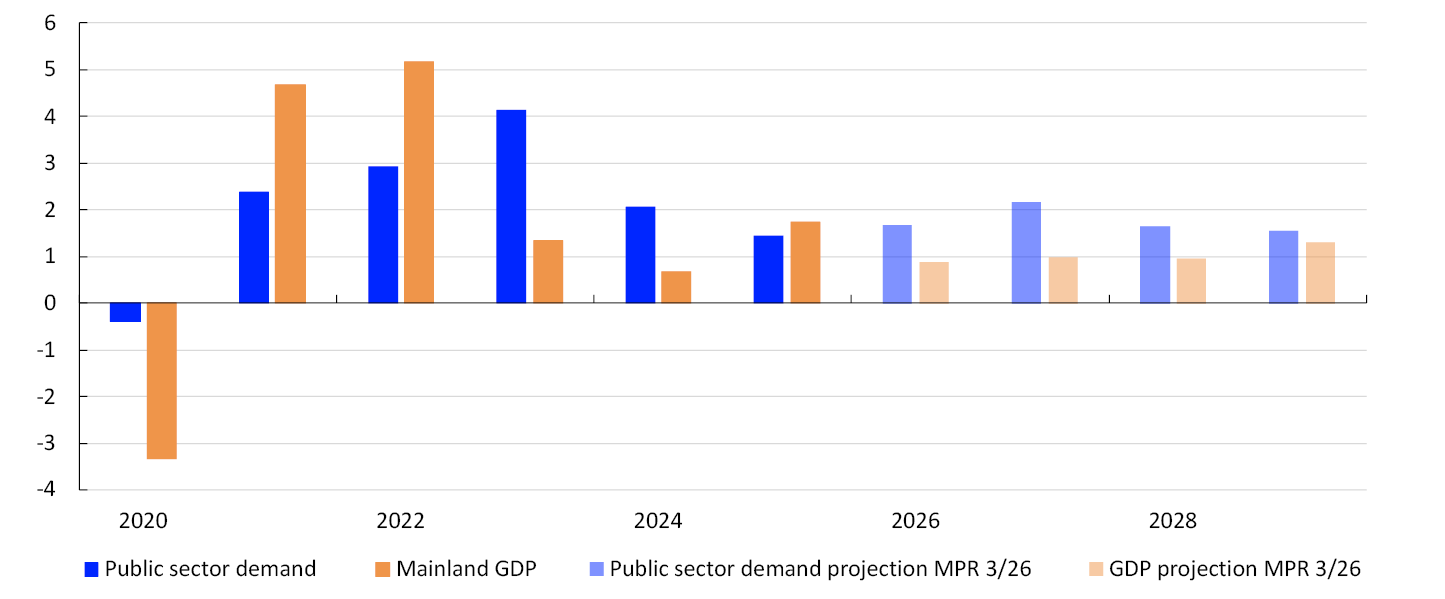
- Growth in public sector demand in 2026 and 2027 is expected to be in line with the proposed Revised National Budget (RNB) and the budget compromise. Higher defence spending will boost growth in public sector demand.
- The structural non-oil budget deficit as a share of the Government Pension Fund Global (GPFG) is assumed to be in line with the proposed RNB for 2026 and the budget compromise. As a share of the GPFG, the deficit is estimated at 2.7% in 2026.
- Support to Ukraine accounts for some of the growth in government spending in 2026 and is expected to have little effect on domestic demand.
According to the estimates from the Ministry of Finance, the fiscal stance, as set out in the proposed RNB for 2026, will have a broadly neutral effect on the level of activity in 2026 and 2027. The estimates also show that the budget plans for 2024–2026 have an expansionary effect on the Norwegian economy in 2026 and 2027.
- 6 Public demand = public consumption + public investment.
Labour market and the output gap
Capacity utilisation, or the output gap, is a measure of the difference between actual output in the mainland economy and potential output. The output gap and potential output cannot be observed and must therefore be estimated. In the near term, the output gap is estimated based on different indicators and models, with particular weight given to labour market developments. The potential output estimate follows from the output gap and GDP estimates. In the longer term, the potential output estimate is based on estimated trend productivity and Norges Bank’s assessment of the highest sustainable level of employment consistent with stable wage and price inflation (trend employment, N*).
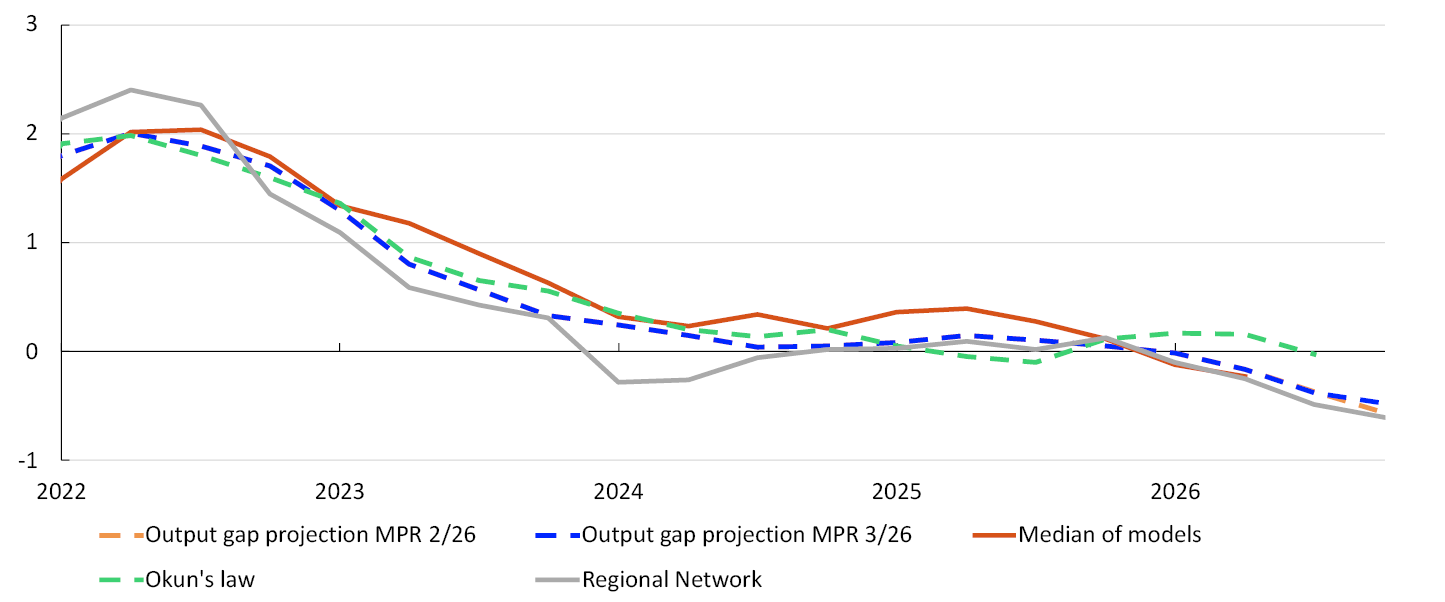
Output is assessed to have been close to potential over the past few years but to have edged down gradually relative to potential and is now likely slightly below potential. The output gap projection has been revised up slightly towards the end of the year compared with the June 2026 Monetary Policy Report (Chart 2.12). The projections are based on the following:
Percent1
- Adjusted for normal seasonal variations, registered unemployment has been stable and close to 2.1% so far in 2026, as projected in the June Report and close to the level consistent with output at potential. Gross unemployment, which also includes job seekers on labour market programmes, has also been stable recently.
- Unemployment measured by the Labour Force Survey (LFS) is higher than registered unemployment, and the gap between the two measures has widened in recent years. This may partly reflect a rise in the number of young job seekers. They often have less incentive to register with the Norwegian Labour and Welfare Administration (Nav) as many are not entitled to unemployment benefits. At the same time, LSF unemployment may suggest that the labour market is less tight than indicated by registered unemployment. Since the June Report, trend LFS unemployment has fallen somewhat.
- Both the stock of vacancies and the inflow of new vacancies have remained stable over the past 12 months. This indicates sustained demand for labour.
- Employment increased slightly more than projected in 2026 Q2. In the coming quarters, employment growth is expected to slow slightly, in line with the expectations of Regional Network contacts. The projections are little changed compared with the June Report.
- The share of contacts reporting capacity constraints and labour shortages has declined since the end of 2025. The indicators suggest that the output gap is somewhat below zero and declining in line with the output gap projection from June.
- Norges Bank’s modelling system for the output gap incorporates variables such as mainland GDP, employment, unemployment, wage growth and inflation. The models indicate that capacity utilisation declined through 2025 and was slightly below a normal level in 2026 H1 (Chart 2.12).
- Mainland GDP evolved broadly as projected through 2026 H1. At the same time, Regional Network contacts expect slightly stronger growth in Q4 than projected in the June Report, in isolation pulling in the direction of a slightly higher output gap towards the end of the year.
The output gap is projected to decline further and bottom out in 2028. Compared with the June Report, labour market developments have been slightly stronger than expected, and the output gap has been revised up slightly for the coming year. The employment rate is expected to hold steady throughout the projection period, albeit slightly below Norges Bank’s assessment of trend growth in the employment rate.
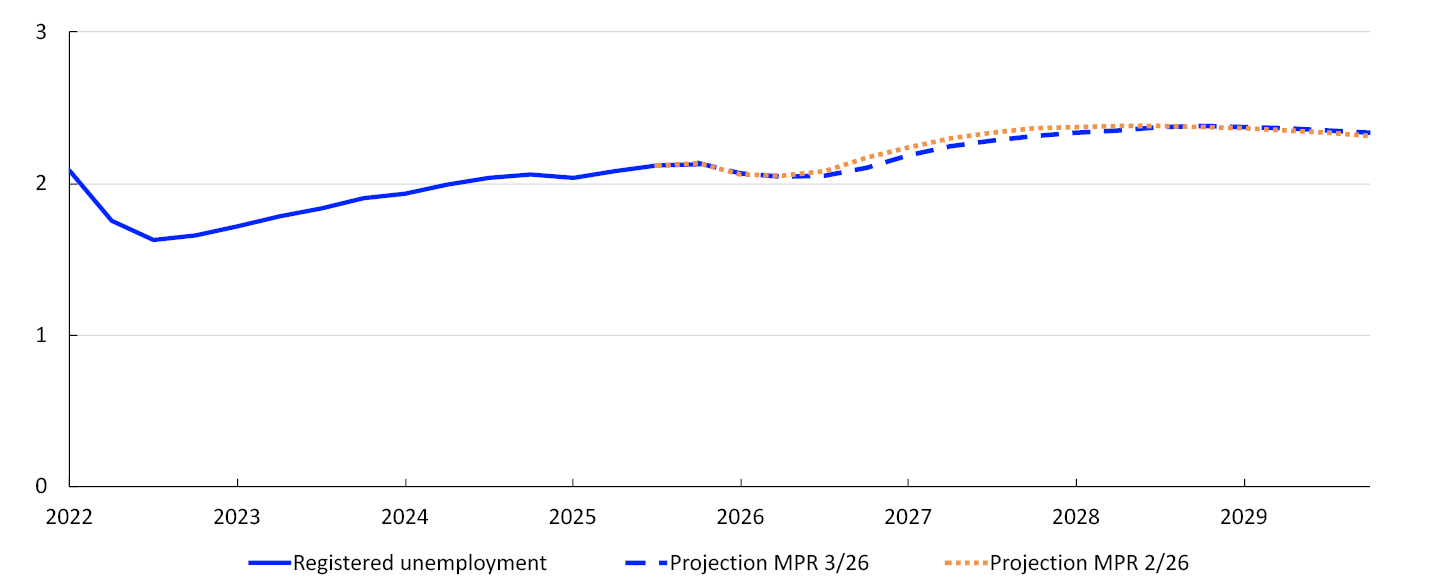
Registered unemployment is projected to rise to 2.4% (Chart 2.13), as in the June Report.
Percent2
Potential output
The growth potential of the Norwegian economy, measured as potential output growth, has gradually declined over the past 20 years (Table 2.1). In the years after the pandemic, however, the decline has levelled off as a result of higher trend employment growth (N*). This increase is partly due to the large inflow of Ukrainian refugees to Norway. In addition, more people in the oldest and youngest cohorts are now employed (see Monetary Policy Report 3/2025 for further details).
Table 2.1 Output and potential output3
|
Percentage change from previous year Change from projections in Monetary Policy Report 2/2026 in parentheses |
|||||||
|---|---|---|---|---|---|---|---|
|
2006–2015 |
2016–2025 |
2025 |
2026 |
2027 |
2028 |
2029 |
|
|
GDP, mainland Norway |
2.8 |
1.9 |
1.7 (0) |
0.9 (0) |
1 (0.2) |
1 (-0.1) |
1.3 (-0.1) |
|
Potential output |
2.9 |
1.8 |
1.8 (0) |
1.2 (-0.1) |
1.5 (0) |
1.2 (0) |
1.2 (0) |
|
N* |
1.4 |
1.1 |
1 (0) |
1 (0.1) |
0.7 (0) |
0.6 (0) |
0.5 (0) |
|
Trend productivity |
1.5 |
0.7 |
0.8 (0) |
0.3 (-0.1) |
0.8 (0) |
0.7 (0) |
0.7 (0) |
Potential output is projected to grow by 1.2% in 2026, The projection is little changed compared with the June Report. The assessment of potential output for 2026 is based on the following:
- Productivity growth has slowed over the past year and was close to zero in 2026 Q2. Productivity in 2026 is assumed to be temporarily low, which curbs potential output in 2026.
- Productivity growth is expected to pick up over the course of 2026 H2, in line with the expectations of Regional Network contacts (Chart 2.14).
Percent4

- Trend employment in 2026 is assessed to be little changed compared with the June Report.
Potential output growth is expected to edge up again between 2026 and 2027 before gradually declining to 1.2% at the end of the projection period. The assessment of potential output ahead is based on the following:
- Trend productivity growth is expected to pick up to 0.8% in 2027 and rise by around 0.7% through the remainder of the projection period.
- Looking ahead, annual trend employment growth is expected to decline gradually, partly owing to prospects for slower population growth. The projections are based on Statistics Norway’s population projections.
- In the coming years, the inflow of temporary foreign workers is expected to increase in pace with employment growth in the wider economy.
- 1 Projections through 2026 Q4. “Regional Network” is a direct estimate of the output gap based on the average of the capacity utilisation indicators in the Regional Network and the historical correlation with Norges Bank’s output gap estimate where the Regional Network indicator leads by one quarter. “Okun’s law” is based on an estimated deviation from the trend in registered unemployment as a percentage of the labour force.
- 2 Registered unemployed as share of the labour force. Seasonally adjusted.
- 3 The contributions from the growth in N* and trend productivity do not necessarily sum exactly to the annual change in potential output due to rounding.
- 4 Annualised quarterly changes. Productivity growth in the Regional Network is calculated as contacts’ expected output growth less expected employment growth. A two-quarter moving average is calculated. Observations from the Regional Network for 2020 have been removed due to scaling difficulties during the pandemic. Productivity growth in the quarterly national accounts is given as mainland GDP per employed person. A four-quarter moving average is then calculated.
Wage growth
Wage growth rose substantially in the wake of the pandemic owing to high inflation, a tight labour market and high profitability in some business sectors. In 2025, wage growth was 4.9%. Wage growth is projected to slow to 4.4% in 2026, slightly lower than projected in the June Report. The projections for 2026 are based on the following:
- In the 2026 wage negotiations, the wage norm for manufacturing was set at 4.4%.
- The output gap is projected to fall through 2026, likely dampening wage growth from 2025 to 2026.
- Regional Network contacts and the social partners in Norges Bank’s Expectations Survey expect wage growth to slow to 4.5% and 4.4%, respectively, in 2026 (Chart 2.15). In the Expectations Survey, wage growth expectations for 2026 have been revised down slightly compared with 2026 Q2.
Annual change. Percent5

- Quarterly data for average monthly wages indicate that wage growth has slowed considerably so far in 2026. This may indicate lower annual wage growth in 2026 than projected in the June Report. At the same time, current figures vary substantially from quarter to quarter, partly because wage settlements can be registered in the statistics at different points in time.
Wage growth is projected to slow further to 4.0% in 2027, unchanged from June. The projection for 2027 is based on the following:
- The Bank’s projections indicate a slight increase in unemployment in 2027 and that the output gap will decline somewhat through the year. Inflation is also projected to fall between 2026 and 2027, suggesting a further slowing of wage growth. Compared with the June Report, these projections are little changed.
- According to Regional Network contacts and the social partners in Norges Bank’s Expectations Survey, annual wage growth in 2027 is expected to be 4.0% and 3.8%, respectively (Chart 2.15). According to Norges Bank’s Regional Network and Expectations Survey, wage growth expectations for 2027 have been revised down slightly compared with 2026 Q2.
- In recent years, the overall wage share in the business sector has been slightly above the average for the past 10 years (Chart 2.16). The wage share is projected to change little from 2025 to 2026.
Percent6
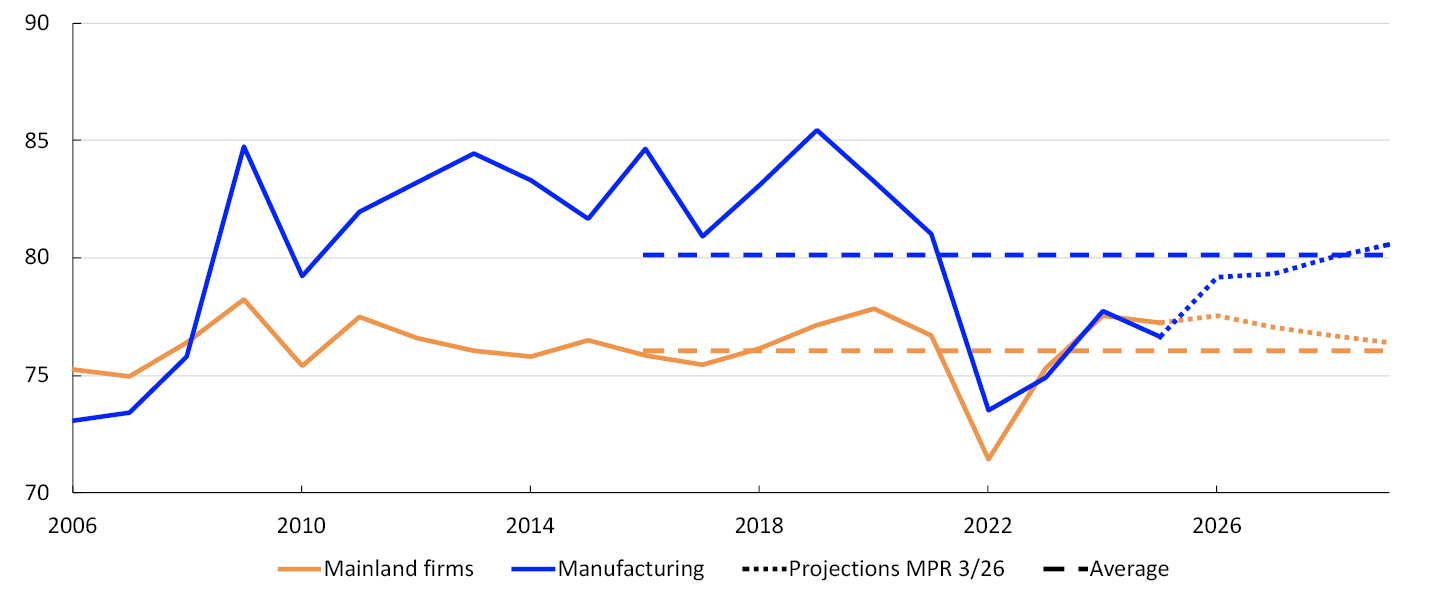
- In recent years, the wage share in manufacturing has been markedly lower than the average for the past decade (Chart 2.16). Information from the national accounts indicates a higher wage share in manufacturing so far in 2026, broadly as projected in the June Report. Looking ahead, a higher wage share pulls in the direction of lower wage growth. The krone has been stronger than projected in the June Report. In isolation, this weighs down on manufacturing profitability. At the same time, prices for a number of commodities have risen (see “Energy and other commodity prices”), pulling in the direction of higher profitability in some manufacturing segments. Overall, profitability projections are little changed from the June Report.
- Norges Bank’s empirical models, which take account of productivity, inflation, capacity utilisation and business profitability, indicate overall annual wage growth of between 4.1% and 4.2% (Chart 2.15).
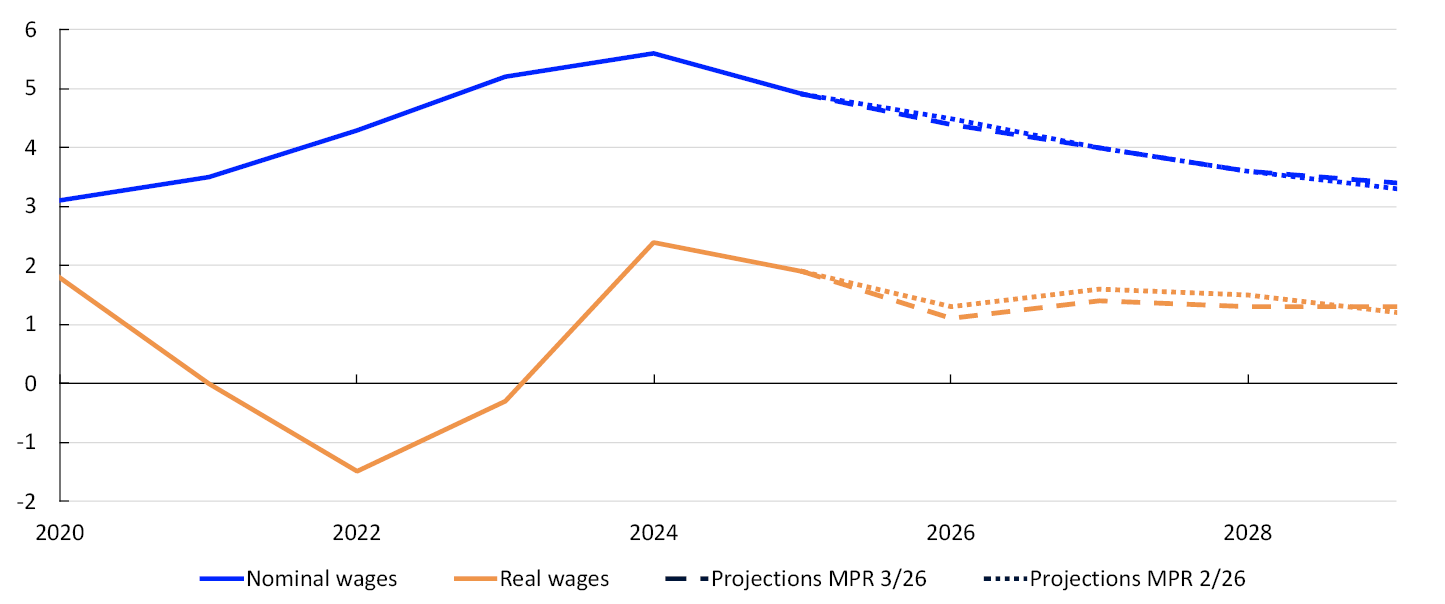
Further out in the projection period, wage growth is expected to decline further, reflecting a looser labour market and lower inflation. Wage shares in both mainland Norway and manufacturing are expected to approach historical averages in the coming years, but the projections are uncertain.
In the projections, real wage growth moderates slightly in 2026, before edging up again in 2027. The projections for the coming years have been revised down slightly compared with the June Report (Chart 2.17). The projections also imply that real wages, as measured by the CPI, will grow faster than productivity through the projection period. This must be viewed in the context of a faster projected rise in firms’ product prices than the projected rise in consumer prices.
Percent7
- 5 Expectations Survey: Social partners’ annual wage growth expectations. Regional Network: Expected wage growth in own enterprise. The VAR models are conditioned on projections for productivity, inflation, capacity utilisation and business profitability for 2026 and 2027.
- 6 The wage share for mainland firms is the share for mainland Norway excluding public administration and housing services. The wage shares for both mainland firms and manufacturing are adjusted for the self-employed.
- 7 Real wage growth: Nominal annual wage growth adjusted for CPI inflation.
Inflation outlook
Inflation has been above the 2% target for several years (Chart 2.18). Inflation expectations among households and business leaders have also remained persistently above target since inflation surged (Chart 1.A). In June and July, the 12-month rise in the consumer price index (CPI) was lower than expected. Inflation increased again in August and was higher than projected. Changes in grid tariffs and higher petrol and diesel prices contributed to the increase. Domestically produced goods and services inflation overall has been broadly in line with projections, while imported goods inflation has slowed more than expected. The 12-month rise in the CPI in August was 3.3%, while the rise in the CPI adjusted for tax changes and excluding energy products (CPI-ATE) was 3.0%.
CPI subcomponents. Contribution to twelve-month change. Percent1

Underlying inflation
Underlying inflation, as measured by the CPI-ATE and other indicators, has been around 3% since July 2024 (Chart 2.19). Through summer, CPI-ATE inflation was lower than projected. Persistently high services and rent inflation is keeping CPI-ATE elevated, while imported goods inflation is pulling in the opposite direction. Annual CPI-ATE inflation is expected to be 3% in 2026, declining thereafter and approaching 2% in 2029. Compared with the June Monetary Policy Report, the projections have been revised down for the coming year and are slightly higher thereafter. The projections are based on the following:
Twelve-month change. Percent2
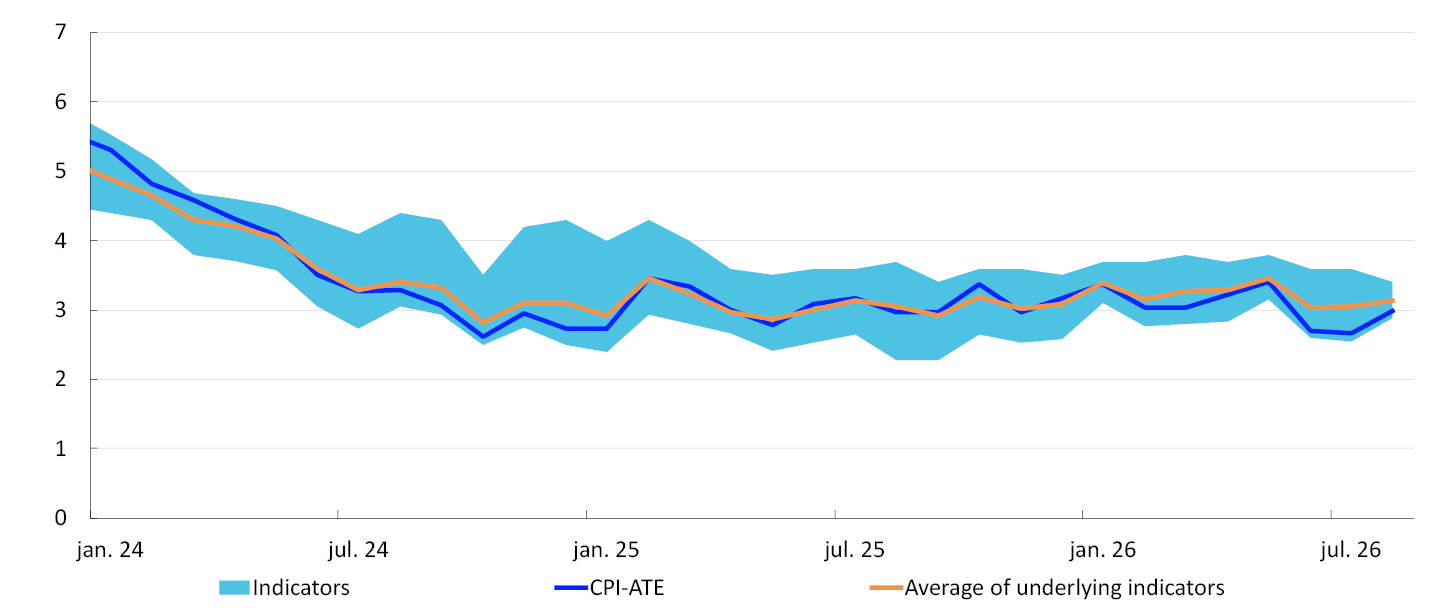
- CPI-ATE projections from Norges Bank’s System for Model Analysis in Real Time (SMART) have been revised down for the coming year (Chart 2.20). Norges Bank’s forecasts are close to the SMART forecasts for the coming quarters.
CPI-ATE. Four-quarter change. Percent3
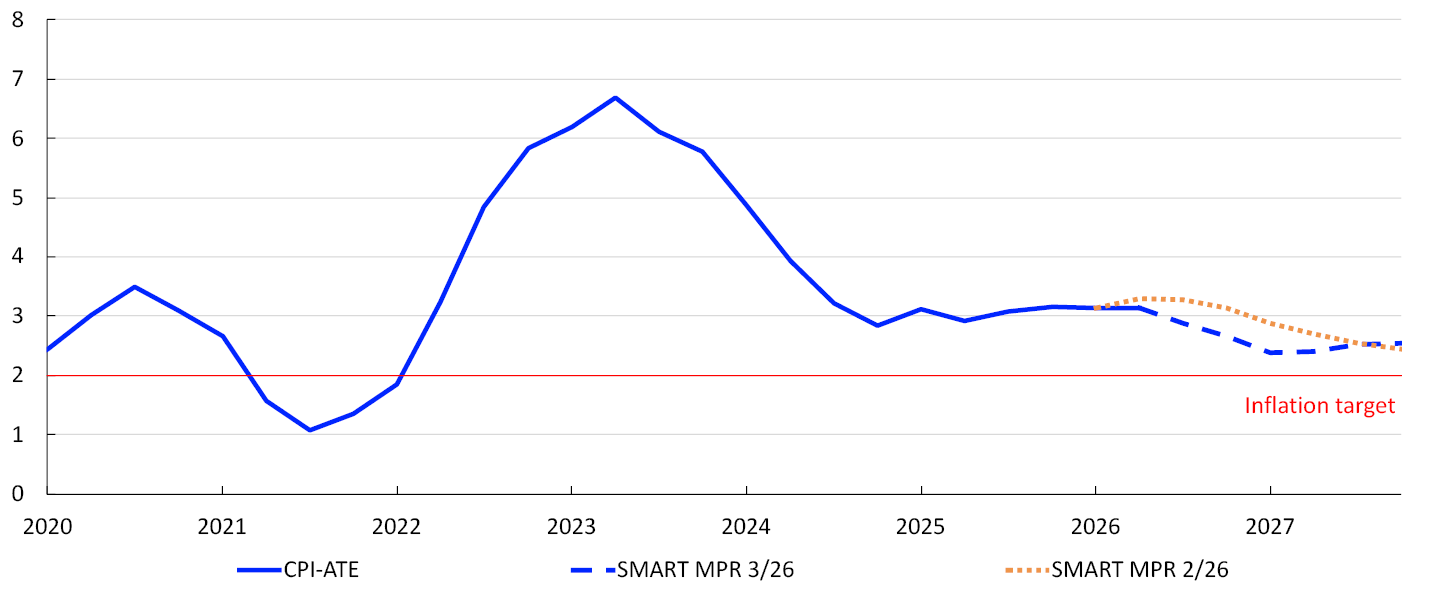
- The Bank’s indicators of imported intermediate and consumer goods prices have risen in recent months. (See “Energy and other commodity prices” for further detail). Overall, the projections for external price impulses have been revised up somewhat compared with the June Report (Chart 2.21).
Four-quarter change. Percent4
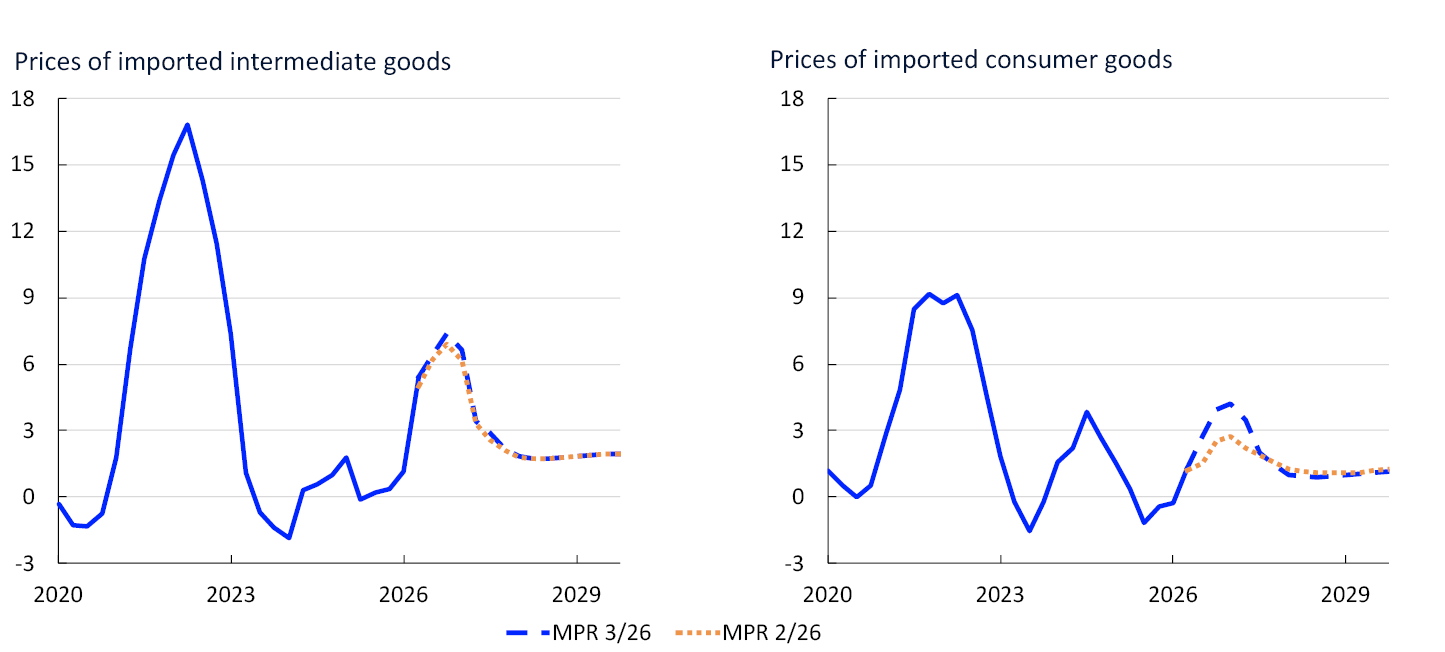
- The krone, as measured by the import-weighted exchange rate (I-44), has appreciated since the beginning of 2026 and is now stronger than assumed in the June Report. A stronger krone is assumed throughout the projection period (Chart 2.D). A stronger krone helps dampen inflation.
- Electricity prices have been high in 2026, and spot and futures prices have risen since the June Report. Higher electricity prices push up business costs and in isolation pull in the direction of higher inflation.
- Rents are expected to rise faster than the CPI-ATE in the coming years and contribute to keeping inflation elevated. As overall inflation comes down, rent inflation is also projected to slow. Compared with the June Report, rent inflation has been revised down for 2026 and 2027.
- Capacity utilisation is projected to decline somewhat in the coming years and contribute to lower price and wage inflation. The projections for capacity utilisation in the coming years have been revised up slightly since the June Report.
- Wage growth has been high in recent years compared with productivity growth. This has resulted in a rapid rise in business costs and has contributed to keeping inflation elevated (Chart 2.22). Overall, the projections for wage and productivity growth show little change from the June Report.
Contribution to four-quarter change in the CPI-ATE. Percentage points5

Consumer price inflation
Annual CPI inflation is projected to be 3.3% in 2026 and is assumed to decline thereafter through the projection period. The projections have been revised up slightly for the coming years compared with the June Report. The projections are based on the following:
- A downward revision of the CPI-ATE projection compared with the June Report pushes down CPI inflation in 2026.
- Higher electricity spot and futures prices push up households’ energy costs. However, the fixed electricity price scheme “Norgespris" has shielded a large share of households in Norway from this cost increase. In July, grid tariffs were also raised. The increase was more pronounced than assumed in the June Report, which pushes up the CPI projection for 2026.
- Following the outbreak of the war in Iran in March, fuel prices increased substantially, but reduced fuel taxes dampened the effect on prices at the pump through summer. The taxes have now been returned to previous levels and are contributing to higher consumer prices. Furthermore, petrol and diesel prices are assumed to follow futures prices. These prices are now higher than in June, pushing up the CPI projection for 2026.
- 1 Contributions estimated based on the CPI by consumption categories (group level). In the statistics, some differences occur between the sum of the components and overall inflation.
- 2 The indicators show the band of indicators CPIM, CPIXE, 20% trimmed mean, CPI-common and weighted median. See Husabø, E. (2017) “Indicators of underlying inflation in Norway”. Staff Memo 13/2017, Norges Bank, for a more detailed review of the indicators.
- 3 The SMART modelling system for short-term forecasting is based on historical relationships. It weights empirical models based on previous forecasting properties.
- 4 IPI: International price impulses to imported intermediate goods, see Brubakk, L., K. Matsen, K. Mjølnerød, Ø. Robstad og E. Werenskiold (2024) “Charting the upstream: An indicator for imported input goods prices”. Staff Memo 5/24. Norges Bank. IPK: Prices for consumer goods imported to Norway (including freight rates), see Røstøen, J. Ø. (2004) “External Price Impulses to Imported Consumer Goods”. Economic Bulletin 21/2004. Norges Bank.
- 5 Isolated individual contributions from various cost components in the CPI-ATE. The residual refers to the difference between the sum of the individual contributions and the CPI-ATE. ULC: Unit Labour Cost. IPK: Prices for consumer goods imported to Norway. IPI: International price impulses to imported intermediate goods.
3. Monetary policy analysis
This section describes the monetary policy analysis presented to Norges Bank’s Monetary Policy and Financial Stability Committee, forming part of the basis for the policy rate decision. The policy rate forecast is explained in Monetary Policy Statement.
Model implications of new information
New information
The forecasts and the monetary policy analysis are primarily based on the macroeconomic model NEMO. For 2026 Q3 and Q4, NEMO is conditioned on projections based on the information and analyses presented in Section 2. Beyond the first two quarters, the model is conditioned on various exogenous driving forces, including market prices for oil and gas, electricity, global economic developments, petroleum investment and public demand. After conditioning on historical data, short-term forecasts and exogenous driving forces, NEMO provides forecasts for the remainder of the forecast horizon. The forecasts are cross-checked against other models.
To summarise how new information and new assessments of the economic situation have affected the forecasts since the June Monetary Policy Report, Chart 3.1 presents forecasts of the output gap and underlying inflation (consumer price index adjusted for tax changes and excluding energy products (CPI-ATE)) given the same policy rate path as in June. Key premises for this analysis are:
Projections with new information conditioned on the policy rate path from MPR 2/26. Percent1
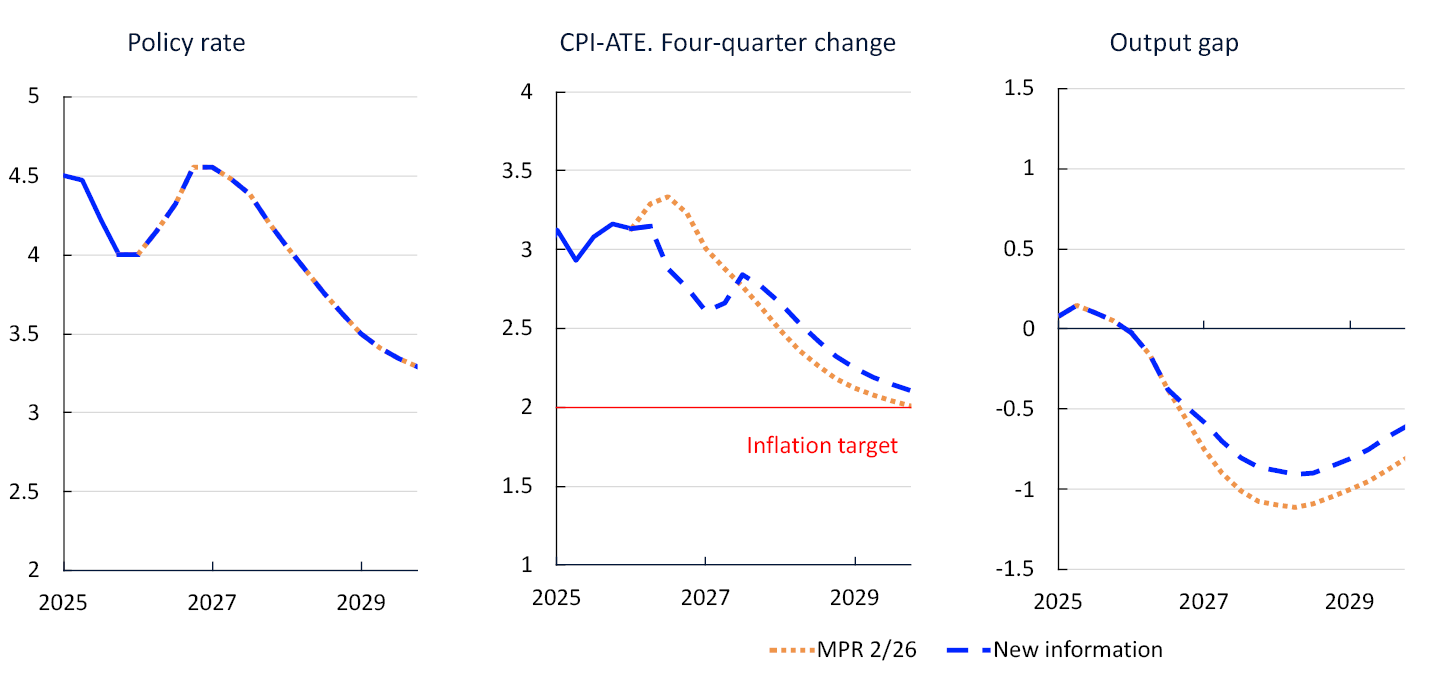
- CPI-ATE growth has been lower than projected in the June Report. Near-term inflation projections have also been revised down. In the model, the downward revision is interpreted primarily as a decline in firms’ margins, which is due to growth in firms’ underlying costs being assessed to be slightly higher than in June.
- Owing to higher commodity prices and freight rates, it appears that external price pressures will be somewhat stronger than assumed in the June Report. Higher electricity prices are pushing up domestic cost pressures.
- The wage growth projection for 2026 is slightly lower than in the June Report, while the projection for 2027 is unchanged.
- The krone exchange rate is stronger than projected in the previous Report, which contributes to dampening inflation ahead. Overall, near-term market policy rate expectations are close to the rate path from the June Report. In the exercise with an unchanged policy rate path, the exchange rate is therefore assumed to change little from the current level.
- The output gap estimate is slightly higher than in June.
- The neutral rate in the model has been revised up since the June Report (Chart 3.4). In the model, this means that an unchanged rate path from June is less restrictive. As a result, further out in the forecast horizon, both inflation and the output gap have been revised up somewhat more than they would have been with an unchanged neutral rate.
This exercise shows that with an unchanged policy rate path, inflation is lower than projected in the June Report over the coming year. The projections have been revised up further out, reflecting somewhat stronger overall forces driving inflation than in June. A somewhat stronger krone implies lower inflation, whereas higher external price pressures and higher electricity costs for firms contribute to higher inflation. The output gap becomes higher than in the June Report.
The model’s policy rate path
NEMO generates a policy rate path that, given the model structure, strikes a balance between low and stable inflation and high and stable output and employment (Chart 3.2). New information and new assessments will normally generate changes in the model-based policy rate path (model path). In both this and the June Report, the model path was lower than the rate path.
Policy rates. Percent2
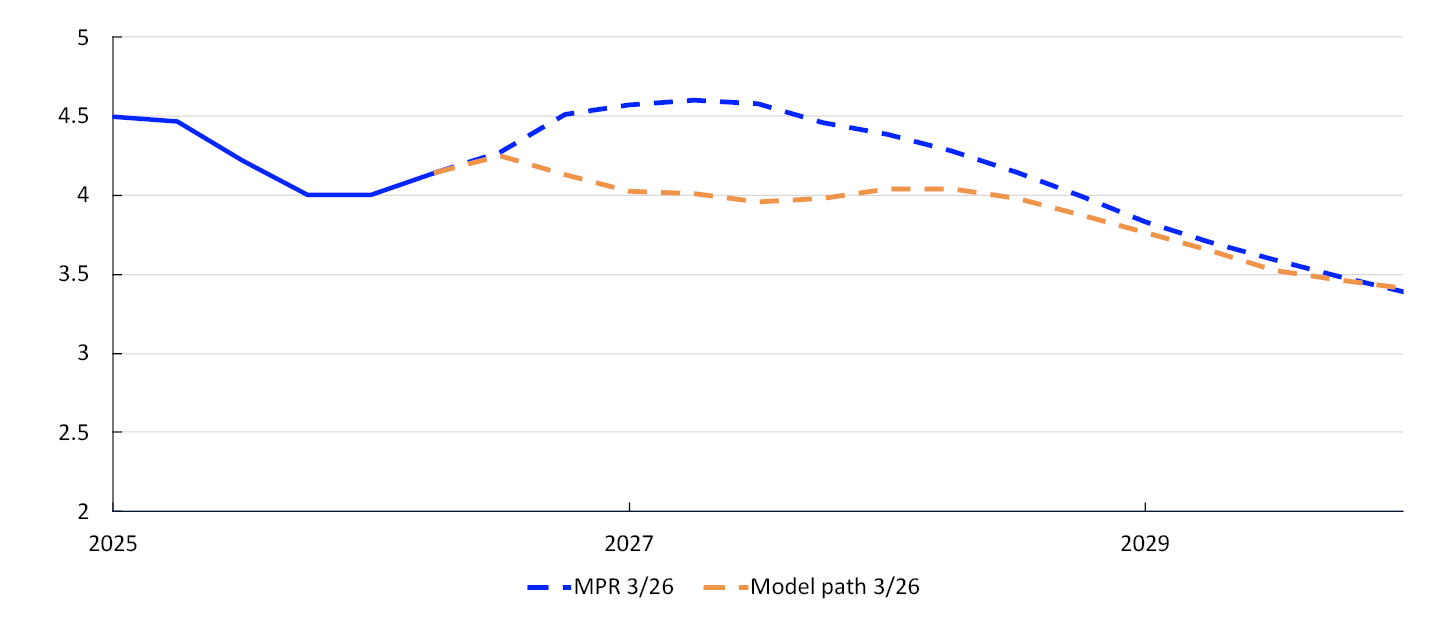
The model path is little changed in the near term compared with the June Report but has been revised up from mid-2027 (Chart 3.3). The krone exchange rate is assumed to weaken somewhat from the current level upon publication of this Report if the rate path follows the model path. This reflects a lower model path than market-implied policy rates in the near term.
Cumulative contribution. Percentage points. 2026 Q3–2029 Q43
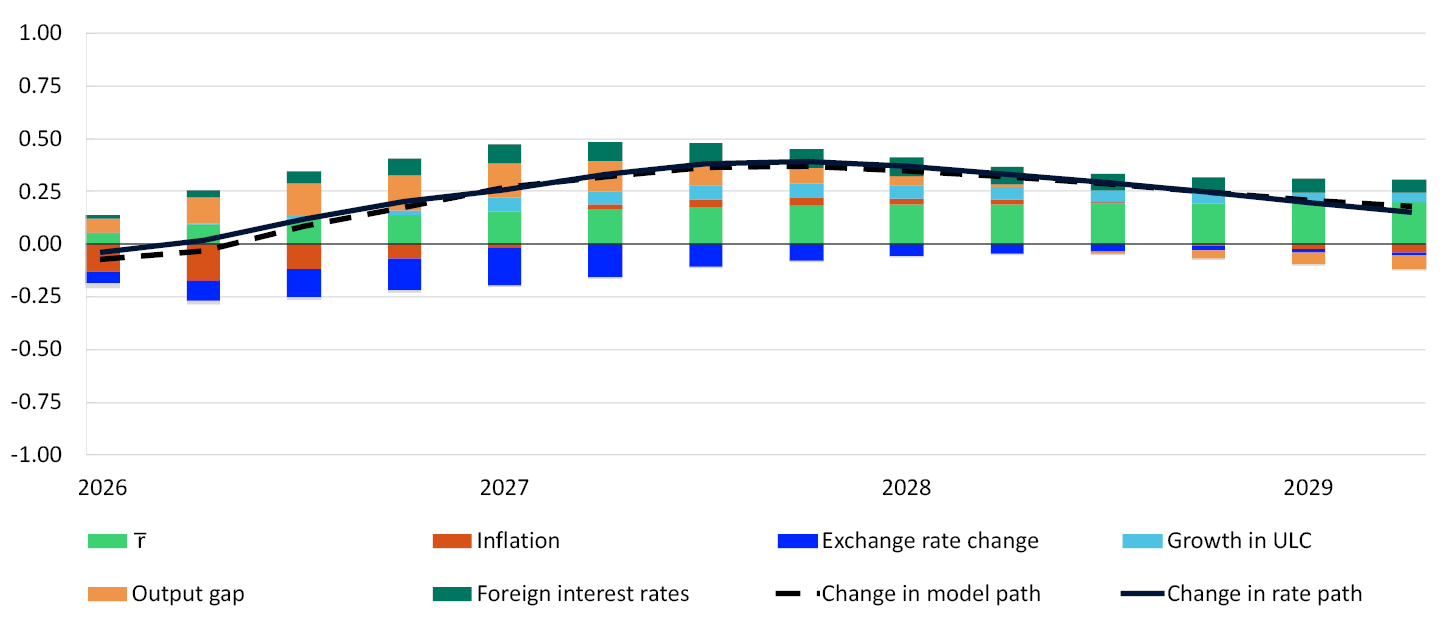
The decomposition in Chart 3.3 shows how changes in the model forecasts for inflation, the output gap and the krone exchange rate, among other factors, contribute to changes in the model path. Presenting the decomposition in this manner does not necessarily provide any indication about the underlying driving forces in the model. In other words, the decomposition shows how changes in the projections affect the model rate, but not what drives the changes. The height of a bar in the decomposition depends on both how much the projection for the variable has changed and the weight of the variable in the GEORG monetary policy rule. The broken line, which is the sum of the bars, shows the change in the model path. The solid line shows the change in the policy rate forecast.
The main contributions to changes in the model path are:
- The inflation projection is lower in the course of the coming year but has been revised up slightly through the remainder of the projection period compared with the June Report. Lower inflation projections contribute to pulling down the model path in the coming year (red bars).
- The output gap has been revised up slightly from the June Report, which pulls up the model path (orange bars).
- For the model path, the krone exchange rate is projected to be a little stronger than assumed for the model path in the June Report. The exchange rate movements therefore push down the policy rate in the model (dark blue bars).
- Near-term market-implied policy rates abroad have risen since the June Report, which pulls up the model path.
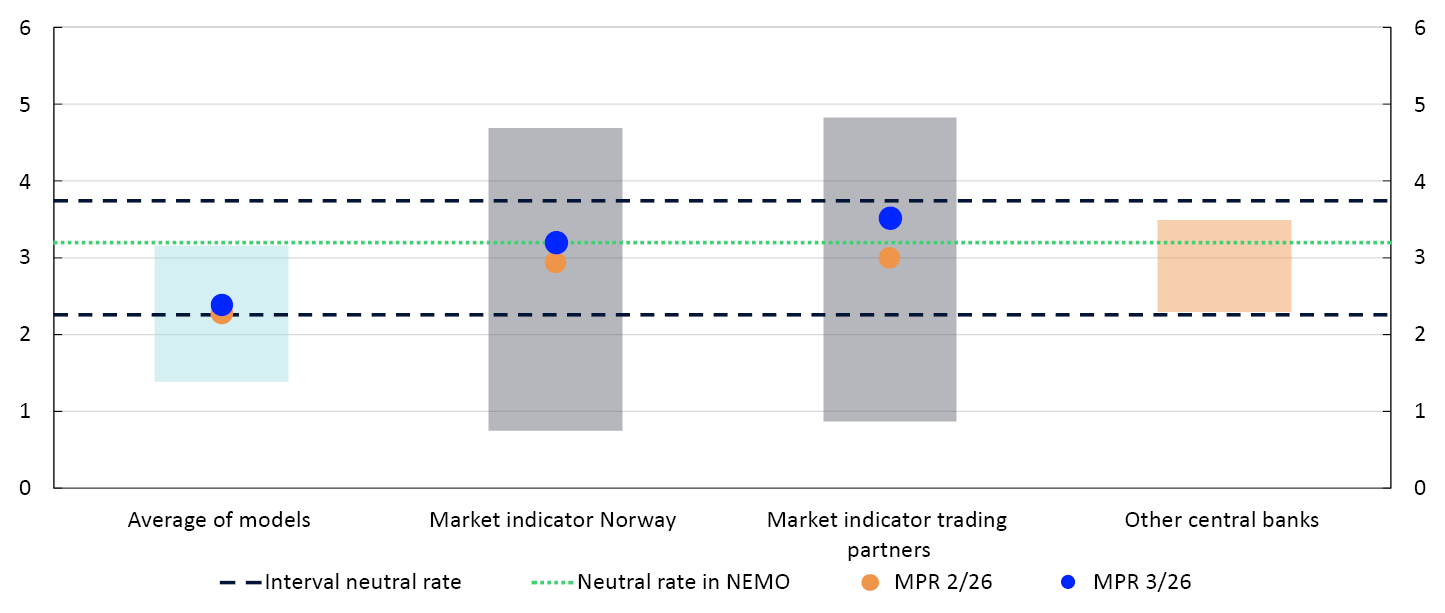
- Market rates at longer maturities both in Norway and among trading partners have risen substantially since the June Report. This pulls up the market indicators of the neutral interest rate (Chart 3.4). The model indicator is also higher than in the June Report. Against this background, the point estimate of the neutral interest rate in the model is raised by 0.2 percentage point to 3.2%, which pulls up the model path throughout the projection period (light green bars).
Percent4
The policy rate forecast in this Report is higher than the model path. The decomposition is based on the model path and its corresponding projections. Using the projections from the rate path generates a change in the model path that is inconsistent with the underlying projections.
Other indicators relevant to monetary policy analysis
- Norges Bank’s simple Taylor rule is used as a simple cross-check of monetary policy. The rule estimates the historical relationship between the current policy rate on the one hand and the policy rate in the previous quarter, long-term market rates and inflation and output gap projections on the other (see Monetary Policy Report 1/2025). The rule gives greater weight to the output gap than the monetary policy rule in NEMO. The rule now indicates a money market rate that is little changed from the June Report (Chart 3.5). This cross-check indicates, like the model path, a somewhat lower policy rate than the projection in this Report.
Three-month money market rate. Percent5

- In the near term, market-implied policy rates can provide an indication of the market’s interpretation of new information since the previous Report and market expectations of the monetary policy response. Market-implied policy rates in the coming year are somewhat higher than in the June Report (Chart 3.6, left panel) and close to the rate path in this Report. In the longer term, market pricing includes term premiums, which means that pricing may deviate to a greater extent from market policy rate expectations. This makes it difficult to make a direct comparison between market pricing and the policy rate path. Long-term market pricing is included in Norges Bank’s assessment of the neutral interest rate in the model (Chart 3.4).
Policy rates. Percent6
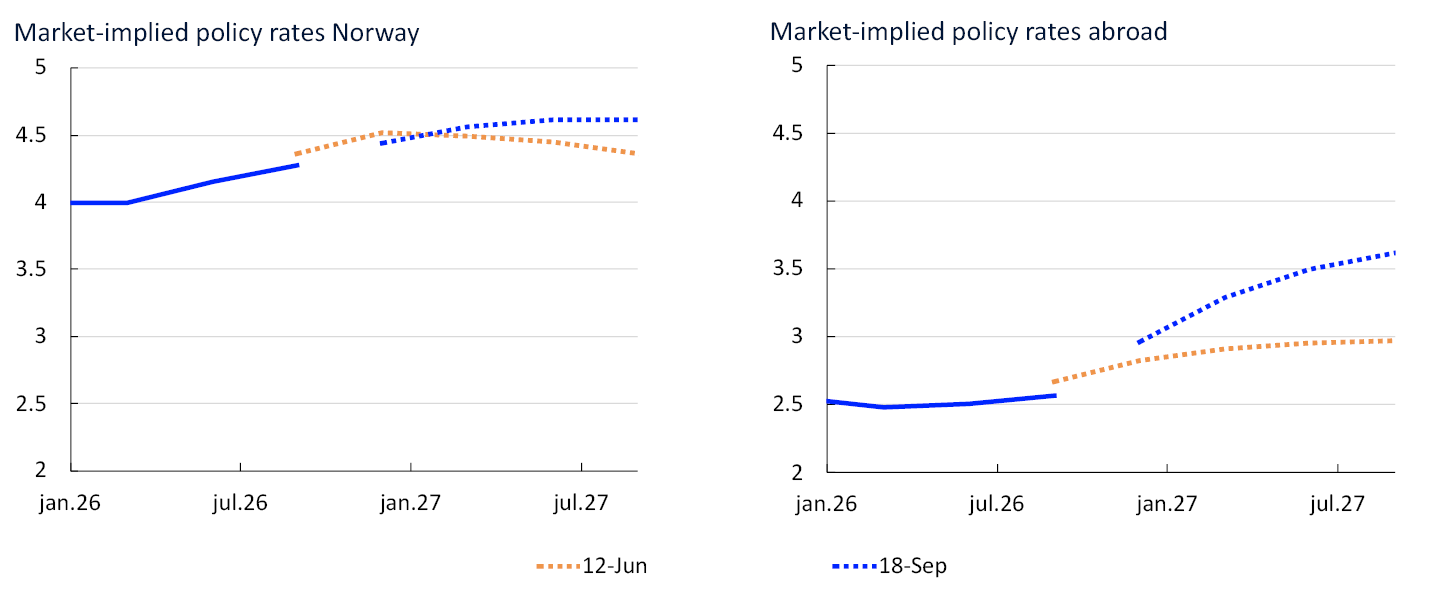
- Norway is a small and open economy, with financial markets highly integrated with trading partner markets. Changes in foreign market rates can affect the krone exchange rate and provide an indication of how market expectations concerning the global economic outlook have changed. Market-implied policy rates among Norway’s main trading partners in the coming 12 months are higher than in the June Report (Chart 3.6, right panel).
- 1 Projections from Monetary Policy Report 3/2026 with new information conditioned on the policy rate path from the previous Report. CPI-ATE: The CPI adjusted for tax changes and excluding energy products. The output gap measures the percentage deviation between mainland GDP and projected potential mainland GDP.
- 2 The model’s policy rate path is calculated in our macroeconomic model NEMO. See Almlid, E., I. F. Haltia and Ø. Robstad (2025) “Mapping Optimal Policy Into a Rule in NEMO: GEORG”. Staff Memo 15/2025. Norges Bank.
- 3 The contributions are based on the GEORG monetary policy rule and reflect changes in forecasts between this Report and the previous Report (see box “A monetary policy rule for understanding changes in the policy rate path” in Monetary Policy Report 4/2025). The forecasts are derived from NEMO when monetary policy follows the model path from GEORG. As a higher policy rate affects prospects for eg inflation and the output gap, the assumed path in the decomposition will deviate from the projections in the Report. Since the rule also gives weight to the fact that the policy rate should not be adjusted too quickly, changes to the model projections will gradually change the level. The forecasts are included as deviations from their normal levels in the model.
- 4 Various indicators of the neutral rate. Black lines indicate the interval assumed for the neutral rate. The green broken line is the level of the neutral rate assumed in NEMO, see “Estimates of the neutral real interest rate” in Monetary Policy Report 2/2026. The market indicator trading partners is a trade-weighted average of market interest rates in the euro area, the UK, the US and Sweden.
- 5 The rule uses projections three quarters ahead for inflation and projections for the current quarter for the output gap.
- 6 12 June: cutoff for the MPR 2/26 projections. 16 September: cutoff for the MPR 3/26 projections.The policy rate abroad is a trade-weighted average of the policy rates of the Bank of England, the European Central Bank, the Federal Reserve and Sveriges Riksbank. Owing to substantial uncertainty related to the level of policy rate expectations ahead, partly due to possible term premiums in market interest rates, the modeling system only conditions on the foreign market interest rates in the first year (see Monetary Policy Report 1/2025).
The monetary policy stance
Description of the policy rate path
The policy rate forecast (rate path) is little changed in the near term but higher in the longer term than in the June Report. The policy rate path is consistent with the rate increasing at this meeting and then remaining at 4.5% for a time. The policy rate forecast falls gradually from the end of next year to just below 3.5% towards the end of the projection period.
The rate path is close to the market-implied policy rate in the near term. It is therefore assumed that the krone will remain broadly unchanged upon publication of the policy rate decision and the Monetary Policy Report.
Market rates and measures of monetary policy restrictiveness
How the policy rate affects the economy depends on both its pass-through to market interest rates and how high these rates are in relation to inflation and the long-term neutral interest rate level. Key developments in this Report are:
- The money market spread is the difference between the three-month Nibor, which is an important reference rate in the Norwegian money market, and the expected policy rate. Overall, the market pricing of the spread is as assumed in the June Report, and the spread projections ahead are unchanged. The money market rate forecast has therefore been revised broadly in line with the policy rate forecast since June (Chart 3.7).
Percent7

- The residential mortgage rate has been broadly as projected in the June Report. The rate is projected to rise from 5.2% in 2026 Q3 to 5.6% towards the end of 2027, before gradually falling (Chart 3.7).
- The expected real interest rate relative to the neutral level is one of several measures of monetary policy restrictiveness. The neutral real interest rate is the real interest rate level that is consistent with a balanced economy over time. Chart 3.8 shows the real policy rate, here defined as the policy rate forecast less Norges Bank’s inflation forecast. The neutral real policy rate is estimated to range between 0.25% and 1.75%, see “Estimates of the neutral real interest rate” in Monetary Policy Report 2/2026. The real policy rate is higher than the interval for large parts of the projection period.
Estimate of the expected real policy rate. Percent8
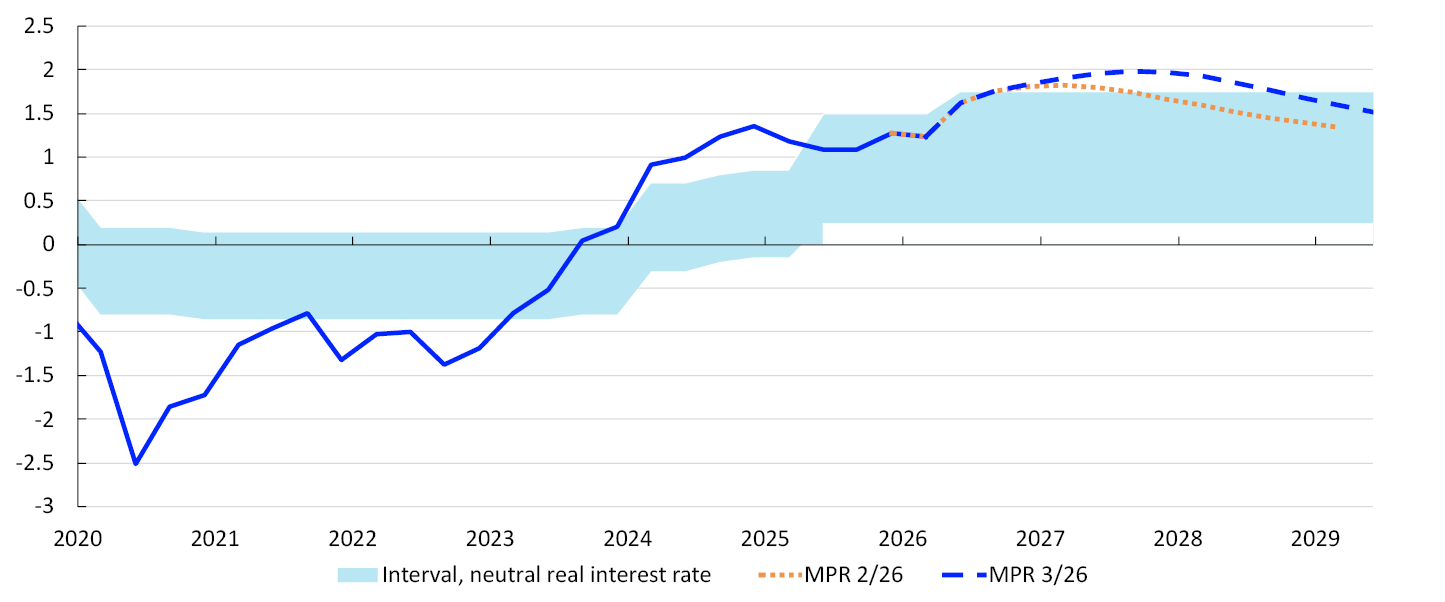
Monetary policy trade-offs
The trade-offs between low and stable inflation and high and stable output and employment are reflected in the Monetary Policy Statement and in the inflation and output gap forecasts. The policy rate, inflation and output gap forecasts are shown in the chart in the Monetary Policy Statement.
The points in Chart 3.9 show the average forecasts one to three years ahead for the output gap and the inflation gap (the difference between inflation and the target) in different reports. The location of the points in the chart depends on the shocks to the economy and the monetary policy response. In this Report, the inflation gap and the output gap are virtually unchanged compared with the June Report (blue point). According to the model, the model path leads to higher inflation and a more positive output gap than projected in this Report (green point).
Inflation gap and output gap. Average 1–3 years ahead. Percent9

- 7 The residential mortgage rate is the average rate on outstanding mortgage loans to households from the sample of banks and mortgage companies included in Statistics Norway’s monthly interest rate statistics.
- 8 The expected real policy rate is the projected policy rate over the next four quarters less projected CPI-ATE inflation over the same period. For 2026 Q3 and in the projection period, the expected real policy rate is estimated based on the projections in this Report. For all previous periods, the expected real policy rate is based on the most up-to-date Monetary Policy Report at the time in question. Norges Bank’s estimated interval for the neutral real rate has been adjusted over time (see box: Estimates of the neutral real interest rate). The interval for the neutral real rate is now between 0.25% and 1.75%.
- 9 The chart shows combinations of forecasts for the output gap (y) and inflation (Π) as deviations from the target (Π*) on average one to three years ahead. Each point represents the forecasts in a specific Monetary Policy Report. There are prospects for near-optimal attainment of objectives if the points are close to the origin. However, the points will typically be some distance from the origin following major shocks. The point for MPR 2/26 is based on the average projections for the same time horizon as for MPR 3/26.
Historical forecast errors and uncertainty indicators
The analyses in this box shed light on the uncertainty around Norges Bank’s forecasts. Fan charts based on historical forecast errors provide an indication of the average level of forecast uncertainty. Model uncertainty indicators suggest that the uncertainty surrounding GDP and underlying inflation forecasts is close to historical levels.
Historical forecast errors are deviations between forecasts and actual developments (see box "Indicators of uncertainty surrounding point forecasts in the near and medium term" in Monetary Policy Report 3/2025). Chart 3.A shows the uncertainty of the forecasts in this Report based on historical forecast errors from the past 20 years. If future forecast errors follow the same pattern as historical errors, actual outcomes will lie within the light shaded areas with a 70% probability. The distributions will change little from report to report.
Historical forecast errors centred on the forecasts for inflation, the policy rate and the output gap. Percent1
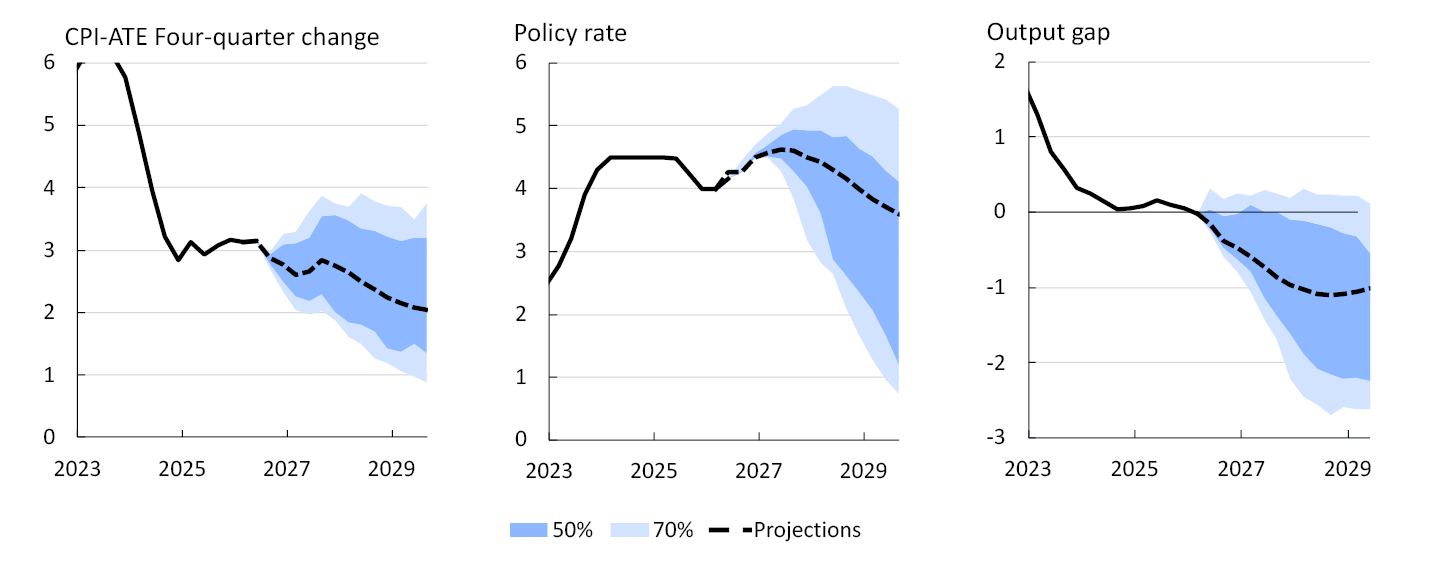
Historical forecast errors provide an indication of the uncertainty normally surrounding Norges Bank’s forecasts but provide little indication of changes in uncertainty over time. Uncertainty indicators from an estimated model framework are used to show how uncertainty has changed in recent years and how the range of possible outcomes is expected to look ahead.2 The model framework captures the relationship between a range of economic variables and uncertainty ahead. The upside risk is measured here as the difference between the 95th percentile and the median of the distribution, while the downside risk is measured as the difference between the median and the 5th percentile.
The models indicate that near-term uncertainty surrounding mainland GDP is at a normal level (Chart 3.B, left panel). In the longer term, the upside risk to GDP is also close to its historical average, while the downside risk is somewhat lower. Both the upside and downside risks to GDP are little changed since the June Report.
Spread between different percentiles and median from quantile regressions. Four-quarter change in Norwegian mainland GDP. Percentage points3
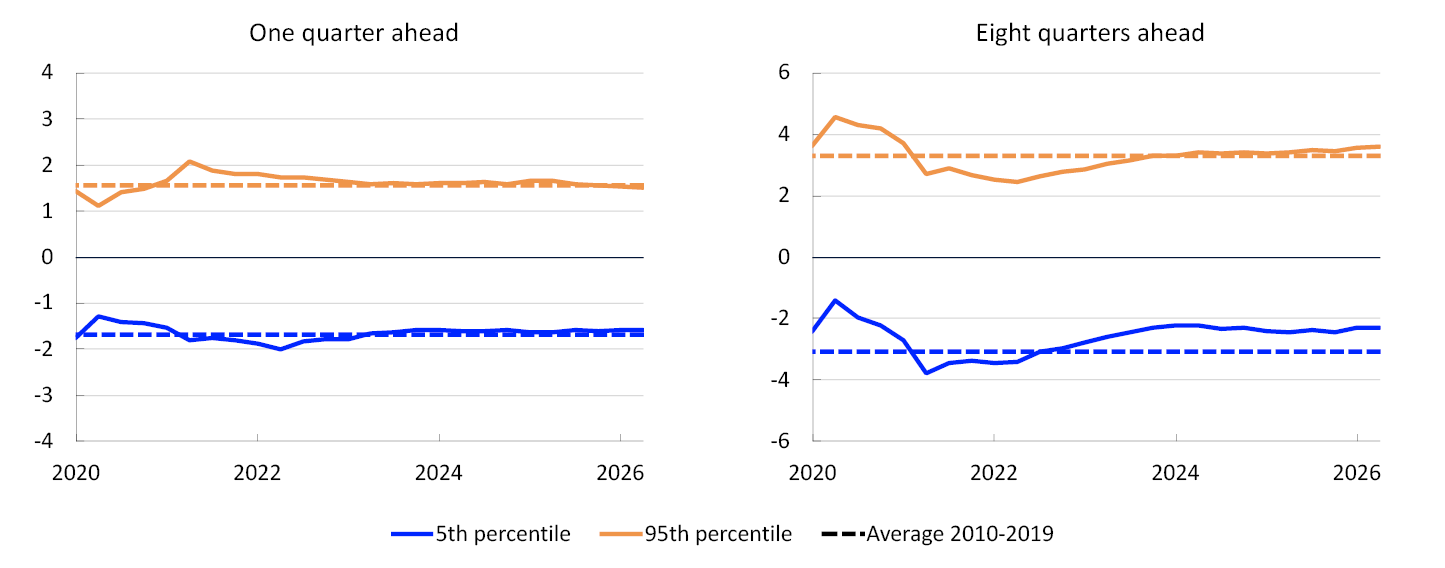
There are also minor changes in uncertainty related to underlying inflation in the near term (Chart 3.C, left panel). The upside risk in the near term is now somewhat higher than the historical average, while the downside risk is close to the historical average. Among other things, the upside risk is related to above-target inflation. In the longer term, the distribution is slightly skewed to the downside (Chart 3.C, right panel).
Spread between different percentiles and median from quantile regressions. Four -quarter change in the CPI-ATE. Percentage points4

- 1 The range of possible outcomes for underlying inflation (CPI-ATE), the policy rate and the output gap are based on forecasting errors over the past 20 years. The distributions are centered on the projections from this Report.
- 2 The models use quantile regressions, with different indicators to forecast output growth, house price inflation and consumer price inflation. See further description in Bowe, F., S.J. Kirkeby, I.H. Lindalen, K.A. Matsen, S.S. Meyer and Ø. Robstad (2023)“Quantifying macroeconomic uncertainty in Norway". Staff Memo 13/2023. Norges Bank.
- 3 The charts show developments in the spread between the 5th and 95th percentiles and the median for the model-estimated distribution of GDP growth one and eight quarters ahead, respectively. Broken lines indicate average 5th and 95th percentiles compared to the median between 2010 and 2019.
- 4 The charts show developments in the spread between the 5th and 95th percentiles and the median for the model-estimated distribution of underlying inflation one and eight quarters ahead, respectively. Broken lines indicate average 5th and 95th percentiles relative to the median between 2010 and 2019.
Box
Krone exchange rate sensitivity to inflation news and monetary policy announcements
Exchange rates react quickly to new information that changes market assessments of economic developments and the monetary policy outlook. A new empirical analysis based on high-frequency data shows that inflation news and monetary policy announcements in Norway and the euro area can collectively explain a relatively large part of the monthly movements in the krone exchange rate against the euro.1
The krone exchange rate is influenced by both developments in the Norwegian economy and international conditions. In a standard model using uncovered interest parity, an unexpected rise in Norwegian market rates relative to rates abroad leads to an immediate appreciation of the krone, followed by a gradual depreciation.2 This in turn implies that news influencing the monetary policy outlook in Norway relative to other countries will also influence the krone exchange rate.
International research has long pointed to challenges associated with finding a stable relationship between economic conditions and exchange rates.3 More recent empirical research challenges the view that exchange rates are largely decoupled from economic conditions. 4 In this box, we examine this relationship by measuring exchange rate movements in narrow time windows around the publication of consumer price data and policy rate decisions. Focusing on narrow time windows makes it easier to distinguish the market reaction to the specific news from movements driven by other factors.
Chart A shows movements in the krone exchange rate against the euro (EURNOK) around publications of Norwegian consumer price data over the period 2002–2025. The chart shows the average and median responses upon publication of consumer price data that have been either surprisingly higher or lower than Bloomberg consensus estimates. The chart also shows that EURNOK changes rapidly when consumer price inflation deviates from market expectations. Higher-than-expected inflation is typically followed by an appreciation of the krone, while lower-than-expected inflation is followed by a depreciation.
Logarithmic change in EURNOK from the level 10 minutes prior to release. 2001–20255

There is considerable variation across individual publications. The absolute exchange rate movements are systematically smaller when measured by the median than by the average. This indicates that a few large movements, measured in absolute terms, raise the average. Response differences may partly reflect the magnitude of the inflation surprise and prevailing market conditions. The chart also indicates that the exchange rate in some cases continues to move after publication. This is because it may take some for the market to capture and interpret new information.
The empirical model examines more systematically how EURNOK is influenced immediately and further out by the publication of consumer price data and monetary policy announcements both in Norway and the euro area.6 Exchange rate movements around these publication events are aggregated for each month into two series: one for news related to relative inflation and one for news related to relative policy rate setting. The series are then used as indicators in the model framework to isolate the monthly krone exchange rate movements related to these news events.7
Chart B first shows the effect of relative inflation and monetary policy news on EURNOK. When inflation increases unexpectedly in Norway relative to the euro area, the krone appreciates immediately, before depreciating gradually again thereafter. The exchange rate is slightly stronger during the first two years following the inflation news release than at the outset. We also find that the krone appreciates when the policy rate is raised unexpectedly in Norway relative to the euro area.8
Krone exchange rate developments may reflect developments in the interest rate differential, represented in the model analysis by the difference between two-year swap rates in Norway and the euro area. Chart B shows that the interest rate differential increases upon both types of news events, which may reflect expectations of higher policy rates ahead in Norway than in the euro area.
Effect of relative news shocks corresponding to one standard deviation on EURNOK and on two-year swap rates upon higher inflation (left) and a higher policy rate (right). Monthly figures9
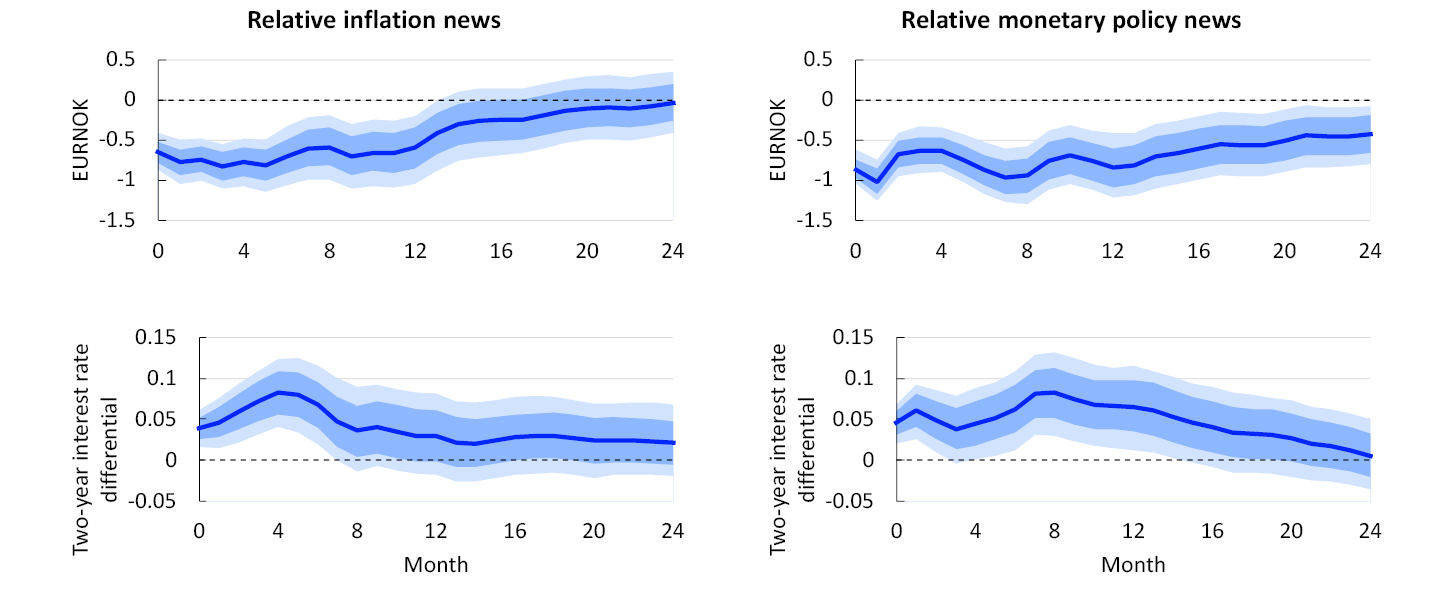
To what extent can krone exchange rate movements be explained by these news events? While an impulse response as in the Chart above shows the effect of a single shock on EURNOK, a variance decomposition shows the share of the monthly variation in EURNOK that can be attributed to each of the shocks in the model. In the decomposition, EURNOK is measured as deviations from the estimated trend in the model. A substantial share of the depreciation of EURNOK since the beginning of the 2000s, around 35%, can be attributed to this trend.10 The duration of the estimated cycles in EURNOK around this trend is 2–5 years. Chart C indicates that inflation news and monetary policy announcements can together explain around three-quarters of the cyclical variation in EURNOK over most horizons.
Contributions from relative inflation and monetary policy news shocks to the cyclical variatiation in EURNOK. Monthly figures11

The results are not unique to the krone. When the same framework is applied to the euro-dollar exchange rate (EURUSD), the picture is very similar. Nor do the results for EURNOK and EURUSD appear driven by the choice of methodology.12
Overall, the analysis provides support for recent literature that finds a close relationship between economic news and exchange rate movements. One possible explanation is that inflation targeting has made central banks’ reaction function more predictable.13 When higher inflation is systematically met with higher policy rates, the expected policy rate response is priced into both market rates and exchange rates.
The results reflect the fact that the analysis does not provide an exhaustive explanation of developments in the krone exchange rate. Although news is identified in narrow time windows, the model only considers monthly effects. Within a given month, the krone exchange rate may move considerably, coinciding for example with changes in oil prices, risk appetite and market conditions. Such factors are not captured by the analysis. As news can only be observed once events occur, the analysis in principle does not provide a better basis for forecasting the krone exchange rate beyond the assumption we can make that the krone exchange rate will react if Norges Bank surprises the market with its policy rate decisions.
- 1 See Gerdrup, K., K. Hallerud and N. Maffei-Faccioli (2026) “Macroeconomic News and Exchange Rates”, Norges Bank Staff Memo (forthcoming).
- 2 See box “The effect of monetary policy on the krone exchange rate” in Monetary Policy Report 1/2025 for a more detailed explanation.
- 3 For a more recent literature review, see eg Itskhoki, O. and D. Mukhin (2021), “Exchange Rate Disconnect in General Equilibrium”, Journal of Political Economy, 129(8), 2183–2232.
- 4 See eg Stravrakeva, V. and J. Tang (2026) “A fundamental connection: Exchange rates and macroeconomic expectations”. The Review of Economics and Statistics, Sep. 2026.
- 5 The chart shows EURNOK movements 30 minutes before and 30 minutes after release of Norwegian consumer price data in the period between 2002 and 2025 relative to 10 minutes before release. The response is calculated separately for releases where consumer price inflation has been higher or lower than the Bloomberg concensus estimate. The chart shows both the average and median change.
- 6 See Karau (2024) “Relative monetary policy and exchange rates”, Discussion Paper No 40, Deutsche Bundesbank, for a study that uses a similar approach to explain exchange rates. For a study that examines other asset prices, see Gürkaynak, R. S., Sack, B., and Swanson, E. T. (2005). “Do actions speak louder than words? The response of asset prices to monetary policy actions and statements.” International Journal of Central Banking, 1(1): 55–9
- 7 The series are used as instruments in a proxy VAR to identify shocks associated with new consumer price data and policy rate decisions. These shocks potentially represent multiple effects of these news events and cannot be interpreted as pure supply shocks (for consumer prices) or pure monetary policy shocks (for policy rate decisions).
- 8 Mæhlum (2025) analyses the effect of monetary policy shocks in Norway and the euro area individually and finds that increased policy rates in Norway or reduced policy rates in the euro area leads to a stronger krone exchange rate (see Mæhlum, M. (2025) “Monetary Policy and the Exchange Rate in Norway”. Norges Bank Staff Memo 3/2023. The analysis in this box finds longer-lasting effects).
- 9 Estimated effect of relative news shocks in a proxy SVAR model. The shocks are identified with the aid of the change in EURNOK in a 24-hour interval around the release of policy rate decisions and inflation data in Norway and the euro area, respectively. The news measures are summarised for each month and used as external instruments. The identified structural shocks are standardised. The shaded areas show 68% and 90% confidence intervals.
- 10 For a more detailed analysis of long-term trends in the krone exchange rate, see Bjørnland, H.C, L. Brubakk and N. Maffei-Faccioli (2024) “Piecing the Puzzle: Real Exchange Rates and Long-Run Fundamentals”. Norges Bank Working Paper 21/2024.
- 11 The chart shows the variance decomposition of the cyclical variation in EURNOK and summarises how much the relative news shocks contribute to explaining the exchange rate variation.
- 12 In the study that this box is based on (see footnote 1 reference), a number of tests are performed to examine the robustness of the results as regards choice of specification and method.
- 13 See Engel, C. and S. P. Y. Wu (2024) “Exchange Rate Models Are Better Than You Think, and Why They Didn’t Work in the Old Days”, NBER Working Paper No. 32808.
Annex
Detailed tables of projections
Table 1 International projections
|
Weights1 Percent |
Percentage change from previous year Change from projections in Monetary Policy Report 2/2026 in parentheses |
|||||
|---|---|---|---|---|---|---|
|
2025 |
2026 |
2027 |
2028 |
2029 |
||
|
GDP |
||||||
|
US |
12 |
2.1 (0) |
2.1 (0.1) |
2 (0.1) |
1.9 (-0.1) |
1.9 (0) |
|
Euro area |
47 |
1.3 (-0.2) |
0.9 (0.4) |
1.2 (0) |
1.4 (0.1) |
1.4 (0.1) |
|
UK |
15 |
1.3 (-0.1) |
1.3 (0.1) |
1.1 (-0.1) |
1.6 (0) |
1.6 (0) |
|
Sweden |
18 |
1.6 (-0.2) |
2.5 (0.6) |
2 (-0.2) |
1.9 (-0.1) |
1.6 (0) |
|
China |
8 |
5.1 (0.1) |
4.4 (-0.2) |
4.5 (0.2) |
4.2 (0.2) |
4 (0.1) |
|
5 trading partners1 |
100 |
1.8 (-0.1) |
1.7 (0.3) |
1.7 (0) |
1.8 (0) |
1.7 (0) |
|
Prices |
||||||
|
CPI US |
2.7 (0) |
3.5 (-0.1) |
2.6 (0) |
2.2 (-0.1) |
2.2 (-0.1) |
|
|
HICP Euro area |
2.1 (0) |
3.1 (0) |
2.6 (0.4) |
1.9 (0) |
2 (0) |
|
|
Underlying inflation 4 trading partners 2 |
2.6 (0) |
2.3 (0) |
2.6 (0.2) |
2.4 (0.1) |
2.2 (0.1) |
|
|
Wage growth 4 trading partners 2 |
3.8 (0) |
3.4 (0.1) |
3.3 (0.1) |
3.3 (0.1) |
3.2 (0.1) |
|
|
Prices for consumer goods imported to Norway, including freight rates3 |
0.1 (0) |
1.9 (0.6) |
2.8 (0.7) |
0.9 (-0.2) |
1.1 (-0.1) |
|
|
Prices for intermediate goods imported to Norway4 |
0.6 (0) |
5.1 (0.3) |
3.7 (0.2) |
1.8 (0) |
1.9 (0) |
|
- 1 The aggregate includes: China, the euro area, Sweden, the UK and the US. Export weights.
- 2 The aggregate includes: The euro area, Sweden, the UK and the US. Import weights.
- 3 In foreign currency terms. Including composition effects and freight rates.
- 4 In foreign currency terms.
Sources: LSEG Datastream and Norges Bank
Table 2 Short-term estimates
Table 2a Consumer prices. Twelve-month change. Percent
|
2026 |
|||||||
|---|---|---|---|---|---|---|---|
|
Jun |
Jul |
Aug |
Sep |
Oct |
Nov |
Dec |
|
|
CPI |
|||||||
|
Actual |
2.7 |
3.0 |
3.3 |
||||
|
Projections MPR 2/26 |
3.2 |
3.1 |
3.0 |
3.2 |
|||
|
Projections MPR 3/26 |
3.5 |
3.8 |
3.4 |
3.2 |
|||
|
CPI-ATE |
|||||||
|
Actual |
2.7 |
2.7 |
3.0 |
||||
|
Projections MPR 2/26 |
3.3 |
3.3 |
3.3 |
3.4 |
|||
|
Projections MPR 3/26 |
2.9 |
2.7 |
2.8 |
2.7 |
|||
Sources: Statistics Norway and Norges Bank
Table 2b House prices. Monthly change. Seasonally adjusted. Percent
|
2026 |
|||||||
|---|---|---|---|---|---|---|---|
|
Jun |
Jul |
Aug |
Sep |
Oct |
Nov |
Dec |
|
|
Actual |
0.3 |
-1.0 |
0.8 |
||||
|
Projections MPR 2/26 |
0.3 |
0.4 |
0.4 |
0.4 |
|||
|
Projections MPR 3/26 |
0.1 |
0.3 |
0.3 |
0.4 |
|||
Sources: Eiendomsverdi. Finn.no. Real Estate Norway and Norges Bank
Table 2c Registered unemployment (rate). Percent of labour force. Seasonally adjusted
|
2026 |
|||||||
|---|---|---|---|---|---|---|---|
|
Jun |
Jul |
Aug |
Sep |
Oct |
Nov |
Dec |
|
|
Actual |
2.0 |
2.1 |
2.1 |
||||
|
Projections MPR 2/26 |
2.1 |
2.1 |
2.1 |
2.1 |
|||
|
Projections MPR 3/26 |
2.1 |
2.1 |
2.1 |
2.1 |
|||
Sources: Norwegian Labour and Welfare Administration (Nav) and Norges Bank
Table 2d GDP for mainland Norway. Quarterly change. Seasonally adjusted. Percent
|
2026 |
||||
|---|---|---|---|---|
|
Q1 |
Q2 |
Q3 |
Q4 |
|
|
Actual |
0.1 |
0.3 |
||
|
Projections MPR 2/26 |
0.4 |
0.3 |
||
|
Projections MPR 3/26 |
0.3 |
0.3 |
||
Sources: Statistics Norway and Norges Bank
Table 3 Projections of main economic aggregates
|
Percentage change from previous year (unless otherwise stated) Change from projections in Monetary Policy Report 2/2026 in parentheses |
||||||
|---|---|---|---|---|---|---|
|
Constant 2023 prices (NOK bn) 2025 |
2025 |
Projections |
||||
|
2026 |
2027 |
2028 |
2029 |
|||
|
Prices and wages |
||||||
|
CPI |
3.0 (0.0) |
3.3 (0.1) |
2.6 (0.2) |
2.3 (0.2) |
2.1 (0.0) |
|
|
CPI-ATE |
3.1 (0.0) |
3.0 (-0.2) |
2.7 (-0.1) |
2.4 (0.1) |
2.1 (0.0) |
|
|
Annual wages |
4.9 (0.0) |
4.4 (-0.1) |
4.0 (0.0) |
3.6 (0.0) |
3.4 (0.1) |
|
|
GDP deflator, mainland Norway |
3.3 (0.0) |
3.8 (-0.1) |
4.0 (0.2) |
3.4 (0.0) |
3.0 (0.1) |
|
|
Real economy1 |
||||||
|
Gross domestic product (GDP) |
5447 |
1.2 (0.0) |
1.0 (0.1) |
0.1 (-0.1) |
-0.5 (-0.1) |
-0.3 (-0.1) |
|
GDP, mainland Norway |
4125 |
1.7 (0.0) |
0.9 (0.0) |
1.0 (0.2) |
1.0 (-0.1) |
1.3 (-0.1) |
|
Output gap, mainland Norway (level) |
0.1 (0.0) |
-0.3 (0.0) |
-0.8 (0.1) |
-1.1 (0.0) |
-1.0 (-0.1) |
|
|
Employment, persons, QNA |
0.7 (0.0) |
0.7 (0.2) |
0.3 (0.0) |
0.3 (0.0) |
0.6 (0.0) |
|
|
Registered unemployment (rate, level) |
2.1 (0.0) |
2.1 (0.0) |
2.3 (0.0) |
2.4 (0.0) |
2.4 (0.1) |
|
|
Demand1 |
||||||
|
Mainland demand |
4295 |
2.0 (0.0) |
1.3 (-0.3) |
2.7 (0.6) |
1.8 (-0.1) |
2.0 (0.0) |
|
– Household consumption |
2199 |
2.7 (0.0) |
0.8 (-0.8) |
2.6 (0.8) |
1.7 (0.0) |
1.8 (0.0) |
|
– Business investment |
469 |
2.7 (0.0) |
2.6 (0.0) |
5.0 (2.4) |
1.5 (-0.2) |
2.0 (-0.3) |
|
– Housing investment |
193 |
-3.6 (0.0) |
0.3 (0.9) |
2.7 (-1.2) |
5.7 (-0.8) |
6.7 (-0.3) |
|
– Public demand |
1434 |
1.4 (0.0) |
1.7 (0.2) |
2.2 (0.0) |
1.7 (0.1) |
1.5 (0.0) |
|
Petroleum investment |
262 |
7.2 (0.0) |
-3.5 (-0.5) |
-4.0 (1.0) |
-1.0 (1.0) |
1.0 (0.0) |
|
Mainland exports |
1188 |
5.8 (0.0) |
1.3 (-0.6) |
2.0 (0.7) |
1.4 (-0.1) |
2.2 (0.2) |
|
Mainland imports |
1692 |
3.8 (0.1) |
3.0 (-1.7) |
3.6 (1.1) |
2.7 (0.0) |
2.9 (0.1) |
|
House prices and debt |
||||||
|
House prices |
5.9 (0.0) |
3.0 (-0.5) |
3.6 (-0.8) |
6.2 (-0.3) |
6.9 (0.4) |
|
|
Household credit (C2)2 |
4.7 (0.0) |
4.6 (-0.1) |
4.6 (-0.1) |
4.6 (0.0) |
4.5 (0.0) |
|
|
Interest rates and exchange rate |
||||||
|
Policy rate (level) |
4.3 (0.0) |
4.2 (-0.1) |
4.6 (0.2) |
4.2 (0.4) |
3.7 (0.3) |
|
|
Import-weighted exchange rate (I-44) (level) |
119.6 (0.0) |
112.3 (-0.9) |
110.0 (-2.0) |
110.0 (-2.0) |
110.0 (-2.0) |
|
|
Expected policy rate, four trading partners (level)3 |
2.8 (0.0) |
2.7 (0.1) |
3.6 (0.6) |
3.7 (0.7) |
3.7 (0.7) |
|
|
Household income and saving ratio1 |
||||||
|
Real disposable income |
3.3 |
2.5 |
1.1 |
1.9 |
2.4 |
|
|
Saving ratio (level) |
5.3 |
6.5 |
5.6 |
5.7 |
5.9 |
|
|
Fiscal policy |
||||||
|
Structural non-oil deficit as a percentage of GPFG4 |
2.6 (0.0) |
2.7 (0.0) |
2.8 (0.0) |
2.8 (0.0) |
2.8 (0.0) |
|
- 1 All figures are working-day adjusted.
- 2 Household credit is stated as four-quarter change at year-end.
- 3 OIS rates, weighted average of rates in the UK, Sweden, the US and the euro area.
- 4 Government Pension Fund Global measured at the beginning of the year.
Sources: Eiendomsverdi, Finn.no, LSEG Datastream, Ministry of Finance, Norwegian Labour and Welfare Administration (Nav), Real Estate Norway, Statistics Norway and Norges Bank