A sharp rise in costs is weakening the outlook
Regional Network contacts report a sharp rise in prices, and the rise has accelerated through summer. At the same time, growth in activity has slowed. Contacts expect the rise in prices and costs and higher interest rates to contribute to a slight decline in activity ahead. Many contacts still report capacity constraints, but the share is smaller than in May. Nearly half of contacts are facing recruitment difficulties. Contacts expect annual wage growth in 2022 to be 4.0%, which is slightly higher than the estimate in May.
Sharp rise in prices
The rise in enterprises’ selling prices is the steepest measured since the start of the Regional Network survey in 2002. In most sectors, the rise in prices has accelerated more than estimated earlier, with a steep rise in retail trade in particular. Over half of contacts expect the rise in prices to slow in the coming year, with a number of contacts citing recent declines in freight rates and prices for certain building materials, for example. On the other hand, contacts expect that high energy prices and wage growth will push up prices ahead.
Profitability among contacts is slightly lower than a year ago. A number of contacts in the regions of southern Norway point in particular to higher electricity costs. Profitability developments have been somewhat better in northern Norway, where electricity prices have been lower. Retail trade contacts report the most pronounced decline in profitability, which largely reflects the unusually profitable summer one year ago for a large number of retail enterprises.
Weaker prospects in most sectors
Over the past year, turnover volumes among a large number of Regional Network enterprises increased substantially, although growth was weak over the past three months (Chart 1). Activity has fallen in retail trade and construction (Chart 2). In oil services, however, growth has picked up.
Chart 1. Total output growth Growth past three months and expected growth next six months. Seasonally adjusted. Annualised. Percent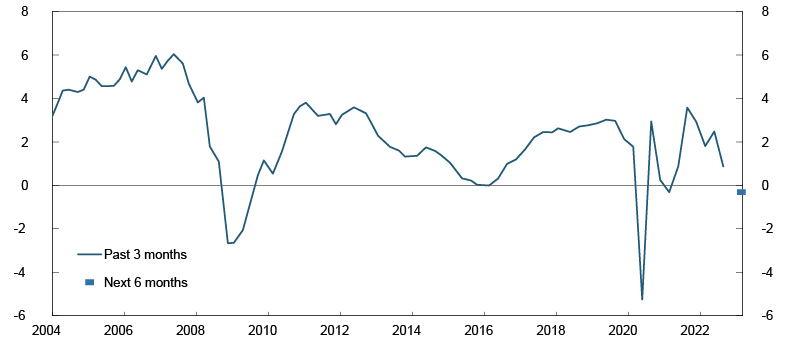
Chart 2. Output growth. All sectors Growth past three months and expected growth next six months. Seasonally adjusted. Annualised. Percent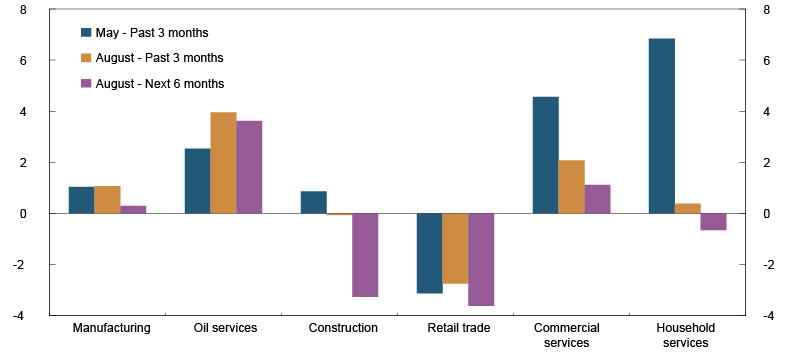
Contacts expect activity to fall through autumn and winter, with a sharp rise in prices and costs and higher interest rates having a dampening effect on demand ahead, particularly from households and construction clients. Nevertheless, many contacts emphasise that they are uncertain about how households and the business sector are adapting to the unusually steep rise in costs.
Falling construction activity
Construction contacts expect a significant lull ahead. The weak prospects are corroborated by contacts in building materials sales and manufacturing and in real estate development. Planned projects have become unprofitable, and a number of construction projects have been deferred owing to higher construction costs. At the same time, some contacts report that deferred projects may nevertheless commence if construction costs normalise.
Commercial services report slower growth, and enterprises expect growth to be dampened further in the next six months. Only a few enterprises expect activity to fall, but fewer expect strong growth than in the previous surveys. Demand is still high for services in legal and strategic consulting, IT and temporary staffing, where substantial recruitment difficulties continue to weigh on growth. At the same time, some contacts report that demand is slightly weaker than at the beginning of 2022. A number of contacts expect that, owing to the sharp rise in costs, enterprises will spend less money on, for example, travel and marketing, or will defer development projects.
Declining household demand
Growth has slowed in household services following robust growth this spring. In summer, far more Norwegians holidayed abroad than in the two preceding summers. Airline strikes and extreme heat in parts of Europe have nevertheless restrained foreign travel somewhat. Large parts of the Norwegian tourism industry have therefore had a busy summer, even though some segments report a decline following the unusually profitable spring. Looking ahead, contacts expect that weaker household purchasing power will lead to lower spending on, for example, restaurants and accommodation.
Estate agents report stable activity. After the entry into force of the Sale of Real Property Act on 1 January 2022, which resulted in a period of lower activity, activity has stabilised. Estate agents expect that fewer housing starts and higher interest rates will have a dampening effect on housing market turnover ahead.
Turnover volume in retail trade has declined further through summer, and the decline is approximately as expected in May. Many retail trade enterprises nevertheless report higher sales in summer than in the pre-pandemic period, but only a few report higher sales volumes in the recent period. Retail segments such as the grocery trade, building materials, furniture and sporting goods report the sharpest declines in sales volumes. On the other hand, turnover in clothing and shoes has risen. Contacts expect that turnover volume in retail trade will continue to fall, citing a sharp rise in prices and higher interest rates and an increase in cross-border shopping by households.
High oil prices and tax changes give a boost to the oil industry
Growth among oil service enterprises has picked up in the recent period, and there are prospects for solid growth over the next six months. The tax changes for the oil industry are boosting growth, which is in line with the expectations in previous surveys, where contacts had expected that the tax changes would have an effect from the latter half of 2022. High oil prices are also pushing up demand, particularly in the export market. The war in Ukraine has resulted in increased interest in oil and gas resources in Norway. Owing to solid prospects in the coming years for the oil and gas industry, some enterprises are shifting back to petroleum-related projects after having reduced activity aimed at this market in recent years.
In non-oil manufacturing, growth is slowing, and contacts expect low growth ahead. Developments are weakest in the domestic market, and domestically-oriented manufacturing expects reduced output over the next six months. The building materials industry and the food industry continue to report a reversal of the high demand during the pandemic. In the export industry, growth picked up this summer and contacts expect growth to remain buoyant in the coming period. Fish and seafood industry contacts report increased demand and have had favourable production conditions this summer.
Downward revision of investment plans
Regional Network contacts are planning for a slight increase in investment in the coming year (Chart 3). Growth has slowed through 2022 and is now at its lowest level since autumn 2020. The slowdown partly reflects large investments by many contacts over the past year and high construction costs. Oil service enterprises are planning for a substantial increase in investment, primarily in capacity expansion and innovation.
Chart 3. Investment growth Expected growth next 12 months. Percent
Slightly lower capacity utilisation
The share of contacts reporting capacity constraints has increased markedly over the past year but has declined slightly through summer (Charts 4 and 5). The decline is broadly based. Close to six in ten contacts continue to report full capacity utilisation, and this share is far above the historical average.
Chart 4. Capacity utilisation1 and labour supply constraints2 Percentage shares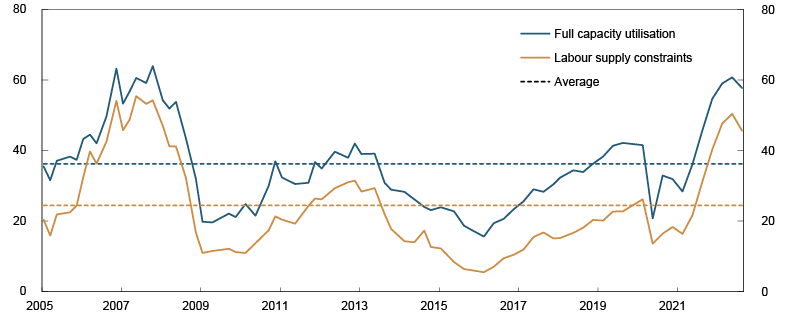
Chart 5. Capacity utilisation1 and labour supply constraints2 Percentage shares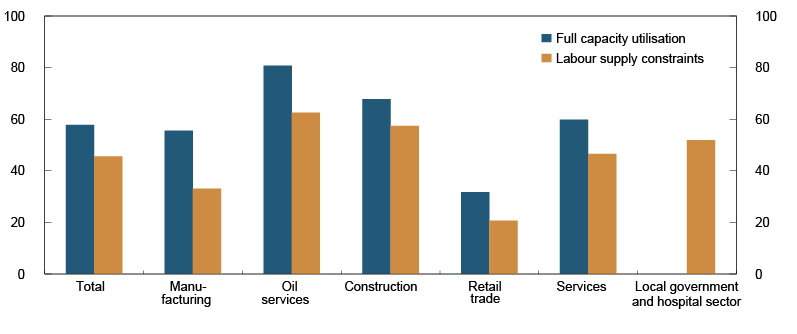
In the previous surveys, many contacts reported challenges related to the flow of goods. Production and transportation disruptions still exist, but some contacts report fewer problems. Many contacts have also adjusted to the situation, for example, by ordering goods earlier than normal. On the other hand, the war in Ukraine has exacerbated shortages of some intermediate goods, such as timber, steel and microchips, resulting in output constraints for some contacts.
Fewer contacts report recruitment difficulties than in May, but challenges remain widespread in most industries. Labour shortages are the most critical in oil service and construction enterprises, even though the share has fallen slightly in construction.
Contacts report increased employment in line with expectations in May. Contacts are planning for lower growth through autumn, but growth is expected to be fairly high compared with activity (Chart 6). However, contacts emphasise that a fall in demand in the period ahead will lead to workforce reductions slightly further out. Some contacts have implemented hiring freezes. Oil service enterprises are planning for the largest increase in staffing ahead, while construction and retail trade enterprises are planning for a reduction.
Chart 6. Employment growth Growth past three months and expected growth next three months. Seasonally adjusted. Percent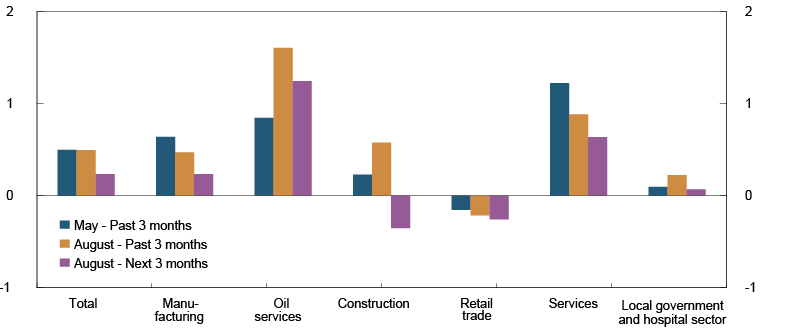
Upward revisions of wage expectations
Contacts expect annual wage growth in 2022 to be 4.0% (Chart 7). The estimate has been revised up from 3.9% in the previous survey. The local government and hospital sector reports the lowest estimate, 3.7%, while services contacts expect the sharpest rise in wage growth, 4.3%. The other sectors expect wage levels to rise by between 3.8% and 4.2%. Many of the contacts follow the wage norm set in the annual wage settlement, but the tight labour market is pulling up wage growth further for a large number of contacts. The sharp rise in prices also pulls up wage growth for a number of contacts, particularly among contacts that hold wage negotiations after summer.
Chart 7. Annual wage growth Expected annual wage growth. Percent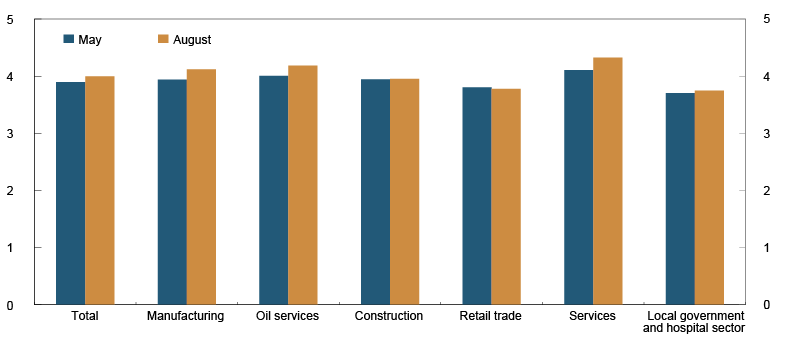
|
This survey |
Previous survey |
|
|
Output and demand Output growth past three months (annualised percentage growth) |
||
|
Total |
0.9 |
2.5 |
|
Domestically-oriented manufacturing |
0.4 |
1.0 |
|
Export-oriented manufacturing |
2.1 |
1.1 |
|
Domestically-oriented oil service industry |
3.9 |
2.7 |
|
Export-oriented oil service industry |
4.1 |
2.2 |
|
Construction |
-0.1 |
0.9 |
|
Retail trade |
-2.8 |
-3.1 |
|
Commercial services |
2.1 |
4.6 |
|
Household services |
0.4 |
6.8 |
|
Expected output growth next six months (annualised percentage growth) |
||
|
Total |
-0.3 |
1.6 |
|
Domestically-oriented manufacturing |
-1.5 |
1.7 |
|
Export-oriented manufacturing |
3.0 |
2.7 |
|
Domestically-oriented oil service industry |
3.6 |
2.5 |
|
Export-oriented oil service industry |
3.6 |
2.5 |
|
Construction |
-3.3 |
0.2 |
|
Retail trade |
-3.6 |
-2.8 |
|
Commercial services |
1.1 |
3.2 |
|
Household services |
-0.7 |
2.9 |
|
|
||
|
Employment growth past three months |
0.5 |
0.5 |
|
Expected employment growth next three months |
0.2 |
0.4 |
|
Labour supply constraints |
45.6 |
50.4 |
|
Full capacity utilisation |
57.7 |
60.8 |
|
Costs and prices |
||
|
Estimated annual wage growth for current calendar year (percent) |
4.0 |
3.9 |