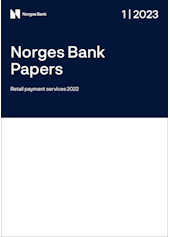
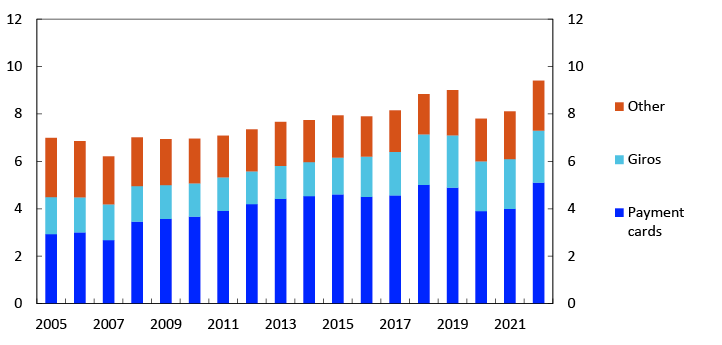
1 Use of payment instruments
In 2022, a total of 3786 million card and giro payments were made. The number of card payments was far higher than the number of giro payments (Chart 1). The rise in the number of card payments has picked up again since the long steady pre-pandemic rise was disrupted.
Chart 1 Use of payment instruments
In millions of payments. 2001–2022
Giro payments are transfers between bank accounts. They can be initiated by the payer or the payee. Transfers that are initiated by the payer are called credit transfers. An ordinary online banking payment is a credit transfer. Avtalegiro is a form of direct debit initiated by the payee whereby funds to cover recurring payments are automatically drawn from the payer.
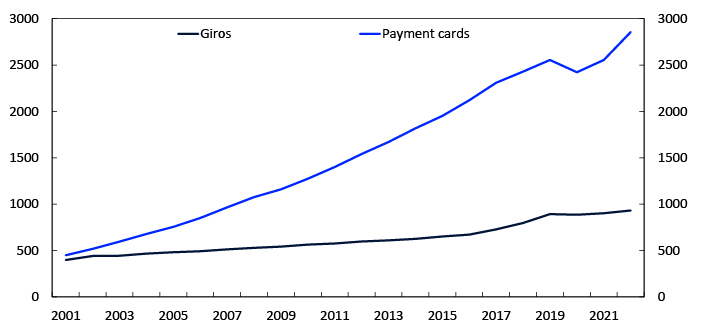
Even though giro payments were far fewer, their value was far higher than the value of card payments (Chart 2). A typical giro payment is thus much larger than a typical card payment. In 2022, the average value of giro payments was NOK 26 046, while the average value of card payments was NOK 375.
Chart 2 Use of payment instruments
In billions of NOK. 2001–2022
Giro payments are used for both paying large bills and for paying wages and salaries, but are increasingly also being used for smaller payments, such as P2P instant payments using the Vipps mobile payment app. Payment cards are primarily used for the purchase of goods and services at points of sale.
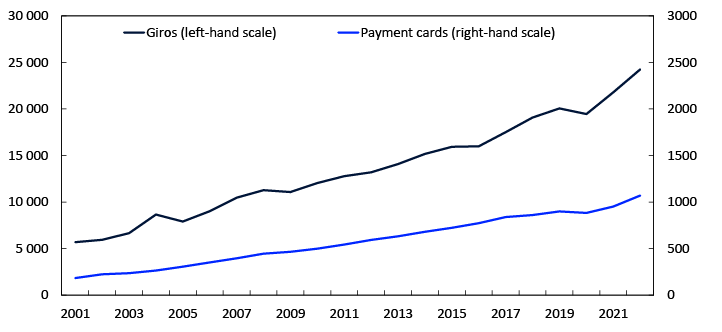
Giro payments by retail customers
Chart 3 shows credit transfers and direct debits by retail customers. Online banking (including mobile banking) had long been the most used transfer service for retail customers but there have been fewer such payments since 2017. The number of instant payments1 has increased rapidly and this is now the most used transfer service for retail customers. Most instant payments are initiated from the Vipps mobile payment app and are P2P payments. Previously, such transfers tended largely to be made via online or mobile banking platforms.
The number of instant payments rose from 198 million in 2021 to 259 million in 2022. The rise partly reflects the fact that a share of the P2P giro payments using Vipps were previously made outside the instant payment system. Such transfers are included in the figures for instant payments from 2021 Q4.2
Direct debits (Avtalegiro)3 were the third most used transfer service for retail customers. The use of this service fell somewhat from 2021, with 111 million payments made in 2022.
Chart 3 Giro payments by retail customers
The use of postal giros and telegiros has diminished and is now relatively rare. In 2022, postal giros were used for a total of 2.3 million transactions and telegiros for 2.2 million transactions.
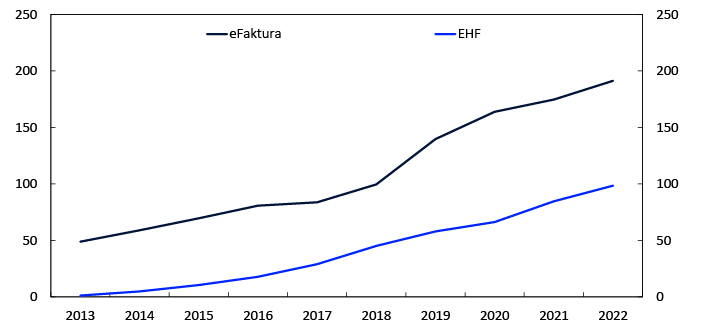
Use of electronic invoices
Bills can be sent in different ways: paper-based, as e-mail attachments or as electronic invoices. Chart 4 shows developments in the number of different electronic invoices sent.
In 2022, 191 million eFaktura invoices were sent from businesses to retail customers. The rise in the number of eFaktura invoices has been pronounced in recent years. In the period between 2021 and 2022, the rise was 10 percent. The sharp growth recent years partly reflects the opening of the Vipps platform to the distribution of eFaktura invoices in March 2019.
In 2022, 99 million EHF invoices were sent. EHF is the government’s e-invoicing format and covers both business-to-government (B2G/G2B) and business-to-business (B2B) invoicing. Growth in the use of these invoices between 2021 and 2022 was 16 percent.
Chart 4 Sending of electronic invoices
1 Instant payments are payments from the bank account of one retail customer to the account of another retail customer via a dedicated payment infrastructure. The funds are accessible by the payee a few seconds after the payer has initiated the payment.
2 Prior to 2021 Q4, these figures were categorised under “Miscellaneous other electronic credit transfers” in Annex tables 9 and 13.
3 Avtalegiro is a form of direct debit initiated by the payee whereby funds to cover recurring payments are automatically drawn from the payer. The corresponding service for the corporate market is called Autogiro.
2 Card transactions
In 2022, 2855 million payments were made with Norwegian payment cards. In addition, 26 million cash withdrawals were made.
Of total card payments, 2183 million, or 76 percent, were made at physical payment terminals (EFTPOS-terminals)4.
In 2022, 1877 million (86 percent) of payments at physical payment terminals were made with contactless5 payment cards. In 2021, contactless payments accounted for 81 percent of payments. The average value of contactless payments was NOK 338. There are also other payment methods available at physical points of sale that are contactless, but that do not involve payment terminals. As a rule, these payments are registered in the statistics as regular online payments. An example are payments made using the Coopay mobile payment app.
Contactless payments can either be made with a physical card or in some other manner, for example with a mobile phone, watch or wristband.6 Payments made with physical cards currently account for most contactless payments. Contactless payments using mobile phones, watches or wristbands accounted for 118 million payments in 2022. In the period between 2021 and 2022, the increase was 133 percent. Payments using mobile phones, watches or wristbands accounted for 6 percent of contactless payments at physical payment terminals and 4 percent of all payments at physical payment terminals in 2022. See box “Making mobile payments in shops” for more information on how such payments are made.
Making mobile payments in shops
Making mobile payments in shops has been possible in Norway since early 2014. mCash was the very first mobile payment platform, but quickly faced two other competitors, Valyou and MobilePay. None of these platforms exist in Norway today.
The different mobile payment platforms connect to the payment infrastructure in different ways. Several platforms use the card infrastructure and contactless communication at payment terminals by using NFC1 or by scanning a QR-code2. Examples of such terminal-based solutions include Apple Pay, Google Pay and Samsung Pay (which all use NFC) and “Vipps at payment terminals”3 (QR).
The other solutions can be understood as web-based. Here, communication does not go through payment terminals and internet access is needed to carry out payments. These solutions also use different technologies. Contact with the payment system can be achieved by scanning a QR-code presented by either the payer or the payee. Coop’s payment app Coopay and different Vipps-solutions are examples of payment apps that use QR-codes. Other forms of payment initiation can be used when making Vipps payments. One example is when the payee sends a payment request directly to the customer (who first provides their telephone number).
All these solutions rely on debit cards or credit cards for charging payments. There are currently no payment methods in shops where payments can be made from bank accounts directly, so-called account-to-account (A2A) POS payments. Progress is however being made in this field, with this type of solution expected to emerge eventually.
In 2022, 1440 million (76 percent) of total contactless payments were made using BankAxept. The remaining contactless payments, 437 million, were made using international cards7. Of these payments, 323 million were made with a physical card, while 113 million were made using mobile phones, watches or wristbands.
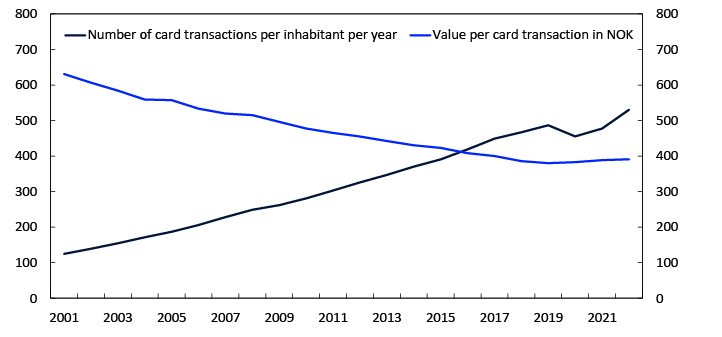
Owing to the outbreak of the pandemic in 2020, for a period it was common for purchases to be less frequent, but in 2021 and 2022 the number of card transactions per inhabitant recovered and is now higher than before the pandemic (Chart 5). The average number of card transactions per inhabitant (for payments and cash withdrawals) in 2022 was 531, compared with 478 in 2021. The average value of card transactions increased somewhat, from NOK 389 in 2021 to NOK 391 in 2022.
Chart 5 Card transactions per inhabitant per year and value per card transaction in NOK
Number of payment cards
At end-2022, the total number of Norwegian payment cards stood at 12.8 million (Overview 1)
The most widely used card type is a card combining BankAxept with an international debit card, usually Visa or Mastercard. 57 percent of cards are of this type. The next most widely used card type is international credit cards, which account for 38 percent of cards. The total number of payment cards has declined somewhat in recent years, partly reflecting the lower number of international credit cards.
Overview 1 The number of Norwegian payment cards at the end of the period (in thousands) 8
|
Card type |
2019 |
2020 |
2021 |
2022 |
|
Combined BankAxept/international debit cards |
7309 |
7199 |
7294 |
7346 |
|
International credit cards |
5297 |
5126 |
5043 |
4861 |
|
Other debit and credit cards |
658 |
181 |
86 |
112 |
|
International charge cards |
328 |
339 |
367 |
364 |
|
E-money cards |
85 |
59 |
74 |
96 |
|
In total |
13 677 |
12 905 |
12 864 |
12 780 |
Source: Norges Bank
Card transactions by issuer and function
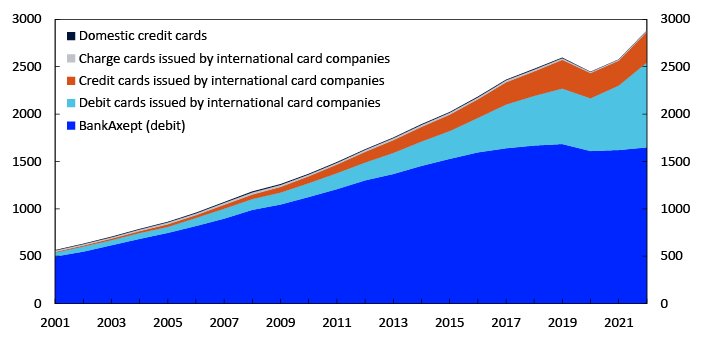
In 2022, 57 percent of all transactions with Norwegian cards were made using the national debit card system, BankAxept (Chart 6). These amounted to 1647 million transactions. There were 1232 million transactions made using different cards issued by international card companies. The number of card transactions using international cards increased by 29 percent over the past year. The share of card transactions made using international cards increased from 37 percent in 2021 to 43 percent in 2022.
BankAxept cards are primarily used for payments at physical points of sale within Norway. International cards are used for such payments, but also for online payments, for payments made using different apps and for payments abroad. BankAxept cards cannot be used for online payments or abroad, nor are they used substantially in apps.
There are several reasons for the substantial increase in the market share of international cards. One reason is the continued rapid increase in online shopping. Furthermore, travel activity picked up again sharply in 2022 and the number of monthly card transactions at physical points of sale abroad rose. A third factor is the increase in the use of apps for the purchase of goods and services at physical points of sale.
If only Norwegian physical card payments at physical points of sale in Norway are examined, the market share of BankAxept is considerably higher and more stable.
Chart 6 Use of Norwegian payment cards by issuer and function.
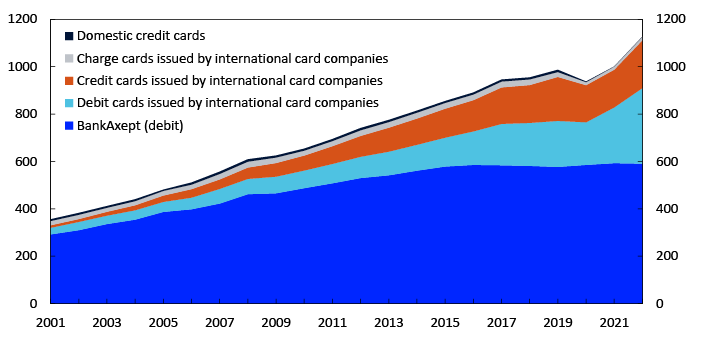
The total value of payments made using Norwegian cards in 2022 was NOK 1127 billion. The value of BankAxept transactions amounted to NOK 590 billion, a slight decline from 2021 (Chart 7). In 2022, BankAxept transactions accounted for 52 percent of the total value of card transactions, a decrease from 59 percent in 2021. The value of transactions using international cards was NOK 536 billion in 2022, an increase of 32 percent over the past year.
The average transaction value for BankAxept cards was NOK 358, NOK 356 for international debit cards, and NOK 624 for international credit cards.
Chart 7 Use of Norwegian payment cards by issuer and function
In billions of NOK. 2001–2022
Internet card payments (online shopping)
There has been a sharp increase in internet card payments over the past years (Chart 8). In 2022, there were 630 million such purchases made with Norwegian payment cards. In the period between 2021 and 2022, growth was 16 percent. Growth was higher for purchases from Norwegian online shops than from foreign online shops. Payments to Norwegian online shops accounted for 63 percent of the total payments for online shopping.
In 2022, the total value of online payments was NOK 271 billion. The value of payments rose by 22 percent between 2021 and 2022. The average value of online payments increased from NOK 407 in 2021 to NOK 430 in 2022.
Chart 8 Online payments with Norwegian payment cards
2007–2022
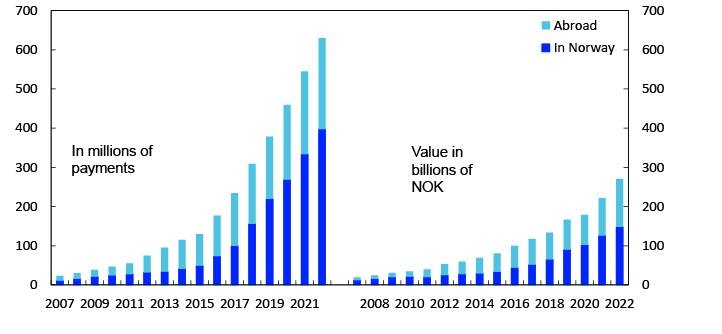
Customers abroad make fewer purchases at Norwegian online shops than Norwegians make at online shops abroad.9 Customers abroad accounted for 12.1 million such purchases, with a total value of NOK 18.3 billion. Both the number of purchases and their values rose from 2021 to 2022.
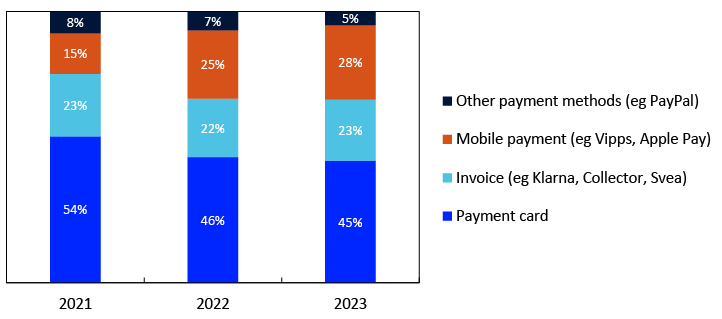
In connection with Norges Bank’s survey on the use of cash, participants were also asked about how they paid for their most recent online purchase. Chart 9 shows that somewhat less than half of purchases were made directly with a payment card. Such payments account for a declining share of payments. An increasing number of survey participants report using mobile payments for their most recent online purchase. Approximately a quarter of purchases were made on a mobile payment platform. Somewhat less than a quarter were invoiced. However, even if the primary method of payment is giro, mobile payment or some other manner, there is also often an underlying card payment. Payment cards are usually the funding source for online mobile payments, and payment cards are often used to pay online shopping invoices.
Chart 9 Payment methods for online shopping
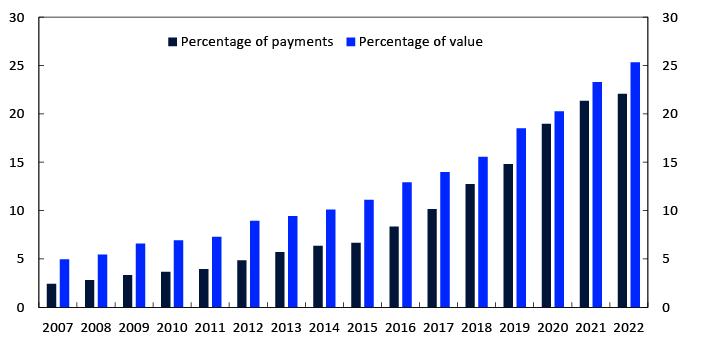
Online payments are assuming an ever-larger share of payments made with Norwegian payment cards. Chart 10 shows that in 2022, online payments accounted for 22 percent of all payments using Norwegian cards. In value terms, online payments accounted for 25 percent of the value of all card payments in 2022.
Chart 10 Online payments with Norwegian payment cards
Percentage of total card payments. 2007–2022
Card transactions abroad
Chart 11 shows the total use of Norwegian payment cards abroad, both at points of sale and via the internet. In 2022, a total of 406 million card transactions were made abroad or with foreign counterparties. This includes 7 million cash withdrawals.
The number of payments at physical points of sale abroad increased sharply in 2022. The number of such payments rose from 72 million in 2021 to 167 million in 2022, an increase of 132 percent. The number of payments at physical points of sale abroad are nevertheless lower than before the pandemic. In 2019, the number of such payments amounted to 172 million. The number of payments to websites abroad continued to increase and rose from 211 million in 2021 to 232 million in 2021. Overall, the number of card payments made abroad or with foreign counterparties rose by 41 percent from 2021 to 2022.
Chart 11 Use of Norwegian payment cards abroad
The value of card use abroad in 2022 totalled NOK 210 billion. The value of the payments was NOK 196 billion, while the value of cash withdrawals accounted for NOK 13 billion. Compared with the value of payments in 2021, the increase was 56 percent. The value of cash withdrawals also increased. The average value of payments at points of sale abroad was NOK 440.
In card transactions abroad, international cards are used. The statistics show that in most cases, international debit cards were used, around eight out of ten transactions. International credit cards were used for most of the remaining payments
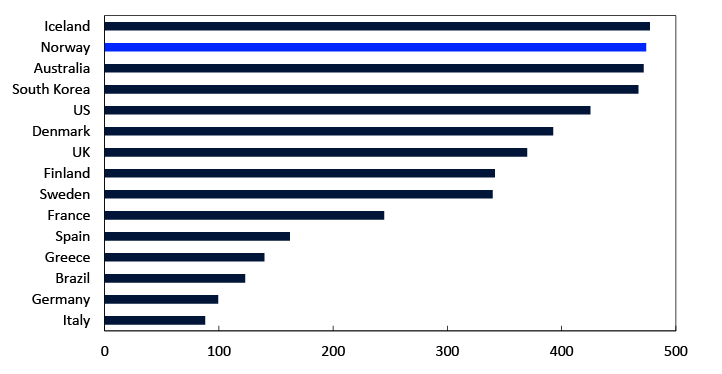
Chart 12 shows that Norway is among the countries with the highest use of cards as a means of paying for goods and services. Only Iceland has a higher annual number of card payments per inhabitant. On average, Norwegians made 474 card payments in 2021, or 1.3 times per day. Germany and several Mediterranean countries can be found at the other end of the scale. However, card use is also increasing rapidly in these countries. The number of card payments per inhabitant in Germany moved up from 90 in 2020 to 99 in 2021. In Greece, the number of card payments per inhabitant increased from 104 in 2020 to 140 in 2021.
Chart 12 Number of card payments per inhabitant per year in selected countries
4 EFTPOS (Electronic Funds Transfer at Point of Sale) is a system for card payments at terminals at physical points of sale.
5 Contactless payments are made by holding the card close to the terminal for a moment. A customer PIN is required if the amount exceeds NOK 500 or the total amount or number of transactions exceeds a threshold. The payment is considered contactless even if a PIN is used.
6 Contactless mobile payments are, for example, payments made using Apple Pay or Vipps at payment terminals. Contactless payments via watch are, for example, payments made using Fitbit Pay or Garmin Pay.
7 In the remainder of the text, the term international card is used for Norwegian payment cards issued by international card companies or under licence from them. These include Visa, Mastercard and American Express.
8 Debit card: Payment card enabling the card user to access deposits and credit from the bank account to which the card is linked. The user’s account is debited each time the card is used.
Credit card: Payment card with a line of credit that in accordance with the cardholder agreement may be repaid regardless of when the card is used.
Charge card: The user of the card receives at certain intervals an invoice for total use.
9 The figures are uncertain. Information from other sources may indicate that they are underreported by about 30 percent.
3 The cash infrastructure
A user can withdraw cash at bank branches, from ATMs and at many shops, either as POS terminal withdrawals or through in-store cash services. See box: “Cash infrastructure” for more information on various cash services.
Cash infrastructure
Cash services for individuals are primarily accessible through three channels: bank branches, cash machines and shops.
The number of bank branches where it is possible to withdraw and deposit cash over the counter has fallen over a long period. There were 56 bank branches at year-end 2022. The number was 87 at year-end 2021.
There are cash machines for both cash withdrawals and deposits, ie ATMs and cash deposit machines, respectively. Recycling machines allow for both withdrawals and deposits. At year-end 2022, there were 878 ATMs, 98 cash deposit machines and 353 recycling machines.
Banks own approximately half of all ATMs, while the cash handling companies Nokas and Loomis and some other companies own the other half. Nokas and Loomis operate their own ATMs and most of the ATMs owned by the banks and the other companies.
Cash services are also offered in shops. Cash-back is a voluntary arrangement provided by shops, where customers can withdraw cash in connection with a goods purchase. Through the in-store cash services solution, customers can withdraw and deposit cash at grocery shops. Shops that take part in the scheme are obliged to have cash available. BankAxept is the operator. The service is available at shops linked to NorgesGruppen and requires the use of BankAxept cards and pin codes. At year-end 2022, there were 1456 participating shops.
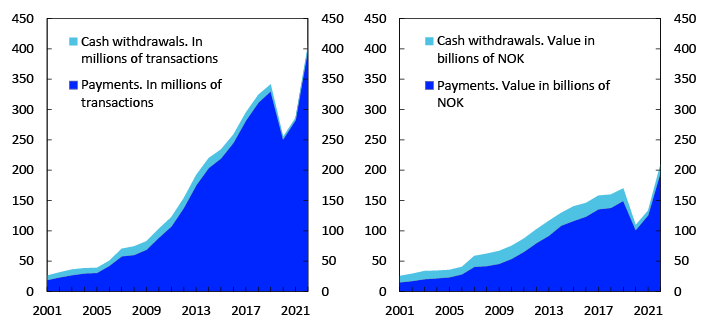
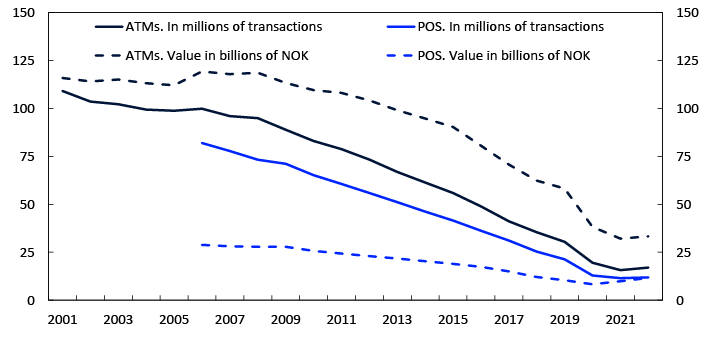
In 2022, there were 17.0 million withdrawals from ATMs10 in Norway, and 11.5 million cash withdrawals from POS terminals (cash-back and in-store cash services).11 Chart 13 shows the number of cash withdrawals from ATM and POS terminals and their values.
In the period between 2021 and 2022, the number of ATM withdrawals rose by 8 percent and the number of withdrawals from POS terminals rose by 4 percent. This is the first time in a very long time that the number of withdrawals rose. The increase may be related to the closing of Posten Norge’s cash withdrawal services in 2020. Withdrawals that were previously made through Posten Norge (and that were not included from our statistics) are now likely made at ATMs or POS terminals.
In 2022, the value of ATM withdrawals was NOK 33.3 billion, and the value of withdrawals from POS terminals was NOK 11.6 billion. From 2021 to 2022, the value of ATM withdrawals rose by 4 percent, while the value of withdrawals from POS terminals rose by 17 percent.
The average withdrawal was NOK 2832 for in-store cash services and NOK 521 for cash-back. The average withdrawal from Norwegian ATMs fell from NOK 2042 in 2021 to NOK 1961 in 2022.
Chart 13 Cash withdrawals from ATMs and POS terminals
2001–2022
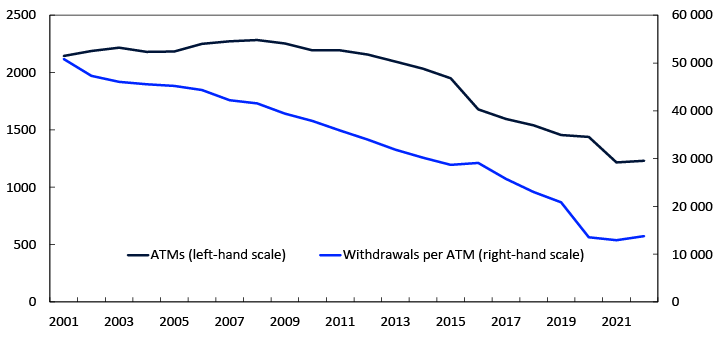
The number of ATMs increased from 1217 at year-end 2021 to 1231 at year-end 2022 (Chart 14). The increase reflects the lack of data from some ATM owners in previous statistics. Excluding the new figures, the number of ATMs at year-end 2022 would have been 1162. Thus, there were 55 fewer ATMs in 2022. The statistics for 2022 comprise all ATMs in Norway.
In 2022, each ATM in Norway was used for an average of 13 779 cash withdrawals (Chart 14), or an average of 38 withdrawals per day.
The average amount withdrawn from each ATM was NOK 27.0 million, or an average of approximately NOK 74 000 per day.
Chart 14 Number of ATMs and withdrawals per ATM per year
4 Cash in circulation
The amount of cash in circulation does not necessarily provide any indication of the volume of cash payments. Cash is both a means of payment and a store of value. Banknotes or coins may often be used solely as a store of value. On the other hand, a banknote or coin could very well be used in multiple payments over the course of a year.
The value of cash in general circulation has declined in recent years (Chart 15). In addition, the amount of cash in circulation shows seasonal variation, with increased demand from the public in connection with summer holidays and Christmas and Easter. In connection with the Covid-19 outbreak in spring 2020, the demand for cash temporarily increased. At year-end 2022, cash in circulation amounted to NOK 37.6 billion.12
Chart 15 Cash in circulation among the public. In billions of NOK
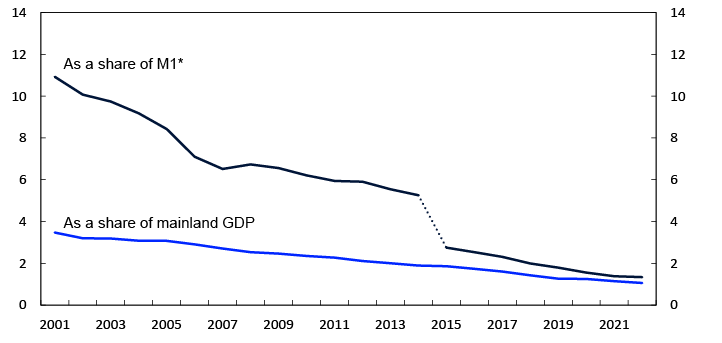
Cash as a share of the monetary aggregate M113 fell from 1.4 percent at end-2021 to 1.3 percent at end-2022 (chart 16). Cash as a share of GDP for mainland Norway amounted to 1.1 percent in 2022.
Chart 16 Cash in circulation as a share of means of payments (M1) and mainland GDP
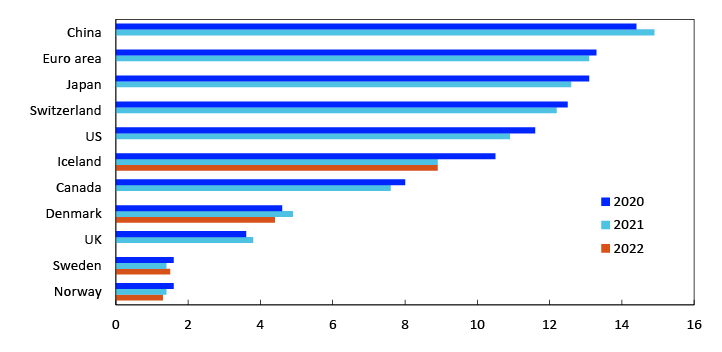
The figures for Norway are low in an international comparison (Chart 17). In Sweden, the share of cash payments is also very low.
Chart 17 Cash in circulation as a share of means of payments in selected countries
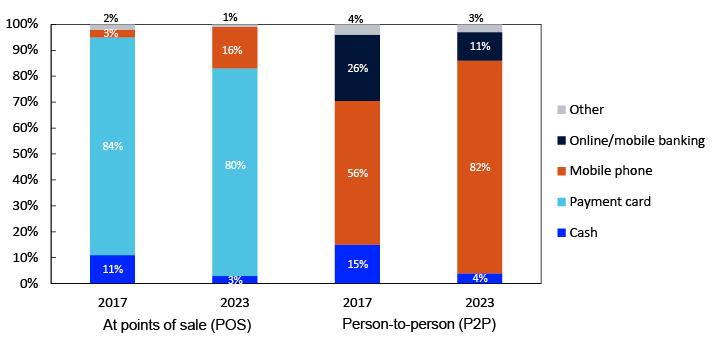
Use of cash in Norway
Norges Bank conducts household surveys on cash usage.1 The surveys examine payment situations in which cash can actually be used. These are mainly person-to-person (P2P) payments and payments for the purchase of goods and services at a point of sale (POS)2. Survey participants are asked to provide information about their most recent payment. They are asked to specify if the payment was at a POS or P2P and the payment method used.
Main results from the surveys
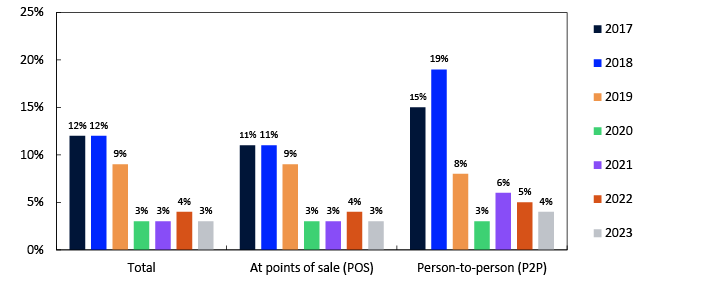
In the survey in 2023, cash accounted for 3 percent of both total payments and POS payments but accounted for 4 percent of P2P payments (Chart 18). The cash share declined in connection with the Covid-19 pandemic and has since remained low. In 2019, the cash share was 8–9 percent.
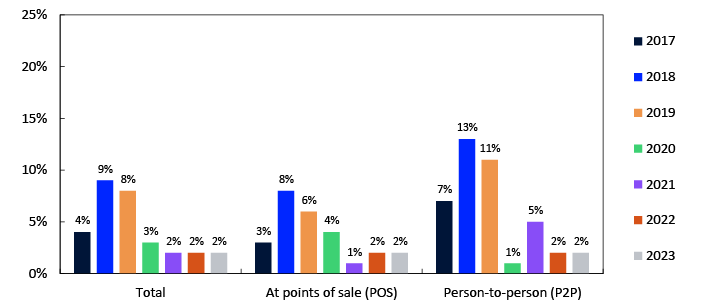
In 2023, the value of cash payments accounted for 2 percent of the total value of payments (Chart 19). The value of cash payments accounted for 2 percent of the value of both POS and P2P payments. The value of cash payments has also fallen since the Covid-19 outbreak.
At points of sale, one can choose to pay
- cash
- with a payment card
- using a mobile phone (eg Coopay, Vipps, Apple Pay and Google Pay)
- in some other manner (eg invoice)
Payment cards are the most used payment method by far at point of sale, with 80 percent of payments in 2023 (Chart 20). Mobile phone payments have risen from 3 percent of total payments in 2017 to 16 percent in 2023.-1
For P2P payments, one can choose to pay
- cash
- using a mobile phone (mainly Vipps)
- using online/mobile banking
- in some other manner
Mobile phone payments have increased from 56 percent of P2P payments in 2017 to 82 percent of payments in 2023. Transfers on online and mobile banking platforms were the next most used payment method, accounting for 11 percent of P2P payments in 2023. In 2017, such transfers accounted for 26 percent of the P2P payments.
Chart 20 Payment methods in different payment situations
1 Data were collected by an external market analysis firm. In each survey, 2000 individuals were queried using both phone- and web-based interviews. The minimum age limit for the phone-based interviews was 15 years and 18 years for the web-based interviews. The survey sample is representative of the wider population, which means that its composition is virtually identical to that of the population in terms of key variables such as sex, age and residence. Representativity allows survey results to be generalised to the whole population. At the same time, limiting the sample size would make the results somewhat uncertain, particularly for subgroups.
2 Points of sale include retail outlets, restaurants, vending machines, hairdressing salons and public transport etc.
-1 In the survey, both payments using physical payment terminals and online payments at points of sale are included. The share of mobile phone payments is therefore larger in the survey than in the payment statistics. The payment statistics only include payments made at physical payment terminals.
12 In addition to the cash held by the public, banks also hold cash. At end-2022, banks’ stock of cash was NOK 2.5 billion. This includes cash stored in banks’ ATMs, branches and depots
13 M1 is the narrow monetary aggregate. This is money that is held by the public and can be used immediately. M1 comprises current accounts and cash. The definition of M1 was changed in 2015, leading to a break in the statistics.
5 Prices for payment services
Overview 2 provides information on prices for different banking and card services. The overview shows average prices and may conceal substantial differences between banks. For many of the services, only a few banks charge fees, while the majority offer no-fee services. This pertains eg to annual fees for online banking, payments at points of sale and ATM cash withdrawals. Prices are lower for customers belonging to a bank’s loyalty programme than those not belonging to such a programme.
Prices for paying bills vary widely among forms of payment. Prices for paper-based and manual payment services are clearly highest and continue to rise. Prices for credit transfers made via cash payment over the counter are now NOK 115, while payments via an online banking service with CID or via avtalegiro cost NOK 0.30 for loyalty scheme customers and NOK 0.80 for other customers.
At the beginning of 2023, the average annual fee for BankAxept cards combined with an international card (Visa or Mastercard) was NOK 228 for loyalty scheme customers and NOK 296 for non-loyalty scheme customers. The average price to make a purchase using BankAxept was NOK 0.80 for non-loyalty scheme customers and free for loyalty scheme customers.
A withdrawal using a debit card during opening hours from a bank’s own ATM now costs NOK 6 for loyalty scheme customers and close to NOK 8 for other customers. Withdrawals using an international credit card from a bank’s own ATM cost NOK 34.40 for loyalty scheme cardholders and NOK 36.40 for non-loyalty scheme cardholders. In addition, a 1.2 percent fee is charged of the amount drawn.
Overview 2 Prices for domestic payment services, retail customers. Weighted average (NOK). 1 January each year
|
Customers who do not belong to loyalty schemes |
Customers who belong to loyalty schemes |
|||||
|
2021 |
2022 |
2023 |
2021 |
2022 |
2023 |
|
|
Payments |
||||||
|
Online banking (with CID), per payment |
0.70 |
0.80 |
0.80 |
0.10 |
0.10 |
0.30 |
|
Online banking – annual fee |
13.20 |
13.30 |
13.10 |
0.60 |
1.10 |
1.10 |
|
Direct debit (Avtalegiro), per payment |
0.80 |
0.80 |
0.80 |
0.20 |
0.30 |
0.30 |
|
Mobile banking (with CID), per payment |
0.90 |
0.80 |
0.80 |
0.10 |
0.10 |
0.30 |
|
Mobile banking – info by SMS |
2.10 |
2.10 |
2.00 |
1.80 |
1.90 |
1.80 |
|
Credit transfer via postal giro, per payment |
12.30 |
13.00 |
13.00 |
12.30 |
12.80 |
13.10 |
|
Giro over the counter – account debit, per payment |
95.40 |
97.10 |
102.50 |
95.40 |
97.10 |
102.50 |
|
Giro over the counter – cash payment, per payment |
108.40 |
108.50 |
115.20 |
108.40 |
108.50 |
115.20 |
|
BankAxept cards at payment terminals (EFTPOS), per payment |
0.80 |
0.80 |
0.80 |
0.10 |
0.00 |
0.00 |
|
Credit card from international credit card company, annual fee |
21.30 |
26.80 |
28.20 |
23.60 |
12.50 |
31.90 |
|
BankAxept cards (combined with debet card from int. card comp.), annual fee |
298.00 |
299.60 |
295.70 |
220.50 |
227.90 |
227.90 |
|
ATM withdrawals, debit cards |
||||||
|
Own bank’s ATMs during opening hours, per withdrawal |
7.20 |
7.80 |
7.90 |
6.70 |
6.50 |
6.00 |
|
Other bank’s ATMs during opening hours, per withdrawal |
8.50 |
8.60 |
8.70 |
7.20 |
7.00 |
7.30 |
|
ATM withdrawals, international credit cards |
||||||
|
Own bank’s ATMs during opening hours, per withdrawal |
31.10 |
31.40 |
34.40 |
32.60 |
33.80 |
36.40 |
|
Other bank’s ATMs during opening hours, per withdrawal |
31.10 |
31.40 |
34.40 |
32.60 |
33.80 |
36.10 |
|
Fee as a percentage of withdrawal amount |
1.1 |
1.1 |
1.2 |
0.8 |
1.1 |
1.2 |
Sources: Finansportalen and Norges Bank
Overview 3 shows a comparison of prices for remittances to other countries. Finansportalen has price data for remittance transactions to 34 countries and regions.14 Banks, non-bank financial institutions and payment institutions provide remittance services to these countries. Prices for remittances are determined by various factors. As a percentage of the transfer amount, the price falls as the amount rises. Also, a remittance transaction in person is much more expensive than an online payment order. This pertains especially to banks, but also when the payment passes through a non-bank financial institution or payment institution. The fee comprises the exchange rate cost and other fees, where other fees comprise both a fixed portion and a portion that depends on the amount transferred. Transfer prices have shown little change over the past year.
Overview 3 Prices for remittances to selected countries. Banks and other providers. In percent of amount transferred. At 1 January 2022 and 2023
|
Transaction in person |
Online payment order |
|||||||
|
NOK 1 000 |
NOK 5 000 |
NOK 1 000 |
NOK 5 000 |
|||||
|
2022 |
2023 |
2022 |
2023 |
2022 |
2023 |
2022 |
2023 |
|
|
Banks |
27.9 |
29.6 |
6.4 |
6.6 |
6.0 |
6.1 |
1.9 |
2.0 |
|
Exchange rate cost |
1.0 |
0.9 |
1.0 |
0.9 |
0.9 |
0.9 |
0.9 |
0.9 |
|
Other fees |
26.9 |
28.8 |
5.4 |
5.8 |
5.1 |
5.2 |
1.0 |
1.0 |
|
Non-bank financial institutions and payment institutions |
- |
14.8 |
- |
12.5 |
5.4 |
5.3 |
3.9 |
3.9 |
|
Exchange rate cost |
- |
7.3 |
- |
7.3 |
3.3 |
3.3 |
3.3 |
3.3 |
|
Other fees |
- |
7.5 |
- |
5.2 |
2.2 |
2.0 |
0.6 |
0.6 |
|
All providers |
27.9 |
26.7 |
6.4 |
7.8 |
5.7 |
5.6 |
2.9 |
3.0 |
|
Exchange rate cost |
1.0 |
2.2 |
1.0 |
2.2 |
2.1 |
2.2 |
2.1 |
2.2 |
|
Other fees |
26.9 |
24.5 |
5.4 |
5.6 |
3.6 |
3.4 |
0.8 |
0.8 |
Sources: Finansportalen and Norges Bank
14 Afghanistan, Bosnia-Herzegovina, Brazil, Bulgaria, Chile, China, Colombia, Eritrea, Ethiopia, EU/EEA, Philippines, Gambia, Ghana, Hungary, India, Iraq, Kosovo, Latvia, Lithuania, Morocco, North Macedonia, Nigeria, Pakistan, Palestine, Poland, Romania, Russia, Serbia, Somalia, Sri Lanka, Thailand, Turkey, Ukraine and Vietnam
6 Banks’ income from payment services
In 2022, banks’ income from payment services came to NOK 9.4 billion (Chart 21). Income from card business increased between 2021 and 2022 and now accounts for more than half of the total income from payment services.
Chart 21 Banks’ income from payment services and net interest and commission
Tables
General data
Table 1 General statistical data for Norway
|
2012 |
2013 |
2014 |
2015 |
2016 |
2017 |
2018 |
2019 |
2020 |
2021 |
2022 |
|
|
Population (as at 1 Jan., in millions) |
4.99 |
5.05 |
5.11 |
5.17 |
5.21 |
5.26 |
5.30 |
5.33 |
5.37 |
5.39 |
5.43 |
|
Mainland GDP, market value (in billions of NOK) |
2 294 |
2 419 |
2 534 |
2 614 |
2 692 |
2 798 |
2 931 |
3 067 |
3 067 |
3 288 |
3 569 |
|
EUR 1 in NOK (annual average) |
7.47 |
7.81 |
8.35 |
8.95 |
9.29 |
9.33 |
9.60 |
9.85 |
10.72 |
10.16 |
10.10 |
Means of payment in Norway
Table 2 Means of payment used by the public (at year-end, in millions of NOK)
|
2012 |
2013 |
2014 |
2015 |
2016 |
2017 |
2018 |
2019 |
2020 |
2021 |
2022 |
|
|
Narrow money supply (M1) |
820 075 |
874 546 |
910 322 |
1 766 857 |
1 842 654 |
1 944 698 |
2 096 769 |
2 159 770 |
2 464 540 |
2 723 600 |
2 811 368 |
|
Banknotes and coins |
48 403 |
48 454 |
47 880 |
48 508 |
46 665 |
44 906 |
41 739 |
38 648 |
38 292 |
37 547 |
37 580 |
|
Deposits in current accounts |
771 672 |
826 092 |
862 442 |
1 718 349 |
1 795 989 |
1 899 792 |
2 055 030 |
2 121 122 |
2 426 248 |
2 686 053 |
2 773 788 |
Table 3 Banknotes and coins in circulation. Annual average (in millions of NOK)
|
2012 |
2013 |
2014 |
2015 |
2016 |
2017 |
2018 |
2019 |
2020 |
2021 |
2022 |
|
|
Total |
51 179 |
49 762 |
49 352 |
50 068 |
49 241 |
46 963 |
43 828 |
40 986 |
40 562 |
39 336 |
39 363 |
|
Total banknotes |
46 379 |
45 509 |
44 995 |
45 605 |
44 726 |
42 427 |
39 354 |
36 577 |
36 227 |
35 018 |
35 085 |
|
1000-krone |
21 180 |
19 798 |
18 712 |
17 947 |
17 029 |
15 627 |
14 013 |
12 238 |
9 552 |
7 194 |
7 269 |
|
500-krone |
15 633 |
16 306 |
17 101 |
18 355 |
18 445 |
17 689 |
16 567 |
15 129 |
17 383 |
18 871 |
18 960 |
|
200-krone |
6 335 |
6 251 |
6 033 |
6 056 |
5 963 |
5 830 |
5 612 |
6 010 |
6 154 |
5 870 |
5 707 |
|
100-krone |
2 149 |
2 118 |
2 096 |
2 154 |
2 172 |
2 161 |
2 067 |
2 145 |
2 113 |
2 062 |
2 108 |
|
50-krone |
1 080 |
1 036 |
1 054 |
1 093 |
1 116 |
1 119 |
1 095 |
1 056 |
1 024 |
1 022 |
1 041 |
|
Total coins |
4 801 |
4 254 |
4 357 |
4 463 |
4 515 |
4 536 |
4 474 |
4 409 |
4 336 |
4 318 |
4 278 |
|
20-krone |
1 638 |
1 679 |
1 715 |
1 760 |
1 775 |
1 775 |
1 746 |
1 717 |
1 688 |
1 684 |
1 664 |
|
10-krone |
1 317 |
1 150 |
1 174 |
1 194 |
1 201 |
1 205 |
1 180 |
1 157 |
1 130 |
1 122 |
1 109 |
|
5-krone |
662 |
502 |
515 |
529 |
539 |
542 |
534 |
525 |
515 |
513 |
510 |
|
1-krone |
943 |
767 |
799 |
826 |
847 |
861 |
862 |
858 |
850 |
848 |
845 |
|
0.5 krone |
241 |
156 |
155 |
154 |
154 |
153 |
153 |
152 |
152 |
152 |
152 |
Payment infrastructure
Table 4 Institutional infrastructure
|
2012 |
2013 |
2014 |
2015 |
2016 |
2017 |
2018 |
2019 |
2020 |
2021 |
2022 |
|
|
Number of banks |
138 |
137 |
137 |
134 |
137 |
136 |
141 |
136 |
134 |
134 |
128 |
|
Savings banks |
109 |
107 |
106 |
104 |
104 |
99 |
98 |
95 |
93 |
91 |
87 |
|
Commercial banks |
17 |
18 |
19 |
20 |
23 |
25 |
29 |
27 |
25 |
25 |
23 |
|
Number of foreign bank branches in Norway |
12 |
12 |
12 |
10 |
10 |
12 |
14 |
14 |
16 |
18 |
18 |
|
Electronic money institutions |
2 |
2 |
3 |
4 |
6 |
6 |
6 |
7 |
6 |
6 |
6 |
Table 5 Number of agreements
|
2012 |
2013 |
2014 |
2015 |
2016 |
2017 |
2018 |
2019 |
2020 |
2021 |
2022 |
|
|
Online and mobile banking agreements |
6 020 427 |
6 317 283 |
7 259 134 |
7 889 444 |
8 427 064 |
8 780 020 |
8 677 815 |
8 619 107 |
8 720 172 |
9 769 703 |
10 253 606 |
|
Retail customers |
5 595 545 |
5 858 058 |
6 768 015 |
7 271 093 |
7 786 587 |
8 111 439 |
7 901 252 |
7 617 363 |
7 383 359 |
8 130 369 |
8 382 347 |
|
Corporate customers |
424 882 |
459 225 |
491 119 |
618 351 |
640 477 |
668 581 |
776 563 |
1 001 744 |
1 336 813 |
1 639 334 |
1 871 259 |
|
Agreements to offer electronic invoicing (eFaktura) to retail customers |
1 071 |
1 220 |
1 378 |
1 490 |
1 611 |
1 577 |
8 108 |
13 462 |
24 161 |
28 505 |
33 903 |
|
Agreements on receipt of electronic invoicing (eFaktura) – retail customers |
9 713 391 |
12 093 853 |
15 304 127 |
14 547 500 |
17 447 887 |
19 581 987 |
23 489 647 |
34 467 240 |
37 440 453 |
38 875 210 |
39 088 984 |
|
Agreements on receipt of electronic invoicing – EHF-format |
2 005 |
7 760 |
31 064 |
48 927 |
65 218 |
96 158 |
129 525 |
154 589 |
181 734 |
218 136 |
255 080 |
|
Company terminal giro agreements |
15 129 |
15 963 |
16 534 |
18 362 |
22 193 |
27 822 |
33 530 |
33 962 |
25 631 |
14 669 |
12 886 |
|
Postal giro agreements |
681 023 |
626 342 |
596 126 |
508 134 |
461 177 |
343 855 |
302 542 |
276 856 |
256 381 |
228 821 |
202 595 |
|
Direct debit agreements (Avtalegiro and Autogiro) |
14 393 988 |
15 597 964 |
17 218 355 |
18 496 228 |
19 964 802 |
19 514 813 |
19 988 423 |
20 511 972 |
20 770 830 |
21 258 883 |
24 770 703 |
|
Avtalegiro – payees |
13 572 |
16 417 |
15 520 |
15 940 |
16 215 |
17 627 |
18 408 |
19 723 |
20 474 |
21 313 |
22 049 |
|
Autogiro – payees |
690 |
654 |
618 |
587 |
627 |
705 |
705 |
691 |
670 |
666 |
627 |
Table 6 Number of cards (in thousands) and number of functions in cards (in thousands)
|
2012 |
2013 |
2014 |
2015 |
2016 |
2017 |
2018 |
2019 |
2020 |
2021 |
2022 |
|
|
Number of cards (as at 31 Dec.) |
12 583 |
12 626 |
13 698 |
14 704 |
14 841 |
15 755 |
13 274 |
13 677 |
12 905 |
12 864 |
12 780 |
|
Contactless cards (NFC) |
- |
- |
- |
- |
- |
774 |
8 617 |
10 094 |
11 140 |
12 465 |
12 485 |
|
Chip cards |
12 029 |
11 862 |
12 764 |
13 859 |
14 390 |
14 803 |
4 570 |
3 561 |
1 697 |
375 |
245 |
|
Magnetic stripe cards |
553 |
761 |
928 |
839 |
445 |
166 |
73 |
2 |
2 |
1 |
2 |
|
Virtual cards |
- |
3 |
6 |
6 |
6 |
13 |
14 |
20 |
23 |
23 |
48 |
|
Number of functions in cards |
19 795 |
20 289 |
21 988 |
23 464 |
23 791 |
25 381 |
20 988 |
21 487 |
20 189 |
20 167 |
20 128 |
|
Debit functions |
13 620 |
14 449 |
15 650 |
16 552 |
16 777 |
18 065 |
14 161 |
14 730 |
14 495 |
14 665 |
14 803 |
|
Bank cards/BankAxept |
6 945 |
7 332 |
7 931 |
8 377 |
8 487 |
9 124 |
7 229 |
7 419 |
7 294 |
7 370 |
7 429 |
|
Payment cards issued by international card companies |
6 675 |
7 117 |
7 719 |
8 175 |
8 290 |
8 941 |
6 932 |
7 311 |
7 201 |
7 295 |
7 374 |
|
Billing functions (payment cards issued by international card companies) |
572 |
569 |
557 |
450 |
431 |
357 |
394 |
328 |
340 |
367 |
364 |
|
Credit functions |
5 603 |
5 054 |
5 504 |
6 185 |
6 456 |
6 864 |
6 326 |
6 344 |
5 296 |
5 061 |
4 865 |
|
Domestic credit cards |
630 |
600 |
635 |
609 |
698 |
732 |
851 |
529 |
74 |
9 |
2 |
|
Payment cards issued by international card companies |
4 973 |
4 454 |
4 869 |
5 577 |
5 759 |
6 132 |
5 455 |
5 797 |
5 211 |
5 052 |
4 863 |
|
E-money |
- |
218 |
277 |
278 |
127 |
94 |
107 |
85 |
59 |
74 |
96 |
Table 7 Cash infrastructure
|
2012 |
2013 |
2014 |
2015 |
2016 |
2017 |
2018 |
2019 |
2020 |
2021 |
2022 |
|
|
Bank branches with over-the-counter cash services |
- |
- |
- |
- |
- |
- |
- |
- |
137 |
87 |
56 |
|
Points of sale with in-store cash services |
- |
- |
- |
- |
- |
- |
- |
- |
1 422 |
1 462 |
1 456 |
|
ATMs |
2 157 |
2 096 |
2 033 |
1 950 |
1 679 |
1 596 |
1 540 |
1 456 |
1 439 |
1 217 |
1 231 |
|
Cash deposit machines |
- |
- |
- |
- |
- |
- |
- |
- |
573 |
473 |
451 |
Retail payment services
Table 8 Use of payment instruments (in millions of payments)
|
2012 |
2013 |
2014 |
2015 |
2016 |
2017 |
2018 |
2019 |
2020 |
2021 |
2022 |
|
|
Total |
2 137.7 |
2 279.5 |
2 443.2 |
2 602.0 |
2 791.6 |
3 037.3 |
3 226.0 |
3 446.1 |
3 308.5 |
3 455.9 |
3 786.1 |
|
Giros |
597.2 |
608.6 |
625.8 |
650.3 |
670.4 |
728.1 |
797.0 |
891.7 |
885.4 |
901.1 |
930.8 |
|
Electronic |
575.1 |
589.0 |
608.8 |
635.3 |
658.0 |
718.5 |
789.3 |
885.2 |
880.6 |
897.3 |
927.7 |
|
Paper-based |
22.1 |
19.6 |
17.0 |
15.0 |
12.4 |
9.6 |
7.7 |
6.5 |
4.7 |
3.8 |
3.1 |
|
Payment cards (payments) |
1 540.4 |
1 670.8 |
1 817.3 |
1 951.6 |
2 121.2 |
2 309.1 |
2 429.0 |
2 554.4 |
2 423.2 |
2 554.8 |
2 855.3 |
|
Electronic |
1 538.3 |
1 668.8 |
1 815.3 |
1 949.2 |
2 120.6 |
2 308.6 |
2 428.5 |
2 553.8 |
2 422.9 |
2 554.6 |
2 854.9 |
|
Manual |
2.1 |
2.0 |
2.1 |
2.5 |
0.6 |
0.5 |
0.6 |
0.6 |
0.2 |
0.2 |
0.4 |
|
Cheques |
0.1 |
0.1 |
0.1 |
0.1 |
0.1 |
0.0 |
0.0 |
0.0 |
0.0 |
0.0 |
0.0 |
Table 9 Giros (in millions of payments)
|
2012 |
2013 |
2014 |
2015 |
2016 |
2017 |
2018 |
2019 |
2020 |
2021 |
2022 |
|
|
Total |
597.2 |
608.6 |
625.8 |
650.3 |
683.2 |
728.1 |
797.0 |
891.7 |
885.4 |
901.1 |
930.8 |
|
Credit transfers |
514.7 |
520.9 |
530.8 |
548.1 |
574.1 |
613.7 |
678.1 |
772.9 |
767.6 |
779.1 |
815.4 |
|
Electronic |
495.4 |
503.7 |
516.0 |
535.4 |
550.6 |
605.2 |
671.2 |
767.1 |
763.1 |
775.3 |
812.3 |
|
Company terminal giro |
14.5 |
14.5 |
15.7 |
15.1 |
16.7 |
18.8 |
21.2 |
23.8 |
22.7 |
16.8 |
12.0 |
|
Telegiros |
8.6 |
7.6 |
6.6 |
5.7 |
5.0 |
4.4 |
3.6 |
3.0 |
1.7 |
2.5 |
2.2 |
|
Online and mobile banking |
430.4 |
437.7 |
448.1 |
467.1 |
481.8 |
502.6 |
525.3 |
537.8 |
502.8 |
493.2 |
508.1 |
|
Retail customers |
246.3 |
257.7 |
262.4 |
274.9 |
283.4 |
291.5 |
286.3 |
267.9 |
238.4 |
253.8 |
252.1 |
|
Corporate customers |
184.1 |
180.0 |
185.7 |
192.3 |
198.4 |
211.1 |
238.9 |
269.9 |
264.4 |
239.4 |
256.1 |
|
Instant payments |
- |
- |
- |
- |
- |
0.9 |
58.1 |
122.7 |
154.0 |
198.1 |
259.3 |
|
Miscellaneous other electronic credit transfers |
41.9 |
43.9 |
45.7 |
47.4 |
59.9 |
78.4 |
63.1 |
79.7 |
81.9 |
64.8 |
30.6 |
|
Paper-based |
19.3 |
17.2 |
14.8 |
12.7 |
10.7 |
8.5 |
6.9 |
5.8 |
4.4 |
3.8 |
3.1 |
|
Company terminal giros and online banking as money order |
0.6 |
0.5 |
0.5 |
0.4 |
0.4 |
0.3 |
0.3 |
0.2 |
0.1 |
0.0 |
0.0 |
|
Postal giros |
15.7 |
14.0 |
12.2 |
10.5 |
8.9 |
7.1 |
5.8 |
4.8 |
3.7 |
3.0 |
2.3 |
|
Giros delivered at the counter – account debits |
3.0 |
2.6 |
2.1 |
1.7 |
1.4 |
1.1 |
0.9 |
0.8 |
0.6 |
0.7 |
0.8 |
|
Direct debits |
79.7 |
85.2 |
92.8 |
99.9 |
107.4 |
113.3 |
118.0 |
118.1 |
117.5 |
121.9 |
115.4 |
|
Giros delivered at the counter – cash payments |
2.8 |
2.4 |
2.2 |
2.3 |
1.7 |
1.1 |
0.8 |
0.7 |
0.3 |
0.0 |
0.0 |
Table 10a Use of payment cards (in millions of transactions)
|
2012 |
2013 |
2014 |
2015 |
2016 |
2017 |
2018 |
2019 |
2020 |
2021 |
2022 |
|
|
Total use of Norwegian cards (in Norway and abroad) |
1 627.3 |
1 752.3 |
1 892.8 |
2 020.7 |
2 182.1 |
2 362.2 |
2 475.8 |
2 594.9 |
2 446.1 |
2 575.4 |
2 880.7 |
|
Payments |
1 540.4 |
1 670.8 |
1 817.3 |
1 951.6 |
2 121.2 |
2 309.1 |
2 429.0 |
2 554.4 |
2 423.2 |
2 554.8 |
2 855.3 |
|
Payments at EFTPOS terminals |
1 463.4 |
1 572.8 |
1 698.8 |
1 818.1 |
1 942.1 |
2 016.5 |
2 074.9 |
2 146.8 |
1 940.7 |
1 980.7 |
2 183.2 |
|
Of which: contactless payments |
- |
- |
- |
- |
- |
22.9 |
102.8 |
344.0 |
1 250.4 |
1 597.7 |
1 876.8 |
|
- with physical cards |
- |
- |
- |
- |
- |
- |
- |
- |
1 235.9 |
1 546.8 |
1758.6 |
|
- other contactless payments |
- |
- |
- |
- |
- |
- |
- |
- |
14.5 |
50.8 |
118.2 |
|
Payments without cash-back |
1 407.5 |
1 521.7 |
1 652.6 |
1 776.6 |
1 905.9 |
1 985.4 |
2 049.5 |
2 125.4 |
1 928.1 |
1 970.9 |
2 173.7 |
|
Payments with cash-back |
55.9 |
51.1 |
46.2 |
41.5 |
36.2 |
31.1 |
25.4 |
21.3 |
12.6 |
9.8 |
9.6 |
|
Internet payments |
74.6 |
95.4 |
115.3 |
130.0 |
177.2 |
234.4 |
305.4 |
378.2 |
459.3 |
545.1 |
629.9 |
|
Other electronic payments |
0.3 |
0.6 |
1.2 |
1.1 |
1.3 |
57.7 |
48.1 |
28.7 |
22.9 |
28.8 |
41.7 |
|
Manual payments |
2.1 |
2.0 |
2.1 |
2.5 |
0.6 |
0.5 |
0.6 |
0.6 |
0.3 |
0.2 |
0.4 |
|
Cash withdrawals |
86.9 |
81.5 |
75.5 |
69.1 |
60.9 |
53.1 |
46.8 |
40.6 |
23.0 |
20.6 |
25.5 |
|
Use of Norwegian cards by function |
1 627.3 |
1 752.3 |
1 892.8 |
2 020.7 |
2 182.1 |
2 362.1 |
2 475.9 |
2 594.9 |
2 446.2 |
2 575.4 |
2 880.7 |
|
Debit functions |
1 487.7 |
1 589.2 |
1 709.9 |
1 820.1 |
1 959.4 |
2 099.6 |
2 190.8 |
2 268.8 |
2 166.0 |
2 300.0 |
2 544.7 |
|
BankAxept |
1 299.1 |
1 366.8 |
1 452.7 |
1 526.4 |
1 594.8 |
1 638.5 |
1 667.5 |
1 682.7 |
1 609.8 |
1 620.0 |
1 647.4 |
|
Payment cards issued by international card companies |
188.6 |
222.3 |
257.2 |
293.8 |
364.6 |
461.1 |
523.3 |
586.1 |
556.2 |
680.0 |
897.2 |
|
Billing functions (payment cards issued by international card companies) |
20.8 |
21.0 |
21.6 |
20.2 |
20.3 |
20.9 |
20.4 |
17.1 |
11.5 |
11.8 |
10.9 |
|
Credit functions |
118.5 |
141.2 |
160.0 |
179.2 |
201.8 |
241.2 |
264.3 |
308.7 |
268.4 |
263.3 |
323.8 |
|
Domestic credit cards |
6.3 |
5.9 |
5.9 |
5.6 |
5.7 |
5.5 |
5.5 |
4.9 |
2.0 |
0.2 |
0.0 |
|
Payment cards issued by international card companies |
112.3 |
135.2 |
154.1 |
173.6 |
196.1 |
235.7 |
258.8 |
303.9 |
266.4 |
263.1 |
323.8 |
|
E-money |
0.2 |
1.1 |
1.3 |
1.1 |
0.6 |
0.4 |
0.4 |
0.3 |
0.3 |
0.3 |
1.3 |
|
Use of Norwegian cards in Norway |
1 473.3 |
1 560.3 |
1 673.1 |
1 786.6 |
1 923.4 |
2 067.3 |
2 151.8 |
2 253.4 |
2 191.3 |
2 289.0 |
2 475.1 |
|
Payments without cash-back |
1 346.5 |
1 444.4 |
1 567.5 |
1 690.7 |
1 839.7 |
1 996.3 |
2 092.2 |
2 202.8 |
2 159.5 |
2 262.2 |
2 447.0 |
|
Payments with cash-back |
55.9 |
51.1 |
46.2 |
41.4 |
36.2 |
31.0 |
25.4 |
21.3 |
12.6 |
9.8 |
9.6 |
|
Cash withdrawals |
71.0 |
64.9 |
59.5 |
54.5 |
47.6 |
40.0 |
34.2 |
29.3 |
19.2 |
17.0 |
18.6 |
|
Use of Norwegian cards abroad |
153.9 |
192.0 |
219.7 |
234.2 |
258.8 |
294.9 |
324.1 |
341.5 |
254.9 |
286.4 |
405.7 |
|
Payments |
138.0 |
175.4 |
203.7 |
219.5 |
245.3 |
281.8 |
311.4 |
330.2 |
251.1 |
282.8 |
398.7 |
|
Cash withdrawals |
15.9 |
16.6 |
16.0 |
14.6 |
13.4 |
13.1 |
12.6 |
11.3 |
3.8 |
3.6 |
6.9 |
|
Use of foreign cards in Norway |
27.2 |
31.6 |
36.6 |
40.2 |
48.3 |
54.7 |
67.2 |
89.2 |
50.5 |
51.5 |
122.0 |
|
Payments |
24.9 |
29.6 |
34.7 |
38.5 |
46.7 |
53.2 |
65.8 |
88.0 |
49.9 |
51.1 |
121.3 |
|
Cash withdrawals |
2.3 |
2.0 |
1.9 |
1.6 |
1.7 |
1.5 |
1.3 |
1.2 |
0.6 |
0.4 |
0.7 |
Table 10b Payment cards. Use of terminals (in millions of transactions)
|
2012 |
2013 |
2014 |
2015 |
2016 |
2017 |
2018 |
2019 |
2020 |
2021 |
2022 |
|
|
Use of Norwegian and foreign cards at Norwegian terminals |
1 531.3 |
1 623.5 |
1 739.7 |
1 855.2 |
1 998.4 |
2 149.5 |
2 248.9 |
2 369.8 |
2 267.3 |
2 365.1 |
2 624.1 |
|
Withdrawals through in-store cash services |
- |
- |
- |
- |
- |
- |
- |
- |
0.3 |
1.7 |
2.3 |
|
Cash withdrawals from ATMs |
73.3 |
66.8 |
61.3 |
55.9 |
48.9 |
41.1 |
35.4 |
30.4 |
19.5 |
15.7 |
17.0 |
|
Payments at EFTPOS terminals that accept BankAxept |
1 422.1 |
1 517.6 |
1 630.3 |
1 742.2 |
1 866.7 |
1 940.3 |
1 999.8 |
2 075.9 |
1 948.6 |
1 975.6 |
2 153.3 |
|
Of which: payments with cashback |
55.9 |
51.1 |
46.2 |
41.5 |
36.2 |
31.1 |
25.3 |
21.3 |
12.6 |
9.8 |
9.6 |
|
Of which: contactless payments |
- |
- |
- |
- |
- |
15.7 |
82.4 |
318.0 |
1 250.8 |
1 587.2 |
1 836.9 |
|
Internet payments |
35.6 |
38.5 |
46.8 |
55.9 |
81.6 |
110.3 |
165.5 |
234.9 |
275.4 |
343.3 |
409.9 |
|
Other payments at domestic terminals |
0.3 |
0.6 |
1.2 |
1.1 |
1.3 |
57.8 |
48.1 |
28.6 |
23.5 |
28.8 |
41.7 |
|
Use of Norwegian cards at Norwegian terminals |
1 504.2 |
1 591.9 |
1 703.1 |
1 815.5 |
1 952.2 |
2 095.2 |
2 182.2 |
2 281.1 |
2 217.1 |
2 313.7 |
2 502.4 |
|
Withdrawals through in-store cash services |
- |
- |
- |
- |
- |
- |
- |
- |
0.3 |
1.7 |
2.3 |
|
Cash withdrawals from ATMs |
70.9 |
64.8 |
59.4 |
54.3 |
47.2 |
39.6 |
34.4 |
29.1 |
18.9 |
15.3 |
16.2 |
|
BankAxept |
65.3 |
59.5 |
54.4 |
49.7 |
43.3 |
36.0 |
31.1 |
26.5 |
17.3 |
13.8 |
14.4 |
|
Other cards |
5.6 |
5.4 |
5.0 |
4.5 |
3.9 |
3.6 |
3.0 |
2.6 |
1.6 |
1.5 |
1.8 |
|
Payments at payment terminals |
1 432.9 |
1 526.5 |
1 642.5 |
1 760.0 |
1 903.7 |
1 997.8 |
2 100.0 |
2 223.4 |
2 174.6 |
2 268.0 |
2 442.2 |
|
BankAxept – payments at EFTPOS terminal (including payments with cash-back) |
1 233.6 |
1 307.1 |
1 398.2 |
1 476.5 |
1 551.3 |
1 602.4 |
1 636.2 |
1 656.1 |
1 592.1 |
1 604.5 |
1 630.7 |
|
BankAxess |
0.2 |
0.2 |
0.2 |
0.2 |
0.2 |
0.2 |
0.1 |
0.1 |
0.1 |
0.0 |
0.1 |
|
Cards issued by international card companies and Norwegian credit cards |
171.1 |
190.0 |
216.1 |
255.7 |
325.1 |
368.7 |
438.3 |
540.7 |
557.7 |
638.6 |
783.0 |
|
Cards issued by oil companies |
22.4 |
24.5 |
23.1 |
23.3 |
22.9 |
22.5 |
21.4 |
22.5 |
21.1 |
21.5 |
22.4 |
|
Cards issued by retail chains |
5.3 |
4.1 |
4.4 |
3.8 |
3.8 |
3.7 |
3.7 |
3.7 |
3.3 |
3.1 |
4.8 |
|
E-money cards |
0.2 |
0.6 |
0.6 |
0.5 |
0.4 |
0.3 |
0.3 |
0.3 |
0.2 |
0.3 |
1.3 |
|
Other payments at Norwegian terminals |
0.3 |
0.6 |
1.2 |
1.1 |
1.3 |
57.8 |
48.1 |
28.6 |
23.3 |
28.7 |
41.7 |
|
Use of foreign cards at Norwegian terminals |
27.0 |
31.6 |
36.6 |
39.7 |
46.2 |
54.3 |
66.7 |
88.7 |
50.2 |
51.4 |
121.8 |
Table 10c Use of cards for transactions on the internet (in millions of transactions)
|
2012 |
2013 |
2014 |
2015 |
2016 |
2017 |
2018 |
2019 |
2020 |
2021 |
2022 |
|
|
Use of Norwegian cards (in Norway and abroad) |
74.6 |
95.4 |
115.3 |
130.0 |
177.2 |
234.4 |
305.5 |
378.2 |
459.2 |
545.1 |
629.9 |
|
Norwegian cards in Norway |
31.9 |
33.8 |
41.0 |
49.3 |
73.7 |
99.8 |
155.8 |
219.6 |
268.7 |
334.0 |
397.8 |
|
Norwegian cards abroad |
42.7 |
61.6 |
74.3 |
80.7 |
103.5 |
134.6 |
149.7 |
158.7 |
190.5 |
211.1 |
232.2 |
|
Use of foreign cards in Norway |
3.8 |
4.7 |
5.8 |
6.6 |
7.9 |
10.5 |
9.8 |
15.3 |
6.6 |
9.3 |
12.1 |
Table 11 Cross-border transfers registered in the Register of Crossborder Transactions and Currency Exchange (transactions in millions)
|
2012 |
2013 |
2014 |
2015 |
2016 |
2017 |
2018 |
2019 |
2020 |
2021 |
2022 |
|
|
Transfers from Norway |
9.0 |
10.0 |
10.3 |
10.9 |
11.2 |
11.5 |
11.5 |
11.1 |
11.6 |
12.7 |
13.5 |
|
SWIFT |
8.0 |
8.7 |
9.3 |
9.9 |
10.1 |
10.3 |
10.4 |
10.1 |
10.7 |
11.8 |
12.7 |
|
Foreign currency cheques |
0.1 |
0.1 |
0.1 |
0.1 |
0.1 |
0.0 |
0.0 |
0.0 |
0.1 |
0.1 |
0.1 |
|
Other transfers (MoneyGram, Western Union, etc.) |
0.9 |
1.2 |
0.8 |
0.9 |
1.0 |
1.1 |
1.1 |
1.0 |
0.8 |
0.8 |
0.7 |
|
Transfers to Norway |
3.6 |
4.3 |
4.9 |
5.3 |
5.9 |
7.1 |
7.6 |
7.5 |
7.8 |
8.2 |
9.6 |
|
SWIFT |
3.5 |
4.2 |
4.7 |
5.3 |
5.9 |
7.1 |
7.6 |
7.4 |
7.8 |
8.2 |
9.6 |
|
Foreign currency cheques |
0.0 |
0.0 |
0.1 |
0.0 |
0.0 |
0.0 |
0.0 |
0.0 |
0.0 |
0.0 |
0.0 |
|
Other transfers (MoneyGram, Western Union, etc.) |
0.0 |
0.1 |
0.1 |
0.0 |
0.0 |
0.0 |
0.0 |
0.0 |
0.0 |
0.0 |
0.0 |
Table 12 Use of payment instruments (in billions of NOK)
|
2012 |
2013 |
2014 |
2015 |
2016 |
2017 |
2018 |
2019 |
2020 |
2021 |
2022 |
|
|
Total |
13 802.8 |
14 724.3 |
15 858.2 |
16 662.4 |
16 763.6 |
18 355.1 |
19 935.4 |
20 957.7 |
20 340.0 |
22 739.2 |
25 314.3 |
|
Giros |
13 201.0 |
14 085.1 |
15 172.1 |
15 934.7 |
15 988.4 |
17 513.9 |
19 074.2 |
20 057.9 |
19 456.1 |
21 786.9 |
24 243.9 |
|
Electronic |
13 055.0 |
13 946.6 |
15 045.2 |
15 796.0 |
15 836.8 |
17 387.8 |
18 951.6 |
19 937.2 |
19 361.6 |
21 694.3 |
24 130.1 |
|
Paper-based |
146.0 |
138.5 |
126.9 |
138.7 |
151.6 |
126.1 |
122.6 |
120.7 |
94.5 |
92.6 |
113.8 |
|
Payment cards (payments) |
594.1 |
632.7 |
681.3 |
724.3 |
772.7 |
839.4 |
860.1 |
899.3 |
883.5 |
952.2 |
1 070.3 |
|
Electronic |
590.0 |
628.8 |
677.4 |
720.3 |
769.7 |
836.3 |
857.1 |
896.4 |
882.9 |
951.7 |
1 069.4 |
|
Manual |
4.1 |
3.9 |
3.9 |
4.1 |
3.0 |
3.1 |
3.0 |
2.9 |
0.6 |
0.4 |
0.9 |
|
Cheques |
7.7 |
6.5 |
4.8 |
3.4 |
2.5 |
1.8 |
1.1 |
0.5 |
0.4 |
0.2 |
0.1 |
Table 13 Giros (in billions of NOK)
|
2012 |
2013 |
2014 |
2015 |
2016 |
2017 |
2018 |
2019 |
2020 |
2021 |
2022 |
|
|
Total |
13 201.0 |
14 085.1 |
15 172.1 |
15 934.7 |
15 988.4 |
17 513.9 |
19 074.2 |
20 057.9 |
19 456.1 |
21 786.9 |
24 243.9 |
|
Credit transfers |
12 942.9 |
13 815.9 |
14 901.0 |
15 643.7 |
15 691.6 |
17 240.1 |
18 778.6 |
19 752.4 |
19 068.7 |
21 272.4 |
23 729.7 |
|
Electronic |
12 816.3 |
13 697.4 |
14 790.9 |
15 528.8 |
15 568.9 |
17 126.4 |
18 664.6 |
19 639.7 |
18 979.6 |
21 183.6 |
23 618.8 |
|
Company terminal giro |
1 042.6 |
1 073.0 |
977.0 |
958.0 |
1 016.3 |
1 123.5 |
1 136.1 |
1 253.3 |
1 158.1 |
1 206.7 |
1 179.3 |
|
Telegiros |
23.1 |
20.3 |
18.0 |
16.0 |
13.7 |
12.0 |
9.6 |
8.1 |
4.1 |
6.5 |
6.2 |
|
Online banking |
11 175.7 |
11 917.0 |
13 005.2 |
13 721.9 |
13 792.6 |
15 291.0 |
16 767.2 |
17 573.2 |
16 966.9 |
19 196.4 |
21 462.4 |
|
Retail customers |
1 298.9 |
1 405.8 |
1 480.3 |
1 462.0 |
1 536.9 |
1 618.1 |
1 574.6 |
1 549.3 |
1 331.7 |
1 392.1 |
1 476.1 |
|
Corporate customers |
9 876.8 |
10 511.2 |
11 524.9 |
12 259.9 |
12 255.7 |
13 672.9 |
15 192.6 |
16 023.9 |
15 635.2 |
17 804.4 |
19 986.3 |
|
Instant payments |
- |
- |
- |
- |
- |
4.1 |
45.4 |
88.0 |
114.0 |
142.0 |
181.9 |
|
Miscellaneous other electronic credit transfers |
574.8 |
687.0 |
790.6 |
832.9 |
746.4 |
695.7 |
738.6 |
717.1 |
736.5 |
632.0 |
789.0 |
|
Paper-based |
126.6 |
118.5 |
110.2 |
114.9 |
122.7 |
113.7 |
114.0 |
112.8 |
89.1 |
88.8 |
110.9 |
|
Company terminal giros and online banking as money order |
7.4 |
6.9 |
6.3 |
5.7 |
5.1 |
3.6 |
2.9 |
2.6 |
1.4 |
1.1 |
0.6 |
|
Postal giros |
32.0 |
28.3 |
24.4 |
20.7 |
17.3 |
13.9 |
11.4 |
9.5 |
7.5 |
6.4 |
4.9 |
|
Giros delivered at the counter – account debits |
87.2 |
83.3 |
79.4 |
88.4 |
100.3 |
96.2 |
99.7 |
100.6 |
80.2 |
81.3 |
105.4 |
|
Direct debits |
238.7 |
249.2 |
254.3 |
267.2 |
267.8 |
261.4 |
287.0 |
297.5 |
381.9 |
510.7 |
511.3 |
|
Giros delivered at the counter – cash payments |
19.4 |
20.0 |
16.7 |
23.8 |
28.9 |
12.4 |
8.6 |
8.0 |
5.5 |
3.8 |
2.8 |
Table 14a Use of payments cards (in billions of NOK)
|
2012 |
2013 |
2014 |
2015 |
2016 |
2017 |
2018 |
2019 |
2020 |
2021 |
2022 |
|
|
Total use of Norwegian cards (in Norway and abroad) |
740.9 |
775.3 |
814.6 |
855.3 |
890.9 |
945.7 |
954.9 |
986.8 |
936.9 |
1000.8 |
1127.2 |
|
Payments |
594.1 |
632.7 |
681.3 |
724.3 |
772.7 |
839.4 |
860.1 |
899.3 |
883.6 |
952.2 |
1070.3 |
|
Payments at EFTPOS terminals |
536.6 |
568.1 |
606.5 |
637.9 |
667.7 |
691.1 |
700.7 |
718.3 |
694.5 |
719.4 |
784.7 |
|
Of which: contactless payments |
- |
- |
- |
- |
- |
3.2 |
16.9 |
73.4 |
398.7 |
548.2 |
633.9 |
|
- with physical cards |
- |
- |
- |
- |
- |
- |
- |
- |
394.4 |
533.0 |
599.6 |
|
- other contactless payments |
- |
- |
- |
- |
- |
- |
- |
- |
4.4 |
15.3 |
34.3 |
|
Internet payments |
53.0 |
59.6 |
68.8 |
80.4 |
99.8 |
117.4 |
133.8 |
166.4 |
179.1 |
221.8 |
271.0 |
|
Other electronic payments |
0.5 |
1.1 |
2.0 |
1.9 |
2.3 |
27.7 |
22.6 |
11.7 |
9.2 |
10.4 |
13.8 |
|
Manual payments |
4.1 |
3.9 |
3.9 |
4.1 |
3.0 |
3.1 |
3.0 |
2.9 |
0.6 |
0.4 |
0.9 |
|
Cash-back from EFTPOS terminals |
23.0 |
21.7 |
20.3 |
18.9 |
17.4 |
15.0 |
12.1 |
10.4 |
7.0 |
5.2 |
5.0 |
|
Other cash withdrawals |
123.7 |
120.9 |
113.0 |
112.1 |
100.8 |
91.3 |
82.6 |
77.0 |
46.3 |
43.5 |
51.8 |
|
Use of Norwegian cards by function |
740.9 |
775.3 |
814.6 |
855.3 |
890.9 |
945.7 |
954.9 |
986.8 |
936.7 |
1 000.8 |
1 127.2 |
|
Debit functions |
619.7 |
641.3 |
669.9 |
699.9 |
726.4 |
758.1 |
762.6 |
771.1 |
765.0 |
828.1 |
909.5 |
|
BankAxept |
529.6 |
541.6 |
560.7 |
578.6 |
585.2 |
583.6 |
581.1 |
576.6 |
585.0 |
592.8 |
590.3 |
|
Payment cards issued by international card companies |
90.1 |
99.7 |
109.2 |
121.4 |
141.2 |
174.5 |
181.5 |
194.4 |
179.9 |
235.3 |
319.2 |
|
Billing functions (payment cards issued by international card companies) |
23.6 |
24.0 |
24.9 |
24.1 |
23.8 |
24.7 |
24.1 |
20.7 |
12.4 |
13.0 |
14.8 |
|
Credit functions |
97.4 |
109.6 |
119.4 |
130.8 |
140.4 |
162.7 |
168.0 |
194.8 |
159.7 |
159.4 |
202.1 |
|
Domestic credit cards |
9.3 |
8.8 |
8.5 |
8.2 |
8.2 |
8.5 |
8.5 |
9.3 |
2.6 |
0.1 |
0.0 |
|
Payment cards issued by international card companies |
88.1 |
100.9 |
110.9 |
122.7 |
132.2 |
154.2 |
159.5 |
185.6 |
157.1 |
159.3 |
202.1 |
|
E-money |
0.1 |
0.4 |
0.4 |
0.4 |
0.3 |
0.3 |
0.2 |
0.2 |
0.2 |
0.3 |
0.8 |
|
Use of Norwegian cards in Norway |
638.4 |
658.9 |
685.1 |
715.0 |
744.9 |
787.6 |
795.0 |
816.8 |
827.4 |
867.5 |
916.7 |
|
Payments |
514.3 |
540.8 |
572.7 |
608.1 |
649.2 |
703.7 |
722.3 |
749.6 |
782.0 |
826.3 |
873.3 |
|
Cash-back from EFTPOS terminals |
23.0 |
21.7 |
20.3 |
18.9 |
17.4 |
15.0 |
12.1 |
10.4 |
7.0 |
5.2 |
5.0 |
|
Other cash withdrawals |
101.2 |
96.5 |
92.1 |
88.1 |
78.3 |
68.9 |
60.6 |
56.7 |
38.4 |
36.0 |
38.5 |
|
Use of Norwegian cards abroad |
102.4 |
116.3 |
129.5 |
140.2 |
145.9 |
158.2 |
159.9 |
170.0 |
109.5 |
133.3 |
209.7 |
|
Payments |
79.9 |
91.9 |
108.6 |
116.3 |
123.5 |
135.7 |
137.9 |
149.7 |
101.6 |
125.8 |
196.4 |
|
Cash withdrawals |
22.6 |
24.4 |
20.9 |
24.0 |
22.4 |
22.4 |
22.0 |
20.3 |
7.9 |
7.5 |
13.3 |
|
Use of foreign cards in Norway |
18.7 |
21.8 |
27.9 |
33.1 |
38.7 |
44.4 |
46.8 |
63.6 |
25.6 |
24.5 |
59.6 |
|
Payments |
15.5 |
19.1 |
25.2 |
30.6 |
36.1 |
42.0 |
44.6 |
61.6 |
24.5 |
23.6 |
58.2 |
|
Cash withdrawals |
3.1 |
2.7 |
2.7 |
2.5 |
2.6 |
2.4 |
2.2 |
2.1 |
1.1 |
0.9 |
1.4 |
Table 14b Payment cards. Use of terminals (in billions of NOK)
|
2012 |
2013 |
2014 |
2015 |
2016 |
2017 |
2018 |
2019 |
2020 |
2021 |
2022 |
|
|
Use of Norwegian and foreign cards at Norwegian terminals |
673.6 |
696.4 |
728.0 |
761.6 |
795.2 |
843.9 |
856.3 |
895.6 |
868.1 |
910.3 |
1 002.2 |
|
Withdrawals through in-store cash services |
- |
- |
- |
- |
- |
- |
- |
- |
1.3 |
4.7 |
6.6 |
|
Cash withdrawals from ATMs |
104.1 |
99.0 |
94.7 |
90.3 |
80.5 |
70.7 |
62.3 |
58.2 |
38.2 |
32.1 |
33.3 |
|
Payments at EFTPOS terminals that accept BankAxept |
538.0 |
561.0 |
590.5 |
621.4 |
651.0 |
671.5 |
686.4 |
702.7 |
706.2 |
727.0 |
782.4 |
|
Of which: POS cash withdrawals (cash-back) |
23.0 |
21.7 |
20.3 |
18.9 |
17.4 |
15.0 |
12.1 |
10.4 |
7.0 |
5.2 |
5.0 |
|
Of which: contactless payments |
- |
- |
- |
- |
- |
1.8 |
12.9 |
66.7 |
399.0 |
543.7 |
613.1 |
|
Internet payments |
31.0 |
35.3 |
40.8 |
48.0 |
61.3 |
73.4 |
85.3 |
123.0 |
112.9 |
135.4 |
166.2 |
|
Other payments at Norwegian terminals |
0.4 |
1.1 |
2.0 |
1.9 |
2.3 |
27.7 |
22.2 |
11.7 |
9.5 |
11.0 |
13.8 |
|
Use of Norwegian cards at Norwegian terminals |
655.0 |
674.7 |
700.3 |
729.2 |
757.9 |
800.6 |
810.6 |
833.2 |
842.9 |
886.1 |
943.5 |
|
Withdrawals through in-store cash services |
- |
- |
- |
- |
- |
- |
- |
- |
1.3 |
4.7 |
6.6 |
|
Cash withdrawals from ATMs |
101.0 |
96.3 |
92.0 |
87.8 |
77.9 |
68.3 |
60.1 |
56.1 |
37.0 |
31.3 |
31.9 |
|
Bank cards/BankAxept |
91.7 |
87.4 |
83.3 |
79.6 |
70.8 |
61.6 |
54.6 |
51.2 |
33.9 |
28.4 |
28.7 |
|
Other cards |
9.2 |
8.9 |
8.7 |
8.3 |
7.2 |
6.7 |
5.5 |
5.0 |
3.1 |
2.8 |
3.2 |
|
Cash-back from EFTPOS terminals |
23.0 |
21.7 |
20.3 |
18.9 |
17.4 |
15.0 |
12.1 |
10.4 |
7.0 |
5.2 |
5.0 |
|
Payments at payment terminals |
530.6 |
555.5 |
586.1 |
620.5 |
660.3 |
689.6 |
716.2 |
755.0 |
788.0 |
833.9 |
886.3 |
|
BankAxept – payments at EFTPOS terminal |
414.3 |
432.1 |
456.7 |
479.7 |
496.4 |
506.4 |
513.9 |
514.6 |
542.1 |
554.3 |
549.8 |
|
BankAxess |
0.5 |
0.5 |
0.4 |
0.4 |
0.5 |
0.6 |
0.6 |
0.4 |
0.3 |
0.2 |
0.2 |
|
Cards issued by international card companies and Norwegian credit cards |
97.8 |
105.9 |
112.3 |
124.6 |
148.7 |
167.3 |
183.5 |
221.4 |
229.9 |
261.0 |
308.9 |
|
Cards issued by oil companies |
15.4 |
15.2 |
14.6 |
14.0 |
12.9 |
13.6 |
16.5 |
16.8 |
14.0 |
16.7 |
23.7 |
|
Cards issued by retail chains |
2.4 |
1.6 |
1.8 |
1.5 |
1.6 |
1.5 |
1.6 |
1.6 |
1.5 |
1.5 |
2.9 |
|
E-money cards |
0.1 |
0.3 |
0.3 |
0.2 |
0.2 |
0.2 |
0.2 |
0.2 |
0.2 |
0.2 |
0.8 |
|
Other payments at Norwegian terminals |
0.4 |
1.1 |
2.0 |
1.9 |
2.3 |
27.7 |
22.2 |
11.7 |
9.5 |
11.0 |
13.8 |
|
Use of foreign cards at Norwegian terminals |
18.6 |
21.7 |
27.7 |
32.4 |
37.3 |
43.4 |
45.7 |
62.4 |
25.2 |
24.2 |
58.7 |
Table 14c Use of cards for transactions on the internet (in billions of NOK)
|
2012 |
2013 |
2014 |
2015 |
2016 |
2017 |
2018 |
2019 |
2020 |
2021 |
2022 |
|
|
Use of Norwegian cards (in Norway and abroad) |
53.0 |
59.6 |
68.8 |
80.4 |
99.8 |
117.4 |
133.8 |
166.4 |
179.1 |
221.8 |
271.0 |
|
Norwegian cards in Norway |
25.3 |
27.7 |
29.4 |
33.1 |
44.3 |
51.7 |
65.1 |
90.1 |
102.2 |
125.8 |
147.9 |
|
Norwegian cards abroad |
27.6 |
31.9 |
39.4 |
47.3 |
55.4 |
65.7 |
68.7 |
76.3 |
76.9 |
96.0 |
123.0 |
|
Use of foreign cards in Norway |
5.7 |
7.5 |
11.5 |
14.9 |
17.0 |
22.3 |
20.3 |
32.9 |
10.7 |
9.6 |
18.3 |
Table 15 Cross-border transfers registered in the Register of Crossborder Transactions and Currency Exchange (in billions of NOK)
|
2012 |
2013 |
2014 |
2015 |
2016 |
2017 |
2018 |
2019 |
2020 |
2021 |
2022 |
|
|
Transfers from Norway |
9 206.3 |
8 225.7 |
8 683.7 |
10 748.0 |
7 655.6 |
8 196.4 |
7 891.1 |
6 456.0 |
6 622.3 |
7 324.5 |
9 738.7 |
|
SWIFT |
7 274.5 |
6 299.8 |
6 521.4 |
8 103.7 |
6 802.8 |
7 458.5 |
7 277.4 |
6 041.3 |
6 224.4 |
6 935.5 |
9 062.9 |
|
Foreign currency cheques |
1 928.6 |
1 921.8 |
2 159.3 |
2 641.0 |
849.3 |
727.8 |
607.2 |
407.7 |
389.8 |
364.3 |
647.4 |
|
Other transfers (MoneyGram, Western Union, etc.) |
3.3 |
4.1 |
3.0 |
3.3 |
3.6 |
10.0 |
6.6 |
6.9 |
8.1 |
24.7 |
28.4 |
|
Transfers to Norway |
5 634.6 |
6 413.2 |
6 739.4 |
8 266.3 |
6 933.5 |
7 066.2 |
6 988.8 |
7 181.0 |
7 905.1 |
8 428.8 |
13 326.9 |
|
SWIFT |
5 633.9 |
6 412.5 |
6 738.8 |
8 265.8 |
6 933.0 |
7 058.2 |
6 987.2 |
7 180.7 |
7 904.7 |
8 428.5 |
13 326.8 |
|
Foreign currency cheques |
0.5 |
0.4 |
0.3 |
0.3 |
0.3 |
0.2 |
0.3 |
0.2 |
0.2 |
0.2 |
0.0 |
|
Other transfers (MoneyGram, Western Union, etc.) |
0.2 |
0.2 |
0.2 |
0.2 |
0.2 |
7.8 |
1.3 |
0.2 |
0.2 |
0.1 |
0.1 |
Table 16 Sending of electronic invoices (in millions)
|
2013 |
2014 |
2015 |
2016 |
2017 |
2018 |
2019 |
2020 |
2021 |
2022 |
|
|
eFaktura from businesses to retail customers (B2C) |
49.0 |
59.0 |
69.7 |
80.8 |
83.8 |
99.6 |
139.8 |
163.9 |
174.7 |
191.3 |
|
EHF format |
1.3 |
5.0 |
10.6 |
17.9 |
29.1 |
45.2 |
58.1 |
66.4 |
84.7 |
98.5 |
Prices
Table 17 Prices for domestic payment services and cash withdrawals, retail customers. Weighted average (NOK). 1 January each year
|
Customers who do not belong to loyalty schemes |
Customers who belong to loyalty schemes |
|||||||||||
|
2018 |
2019 |
2020 |
2021 |
2022 |
2023 |
2018 |
2019 |
2020 |
2021 |
2022 |
2023 |
|
|
Payments |
||||||||||||
|
Online banking (with CID), per payment |
0.90 |
0.80 |
0.80 |
0.70 |
0.80 |
0.80 |
0.00 |
0.00 |
0.00 |
0.10 |
0.10 |
0.30 |
|
Online banking – annual fee |
14.40 |
14.50 |
14.70 |
13.20 |
13.30 |
13.10 |
1.40 |
2.30 |
2.40 |
0.60 |
1.10 |
1.10 |
|
Direct debit (Avtalegiro), per payment |
1.00 |
0.80 |
0.80 |
0.80 |
0.80 |
0.80 |
0.10 |
0.10 |
0.00 |
0.20 |
0.30 |
0.30 |
|
Mobile banking (with CID), per payment |
1.00 |
0.80 |
0.80 |
0.90 |
0.80 |
0.80 |
0.00 |
0.00 |
0.00 |
0.10 |
0.10 |
0.30 |
|
Mobile banking – info by SMS |
2.10 |
2.20 |
2.20 |
2.10 |
2.10 |
2.00 |
1.90 |
1.90 |
1.90 |
1.80 |
1.90 |
1.80 |
|
Credit transfer via postal giro, per payment |
11.30 |
12.10 |
12.30 |
12.30 |
13.00 |
13.00 |
11.20 |
12.10 |
12.30 |
12.30 |
12.80 |
13.10 |
|
Giro over the counter – account debit, per payment |
85.80 |
94.80 |
95.70 |
95.40 |
97.10 |
102.50 |
87.50 |
94.80 |
95.70 |
95.40 |
97.10 |
102.50 |
|
Giro over the counter – cash payment, per payment |
99.20 |
107.90 |
108.10 |
108.40 |
108.50 |
115.20 |
100.20 |
107.90 |
108.10 |
108.40 |
108.50 |
115.20 |
|
BankAxept cards at payment terminals (EFTPOS), per payment |
1.00 |
0.90 |
0.90 |
0.80 |
0.80 |
0.80 |
0.10 |
0.10 |
0.00 |
0.10 |
0.00 |
0.00 |
|
Credit card from international credit card company, annual fee |
56.60 |
32.40 |
15.30 |
21.30 |
26.80 |
28.20 |
32.20 |
25.20 |
25.00 |
23.60 |
12.50 |
31.90 |
|
BankAxept cards (combined with debet card from int. card comp.), annual fee |
277.30 |
282.50 |
290.90 |
298.00 |
299.60 |
295.70 |
234.00 |
231.80 |
238.40 |
220.50 |
227.90 |
227.90 |
|
ATM withdrawals, debit cards |
||||||||||||
|
Own bank’s ATMs during opening hours, per withdrawal |
5.50 |
5.60 |
6.50 |
7.20 |
7.80 |
7.90 |
5.50 |
5.90 |
6.70 |
6.70 |
6.50 |
6.00 |
|
Other bank’s ATMs during opening hours, per withdrawal |
7.50 |
7.80 |
8.10 |
8.50 |
8.60 |
8.70 |
7.30 |
7.40 |
7.80 |
7.20 |
7.00 |
7.30 |
|
ATM withdrawals, international credit cards |
||||||||||||
|
Own bank’s ATMs during opening hours, per withdrawal |
28.60 |
30.70 |
31.60 |
31.10 |
31.40 |
34.40 |
20.40 |
22.20 |
30.80 |
32.60 |
33.80 |
36.40 |
|
Other bank’s ATMs during opening hours, per withdrawal |
28.70 |
30.70 |
31.70 |
31.10 |
31.40 |
34.40 |
20.40 |
22.20 |
31.00 |
32.60 |
33.80 |
36.10 |
|
Fee as a percentage of withdrawal amount |
1.0 |
1.3 |
1.2 |
1.1 |
1.1 |
1.2 |
1.1 |
1.2 |
1.2 |
0.8 |
1.1 |
1.2 |
Table 18 Prices for domestic payment services, corporate customers. Weighted average (NOK). 1 January each year
|
2012 |
2013 |
2014 |
2015 |
2016 |
2017 |
2018 |
2019 |
2020 |
2021 |
2022 |
2023 |
|
|
Payments |
||||||||||||
|
Electronic giro services |
||||||||||||
|
Corporate online banking monthly fee |
- |
- |
- |
- |
- |
- |
- |
- |
- |
- |
- |
71.20 |
|
Corporate online banking without notification |
1.50 |
1.60 |
2.60 |
2.80 |
2.60 |
3.10 |
3.30 |
3.20 |
3.30 |
3.60 |
3.80 |
4.20 |
|
Corporate online banking with notification |
4.20 |
4.20 |
4.30 |
4.40 |
4.40 |
4.50 |
4.50 |
4.50 |
4.90 |
5.10 |
5.30 |
5.00 |
|
Corporate online banking with CID |
1.10 |
1.10 |
1.20 |
1.10 |
1.30 |
1.30 |
1.40 |
1.50 |
1.50 |
1.50 |
1.50 |
1.50 |
|
Autogiro payment |
- |
- |
- |
- |
- |
- |
- |
- |
- |
- |
- |
2.30 |
|
Paper-based giro services |
||||||||||||
|
Corporate online banking sent as money order |
74.80 |
75.20 |
84.00 |
89.20 |
91.90 |
98.60 |
101.30 |
101.30 |
103.20 |
103.70 |
111.30 |
108.30 |
|
Receipt of payment |
||||||||||||
|
Electronic giro services |
||||||||||||
|
Avtalegiro monthly fee |
- |
- |
- |
- |
- |
- |
- |
- |
- |
- |
- |
80.40 |
|
Avtalegiro without notification |
1.30 |
1.30 |
1.40 |
1.40 |
1.60 |
1.60 |
1.70 |
2.00 |
2.00 |
2.00 |
2.60 |
2.60 |
|
Avtalegiro with notification |
3.60 |
3.60 |
3.80 |
3.80 |
3.60 |
3.60 |
3.90 |
3.90 |
3.90 |
4.10 |
4.10 |
4.10 |
|
Autogiro monthly fee |
- |
- |
- |
- |
- |
- |
- |
- |
- |
- |
- |
80.40 |
|
Autogiro without notification |
2.20 |
2.20 |
2.40 |
2.70 |
2.80 |
2.80 |
3.10 |
3.80 |
3.60 |
3.70 |
3.80 |
3.50 |
|
Autogiro with notification |
6.30 |
7.40 |
7.80 |
8.00 |
7.60 |
7.60 |
8.10 |
8.40 |
8.30 |
8.40 |
8.40 |
7.80 |
|
E-giro monthly fee |
- |
- |
- |
- |
- |
- |
- |
- |
- |
- |
- |
84.50 |
|
E-giro with CID |
- |
- |
- |
- |
- |
- |
- |
- |
- |
- |
- |
2.20 |
|
E-giro with notification |
- |
- |
- |
- |
- |
- |
- |
- |
- |
- |
- |
2.50 |
|
Optical Character Recognition monthly fee |
- |
- |
- |
- |
- |
- |
- |
- |
- |
- |
- |
84.50 |
|
Optical Character Recognition with CID |
- |
- |
- |
- |
- |
- |
- |
- |
- |
- |
- |
2.20 |
|
Sending eFaktura |
||||||||||||
|
eFaktura B2C monthly fee |
- |
- |
- |
- |
- |
- |
- |
- |
- |
- |
- |
76.30 |
|
eFaktura B2C per invoice |
- |
- |
- |
- |
- |
- |
- |
- |
- |
- |
- |
3.40 |
|
eFaktura B2C invoice hotel per invoice |
- |
- |
- |
- |
- |
- |
- |
- |
- |
- |
- |
1.80 |
|
eFaktura B2B online banking monthly fee |
- |
- |
- |
- |
- |
- |
- |
- |
- |
- |
- |
159.30 |
|
eFaktura B2B online banking per invoice |
- |
- |
- |
- |
- |
- |
- |
- |
- |
- |
- |
8.40 |
|
eFaktura B2B file-based monthly fee |
- |
- |
- |
- |
- |
- |
- |
- |
- |
- |
- |
201.90 |
|
eFaktura B2B file-based per invoice |
- |
- |
- |
- |
- |
- |
- |
- |
- |
- |
- |
3.30 |
|
Receipt of eFaktura |
||||||||||||
|
eFaktura B2B online banking monthly fee |
- |
- |
- |
- |
- |
- |
- |
- |
- |
- |
- |
211.70 |
|
eFaktura B2B online banking per invoice |
- |
- |
- |
- |
- |
- |
- |
- |
- |
- |
- |
3.20 |
|
eFaktura B2B file-based monthly fee |
- |
- |
- |
- |
- |
- |
- |
- |
- |
- |
- |
201.90 |
|
eFaktura B2B file-based per invoice |
- |
- |
- |
- |
- |
- |
- |
- |
- |
- |
- |
3.30 |
Table 19 Prices for transfers from Norway to EU/EEA countries. Weighted average (NOK) for a sample of banks. 1 January each year
|
Electronic payment order/automated processing |
Manual payment order |
|||||||||||
|
2018 |
2019 |
2020 |
2021 |
2022 |
2023 |
2018 |
2019 |
2020 |
2021 |
2022 |
2023 |
|
|
SEPA (SWIFT) transfers |
||||||||||||
|
With BIC and IBAN, NOK 2 500 |
29.20 |
29.20 |
25.80 |
26.50 |
25.70 |
29.10 |
- |
- |
- |
- |
- |
- |
|
Ordinary Swift transfer in NOK |
||||||||||||
|
Without BIC and IBAN, NOK 2 500 |
91.60 |
90.90 |
98.70 |
102.40 |
122.80 |
125.30 |
302.60 |
299.70 |
294.50 |
298.80 |
306.50 |
311.60 |
|
With BIC and IBAN, NOK 2 500 |
67.00 |
66.70 |
71.50 |
72.60 |
69.30 |
72.40 |
239.70 |
299.10 |
294.10 |
298.10 |
299.00 |
305.20 |
|
Ordinary Swift transfer in EUR |
||||||||||||
|
Without BIC and IBAN, NOK 2 500 equivalent |
72.80 |
73.00 |
82.20 |
84.90 |
109.50 |
113.30 |
302.60 |
299.70 |
294.50 |
298.80 |
306.50 |
311.60 |
|
With BIC and IBAN, NOK 2 500 equivalent |
52.60 |
54.60 |
65.00 |
62.50 |
60.80 |
64.30 |
301.60 |
299.10 |
294.10 |
298.10 |
299.00 |
305.20 |
|
SWIFT express transfer in NOK |
||||||||||||
|
Without BIC and IBAN, NOK 150 000 |
395.10 |
387.00 |
355.40 |
326.40 |
292.60 |
308.90 |
525.30 |
527.70 |
488.00 |
498.70 |
494.10 |
490.30 |
|
With BIC and IBAN, NOK 150 000 |
363.10 |
258.80 |
257.30 |
241.20 |
218.60 |
231.90 |
486.00 |
532.70 |
493.60 |
487.60 |
491.60 |
489.20 |
|
SWIFT express transfer in EUR |
||||||||||||
|
Without BIC and IBAN, NOK 150 000 equivalent |
383.40 |
376.00 |
345.90 |
317.00 |
279.30 |
297.00 |
525.30 |
527.70 |
488.00 |
498.70 |
494.10 |
490.30 |
|
With BIC and IBAN, NOK 150 000 equivalent |
358.70 |
254.70 |
253.70 |
237.40 |
213.50 |
227.30 |
486.00 |
524.60 |
486.10 |
487.60 |
491.60 |
489.20 |
|
Cheques to other countries |
||||||||||||
|
Equivalent to NOK 2 500 |
- |
- |
- |
- |
- |
- |
260.70 |
262.90 |
268.90 |
271.60 |
265.70 |
267.70 |
Table 20 Prices for receipt of payments from EU/EEA countries. Weighted average (NOK) for a sample of banks. 1 January each year
|
Receipt of payments from EU/EEA countries |
||||||||||||
|
2012 |
2013 |
2014 |
2015 |
2016 |
2017 |
2018 |
2019 |
2020 |
2021 |
2022 |
2023 |
|
|
Receipt of SEPA (SWIFT) payments |
||||||||||||
|
With BIC and IBAN, NOK 2 500 equivalent |
- |
- |
- |
- |
21.30 |
22.40 |
21.20 |
21.10 |
18.00 |
17.90 |
17.50 |
18.70 |
|
With BIC and IBAN, NOK 150 000 equivalent |
- |
- |
- |
- |
21.70 |
22.80 |
21.50 |
21.20 |
18.10 |
17.90 |
17.50 |
18.80 |
|
Receipt of payments in EUR |
||||||||||||
|
Without BIC and IBAN, NOK 2 500 equivalent |
60.80 |
61.50 |
64.30 |
54.20 |
59.40 |
62.60 |
70.50 |
72.40 |
76.10 |
79.50 |
81.50 |
81.30 |
|
Without BIC and IBAN, NOK 150 000 equivalent |
81.60 |
83.40 |
86.50 |
77.70 |
73.50 |
76.70 |
84.70 |
83.70 |
87.30 |
87.10 |
95.00 |
90.40 |
|
With BIC and IBAN, NOK 2 500 equivalent |
18.60 |
20.20 |
20.60 |
20.80 |
53.10 |
55.10 |
59.10 |
57.20 |
62.10 |
68.60 |
67.00 |
73.50 |
|
With BIC and IBAN, NOK 150 000 equivalent |
18.60 |
20.20 |
20.60 |
20.80 |
58.50 |
60.40 |
64.70 |
63.20 |
68.60 |
88.40 |
88.20 |
91.40 |
|
Receipt of payments in other currencies |
||||||||||||
|
Without BIC and IBAN, NOK 2 500 equivalent |
70.20 |
69.00 |
71.00 |
71.30 |
79.00 |
79.00 |
81.70 |
85.10 |
85.50 |
89.60 |
91.90 |
94.90 |
|
Without BIC and IBAN, NOK 150 000 equivalent |
91.40 |
90.40 |
97.00 |
97.90 |
93.90 |
93.80 |
95.90 |
95.90 |
96.70 |
96.80 |
104.40 |
110.90 |
|
With BIC and IBAN, NOK 2 500 equivalent |
70.20 |
68.90 |
71.00 |
71.30 |
72.10 |
72.70 |
73.80 |
73.50 |
75.00 |
77.00 |
74.90 |
79.00 |
|
With BIC and IBAN, NOK 150 000 equivalent |
90.40 |
89.10 |
95.80 |
96.80 |
96.00 |
96.20 |
96.80 |
96.80 |
96.90 |
96.80 |
96.10 |
96.90 |
Remittances
Table 21 Prices for remittances to selected countries. Banks and other providers. In percent of amount transferred. At 1 January 2022 and 2023
|
Transaction in person |
Online payment order |
|||||||
|
NOK 1 000 |
NOK 5 000 |
NOK 1 000 |
NOK 5 000 |
|||||
|
2022 |
2023 |
2022 |
2023 |
2022 |
2023 |
2022 |
2023 |
|
|
Banks |
27.9 |
29.6 |
6.4 |
6.6 |
6.0 |
6.1 |
1.9 |
2.0 |
|
Exchange rate cost |
1.0 |
0.9 |
1.0 |
0.9 |
0.9 |
0.9 |
0.9 |
0.9 |
|
Other fees |
26.9 |
28.8 |
5.4 |
5.8 |
5.1 |
5.2 |
1.0 |
1.0 |
|
Non-bank financial institutions and payment institutions |
- |
14.8 |
- |
12.5 |
5.4 |
5.3 |
3.9 |
3.9 |
|
Exchange rate cost |
- |
7.3 |
- |
7.3 |
3.3 |
3.3 |
3.3 |
3.3 |
|
Other fees |
- |
7.5 |
- |
5.2 |
2.2 |
2.0 |
0.6 |
0.6 |
|
All providers |
27.9 |
26.7 |
6.4 |
7.8 |
5.7 |
5.6 |
2.9 |
3.0 |
|
Exchange rate cost |
1.0 |
2.2 |
1.0 |
2.2 |
2.1 |
2.2 |
2.1 |
2.2 |
|
Other fees |
26.9 |
24.5 |
5.4 |
5.6 |
3.6 |
3.4 |
0.8 |
0.8 |
Table 22 Prices for remittances to selected countries. In percent of amount transferred. At 1 January 2022 and 2023
|
Transaction in person |
Online payment order |
|||||||
|
NOK 1 000 |
NOK 5 000 |
NOK 1 000 |
NOK 5 000 |
|||||
|
2022 |
2023 |
2022 |
2023 |
2022 |
2023 |
2022 |
2023 |
|
|
Europe (EU) |
25.0 |
27.1 |
5.4 |
7.3 |
3.6 |
4.7 |
1.8 |
2.5 |
|
EU/EEA |
24.1 |
29.0 |
5.1 |
6.0 |
2.6 |
3.1 |
0.8 |
0.9 |
|
Bulgaria |
- |
31.7 |
- |
7.7 |
- |
6.5 |
- |
4.0 |
|
Latvia |
24.1 |
26.8 |
5.1 |
7.8 |
3.4 |
3.8 |
1.9 |
1.9 |
|
Lithuania |
24.1 |
27.0 |
5.1 |
8.1 |
3.5 |
3.9 |
1.9 |
2.0 |
|
Poland |
26.4 |
25.2 |
5.9 |
6.3 |
4.0 |
4.2 |
2.0 |
2.1 |
|
Romania |
26.1 |
27.3 |
5.6 |
8.3 |
4.1 |
4.7 |
2.2 |
2.5 |
|
Hungary |
- |
26.3 |
- |
6.3 |
- |
5.7 |
- |
3.0 |
|
Other Europe |
29.7 |
28.1 |
7.1 |
8.1 |
6.2 |
6.1 |
3.0 |
3.3 |
|
Bosnia-Herzegovina |
30.4 |
28.8 |
6.4 |
9.0 |
5.7 |
7.9 |
2.5 |
4.7 |
|
Kosovo |
27.9 |
25.9 |
5.9 |
6.9 |
6.2 |
5.9 |
1.5 |
2.3 |
|
North Macedonia |
27.9 |
29.0 |
5.9 |
6.0 |
5.3 |
5.4 |
1.9 |
2.4 |
|
Russia |
27.9 |
0.0 |
7.9 |
0.0 |
5.8 |
0.0 |
2.7 |
0.0 |
|
Serbia |
34.0 |
30.6 |
10.0 |
10.9 |
6.7 |
6.8 |
3.6 |
3.9 |
|
Turkey |
31.5 |
28.1 |
7.5 |
8.4 |
6.9 |
6.0 |
4.3 |
3.4 |
|
Ukraine |
- |
- |
- |
- |
- |
4.7 |
- |
4.0 |
|
Asia |
30.3 |
28.2 |
7.3 |
8.4 |
6.2 |
6.3 |
2.8 |
3.1 |
|
Afghanistan |
30.3 |
28.5 |
6.3 |
8.3 |
6.2 |
6.9 |
1.5 |
3.3 |
|
Philippines |
28.2 |
25.2 |
6.2 |
6.6 |
5.1 |
4.7 |
2.2 |
1.9 |
|
India |
29.2 |
28.5 |
7.2 |
8.8 |
6.0 |
6.1 |
3.0 |
3.2 |
|
Iraq |
33.9 |
29.0 |
9.9 |
8.7 |
8.3 |
7.2 |
3.6 |
3.4 |
|
China |
28.4 |
27.3 |
6.4 |
8.3 |
5.3 |
6.1 |
1.6 |
2.9 |
|
Pakistan |
33.6 |
28.0 |
9.6 |
8.4 |
6.9 |
6.2 |
3.8 |
3.2 |
|
Palestine |
30.4 |
32.4 |
6.4 |
7.0 |
6.3 |
6.8 |
1.6 |
2.9 |
|
Sri Lanka |
33.1 |
31.4 |
9.1 |
11.8 |
8.1 |
9.3 |
4.7 |
6.0 |
|
Thailand |
28.5 |
26.0 |
6.5 |
7.4 |
5.3 |
5.0 |
2.2 |
2.3 |
|
Vietnam |
30.3 |
29.1 |
6.3 |
9.4 |
6.3 |
5.8 |
2.7 |
2.6 |
|
Americas |
30.0 |
27.8 |
7.4 |
8.6 |
7.0 |
6.5 |
3.4 |
3.5 |
|
Brazil |
31.5 |
29.3 |
7.5 |
9.5 |
7.0 |
7.4 |
3.7 |
4.1 |
|
Chile |
29.6 |
27.1 |
7.6 |
8.2 |
7.2 |
7.3 |
3.3 |
3.6 |
|
Colombia |
- |
- |
- |
- |
- |
3.4 |
- |
2.3 |
|
Africa |
30.4 |
29.1 |
6.4 |
8.5 |
6.7 |
7.2 |
2.9 |
4.0 |
|
Eritrea |
30.3 |
26.9 |
6.3 |
8.1 |
6.2 |
6.8 |
1.5 |
2.6 |
|
Ethiopia |
30.3 |
31.9 |
6.3 |
6.6 |
6.2 |
6.0 |
1.7 |
3.0 |
|
Gambia |
30.3 |
27.8 |
6.3 |
9.0 |
7.9 |
9.1 |
3.1 |
5.7 |
|
Ghana |
30.3 |
29.0 |
6.3 |
10.2 |
7.1 |
9.3 |
3.7 |
6.0 |
|
Morocco |
30.9 |
29.0 |
6.9 |
9.3 |
7.7 |
7.5 |
4.1 |
4.1 |
|
Nigeria |
30.3 |
31.9 |
6.3 |
6.6 |
5.5 |
5.6 |
2.2 |
2.4 |
|
Somalia |
- |
- |
- |
- |
6.4 |
5.9 |
1.6 |
3.5 |
Sources and notes for the tables
Source material for the data, an overview of data quality and averaging methods are presented below. Further details on table contents are also provided. Statistics on general data and means of payment in Norway have been compiled by Norges Bank, while other statistical data have been compiled by Statistics Norway.
Sources:
- General data: Statistics Norway and Norges Bank
- Information on means of payment in Norway: Statistics Norway (SSB) and Norges Bank
- Information on giros, cheques, payment cards, ATMs, payment terminals and mobile payment: Finance Norway; DNB Bank ASA; Nordea Bank ABP, Norway Branch; Handelsbanken; Danske Bank; Cultura Sparebank, Skandinaviska Enskilda Banken AB (publ) Oslo branch, Norwegian department of a foreign firm; Eika Gruppen AS; Nets Branch Norway; Mastercard Payment Services Infrastructure (Norway); Tietoevry Norge AS; SDC A/S; EVRY Card Services AS; Komplett Bank AS; SEB Kort Bank AB Oslo branch, Norwegian department of a foreign firm; Ikano Bank AB (publ) Norway Branch; Elavon Financial Services DAC, Norway Branch; American Express S.A. (Norway Branch); Swedbank Norge; Santander Consumer Bank AS; Entercard Norge, branch of Entercard Group AB; Kortaccept Nordic AB NUF; Bambora Norge NUF; Euronet 360 Finance Limited; Vipps AS; Circle K Norge AS; Wex Europe Services AS; ST1 Norge AS; Blue Energy AS; YX Norge AS
- Information on electronic invoices has been collected from Mastercard Payment Services Infrastructure (Norway) AS and the Norwegian Agency for Public and Financial Management (DFØ).
- Information on cross-border payments other than by card has been collected from the Register of Crossborder Currency Transactions and Currency Exchange (The Norwegian Tax Administration).
- Information on fees for fund transfers to selected countries and regions and retail customer service fees from 2009 have been collected from Finansportalen. Earlier fees for retail customer services, corporate customer services and cross-border payments have been collected from the banks’ price lists and forms.
Notes on the tables:
Table 5 – Number of agreements
- The number of agreements for sending or receiving eFaktura refers to agreements relating to sending electronic invoices directly to and from an online bank. The number of agreements for sending e-invoices in EHF format pertains to enterprises registered as recipients of e-invoices in EHF format sent via the access point in the PEPPOL infrastructure. PEPPOL is a Norwegian version of an international format, PEPPOL BIS.
Table 6 – Number of cards and number of functions in cards
- The table shows the number of cards issued in Norway by banks and finance companies. Figures as from 2013 include e-money cards (Visa and Mastercard, prepaid cards) and accounts in card systems that are not linked to physical cards.
- Physically the cards are broken down by technology type. They may come with contactless technology and have a chip and a magnetic stripe, only have a chip and a magnetic stripe or only a magnetic stripe or they can be virtual, such as travel accounts in card systems not linked to physical cards.
- The functions in the card are broken down by settlement method, ie whether card use entails immediate debit of a bank account (debit function), whether the user receives an invoice that is paid in full a few weeks later (billing function), whether the use has a credit that is repaid in instalments (credit function) or whether the user pays with a prepaid card (e-money).
- As from 2018, the reporting on the number of payment cards was changed. The new figures cannot be directly compared with previous figures. Figures up to 2017 were partly based on estimates, while the figures from 2018 are based on directly reported card data.
Table 7 – Cash infrastructure
- The table shows the number of locations where the public can deposit and withdraw cash.
- The number of locations with “in-store cash service” is obtained from the following webpage: Kontanttjenester i butikk – BankAxept [Norwegian only]
Tables 8 and 12 – Use of payment services
- Table 12 includes cash-back in the amount for electronic goods purchases for the years 2006–2011 in previous publications, but not publications as from and including 2013 (with figures up to and including 2012).
Tables 9 and 13 – Giro payments
- Instant payments include both instant payments made on mobile payment platforms, such as Vipps, and other instant payments, for example instant payments using online or mobile banking platforms.
- Miscellaneous other electronic credit transfers include payments made on mobile payment platforms that are not instant payments, and local payment solutions used for recurring transactions, loan repayment etc.
Tables 10a and 14a – Payment cards. Card use
- The tables show all use of payment cards issued in Norway and included in Table 6.
- The figures for “POS cash withdrawals” include cash-back at EFTPOS terminals that accept BankAxept cards, while the figures for “other cash withdrawals” refer to “in-store cash service”, and over-the-counter and ATM withdrawals.
- “Other contactless payments” include payments at terminals using Vipps and other mobile payment platforms such as Apple Pay and Google Pay, and payments using watches and wristbands such as Fitbit Pay and Garmin Pay.
- “Online payments” include both payments with physical cards and payments via different mobile payment platforms such as Vipps, Apple Pay and Google Pay. From the publication of Retail payment services 2020, online shopping payments using the Vipps mobile payment platform have been included in the figures for online shopping. In earlier reports, such payments have been categorised under mobile payments.
- “Other electronic payments” include payments made using mobile payment platforms that are not accounted for as online payments nor as payments at EFTPOS-terminals. Examples are P2P- and P2B-payments made through Vipps. The numbers also include payments from accounts without the use of physical cards, such as payments from travel accounts in offline card systems.
- The figures for prepayments/e-money include registered use of NAV (Norwegian Labour and Welfare Administration) cash cards, universal gift cards in Norway and prepaid Visa and Mastercard issued by banks in Norway. The figures for 2012 only include use of prepaid cards in EFTPOS terminals that accept BankAxept cards. The figures as from 2013 include all cards in Norway and abroad.
- The figures for use of Norwegian cards abroad and foreign cards in Norway primarily refer to cards issued by international card companies, including Visa, Eurocard, Mastercard, Diners, American Express, JCB cards (Japan Credit Bureau) and China Union Pay.
- The use of BankAxept cards in Norwegian-owned EFTPOS terminals abroad has been included in the figures for use of Norwegian cards abroad.
Tables 10b and 14b – Payment cards. Use of payment terminals
- The tables refer to use of Norwegian and foreign payment cards at all Norwegian-owned EFTPOS terminals installed in Norway and abroad. Note that this applies even if payments using Norwegian cards at terminals abroad are included as use of Norwegian cards abroad in Tables 10a and 14a.
- In order to show how the terminals are used, use of cards issued by retail chains are included, even though such cards are not defined as payment cards and included in Tables 10a and 14a.
- The tables also show the online use of Norwegian and foreign cards at Norwegian websites. Figures include both payments made with physical cards and payments using different mobile payment platforms such as Vipps, Apple Pay and Google Pay. From the publication date of last year’s report, online shopping payments using the Vipps mobile payment platform have been included in the figures for online shopping. In earlier reports, such payments have been categorised under mobile payments.
- “Other payments at Norwegian terminals” include payments made using mobile payment platforms that are not accounted for as online payments nor as payments at EFTPOS-terminals. Examples are P2P- and P2B-payments made through Vipps. In earlier publications these payments have been omitted. Figures from 2017 and forward have been revised up. The numbers also include payments from accounts without the use of physical cards, such as payments from travel accounts in offline card systems.
- The figures for cash withdrawals from ATMs using e-money refers to use of NAV cash cards. The figures for payments using e-money include registered use of universal gift cards in Norway and prepaid Visa and Mastercard cards issued by banks in Norway and abroad. The figures for 2012 only include prepaid cards used at EFTPOS terminals that accept BankAxept cards. The figures as from 2013 include all use of such cards in Norway.
Tables 10c and 14c – Use of cards online
- Figures include both payments with physical cards and payments using different mobile payment platforms such as Vipps, Apple Pay and Google Pay. From the publication of Retail payment services 2020, online shopping payments using the Vipps mobile payment platform have been included in the figures for online shopping. In earlier reports, such payments have been categorised under mobile payments.
Table 16 – Sending electronic invoices
- The table shows the number of sent eFaktura, ie banks’ electronic invoice solution, and electronic invoices in EHF format, which is the government’s format for electronic invoicing.
- Figures for B2B eFaktura e-invoices are from 2019 included in the figures for invoices in EHF format.
Tables 17 to 20 – Prices for domestic payment transactions, cash withdrawals and payment receipt, and prices for cross-border transactions
- Information on prices for retail customer services (Table 17) is from 78 banks with prices collected from Finansportalen. These banks accounted for 89 percent of the market measured by deposits and current accounts. There are two average prices for each service, one for customers belonging to a loyalty scheme and one for those who do not. Average prices are calculated by weighting the price in each bank based on the bank’s share of deposits in current accounts. In cases where a bank has several loyalty schemes, the median price is used to calculate the average price for all banks of the services in the loyalty scheme.
- The prices for corporate services are collected from online price lists and information on prices for cross-border payments are reported in a form. Prices are from price lists and forms from 21 banks that had a market share of 80 percent in terms of deposits in transaction accounts. The prices only include customers that do not belong to loyalty schemes or receive other types of discount. Average prices are calculated by compiling average prices for commercial and savings banks by weighting the price at each bank based its share of deposits in transaction accounts. The average prices for all banks are then calculated by weighting the prices for banking groups by market share measured by the number of transactions during the statistical year.
- Annual fee for BankAxept cards (combined with international debit card) applies to “ordinary” cards. These cards can be used for payments at physical outlets and for online purchases. There is no card holder identification on these cards.
- The price of postal giros is for each form posted. Postage for each form posted comes in addition.
- The price of direct debit (Avtalegiro) receipt refers to receipt without notification.
- From 2017, Finansportalen has had information on prices for several credit cards for non-loyalty scheme customers, and not only for single credit cards, as before. From 2017, the median of prices at each bank for the different credit cards has therefore been used to calculate average prices for non-loyalty scheme customers.
- Cross-border fees refer to fixed sum transfers in the EEA with or without BIC and IBAN information and excluding exchange rate cost. Fees do not include additional costs for cash payments, third country currency, confirmations or costs that the payer must cover for the payee.
Tables 21 and 22 – Prices for remittances to selected countries/regions
- Prices are based on information from 13 service providers. Six of them are banks and seven are non-bank financial institutions, payment institutions or foreign service providers. Service providers that have provided information, represent a sample of a larger group of Norwegian and international service providers offering remittance services in Norway.
- Average prices are calculated by first calculating an arithmetic average for each of the reporting institutions that charge more than one price per service/service variable. Then an arithmetic average is calculated of the prices from all providers of the service/service variable.
- Banks’ prices refer to prices for SWIFT transfers, while the prices reported by the other institutions refer to transfers over proprietary networks.
Standard symbols in the tables:
- Incomplete information or zero
0 Less than 0.05 of the unit used