Costs in the Norwegian payment system 2020
1 About the survey
Background
Pursuant to the Central Bank Act, Norges Bank is responsible for promoting an efficient and secure payment system where payments can be carried out swiftly, securely, at low cost and tailored to users’ needs.
This report documents the social costs in the payment system in Norway. The data are for 2020. The pandemic affected both the economy and consumers’ payment habits that year. However, there are no signs that structural changes in payment patterns, such as the fall in the use of cash, will be reversed. The cost estimates would have been different in the years prior to the pandemic but are representative of subsequent years.
Norges Bank has conducted payment cost surveys on a regular basis since 1988. The previous survey was conducted with data for 2013 (Norges Bank (2014)). The surveys provide a basis to examine cost developments over time and compare with costs in other countries’ payment systems.
Social costs – not social benefits
The social cost of a payment is the total use of real resources, such as labour and capital, by the participants involved in the payment. Transfers between participants, such as remuneration, are not included in social costs but are included in the private costs of banks and other participants. In this analysis, we will present estimates for both social and private costs. Total social costs are the costs for Norway as a nation of producing and using payment services.
We do not assess the social benefit of payments or payment instruments, ie the extent to which they contribute to satisfying the needs of users and society. Comprehensive assessments of efficiency consider both benefits and costs. Although some payment instruments cost more, these instruments may provide social benefits that justify their costs. Norges Bank’s assessments of policy issues are presented in other publications, such as the annual Financial Infrastructure Report. This paper is part of the factual basis for Norges Bank’s policy assessments. Another important purpose is to contribute to an informed public debate.
Means of payment and payment instruments
There are two main types of means of payment: cash (central bank money) and bank deposits (deposit money), which are accessed using payment instruments. Payment cards and giros (bank transfers) are examples of payment instruments that give users access to deposit money. Cash can be used without recourse to other instruments and is therefore both a means of payment and a payment instrument.
This paper contains estimates of costs associated with the use of each of these payment instruments. Total social costs and the contribution of different participants to social costs are also estimated.
Since the survey is limited to the use of payment instruments, it does not include costs related to the issuance of bank deposits as a means of payment, as bank deposits are primarily created by banks when they issue loans. Since cash is both a means of payment and a payment instrument, costs related to issuing cash are included.
Uncertainty associated with the results
In surveys like this one, a number of methodological choices in different areas must usually be made, and the right choices are not always obvious. Different assumptions produce different results. In this paper, we have explained why we made our most important choices. We emphasise that there is uncertainty associated with the results. The results for cash-related costs are particularly uncertain, since a large part of the use of cash must be estimated, and different methods produce different results. This is explained in more detail below.
Participants and payment situations
In the survey, there are six main participants that are parties to payments or provide services to these parties: households, businesses, the public sector, banks, subcontractors and Norges Bank (Chart 1).
Chart 1. Participants in the Norwegian payment system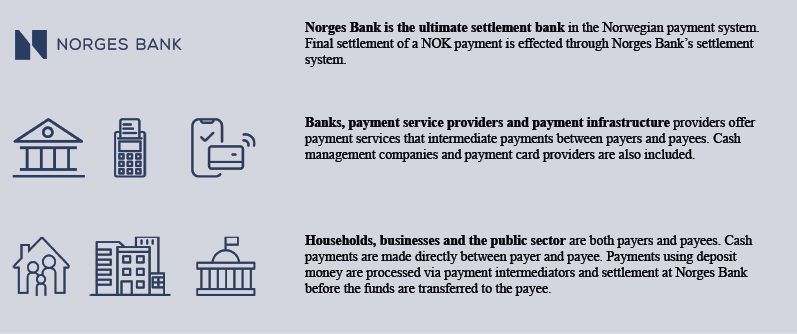
A majority of payments are made at physical outlets using a payment card (see Section 3). Mobile payments and cash payments are also often used in such payment situations.
An increasing share of goods and services are purchased online. Online payments are also predominantly made using a card, but a substantial share of these purchases are made as mobile payments (with a card as the underlying payment instrument) or are invoiced (and then paid using a mobile banking app or an online banking platform).1
Bill payments and other giro payments are a third group of payments, mainly comprising bill payments by households, businesses or the public sector and mass payments of wages or benefits by businesses and the public sector. Online or mobile banking solutions are mainly used for these payments, many of which are also automated to some degree through solutions such as eFaktura e-invoices and AvtaleGiro and Autogiro direct debits.
The use of resources by different participants
The costs incurred by participants are composed of different elements. For households, resource use mainly comprises time consumption for the actual payment. At a physical outlet, it may be the time between when an amount is presented at the payment terminal and when the payment is approved. Another example is the time required to withdraw cash from an ATM. Time consumption is a social cost because the time could have been spent on work or some other activity measured in terms of labour cost.
Resource use by businesses and the public sector comprises labour costs for employees and equipment costs, such as cash registers, safes and payment terminals (for points of sale). Many of the costs for businesses and the public sector are IT-related.
Resource use by payment service providers, mainly banks, comprises labour costs for the employees who process payments, costs for equipment related to payments, such as ATMs, and costs for operating and developing payment-related IT systems. Another group of costs is related to fraud. These include both direct losses and costs associated with preventing fraud.
Box 1 Which payments are included?
The survey focuses on domestic payments made by households, businesses and the public sector. The analysis does not cover bank-to-bank payments, Norwegians’ use of payment services abroad, foreigners’ use of payment services in Norway or cross-border online purchases. Payments using cheques, fuel cards, e-money and crypto-assets are also excluded. The volume of such payments in Norway is likely relatively limited.
The participants, payment situations and instruments are described in more detail above. An important change in relation to the 2013 survey is the addition of a number of elements of giro payments. The new elements are the costs to businesses and their subcontractors of issuing invoices and processing ingoing payments. In 2013, only businesses’ outgoing payments were included.
In its cost survey guide, the World Bank (see World Bank Group (2016))1 recommends that costs for printing invoices should be excluded from production costs. Nevertheless, we have chosen to include such costs because, in our view, the costs for giro payments will then be more comparable with the costs for payments at physical outlets and via online shopping. For example, we have included costs for cash register systems at physical outlets and online retailers’ IT costs (such as checkout solutions). Here, some of these costs will be for computing the total amount payable by the customer. It is thus our view that inclusion of corresponding costs for giro payments is appropriate. The same assessment was made by Danmarks Nationalbank in its 2016 cost survey, where costs for accounting systems and for printing and posting invoices are included.2
We have also revised the methodology for estimating cash-related costs. In the previous survey, we reduced the costs for cash withdrawals by the portion of withdrawals assumed to be related to storing value and not to cash payments. This share was estimated based on the percentage of the value of withdrawals accounted for by the value of cash payments (66 percent in 2013). Such a reduction was not made this time. All cash infrastructure costs (deposits, withdrawals and other cash services) are now included in cash-related costs. With this format revision, costs for the various payment instruments will be as comparable as possible, as some of the costs for cards and giro payments are related to value storage purposes (such as online banking services for investment fund accounts etc). Since the data do not enable us to distinguish between payments and value storage for all instruments, we have chosen not to do so for any instruments.
This implies that all costs for converting between bank deposits and cash have been allocated to cash. Alternatively, costs associated with depositing cash into a bank account could be seen as a cost of obtaining bank deposits. However, in line with previous surveys for Norway and surveys in other countries, we have chosen to allocate such costs to cash. Costs for withdrawing and depositing cash are therefore considered as a necessary cost in the execution of cash payments, but not in the execution of payments using bank deposits.
Scope of the survey and changes from the previous survey
The survey covers most types of domestic payments in Norway. Box 1 explains the types of payments included. Some changes have also been made in scope and methodology in relation to the previous survey, which used data for 2013. The purpose is to obtain the best possible estimate of social costs and highest degree of comparability between the different payment instruments. Information on costs in 2020 has in many cases also been presented in the same format as in the 2013 survey. Costs in this survey were recorded in the year in which they accrued (2020).
Data and sources
The estimates in the analysis are based on data from a number of sources, the most important of which are listed here. Individual sector data and estimates, including some key methodological decisions, are described in more detail in the appendices.
Sub-surveys of resource use were carried out for banks, businesses and the public sector. Based on data on resource use and the number of transactions, unit costs were estimated for the payment instruments included in the survey. The unit costs from the sub-surveys were aggregated up to the sum of social costs for the whole country using the totals from the payment statistics.
In the sub-survey for banks, a sample of banks and card acquirers reported their costs, which were allocated within each main payment area (see Appendix 1).
As mentioned, time consumption is an important part of resource use when payments are made. In processing survey data, we have established the time spent on various payment transactions (see Appendix 2). A sub-survey was conducted for the time spent on payment transactions at physical outlets and withdrawing cash from ATMs. The study was conducted by Ipsos on behalf of Norges Bank. Internal time consumption surveys have been conducted to measure time consumption for online purchases, bill payment using online and mobile banking solutions and person-to-person (P2P) payments.
A sample of businesses have responded to a questionnaire about the use of resources to receive and send payments (see Appendix 3).
Information about Norges Bank’s costs is taken from the central bank’s financial statements. This includes costs for banknote and coin production, operation of Norges Bank’s settlement system and labour costs related to overseeing cash payment and electronic payment systems.
A survey of subcontractors’ resource use was not conducted.2 Subcontractors include cash management companies, card companies, payment centres, data centres and suppliers of cash register and accounting systems. Subcontractors receive fees from the other survey participants for services rendered. Subcontractors’ use of resources is set equal to these fees, less a 4 percent profit margin.
Information on the number of payments has been obtained from several sources. The total number of electronic payments and transactions is taken from Norges Bank’s annual payment statistics (see Norges Bank (2021)). Norges Bank’s semi-annual survey on household payment habits and the business survey formed the basis for estimating the total number of cash payments (see Box 2).
The source for the charts and tables in this paper is Norges Bank unless otherwise specified.
2 Social costs in 2020
The social costs of payments in Norway in 2020 are estimated at NOK 24 billion, most of which was related to card and giro payments (Chart 2).
Chart 2 Social costs per payment type. 2020. In billions of NOK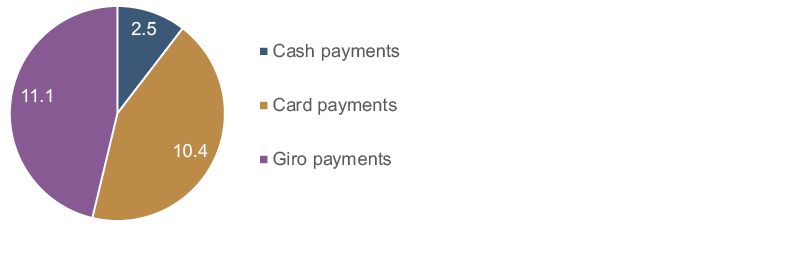
Social costs accounted for 0.79 percent of mainland GDP. In the 2013 cost survey, social costs were estimated to be 0.60 percent of mainland GDP (Chart 3).3 We have also estimated costs in 2020 using the same format/scope as for the 2013 survey (see Box 1 for information on the main differences between the two surveys). Using the same format as in 2013, costs in 2020 amounted to 0.56 percent of mainland GDP. Total costs in real terms have thus declined somewhat.
Chart 3 Total social costs. As a percentage of mainland GDP. 2013 and 2020
Of the instruments in the survey, giro services accounted for the largest costs. Giro costs have more than doubled since the previous survey as the survey was expanded to include more elements of giro payments than in 2013 (see Box 1). If giro costs are estimated based on the 2013 format, the costs of these payments are shown to have fallen between 2013 and 2020.
Card payments accounted for somewhat less than half of total costs. The format for estimating the social costs of card payments is chiefly the same as in 2013. Card payment costs increased between 2013 and 2020, but account for a smaller share of total costs than in 2013.
As mentioned in Box 1, the methodology for estimating cash-related costs has also been revised. Regardless of the methodology applied, there have been fewer cash payments and more limited use of the cash infrastructure since the previous survey. Cash-related costs have therefore fallen, both in absolute terms and as a share of total costs.
3 In Norges Bank (2014), this percentage was reported to be 0.63. Since mainland GDP for that year was subsequently revised, the percentage was revised accordingly.
3 Number of payments
In 2020, 3.2 billion payments were made, 25 percent more than in 2013 (Table 1).
There has been a shift away from cash towards electronic payments. Both giro payments and card payments have increased by 45 percent since 2013. Growth in giro payments is largely in the form of mobile instant payments4, while growth in card payments has been particularly strong for international cards. This is primarily due to strong growth in online purchases.
Table 1 Number of payments and use of cash services.5 2013 and 2020. In millions of payments and percent
|
|
Number of payments/transactions |
|
|
|
2013 |
2020 |
Change 2013–2020 |
|
|
In millions |
In millions |
Percent |
|
|
Total cash |
465.9 |
171.3 |
-63 % |
|
Cash services |
202.4 |
39.1 |
-81 % |
|
Cash payments |
263.5 |
132.2 |
-50 % |
|
Card payments |
1 497.6 |
2 172.4 |
45 % |
|
BankAxept |
1 310.1 |
1 592.1 |
22 % |
|
International cards |
187.5 |
580.3 |
209 % |
|
Giro payments |
615.6 |
891.4 |
45 % |
|
Total Norway |
2 579.1 |
3 235.1 |
25 % |
The vast majority of payments (2 666 million) are for household purchases of goods and services (Chart 4), most of which were made using a card. Business-to-business purchases of goods and services accounted for 149 million payments, and 220 million payments were P2P (many of which are payments initiated in the Vipps mobile payment app). There were far fewer payments to and from the public sector. These are typically large-value payments.
Chart 4 Payments between sectors in Norway. 2020. In millions of payments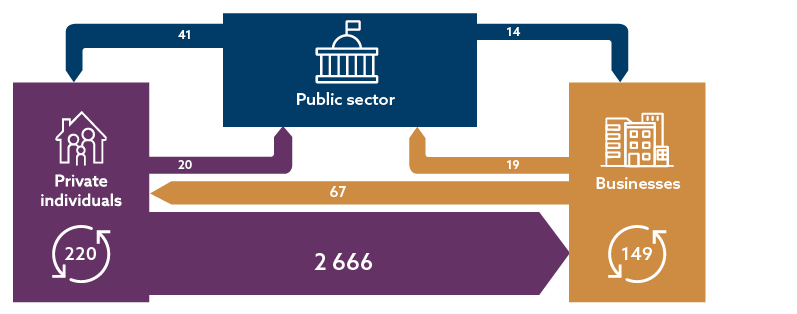
BOX 2 the Use of cash
There are no reliable data on the use of cash, but there are various methods for estimating it. The different methods provide different estimates of the use of cash and thus result in different estimates of cash-related costs. The estimates of cash-related costs are therefore uncertain. For a more detailed review of different approaches, see Gresvik and Haare (2009) and Schmiedel et al (2012).
In household surveys conducted in spring and autumn 2020, an average of 3.6 percent responded that they used cash for their most recent payment at a physical outlet. The results of similar surveys in 2007 and 2013 were 24 and 14 percent, respectively. The surveys show a markedly declining trend in the use of cash over time (Chart 5).1
Chart 5 The use of cash at points of sale and for P2P payments. Results of semi-annual household surveys. 2017-2022. Percent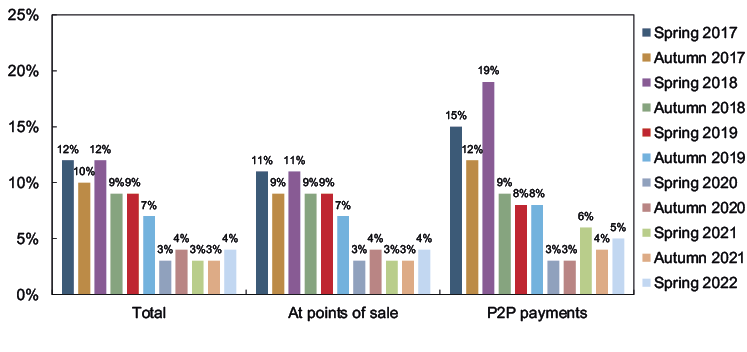
The business survey showed that cash payments accounted for 8.0 percent of the total number of payments. This is based on reporting from 45 businesses, a subset of the businesses responding to the questionnaire (see Appendix 3). About half of these businesses were able to observe the number of cash sales, while the other half estimated the number of cash sales based on the value of cash turnover and assumptions regarding the average value of a cash sale.
In the surveys in 2007 and 2013, the results of the household surveys were used as the basis for the estimate of the number of cash payments. In this survey, the estimate is based on the average share of cash payments from both the household survey and business surveys. This results in a 5.8 percent share for cash payments at physical outlets. The total number of cash payments is estimated at 132.2 million.2
1 The surveys were conducted by an external market research company. At least 2 000 persons over the age of 15 were included in each of the surveys, which were conducted via telephone interviews and internet-based questionnaires. The survey samples are representative of the population. A sample is representative when the composition of the sample is virtually identical to the composition of the population as a whole in terms of key variables such as sex, age and place of residence. This allows the results of a survey to be generalised to the entire population. At the same time, the limited size of the sample will make the results somewhat uncertain, particularly for subgroups.
2 In 2020, there were a total of 1 ٩٥١.٣ million payments at point-of-sale (POS) terminals in Norway. This covers both payments made using physical cards and payments made using mobile wallets. A ٥.٨ percent share for cash payments and ١ ٩٥١.٣ million non-cash payments result in an estimated ١٢٠.١ million cash payments at physical outlets. Payments made at physical outlets not using terminals with mobile solutions such as Vipps and the supermarket chain app Coopay are not included in the estimation basis. The number of payments at physical outlets (and the number of cash payments) is therefore probably somewhat too low. The number of Coopay transactions was about ١٢ million in ٢٠٢٠. The estimated number of payments at physical outlets (٢٠٧١.٤ million (١ ٩٥١.٣ + ١٢٠.١)) is the basis for estimating the number of P٢P payments. In ٢٠٢٠, such payments accounted for an average of ١٦.٥ percent of the sum of payments at points of sale and P٢P payments. According to the surveys, ٣ percent of person-to-person payments were made in cash. This amounted to ١٢.١ million payments. In total, we have estimated that in ٢٠٢٠, ١٣٢.٢ million payments were made in cash.
Box 3 PAYMENTS USING A giro TRANSFER
In 2020, 891.4 million giro payments were made. Giro payments are transfers between bank accounts that do not originate from a card payment. Examples of giro payments include bill payments, person-to-person (P2P) transfers (eg payments using the Vipps payment app) or mass payments of salaries, benefits or pensions. This survey has given us more detailed knowledge about the origins of giro payments.
Table 2 Giro payments by origin of payment. 2020. In millions of payments
|
Giro transfers |
891.4 |
|
Bill payments (businesses) |
129.9 |
|
Paper invoices (B2B) |
46.3* |
|
EHF invoices |
66.4** |
|
Edifact |
13.7 |
|
Autogiro (direct debit) |
3.5 |
|
Company terminal giro systems |
22.7 |
|
Bill payments (households) |
336.0 |
|
Paper invoices (B2C) |
92.0 |
|
eFaktura (e-invoice) |
130.0*** |
|
AvtaleGiro (direct debit) |
114.0 |
|
P2P |
154.0 |
|
Total |
642.6 |
|
Remainder |
248.8 |
* Includes 0.6 million paper invoices paid by the public sector.
** Includes 5.7 million EHF payments by the public sector.
***The amount has been corrected for the direct debit and e-invoice combination product. The amount represents eFaktura invoices without direct debit and is estimated on the basis of information from the businesses participating in the survey. In Norges Bank’s payment statistics, the number of eFaktura e-invoices for 2020 is 163.9 million.
Sources: Norges Bank, Norges Bank (2021), Mastercard Payment Services Norway, the Norwegian Government Agency for Financial Management (DFØ), Asker municipality, Bærum municipality and the city of Oslo.
Of the 891.4 million giro payments, 129.9 million are businesses’ bill payments. Of these, about 46.3 million payments are estimated to have come from a paper-based invoice (invoice sent by e-mail or on paper in the post), 80.1 million from an electronic invoice (EHF and Edifact) and 3.5 million are Autogiro direct debits.
In 2020, households paid 336 million bills, of which NOK 244 million payments of bills sent electronically (eFaktura e-invoice and AvtaleGiro direct debit) and 92 million were paper-based. The number for paper-based giros is an estimate by Mastercard based on payments cleared in NICS.
A total of 154 million payments are P2P payments, for example using the Vipps app. Of the remaining 248.7 million payments, just over 49.5 million are payments from the public sector (many of these payments will be transfers to private individuals such as wages, benefits, pensions, etc), 88.4 million payments were made by businesses and 110.9 million payments by households.
4 These are payments from a retail customer’s bank account to another retail customer’s bank account over a separate payment infrastructure. Once the payer has initiated the payment, the funds are available in the payee’s account in seconds.
5 The estimate of the number of cash payments is uncertain (see Box 2).
4 Total social unit costs
The average payment has become more cost-efficient. The total social unit cost in 2020 was NOK 7.5 (Chart 6), higher than in the 2013 survey. However, the increase reflects an expansion of the scope of the survey. With the same format as in 2013, the total unit cost in 2020 would have been NOK 5.3, which is considerably lower than in 2013.
Chart 6 Social unit costs. 2013 and 2020. In 2020 NOK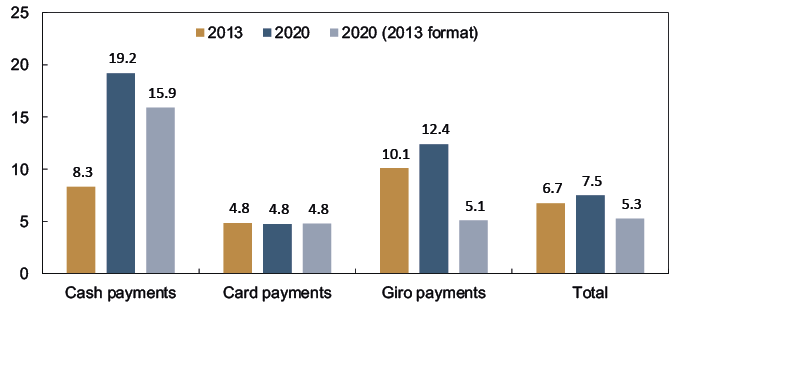
Unit costs for the different payment instruments differ considerably. There can be many reasons for this:
- Differences in cost-efficiency can result in cost differences.
- The number of payments affects unit costs. There are substantial fixed costs. For all payment methods, infrastructure costs are typically independent of the number of payments.
- There are different areas of use for the different payment instruments. This means that both resource intensity and the infrastructure will be different. To make a fully automated bill payment from an online banking platform requires a completely different type of infrastructure and different level of resource intensity from the payer and payee than paying cash at a physical outlet. The infrastructure required to pay with a card at a physical outlet is different from the infrastructure required to make a card payment for an online purchase.
- Payments can vary in terms of benefit. In some cases, this also affects costs. For some types of card payments, users earn a bonus on purchases. The cost of this bonus will be recorded as a payment cost, while the benefit for the payer will not be included. Other examples include the benefit of the immediate transfer of funds in an instant payment and the benefit of holding cash.
Cash is primarily used for payments at physical outlets and for P2P payments. The average unit cost of cash payments is estimated at NOK 19.2. This includes both the costs of the payment operation itself and costs associated with the cash infrastructure. More than half of the costs of cash payments are related to the costs of the cash infrastructure.6 The cost per cash payment has increased markedly since 2013. There are substantial fixed costs associated with cash payments and the cash infrastructure, and in view of the considerable decline in the use of cash since 2013, it is to be expected that the cost per deposit and withdrawal would rise.
Cash-related costs totalled NOK 2.5 billion in 2020 (Table 3). Businesses accounted for the largest costs. Their cash-related costs (NOK 1.1 billion) comprised the use of labour, both time spent accepting the actual payment at the cash register and other time consumption for cash management. In addition, costs were incurred related to the purchase and depreciation of cash registers.
Banks and subcontractors had a total of NOK 1.2 billion in cash-related costs. This largely reflected the costs of operating the cash infrastructure, such as costs related to the operation of cash machines, costs for over-the-counter cash withdrawals and deposits and costs for cash services provided by cash management companies.
About half of households’ costs related to cash payments (NOK 197 million) were related to the time spent on the actual payment. In a survey of time consumption, a cash payment was found to take an average of 15 seconds. The remaining costs were associated with the time spent using the cash infrastructure for, for example, cash withdrawals and deposits at cash machines, over the counter at banks or at points of sale.
Norges Bank’s costs amounted to NOK 119 million. This comprised labour costs internally at Norges Bank related to cash management (receiving and supplying notes and coins) and cash operations’ share of Norges Bank’s joint costs, such as rent and security costs.
Table 3 Costs by payment instrument and participant. 2020. In millions of NOK and percent
|
Cash |
Cards |
Giro |
Total |
Percent |
|
|
Banks |
514 |
2 803 |
3 521 |
6 838 |
29 % |
|
Households |
197 |
1 668 |
380 |
2 246 |
9 % |
|
Businesses |
1 056 |
3 021 |
4 091 |
8 168 |
34 % |
|
Public sector |
0 |
0 |
131 |
131 |
1 % |
|
Subcontractors |
650 |
2 766 |
2 918 |
6 34 |
26 % |
|
Norges Bank |
119 |
103 |
51 |
273 |
1 % |
|
Total |
2 535 |
10 361 |
11 093 |
23 989 |
100 % |
|
Percent |
11 % |
43 % |
46 % |
100 % |
|
Card payments can be used in different payment situations. Most card payments are made at physical outlets. At the same time, online shopping is growing rapidly, and online card payments now account for one in five card payments.
There are different types of card, with different uses and characteristics. A debit card is linked to a bank account and payment is settled within a short period of time. A credit card provides the possibility of deferred payment and in practice involves a loan from card issuer to payer (card user). Cards also differ according to card network.
BankAxept is the domestic debit card system. Currently, these cards can only be used for payments at physical outlets in Norway. International cards include cards belonging to the Visa, Mastercard and American Express networks. These cards can be used for payments at physical outlets, for online purchases and cross-border payments. Most payment cards in Norway today are debit cards. They also combine functionalities and are linked to both BankAxept and one of the international card systems. Credit cards are not combination cards and are only linked to one of the international card systems.
The unit cost for card payments has remained unchanged since the previous survey and was estimated at NOK 4.8 for 2020 (Chart 6). Unit costs for all card types have fallen, but because online purchases account for a much larger share of the number of card payments than in the previous survey, total unit costs have not changed.
The total social costs of card payments amounted to NOK 10.4 billion (Table 3). Banks’ costs amounted to NOK 2.8 billion. These costs include both card acquirer7 and card issuer costs, NOK 0.9 billion and NOK 1.9 billion, respectively. Most of the costs are related to internal resource use, such as labour and IT resources.
Household card costs are estimated at NOK 1.7 billion and are estimated based on the time spent paying by card. Costs include payments at physical outlets and for online purchases. Research to assess this time use has shown that the time consumption for a card payment averaged 9 seconds at a physical outlet and 28 seconds for an online purchase.
Businesses’ resource use related to card payments was NOK 3.0 billion. The costs of receiving the actual payments accounted for by far the largest share of total resource use.
Subcontractors’ costs amounted to NOK 2.8 billion and consist of the remuneration the subcontractors receive from other survey participants less a 4 percent profit margin. For card payments, card processors, data centres, card networks, and POS terminal providers are the main subcontractors. The largest cost item here is authorisation and processing costs that card acquirers and card issuers pay to their service providers.
Giro payments are primarily bill payments. Most bill payments are made on an online banking platform, using fully or partly automated instruments such as AvtaleGiro, Autogiro (direct debit) or eFaktura (e-invoice) or by entering details manually or scanning the bill. Instant payments are also considered giro payments. These are primarily P2P payments made using the Vipps payment app.
The unit cost for giro payments was NOK 12.4 (Chart 6), higher than in 2013. However, the increase is primarily because the survey has been expanded since 2013. A larger portion, especially of businesses’ costs related to making and receiving payments, has been included (see Box 1 above and Appendix 3 for details). If the 2013 format had been applied to 2020 data, unit costs for giro payments would have been about NOK 5, ie a reduction by half since 2013, The decrease is because of lower time consumption for making payments, but can probably also be attributed to an increase in banking efficiency (see Appendix 2).
Online banking payments account for the largest share by far of electronic giro payments. The second largest category is direct debits, such as AvtaleGiro (for households) and Autogiro (for businesses). Direct debits are payments where the payee places the payment order in the payer’s account once the payer has accepted the arrangement. They are less resource-intensive for households and businesses. For banks, the use of resources per payment by direct debit and online banking payments is approximately the same. The processing of paper-based giros involves substantial manual processing and is therefore far more resource-intensive in terms of time consumption than electronic giro payments.
The total social costs of giro payments amounted to NOK 11.1 billion (Table 3). Banks, businesses and subcontractors accounted for most of these costs. Banks’ costs are largely related to internal use of resources such as labour and IT systems. Businesses’ largest costs are for internal time consumption for issuing invoices and collecting payments, as well as paying their own bills. Subcontractors’ costs relate to both processing costs for banks’ giro payments and to services for invoicing and collection on behalf of businesses.
Costs for the public sector mainly comprise internal resource use and IT system costs. Public sector payments are mainly concentrated on a few large agencies, such as the Norwegian Labour and Welfare Administration (NAV), the Norwegian Tax Administration and the Norwegian Government Agency for Financial Management (DFØ). The DFØ provides shared services to a number of government agencies such as payroll administration, accounting and travel expenses. The payment infrastructure is characterised by economies of scale, and the concentration of payments on a few agencies means that unit costs for the public sector are low. For example, private unit cost for businesses of sending payments is NOK 16.0, compared with NOK 1.1 for the public sector (see Appendix 4).
6 The unit cost of actual cash payments was NOK ٩.٢, while the unit cost of the use of the cash infrastructure was NOK ٢٩.٨.
7 The card acquirer is the merchant’s bank and processes received card payments on the merchant’s behalf. The card issuer is the bank that issued the payment card to the payer/customer.
5 Unit costs of payments at physical outlets
Payment for purchases at a physical outlet can usually be made by cash or card.8 The data in the survey did not provide a basis for calculating unit costs specifically for payments at physical outlets, but attempts have been made to estimate such costs. The same has been done for online shopping.9 For card payments at physical outlets, we have distinguished between payments made with BankAxept cards, international debit cards and international credit cards. The costs of the different payment methods differ considerably (Chart 7).
Cash payments for purchases at a physical outlet show the highest unit costs by far, at NOK 19.7.10 The cheapest payment method is by BankAxept card payments,11 with a unit cost of NOK 3.3. Payments using international cards are more expensive, especially credit card payments (NOK 10.4). Payments using international debit cards cost NOK 4.7 per payment.
Chart 7 Social unit costs at physical outlets. 2020. In NOK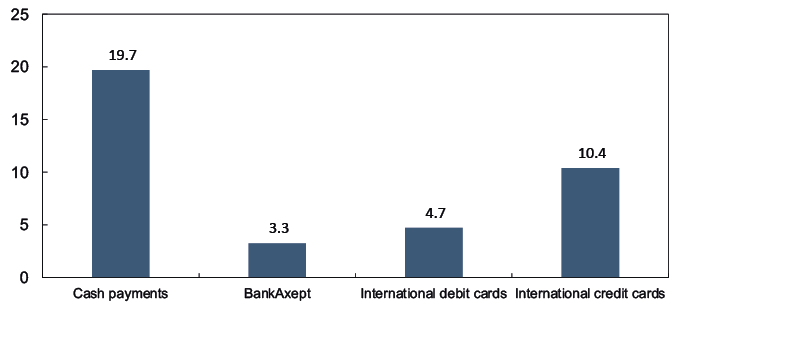
8 We also regard mobile payments as a separate payment method for purchases at physical outlets. However, for this survey, we have not calculated specific costs for mobile payments. In most cases, mobile payments are made at physical outlets with an international card as the underlying payment instrument. We assume that costs for mobile payments are not very different from those for payments with international cards.
9 The estimates are based on information from the payment statistics that the distribution between physical outlets and online shopping is 54/46 percent and that the distribution between debit cards and credit cards is 61/39 percent. This gives an estimated number of payments at physical outlets of 191 million using international debit cards and 120.3 million payments using international credit cards. With regard to online purchases, we estimate that 165.1 million payments were made using international debit cards and 103.9 million payments using international credit cards. In the calculation, we have also assumed that the use of resources by subcontractors (including card companies such as Visa and Mastercard) is lower for purchases at physical outlets than for online purchases. This is based on information from the business survey that the fee paid by the merchant when purchases are made at a physical outlet corresponds to 56 percent of the fee paid when purchases are made online.
10 The calculation is based on an estimated number of point-of-sale cash payments of 120.1 million (see Box 2 for more details on this calculation). The unit cost of point-of-sale cash payments is slightly lower than the total unit cost. This is because we have not included the costs of P2P cash payments. Nor have we included infrastructure costs for P2P payments. This accounted for 16.5 percent of the infrastructure costs (based on the share of P2P payments in the household surveys).
11 The BankAxept system is currently only used at physical outlets. Unit costs at physical outlets are therefore the same as total unit costs. A total of 1 592.1 million BankAxept payments were made in 2020.
6 Unit costs for online payments
Online card payments can currently only be made using international cards.12 The calculations show that there are also cost differences between debit cards and credit cards for online shopping (Chart 8).
Furthermore, the unit costs of online payments are well above the corresponding costs (using the same payment instrument) of payments at physical outlets. As mentioned, there may be several reasons for this. The time that households spend making a payment is more than twice as long for online purchases than for purchases at a physical outlet. For merchants, receiving online payments is more resource-intensive than payments at physical outlets. Subcontractors’ costs are significantly higher for online purchases than for purchases at physical outlets. These costs consist mainly of fees paid by banks and merchants to subcontractors such as the various card companies. The fees are higher because the average transaction amount for online purchases is significantly higher than the average transaction amount at physical outlets, and international card fees are linked to the transaction amount.
Chart 8 Social unit costs for payments at physical outlets and for online payments. 2020. In NOK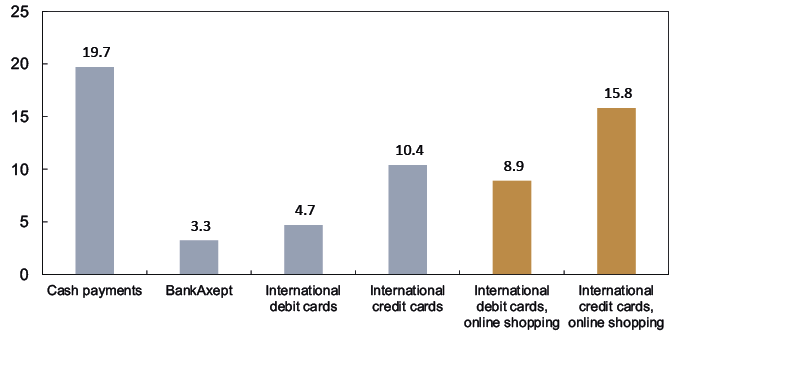
12 Payment by invoice is also a common method of payment for online purchases. We have not calculated unit costs specifically for such payments.
7 Comparisons with other countries
Payment costs in Norway appear to be low compared with other countries. A number of countries have conducted surveys of payment costs. Many of these surveys were conducted some time ago and cover a smaller part of the payment system than Norges Bank’s survey. Comparisons of results across countries are therefore sensitive to the fact that different countries’ surveys differ in methodology and scope. Some surveys only cover payments at physical outlets, such as Kosse et. al (2017) for Canada. Others include fewer sectors (for example, an EU study from 2012 does not include households’ costs, see Schmiedel et al. (2012)).
Norges Bank’s survey for 2020 is comprehensive and includes all sectors along the payment chain and all major payment methods. The survey also covers a wide range of payment costs. Costs related to invoicing are included, for example. These costs are excluded from surveys in many other countries.
Table 4 shows the main results from some selected surveys. Costs in Norway appear to be relatively low if the broader scope of the survey for Norway is taken into account (see the right-hand column on the scope of the survey). However, it is difficult to obtain fully comparable figures.
Table4 Payment cost surveys in different countries
|
Country |
Most recent observation period |
Social costs as a percentage of GDP |
Scope of survey |
|
Norway |
2020 |
0.79 (mainland GDP) |
Includes costs for the central bank, banks, businesses, the public sector and households. Includes household-to-household, household-to-business, household-to-public sector, business-to-business and business-to-public sector payments. |
|
Denmark |
2016 |
0.80 |
Includes costs for the central bank, banks, businesses and households. Includes household-to-household, household-to-business and business-to-business payments. |
|
Australia |
2013–2014 |
0.7113 |
Includes costs for the central bank, banks, enterprises and households. Includes household-to-business payments. |
|
EU |
2009 |
0.96 |
Includes costs for the central bank, banks and enterprises. Includes household-to-business payments. |
|
Sweden |
2009 |
0.68 |
Includes costs for the central bank, banks, businesses and households. Includes household-to-business payments. |
Sources: The Danish Payments Council (2018). Australia: Stewart et. al (2014). EU: Schmiedel et. al (2012). Sweden: Segendorf and Jansson (2012).
13 The figure includes household expenses. The survey estimates costs at 0.54 percent of GDP with additional household expenses equivalent to 0.17 percent of GDP.
Appendix 1. Banks’ private costs and revenues
1 About the sub-survey
A total of 14 banks and 2 non-bank card acquirers took part in the bank sub-survey. The sample of banks accounted for 83 percent of total deposits in payment accounts in Norwegian banks in 2020. Most banks also provide acquiring services for BankAxept transactions. One of the banks is also acquirer for payments made with international cards. There was a majority of large banks in the sample, which comprised savings banks and commercial banks. Both Norwegian banks and branches of foreign banks took part.
Largely the same methodology was used as in the surveys in 2007 and 2013, apart from some updates to the range of services included. Payment services were divided into three main categories: giro payments (payments debited directly from an account), card payments and cash services. A total of 45 services were specified, 20 in the giro payment category, six in the card payment category and 19 in the cash services category.
In the survey, banks were asked to distinguish between direct and indirect costs. Direct costs can be directly tied to the specific service generating the cost. These are mainly costs that vary with the number of units produced by the service, but they can also be fixed. Indirect costs are costs that cannot be directly attributed to a service but must be allocated according to an allocation key. Indirect costs were first allocated to the three main categories (cash payments, card payments and giro payments) according to use in person-years per category, then subdivided by service within each main category using one or more cost drivers. A cost driver is a factor that determines the proportion of the indirect costs that should be allocated to each service. With this methodology, use in terms of person-years will be the principal cost driver.
The reported data on costs and number of transactions provided the basis for calculating unit costs for all the different services. To find the banking sector’s total costs, the unit costs from the sample were multiplied by the number of payments in Norges Bank’s annual payment statistics. For services that are not included in the payment statistics, costs were scaled up to 100 percent in relation to the sample’s share (83 percent) of Norwegian banks’ total deposits in payment accounts in 2020.
2 Banks’ total costs
Banks’ total costs associated with payments amounted to NOK 10.2 billion in 2020 (Table A1.1). The costs of card payments and giro payments were about the same and both accounted for just over 45 percent of banks’ total costs. The cost of providing cash services accounted for just over 9 percent of total costs. One third of the costs were payments to other parties for services received, while two thirds were for banks’ internal use of resources.
Table A1.1 Banks’ costs. 2020. In millions of NOK
|
Banks |
Private costs (A+B) |
Fees paid (A) |
Internal production costs (B) |
|
Cash services |
934.3 |
420.8 |
513.5 |
|
Card payments |
4 628.6 |
1 825.8 |
2 802.8 |
|
Giro payments |
4 633.5 |
1 112.0 |
3 521.4 |
|
Total |
10 196.3 |
3 358.6 |
6 837.8 |
3 Allocation of direct and indirect costs
About half of banks’ total costs could be allocated directly to the various payment services (direct costs). The other half of the costs were joint costs allocated using different allocation keys as explained above.
For giro services, by far the largest direct cost item was expenses for the authorisation and processing of transactions (46 percent), followed by development costs (23 percent) related to, for example, online and mobile banking. Authorisation and processing also resulted in the largest costs for card payments (33 percent). The fees paid by the acquirer to the issuer, the interchange fees, accounted for 19 percent of the direct costs. For cash services, the dominant costs were fees paid to cash management companies (21 percent), costs associated with ATMs and other cash machines (16 percent) and compensation for outsourced over-the-counter services (42 percent).
The largest internal or indirect costs related to cash payments were associated with maintaining ATMs and other cash machines (13 percent) and over-the-counter activities such as deposits and withdrawals and other activities, such as exchange (21 percent). Banks’ indirect card costs were mainly associated with the maintenance of payment cards and card administration (28 percent) and consultants and promotional campaigns (32 percent). In addition, systems operation required 11 percent of the resources. A large share of the costs of giro payments were also associated with consultants and promotional campaigns (26 percent) and systems operation (15 percent).
4 Banks’ unit costs
There are large differences in banks’ costs per payment/transaction (Table A1.2). Payments are characterised by substantial fixed costs. When the number of transactions falls to low levels, unit costs can rise to very high levels. At the same time, owing to economies of scale, the cost of the individual transaction will be very low when the number of transactions is high. We see that unit costs for card payments and giro payments are just over NOK 2 and just under NOK 4, respectively. Unit costs have decreased for both cards and giros. Unit costs per cash service transaction were NOK 35, far higher than in 2013. About three million of the cash service transactions were withdrawals and deposits over the counter. Most of the remaining transactions were withdrawals and deposits of cash in ATMs and cash deposit machines.
Table A1.2 Banks’ unit costs. 2013 and 2020
|
|
2013 |
2020 |
||
|
Unit cost (in 2020 NOK) |
Private costs (in millions of NOK) |
Millions of payments/ transactions |
Unit cost (in NOK) |
|
|
Cash |
14.0 |
934.3 |
26.4 |
35.4 |
|
Card |
2.4 |
4 628.6 |
2 172.4 |
2.1 |
|
Giro |
5.5 |
4 633.5 |
1 220.8 |
3.8 |
|
Total |
4.1 |
10 196.3 |
3 419.6 |
3.0 |
Table A1.3 shows developments over a somewhat longer period. Since the survey in 2007, the unit cost (measured in 2020 NOK) has been reduced by half. The contribution to the decline comes in equal measure from cash and cards and to a lesser extent from giros. Unit costs for cash have gone up, but due to a far lower volume than in 2007, the contribution from cash to the total unit cost has decreased markedly. Unit costs for cards have gone down. In addition, the number of card transactions has increased sharply. As a result, the contribution of card payments to the total unit cost has decreased markedly.
Table A1.3 Banks’ productivity since 1988
|
Bank productivity indicators (in 2020 NOK) |
1988 |
1994 |
2001 |
2007 |
2013 |
2020 |
|
Private costs (in billions of NOK) |
8.0 |
9.3 |
8.7 |
9.8 |
9.9 |
10.2 |
|
Private costs as a share of GDP |
0.59 % |
0.61 % |
0.38 % |
0.33 % |
0.28 % |
0.30 % |
|
Private unit costs (in NOK) |
20.9 |
15.9 |
7.8 |
6.3 |
4.1 |
3.0 |
|
Number of transactions in banks (in millions) |
381 |
481 |
968 |
1 545 |
2 405 |
3 420 |
Table A1.4 provides an overview of unit costs for some of banks’ key payment services. The costs have been converted into 2020 NOK and compared with the results of the previous two banking surveys. Unit costs for electronic payment services are generally lower than unit costs for cash-related services. There has also been a further fall since the last survey for the most widely used electronic giro and card services. At the same time, the cost of cash-related services has risen markedly. Unit costs for ATM withdrawals have tripled and the cost of over-the-counter deposits and withdrawals has doubled (mainly through the Post in Store service (discontinued)). This is of course related to the decline in cash usage. Since 2013, the number of ATM withdrawals has decreased by 70 percent.
Table A1.4 Unit costs for selected payment services. 2007, 2013 and 2020. In 2020 NOK
|
Selected services |
2007 |
2013 |
2020 |
|
Online banking, personal |
2.6 |
3.4 |
2.1 |
|
Online banking, corporate |
2.6 |
2.7 |
1.5 |
|
Instant payment |
- |
- |
2.5 |
|
e-Faktura |
- |
- |
1.7 |
|
Avtalegiro |
3.3 |
3.2 |
2.4 |
|
Card payments, acquirer |
|
|
|
|
BankAxept |
2.0 |
0.5 |
0.4 |
|
International debit cards |
- |
2.1 |
1.4 |
|
International credit cards |
- |
10.2 |
3.3 |
|
Card payments, issuer |
|
|
|
|
BankAxept |
1.3 |
0.7 |
0.6 |
|
International debit cards |
- |
2.4 |
2.0 |
|
International credit cards |
- |
17.2 |
7.7 |
|
Own ATM, own customers |
9.3 |
7.7 |
25.2 |
|
Own ATM, other customers |
7.9 |
6.9 |
20.6 |
|
Other bank's ATM, own customers |
11.3 |
6.6 |
7.2 |
|
Cash deposits/withdrawals over the counter |
57.6 |
54.8 |
100.6 |
The table also shows that there are substantial differences in unit costs for different types of cards. A payment using the domestic debit card BankAxept costs banks a total of just over NOK 1 (NOK 0.4 plus NOK 0.6). A payment using an international debit card, for example from Visa or Mastercard, costs banks NOK 3.4 (NOK 1.4 plus NOK 2.0), while a payment with an international credit card costs banks about NOK 11 kroner (NOK 3.3 plus NOK 7.7).
Unit costs for all types of cards have decreased, but especially the cost of international cards, particularly credit cards. One probable reason is that there have been far more payments by card since 2013. Growth in the use of international cards has been particularly strong primarily as a result of strong growth in online shopping (where BankAxept cannot be used). The number of international card payments has quadrupled since 2013. However, around three out of four domestic card payments are still made using the BankAxept system.
It is not only the different transaction volumes that can explain the differences in costs between the different cards. In addition, there are extra costs for additional functionality and other benefits resulting from holding or using international cards.
- The differences in costs are largely due to higher processing costs and higher fees paid to the international card companies than to BankAxept. This is to be expected given that, among other things, international cards have a greater range of uses than BankAxept cards. For example, international cards can be used for online shopping and for making payments abroad. There are both development costs and ongoing costs for these functionalities that must be covered.
- Use of international cards requires the card acquirer to pay a so-called interchange fee to the card issuer to cover the issuer’s costs associated with the issued card. These fees are included in the card acquirer’s unit costs and accounts for NOK 0.4 of each debit card payment and NOK1.4 of each credit card payment.
- When credit cards are used, the card issuer incurs costs associated with the credit provided. This accounts for a large part of the unit costs.
- International cards also often provide benefits such as travel insurance and access to airport lounges (credit cards). This is also a cost covered by banks.
BOX A1.1. BREAKDOWN OF BANKS’ FEE INCOME
Statistics Norway’s statistics (ORBOF database) show that banks received total fees from customers of just over NOK 7.8 billion in 2020 (Table A1.5). Total costs amounted to NOK 10.2 billion (Table A1.1). Cost coverage for payments thus amounts to 76.7 percent.
In the statistics, the total amount is only divided into two sub-items: payment services, cards and payment services, giro and other. The information in ORBOF is not broken down by card type or agent. We have therefore further divided the fees based on some assumptions. The fees are included in the cost calculations for businesses, the public sector and households.
The fees from payment services, giro and other are broken down by business and household based on an estimated distribution using the information in Norges Bank’s payment statistics. In addition, the public sector has provided information about fees paid.
The fees from payment services, cards are broken down as follows: businesses’ fees paid for card payments (both BankAxept and international cards) are taken from the business survey. We have no information on how the rest of the fees should be distributed, so for households they were distributed by equal parts (one third each) to BankAxept, international cards and ATMs respectively.
Table A1.5 Banks’ fee income. 2020. In millions of NOK
|
|
Businesses |
Public sector |
Households |
Total |
|
Payment services, cards |
1 700 |
2 235 |
3 936 |
|
|
BankAxept |
114 |
- |
745 |
859 |
|
International cards |
1 586 |
- |
745 |
2 331 |
|
ATMs |
- |
- |
745 |
745 |
|
Payment services, giro and other |
1 496 |
19 |
2 374 |
3 889 |
|
Total |
3 196 |
19 |
4 609 |
7 825 |
Appendix 2. Households’ costs and time spent on payments
1 Total costs for households
Households’ costs associated with payments consist mainly of fees paid to banks and time spent making payments and using the cash infrastructure. The estimated fee payments are discussed in more detail in Box A1.1. Fees accounted for slightly more than two thirds (NOK 4.6 billion out of NOK 6.9 billion) of households’ costs associated with payments (Table A2.1).
Table A2.1 Households’ costs. 2020. In millions of NOK
|
Households |
Total costs |
Paid fees |
Time spent |
|
Cash |
942.6 |
745.3 |
197.3 |
|
Cash payments |
118.5 |
0.0 |
118.5 |
|
Cash services |
824.2 |
745.3 |
78.8 |
|
Card payments |
3 158.9 |
1 490.6 |
1 668.2 |
|
BankAxept |
1 727.4 |
745.3 |
982.1 |
|
International cards |
1 431.5 |
745.3 |
686.2 |
|
Giro payments |
2 753.6 |
2 373.7 |
380.0 |
|
Total |
6 855.1 |
4 609.6 |
2 245.5 |
Time consumption accounts for the remaining third of the costs. The time consumption costs are calculated by multiplying time consumption by average wage14 and the number of payments/transactions. The estimated time consumption for different payment activities is the topic of the next part of this appendix.
2 Time consumption surveys
In Norges Bank (2014), estimates of time consumption for payments were largely taken from Gresvik and Haare (2009). Since then, there have been significant changes in the way payments are made, and payment technology has evolved. We have therefore carried out new measurements of the time it takes to make a payment. The surveys cover payments at physical outlets, online payments and bill payments.
Like the other sub-surveys, the time consumption surveys were originally scheduled to be carried out in 2020, but owing to the pandemic, the surveys were postponed until 2021. Time spent making payments probably changed little between 2020 and 2021.
Time consumption survey at physical outlets and ATMs
The time consumption survey for payments at physical outlets was conducted in the period 10–28 June 2021. The survey was conducted by Ipsos on behalf of Norges Bank.15 Observations were made at a total of 17 physical outlets in Oslo, Bærum, Trondheim and Bergen. All points of sale are owned by NorgesGruppen. Of the 17 points of sale, 11 were supermarkets (different retail chains are represented), 3 were cafes and 3 convenience stores (Table A2.2). Of the 2 827 observations made, 2 341 were at supermarkets, 259 at cafes and 227 at convenience stores.
86 percent of payments were by card (64.5 percent were contactless payments, 20.4 percent were non- contactless and 1 percent included cash withdrawals, so-called cash-back), 10.3 percent were cash payments, 1.8 percent were made by mobile phone and 0.4 percent were made using a smartwatch (Table A2.2). 1.5 percent of the observations were in-store cash services (CIB), a service provided at over 1 450 of NorgesGruppen’s supermarkets that allows customers to either deposit or withdraw cash.
Table A2.2 Number of points of sale and observations
|
Number of points of sale |
Number of observations |
Cash |
Card |
Mobile |
Watch |
|
|
Supermarket |
11 |
2 341 |
259 |
1 997 |
35 |
8 |
|
Cafe |
3 |
259 |
21 |
225 |
9 |
4 |
|
Convenience store |
3 |
227 |
12 |
208 |
6 |
0 |
|
Total |
17 |
2 827 |
292 (10.3%) |
2 430 (86.0%) |
50 (1.8%) |
12 (0.4%) |
Time consumption for a cash payment averaged 14.7 seconds (Table A2.3). Contactless payments by card took an average of 7.8 seconds, compared with 14.8 seconds if the card was inserted in the card terminal. Paying by phone took an average of 8.9 seconds, while paying by watch took 7.7 seconds. When a cash withdrawal was made at the same time as a card payment (so-called cash-back), the payment took an average of 13.3 seconds. In-store cash services (CIB) took an average of 15.8 seconds.
In the survey, the measurement of time consumption starts when the cashier has finished scanning the customer’s goods and has informed the customer of the final amount. The payment has been completed when the sale has been approved (using a card) or customers have received any change (cash).
Table A2.3 Measurements of time consumption at physical outlets for different payment methods. 2021
|
Cash |
Contactless card |
Non- contactless card |
Mobile |
Watch |
Card + cash-back |
CIB |
Total |
|
|
Number |
292 |
1 824 |
577 |
50 |
12 |
29 |
43 |
2 827 |
|
Percentage |
10.3 |
64.5 |
20.4 |
1.8 |
0.4 |
1.0 |
1.5 |
100.0 |
|
Time consumption in seconds (average) |
14.7 |
7.8 |
14.8 |
8.9 |
7.7 |
13.3 |
15.8 |
10.9 |
Time consumption for a cash payment was affected to a lesser extent by the transaction amount (Chart A2.1); it is more the case that time consumption appears to have been high for some payments when the transaction amount was low and the customer probably paid with coins.
Chart A2.1 Cash payment: Transaction amount (in NOK, horizontal axis) and time consumption (in seconds, vertical axis)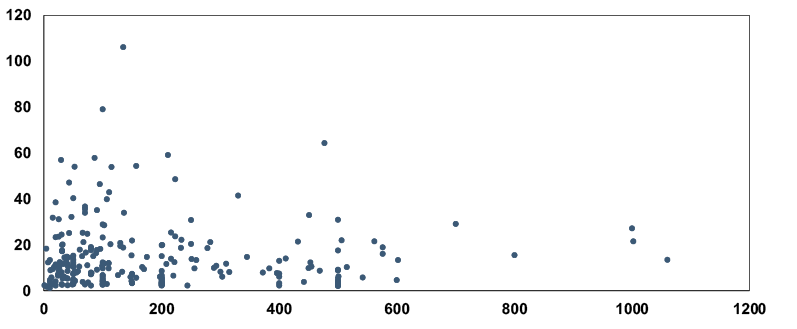
In addition to observing time consumption in stores, Ipsos made 52 observations of time consumption for cash withdrawals at ATMs. The observations were made in central Oslo. It took an average of 51.6 seconds to withdraw cash from an ATM. Measurement began when the card was inserted into the ATM and ended when the card was returned to the customer.
The time it takes to make a payment has fallen for bank cards since 2007 and 2013 because of the possibility of making contactless payments (Table A2.4). For card payments that were not contactless, cash payments or ATM withdrawals, time consumption is approximately the same in 2007, 2013 and 2021.16
Table A2.4 Time consumption for different payment instruments in 2007, 2013 and 2021. In seconds
|
Year of obs. |
Cash |
Contactless cards |
Non-contactless cards17 |
ATM withdrawals |
|
2007 |
16 |
17 |
110 (of which 50 seconds is withdrawal time and 60 seconds is travel time) |
|
|
2013 |
14 |
14 |
100 (of which 40 seconds is withdrawal time and 60 seconds is travel time) |
|
|
2021 |
15 |
8 |
15 |
52 (no travel time) |
Sources: Norges Bank, Norges Bank (2014) and Gresvik and Haare (2009)
Time consumption for online payments
The time that households spend making payments for online purchases has been measured in an internal survey conducted by Norges Bank. The results of the survey are based on relatively few observations and should therefore be interpreted with caution. Norges Bank’s surveys on household payment habits provide information about which payment methods are used for online payments and the extent to which they are used.18 The figures from the survey in spring 2021 and the results of the internal time consumption survey have been compiled together in Table A2.5. Weighted time consumption for online payments was estimated at 28.2 seconds.
Table A2.5 Share of different payment methods and time consumption for online payments. 2021. As a percentage and in seconds
|
Payment methods |
Percentage, spring 2021 |
Time consumption (in seconds) |
|
|
Card payment |
54 % |
34.7 |
|
|
Mobile phone payment |
15 % |
15.2 |
|
|
Invoice |
24 % |
20.5 |
|
|
Other |
9 % |
30.7 |
|
|
Weighted time consumption (in seconds) |
|
28.2 |
|
Survey of time consumption for bill payments and other online banking payments
The survey of time consumption for bill payments was carried out internally by a small group of Bank staff in December 2021. The survey measured the time it took to prepare a payment for approval by either:
1.keying in information from a paper invoice and an invoice sent by email, respectively,
2.taking a photo of the invoice and verifying the invoice information in the Vipps app.
The time spent paying the invoice was measured from the moment the payer was logged onto the online bank and had reached the payment page until all the information in the invoice had been keyed in. We measured three invoices where a photo of the invoice had been taken, and the information had been verified. Ideally, the survey should have included approval and authorisation of the payment. The invoices used had already been paid, and since banks have different approval methods with different processing times, no attempt has been made to give an estimate of average approval times for invoice payments.
It took an average of 47.2 seconds to key in the account number, CID number and amount, while it took an average of 31.3 seconds to take a photo of an invoice and prepare it for approval in Vipps (Table A2.6). Figures from DNB and Vipps indicate that 15 percent of paper and PDF invoices are paid by taking a photo of the invoice. A weighted average indicates that an invoice takes 44.8 seconds to pay.
Table A2.6 Time consumption paying bills sent on paper/ PDF. 2021
|
Number of observations |
Time consumption (seconds) |
|
|
Online banking/mobile banking |
22 |
47.2 |
|
Photo/ scanning |
3 |
31.3 |
|
Total |
25 |
44.8 |
Sources: Norges Bank, DNB and Vipps
In 2020, 238.4 million payments were made via online banks. We estimate that 92 million of these originated from a paper invoice. The estimate was provided by Mastercard Payment Services Norway. Mastercard’s estimate was based on payments settled in NICS (most household and corporate payments are processed through NICS). We further estimate that 130 million of the online bank payments were eFaktura (e-invoice) (not in combination with AvtaleGiro (direct debit)). The remaining 16.4 million payments are assumed to be payments that did not originate from an invoice. Time consumption paying an eFaktura is assumed to be 0 seconds19, while making a payment that does not originate from an invoice takes 30 seconds. Thus, as a weighted average, a payment via an online bank takes 19.4 seconds (Table A2.7).
Table A2.7 Time consumption for online bank payments, direct debits and instant payments. 2021
|
Number of observations (in millions) |
Time consumption (in seconds) |
|
|
Paper invoice |
92 |
44.8 |
|
eFaktura |
130 |
0 |
|
Payments initiated by payer |
16.4 |
30 |
|
Online bank payments (sum of the three rows above) |
238.4 |
19.4 |
|
Avtalegiro |
114 |
0 |
|
Instant payments |
154 |
10 |
Sources: Norges Bank and Mastercard Payment Services Norway
14 As labour costs, we have used Statistics Norway’s average monthly salary for all employees for 2020 (NOK 48 750).
15 Norges Bank participated in the survey at one of the points of sale.
16 In the 2007 survey, time consumption for ATM withdrawals was taken from a Swedish study (Bergman et al., 2007), where 50 seconds is the estimated time spent withdrawing cash and 60 seconds is travel time and waiting time at an ATM. In Norges Bank (2014), the time it took to withdraw cash was adjusted down to 40 seconds based on spot checks, while 60 seconds were added to the waiting and travel time. In this survey, we do not include waiting and travel time. Our estimates of 52 seconds are close to the estimates in the Swedish survey used in Gresvik and Haare (2009).
17 Please note that the surveys in 2007 and 2013 distinguished between BankAxept cards and international cards. Such a distinction has not been made here. For example, for combination cards, it will not matter if the payment is a Visa/ Mastercard payment or a BankAxept payment. The estimates for cards in 2007 and 2013 are for BankAxept payments.
18 For more information, see Norges Bank (2021).
19 Measurement begins when the payer is logged in to the online bank (or mobile app). Payments by eFaktura are made at the push of a button. The time spent is therefore set equal to 0 even if, in contrast to a direct debit, the payment requires deliberate action by the payer.
Appendix 3. Businesses’ private costs
About the sub-survey
In autumn 2020, Norges Bank conducted a pilot survey of six businesses, asking businesses to provide statistics on and costs of sending and receiving payments.20 On the basis of feedback, the questionnaire the six businesses responded to was revised somewhat. In January 2021, Norges Bank sent a letter to 85 businesses requiring them to respond to the revised questionnaire (see Appendix 5 for the questions in the sub-survey).
In the sub-survey, three categories of businesses were defined: 1) businesses with sales via a physical outlet, 2) businesses with online sales and 3) businesses that issue bills (excluding bills for online purchases). Examples of businesses that issue bills (third category) are electricity companies, telecommunications companies, daycare centres and insurance companies. A business can fall into one or more of the categories. The aim of categorising businesses in this way was to be able to distinguish costs for giro payments from costs associated with using cards or cash. The categories also made it possible to distinguish between the costs related to sales at a physical outlet and online sales.
The information the businesses were asked to provide covered the calendar year 2020.21 The businesses in the sample reported high turnover in 201922, sell goods and services directly to end users in Norway and are registered in the Register of Business Enterprises. The sample provided a good balance of sectors represented and between businesses with sales at physical outlets, those with online sales and businesses issuing bills. Of the 85 businesses, four were removed from the survey due to a large fall in turnover in 2020. Of the 81 remaining businesses, Norges Bank received responses from 71.
Including the six businesses in the pilot survey and excluding the four businesses removed, a total of 87 businesses were invited to participate in the survey. A total of 77 businesses responded to the survey, a response rate of 89 percent.23 Of these, 65 were of adequate response quality. These became the final sample on which the Bank’s estimates were based. The 12 responses excluded from the estimation basis had one or more significant inadequacies. For example, the responses were incomplete, or deviated significantly from those of comparable businesses, and the business did not respond to follow-up questions.
The survey was resource-intensive, for the businesses and for Norges Bank. The 65 businesses spent an average of 28 hours each responding to the survey, and the survey involved an average of seven persons from each business.
Norges Bank ensured that the responses were consistent by comparing them with one another, identified aberrant responses and had at least one round of follow-up questions with most of the businesses. Meetings were also held with several businesses to review their responses and clarify questions.
Of the 65 businesses, 47 reported sales at physical outlets, 41 reported online sales and 42 reported issuing bills (Chart A3.1).
Chart A3.1 Ways in which the 65 businesses receive payments. 2020. Number of businesses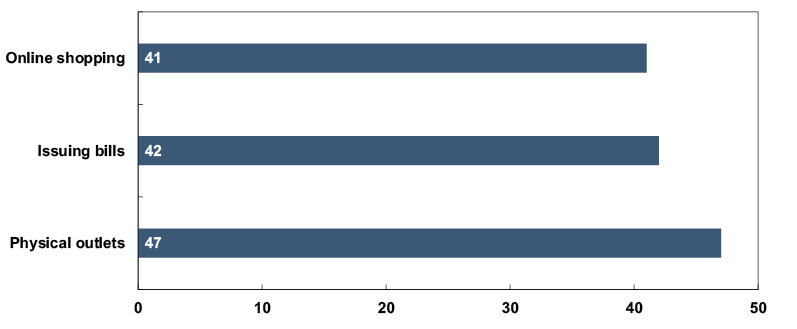
In 2020, the 65 businesses had just under 158 000 employees and NOK 624 billion in sales, of which NOK 364 billion were at physical outlets, NOK 27 billion were online sales and NOK 234 billion were billed (Table A3.1).
The businesses received a total of 1 309 million payments. Of this, 1 174 million were at physical shops, 102 million from issuing bills and 33 million for online sales. There are significant differences in the average sale amount. An average bill was NOK 2 295, an average sale at a physical outlet was NOK 310, while an average online sale was NOK 812.
Table A3.1 Sales and number of payments for the 65 businesses. Average amount per payment. 2020
|
Total |
Physical |
Bills |
Online |
|
|
Sales in billions of NOK |
624 |
364 |
234 |
27 |
|
Number of transactions in millions |
1 309 |
1 174 |
102 |
33 |
|
Average amount in NOK |
477 |
310 |
2 295 |
812 |
The 1.3 billion payments received by the businesses in the survey accounted for 41 percent of all payments made in Norway in 2020 (Table A3.2). The sample thus covered a substantial share of total payments.
Table A3.2 Total number of payments in Norway, number of payments in the survey and survey coverage ratio. 2020
|
Total |
Cash |
BankAxept |
Int. cards |
eFaktura |
Avtale-Giro |
Paper invoice |
EHF |
|
|
Number of payments in Norway (in millions) |
3 172 |
120* |
1 592 |
580 |
130 |
114 |
138 |
66 |
|
Number of payments in the survey (in millions) |
1 309 |
94 |
935 |
137 |
35 |
42 |
18 |
7 |
|
Coverage (percent) |
41 |
79* |
59 |
24 |
27 |
37 |
13 |
10 |
* Estimate (see Box 2 on page 12).
Source: Norges Bank (2021). The number of paper invoices in 2020 is estimated on the basis of responses to this survey and estimates from Mastercard Payment Services Norway24
Most payment methods are well represented in the survey. Just under 60 percent of all BankAxept payments were made at one of the businesses, while for international cards just under one in four payments were made at one of the businesses. Just under 80 percent of total estimated cash payments in Norway were made to one of the respondents. 27 percent of paid eFaktura e-invoices were received by one of the businesses, 37 percent of Avtalegiro direct debits, 15 percent of issued paper invoices (including invoices sent by e-mail) and 10 percent of issued EHF invoices.
The costs the businesses were asked to report differ according to sales method (Chart A3.1).
Chart A3.1 Cost elements by sales method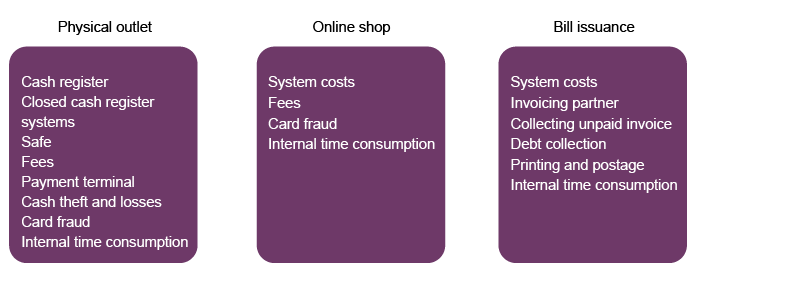
Internal time consumption appears in all three payment situations but differs in content. For example, time consumption for a sale at a physical outlet consists mainly of cash management tasks. For online purchases, time consumption is related to reconciliation, issuing refunds, following up errors and dealing with card fraud. For bill issuance, time consumption is related to printing and sending invoices, sending payment reminders for overdue invoices, compiling data files for sending invoices, etc. System costs for online purchases and bill issuance also differ. For online purchases, there are either proprietary online terminals (the online shop’s costs are not included here) or checkout solutions. For bill issuers, costs are largely associated with accounting systems (ERP systems).
Businesses’ costs of sending and receiving payments
In 2020, businesses total costs for sending and receiving payments amounted to about NOK 3.9 billion. Of this, nearly NOK 3.6 billion is the cost of receiving payments, while NOK 0.3 billion is the cost of sending payments (Table A3.3).
Table A3.3 Businesses’ costs of sending and receiving payments. 2020. In millions of NOK
|
Private costs |
Subcontractors |
Production costs |
|
|
Receiving payments |
3 581 |
1 306 |
2 274 |
|
Physical outlet |
2 982 |
894 |
2 088 |
|
Cash |
1 013 |
184 |
829 |
|
Cards |
1 960 |
701 |
1 259 |
|
BankAxept |
1 549 |
433 |
1 117 |
|
International cards |
410 |
269 |
142 |
|
Online purchases |
228 |
137 |
91 |
|
International cards |
142 |
90 |
52 |
|
Invoice |
26 |
15 |
11 |
|
Giro |
371 |
275 |
96 |
|
Sending payments |
342 |
112 |
230 |
The total costs of receiving payments are distributed fairly equally between the businesses and subcontractors, while the costs of sending payments are borne to a greater extent by the businesses. There are considerable differences between the different ways of receiving payments. 82 percent of cash-related costs are expenses covered by businesses. For cards used at a physical outlet, the corresponding percentage is 64, while for giros it is 35.
The average cost of receiving a payment is NOK 2.7 (Table A3.4), far lower than the cost of sending a payment, which averages NOK 16.0. A large share of the costs of sending a payment is the business’s own time consumption (receiving the invoice, verifying its contents and approving the payment).
The cost per payment for sales at a physical outlet is NOK 2.5. This is lower than the cost per payment for online sales (NOK 6.9) and sales that are billed (NOK 3.6). One of the reasons online purchases cost over NOK 4 more per payment than sales at a physical outlet is that online shopping fees vary by the transaction amount. By comparison, BankAxept, which is the most common payment card for sales at a physical outlet, charged a fixed fee in 2020.25 The average online shopping transaction amount is nearly three times the average transaction amount at physical outlets, which will have a substantial impact on the fees online shops pay per sale.
Invoice issuance by online shops costs NOK 6.2 while invoice issuance by parties other than online shops costs an average of NOK 3.6 because there are different costs associated with online shopping than those incurred by businesses that only issue bills (Chart A3.1).
Table A3.4 Businesses’ unit costs for payments. 2020. In NOK
|
Private costs |
Subcontractors |
Production costs |
|
|
Receiving payments |
2.7 |
1.0 |
1.7 |
|
Physical outlets |
2.5 |
0.8 |
1.8 |
|
Cash |
10.7 |
1.9 |
8.8 |
|
Cards |
1.9 |
0.7 |
1.2 |
|
BankAxept |
1.7 |
0.5 |
1.2 |
|
International cards |
3.5 |
2.3 |
1.2 |
|
Online shopping |
6.9 |
4.2 |
2.7 |
|
International cards |
7.6 |
4.8 |
2.8 |
|
Invoice |
6.2 |
3.5 |
2.7 |
|
Giro |
3.6 |
2.7 |
0.9 |
|
Sending payments |
16.0 |
5.3 |
10.8 |
Businesses’ costs for sales at physical outlets
Payment cards were the most common payment method for sales at a physical outlet in 2020 (Chart A3.2). 89.7 percent of payments were made using a card (79.6 percent using a BankAxept card and 10.1 percent using an international card). Despite a significant decrease in the use of cash in 2020, 8.0 percent of all sales for the businesses in the survey were paid for in cash (see also Box 2 above).
Chart A3.2 Payment methods at physical outlets. 2020. Percent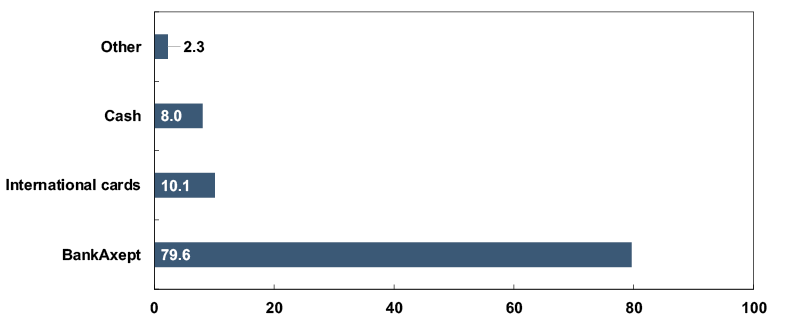
The share of sales paid for in cash differs considerably across businesses (Chart A3.3).
Chart A3.3 Share of cash for businesses reporting cash sales.2020. Percent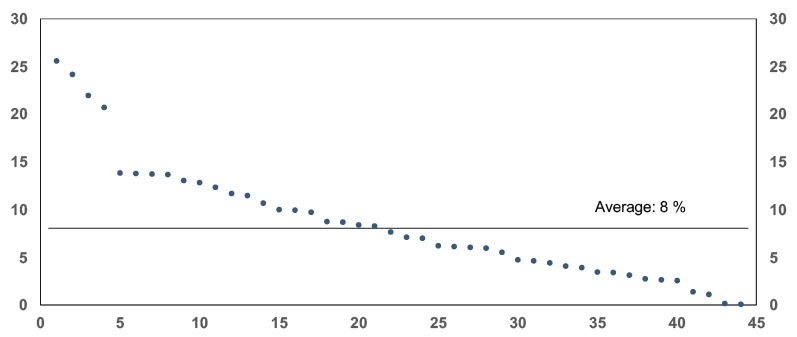
There is a fairly large difference in unit costs for the different payment methods. The unit cost for cash is NOK 10.7, BankAxept cards NOK 1.7, international debit cards NOK 2.5 and international credit cards NOK 3.4 (Chart A3.4). The estimate for international debit cards and international credit cards is based on observations from 21 of the 47 businesses with sales at a physical outlet. Some companies had trouble distinguishing between the fees for international debit and credit cards. The difference in the unit cost for BankAxept and international cards is due to a difference in fee structure. In 2020, BankAxept charged a fixed fee per payment, with the businesses paying an average of NOK 0.21 per sale, while the businesses paid slightly over NOK 2 per sale for international cards.
Chart A3.4 Businesses’ unit costs. 2020. In NOK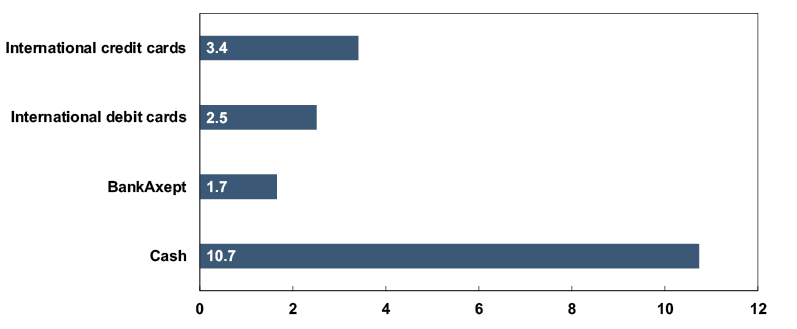
Unit costs for cash are so much higher than for other means of payment chiefly because of businesses’ time consumption and the costs associated with a closed cash register system (including a safe). Of the unit cost of NOK 10.7, NOK 6.6 is the business’s time consumption, NOK 2.5 is expenses for a closed cash register system, NOK 1.1 is fees paid to the cash supplier, NOK 0.3 is cash register expenses (broken down into cards and cash according to the number of payments) and NOK 0.2 is cash losses per cash payment (Chart A3.5). Time consumption for cash comprises closing the cash register, putting money in and taking it out of safes, ordering cash, delivering cash to a bank, dealing with cash register imbalances and theft as well as the moment of payment itself (which takes 15 seconds for cash (see discussion in Appendix 2)).
Chart A3.5 Businesses unit costs for cash. 2020. In NOK. Total NOK 10.7.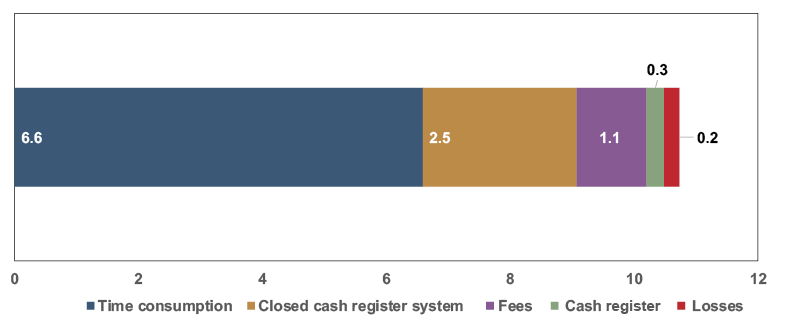
The total unit cost for cards (BankAxept and international cards) is NOK 1.9. Of this, NOK 1.0 is time consumption, NOK 0.4 is card acquirer fees, NOK 0.3 is expenses for cash register systems and NOK 0.1 is terminal costs (Chart A3.6). Time consumption mainly comprises the execution of card payments (which takes 9 seconds), while card terminal administration and error correction and dealing with card fraud are negligible time costs for businesses.
Chart A3.6 Businesses’ unit costs for cards. 2020. In NOK. Total NOK 1.9.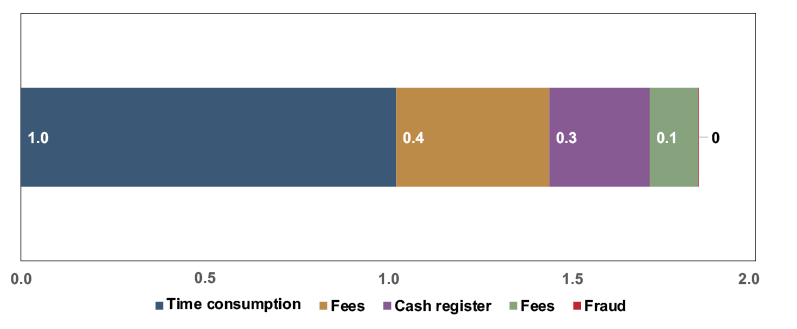
Businesses’ costs for online sales
Cards are the most common online payment method (Chart A3.7), used for 57 percent of online sales. 23 percent of sales were paid for using the Vipps app, an invoice was issued for 13 percent and PayPal was used for 1 percent of sales.
Chart A3.7 Online payment method. 2020. Percent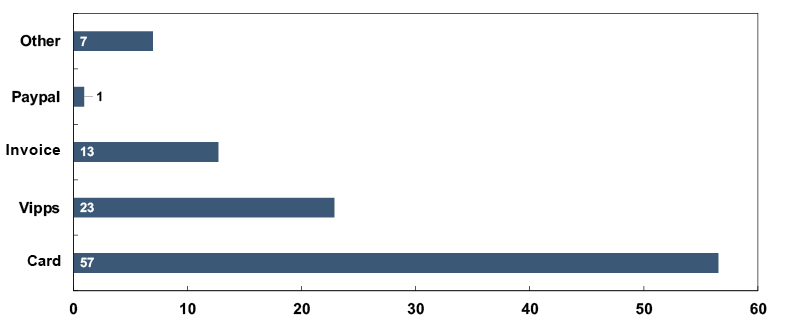
Unit costs for the various online payment methods differ slightly (Chart A3.8). The unit cost for mobile payments (Vipps) is NOK 6.1, for invoices NOK 6.2, international debit cards NOK 6.7 and international credit cards NOK 8.0. Unit costs are higher for cards than for mobile payments and invoices, which reflect that card fees are somewhat higher per payment than fees for invoice and mobile payments. The fees for cards and mobile payments vary with the transaction amount. The average card transaction is NOK 675, while mobile transactions average NOK 365. Per payment, this translates into a higher unit cost for cards.
Chart A3.8 Unit costs for online shopping. 2020. In NOK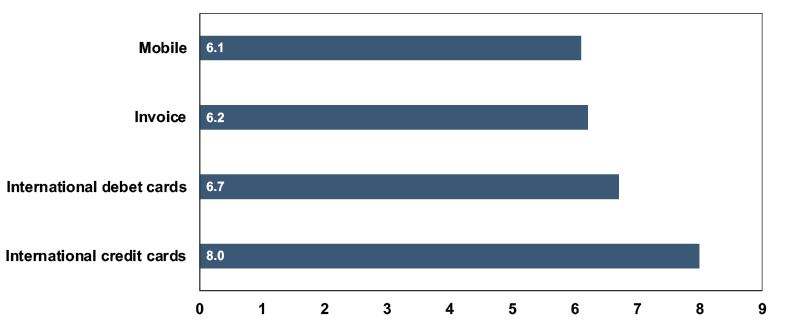
The total unit cost for card payments is NOK 7.6, which comprises card fees (NOK 3.6), time consumption (NOK 2.2) and system costs (NOK 1.8) (Chart A3.9). Card fraud was a negligible expense for businesses.
Chart A3.9 Unit cost for cards. Online shopping. 2020. Kroner. Total NOK 7.6.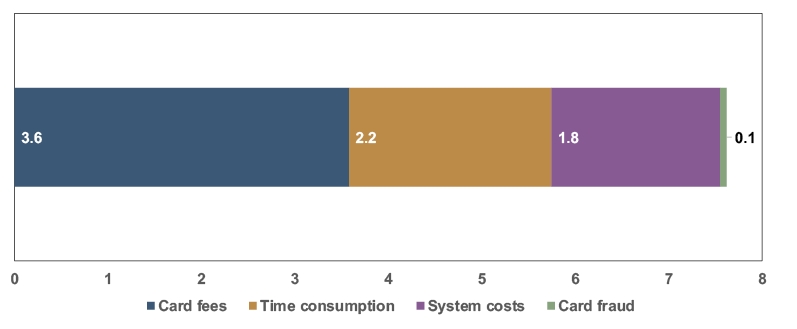
Card fees per payment are significantly higher for online shopping than for purchases at physical outlets. There are two main reasons for this:
- Until 2021, BankAxept charged a fixed transaction fee irrespective of the amount, and BankAxept cannot be used for online shopping.
- The average transaction amount for cards is more than twice as high for online shopping (NOK 675 for online shopping compared with NOK 327 at physical outlets).
The differences are much smaller if we instead compare card fees as a percentage of total sales. Fees for international credit cards account for 0.58 percent of total online shopping sales and 0.49 percent of total sales at a physical outlet (Table A3.5). For international debit cards, fees are 0.48 percent of total sales at physical outlets and 0.44 percent for online shopping. It is reasonable that credit card fees are higher than those for debit cards, but it is surprising that debit card fees are lower as a percentage of total sales for online shopping than for sales at physical outlets.
Table A3.5 Card fees for physical outlets and online shopping. 2020
|
Card fees per payment |
Card fee per NOK transacted |
|||
|
Physical outlet |
Online shopping |
Physical outlet |
Online shopping |
|
|
BankAxept |
0.21 kr. |
NA |
0.07% |
NA |
|
International debit cards |
1.07 kr. |
2.67 kr. |
0.48% |
0.44% |
|
International credit cards |
1.96 kr. |
3.96 kr. |
0.49% |
0.58% |
The unit costs for an invoice are NOK 6.2 and comprise time spent (NOK 2.2), system costs (NOK 1.8), expenses for the invoicing partner (NOK 0.9), printing and postage of physical invoices (NOK 0.9), expenses for collecting an unpaid invoice (NOK 0.3) and debt collection costs (NOK 0.1) (Chart A3.10).
Chart A3.10 Unit cost for invoices. Online shopping. 2020. In NOK. Total NOK 6.2.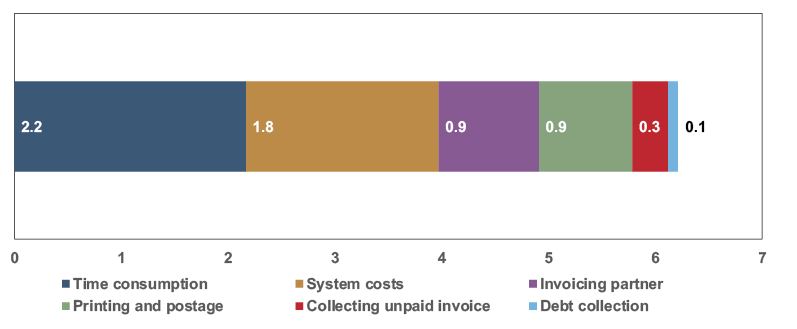
The reason that time consumption and system costs are the same for invoices and cards is that these processes are common to all online shopping payment methods. Costs are allocated among payment methods according to the share of payments for which the respective payment methods are used. As a result, per payment costs will be the same across payment methods.
Businesses’ costs for direct debits and invoicing
In 2020, the 42 businesses that bill their customers collected payment via 101 million invoices and direct debits, of which 86 million were e-invoices and direct debits. Of the 86 million, 42 million were direct debits (including combination products such as Avtalegiro (direct debit for households) combined with eFaktura (e-invoice)), 34 million were eFaktura invoices, 6 million were EHF invoices and 4 million were Autogiro (direct debit for businesses). The businesses issued 15 million invoices on paper or as email attachments (15 percent of the total number of invoices issued) (Chart A3.11).
Chart A3.11 Invoices issued. 2020. In millions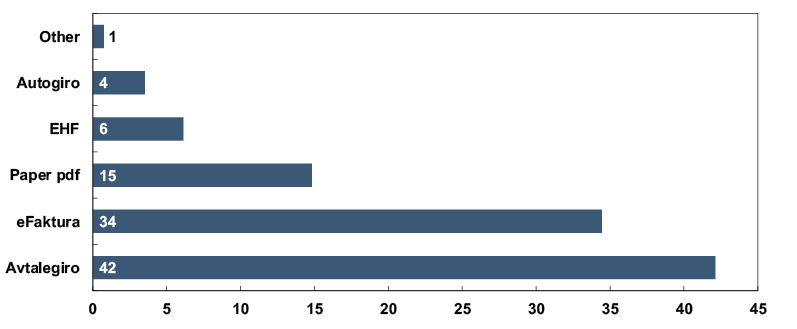
The unit cost for invoices and direct debits was NOK 3.6. Of this, NOK 0.9 was time consumption by the enterprise, NOK 0.8 was the cost of access points, NOK 0.7 costs for an invoicing partner, NOK 0.5 printing and postage costs, NOK 0.4 costs for invoice generation systems and NOK 0.2 payment collection costs (Chart A3.12).
Chart A3.12 Unit cost per invoice issued. 2020. In NOK. Total cost NOK 3.6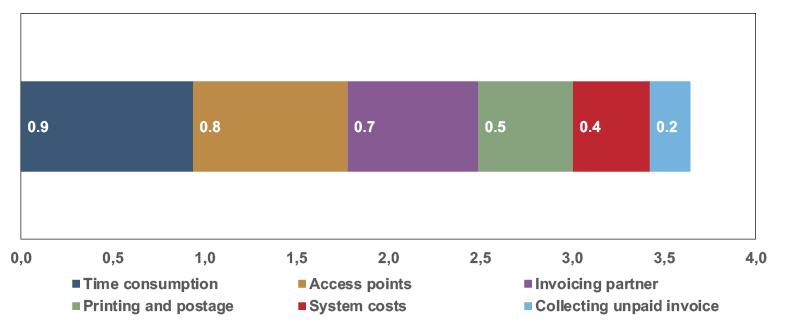
The businesses were also asked to report on the size of the losses they had incurred per invoice issued (bills that were never paid or where only part of the invoiced amount could be collected). The losses were equivalent to NOK 3.5 per invoice issued. Losses as a result of unpaid invoices have not been included as payment costs in this survey.
The cost of sending payments
The businesses mainly received e-invoices. Of their total payments, about 80 percent were e-invoice payments (eg Autogiro, EHF and EDIFACT). About 13 percent of the payments originated from an invoice sent on paper or as an email attachment, while 7.2 percent did not originate from an invoice (Chart A3.13).
Chart A3.13 Payments sent by businesses. 2020. In percent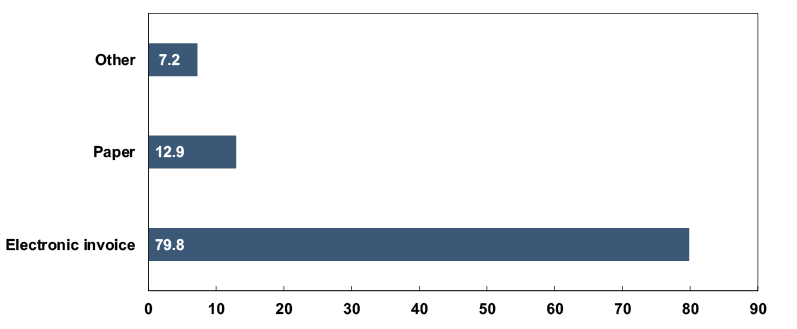
Businesses’ cost of sending payments is NOK 16.0 per payment, comprising time consumption (NOK 10.8), variable financial and accounting system costs (NOK 0.9)26 and bank charges (NOK 4.3) (Chart A3.14).
Chart A3.14 Cost for businesses of sending payments. 2020. In NOK. Total NOK 16.0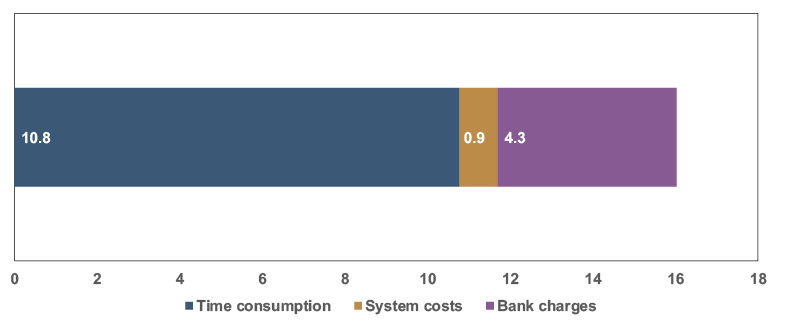
Time consumption includes scanning any paper invoices, verifying and authorising the payment, conducting any checks and executing the payment.
Comparison with previous estimates
In previous surveys, Norges Bank calculated businesses’ costs associated with payments at physical outlets and with giro payments. Previous surveys did not include costs associated with e-commerce or the cost of issuing invoices.
The cost elements reported by the businesses related to sales at a physical outlet are approximately the same as in the survey in 2013. Since 2013, unit costs have changed considerably for international cards and cash. The unit cost of a cash payment has increased from NOK 2.8 to NOK 10.7, while the unit cost for international cards has fallen from NOK 8.9 to NOK 3.5 (Chart A3.15). The unit cost is approximately unchanged for BankAxept card payments. The figures for 2013 have been adjusted for inflation between 2013 and 2020.
Chart A3.15 Unit costs. 2013 and 2020. In 2020 NOK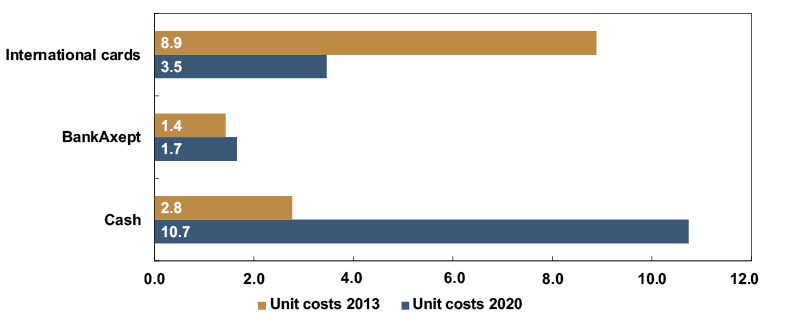
One of the main reasons for the increase in businesses’ unit costs for cash payments is the considerable reduction in the number of cash payments since 2013. Cash payment costs are mainly fixed costs that must be paid regardless of the number of cash payments the business receives (safe depreciation costs, costs related to a closed cash register system, time spent on reconciling and closing cash registers etc.). These fixed costs are now spread across far fewer payments.
The cost of international card payments has decreased to such an extent mainly because fees have been reduced on average from 0.97 percent to 0.47 percent of the transaction amount. In this survey, the time spent on a card payment is not divided into international cards and BankAxept cards, so the time spent on an international card payment is the same as the time spent on a BankAxept payment. From 2013 to the present, the time spent on an international card payment has decreased from 25 seconds to 9 seconds. The reduction in time spent reduces the unit cost of international cards by close to NOK 1.5.
The unit cost for BankAxept payments is NOK 0.23 higher than in 2013. This is partly because the average fee that businesses pay for a sale paid for using a BankAxept card has increased from NOK 0.06 per payment to NOK 0.21 per payment.
The 2013 costs survey measured fewer elements of businesses’ giro payment costs. In 2013, giro payment costs consisted of the fees businesses pay to banks and businesses’ time consumption, which was set at 60 seconds per giro payment. The current survey measures both the cost for businesses of issuing invoices and the cost of paying invoices. Chart A3.16 compares the costs of giro payments, and we show figures for 2020 based on the methodology of the 2013 survey (orange bar) and the figures for 2013 adjusted for the price level between 2013 and 2020 (purple bar), as well as businesses’ costs related to paying invoices as they are now calculated (blue bar).
Chart A3.16 Unit costs for giro payments. 2013 and 2020. In NOK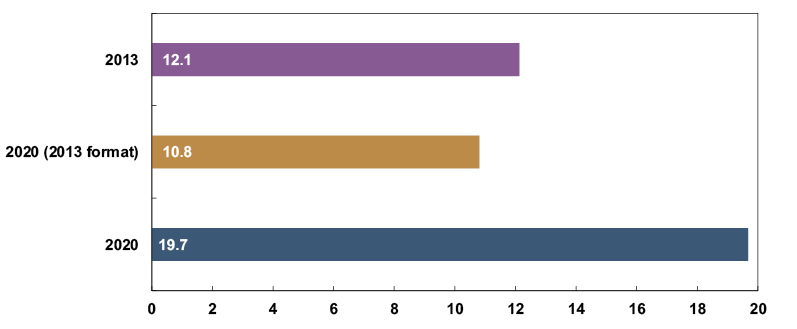
In 2020, the private cost of giro payments measured by the 2013 method was NOK 10.8, a decrease of NOK 1.3 from 2013. The private cost measured by the method used in this report is NOK 19.7. Of this, NOK 3.6 is the cost of issuing an invoice and NOK 16 is the cost of paying invoices (of this in turn, NOK 4.3 is fees paid to banks).
20 Ideas2Evidence supplied an electronic questionnaire on behalf of Norges Bank.
21 The businesses in the pilot study provided information for the first half of 2020, which was aggregated to annual data by multiplying the responses by 2.
22 Turnover figures were taken from the Register of Business Enterprises.
23 Compared with previous surveys in Norway and surveys in other countries, this response rate is high. The Bank of Canada achieved a response rate of 3.5 percent for a similar survey for 2014 (see Kosse et al (2017)). Of the 29 ٥٢٥ businesses invited to participate, ١ ٠١٤ responded. Denmark’s central bank, Danmarks Nationalbank, achieved a response rate of ٥.٨ percent for a similar survey in ٢٠١٢ (see Danmarks Nationalbank (٢٠١٢)). Out of a sample of ٤ ٠٠٠ enterprises, Danmarks Nationalbank received ٢٣١ satisfactory responses. Sweden’s central bank, Sveriges Riksbank, achieved a response rate of ٥٠ percent in a survey for ٢٠١٢, and the sample used by the Riksbank comprised ١١ satisfactory responses (see Segendorf and Jansson (٢٠١٢)). The Portuguese central bank received ١٣ satisfactory responses from ٢٣ questionnaires in ٢٠٠٥ (see Banco de Portugal (٢٠٠٧)). Other central banks have also reported challenges in getting businesses to respond to such surveys (see, for example, Turjan et al (٢٠١١)). The reason Norges Bank’s survey achieved such a high response rate was probably primarily that participation was mandatory. Pursuant to the Norges Bank Act, Norges Bank may require disclosure of information from businesses registered in the Register of Business Enterprises. Close follow-up of individual businesses by Norges Bank probably also contributed positively to the response rate and the share of satisfactory responses.
24 Mastercard’s estimates are based on calculations using transactions in the NICS interbank system. The estimate seems reasonable in view of the information we obtained in this survey.
25 In summer 2021, BankAxept introduced a new pricing structure, and the fees now vary with the transaction amount.
26 We also asked companies to report fixed costs for their financial and accounting systems. These amounted to NOK 6.5 per payment. These costs were not included as businesses’ financial and accounting systems perform many functions in addition to executing payments. Only costs that vary with the number of payments have therefore been included.
Appendix 4. Private costs in the public sector
This is the first cost survey Norges Bank has conducted where payment costs are reported by the public sector. In previous surveys, it was assumed that the public sector has the same unit costs related to receiving and sending payments as private sector businesses. There are also few examples of public sector reporting of own payment costs in other countries’ cost surveys.27 Costs for the public sector are calculated on the basis of cost reporting by the Norwegian Labour and Welfare Administration (NAV), the Norwegian Tax Administration and the Norwegian Government Agency for Financial Management (DFØ) for the whole of 2020.28 In calculating the number of payments to and from the public sector in total, we have also included data received from three municipalities and used several other sources.
In total, the Norwegian Government Agency for Financial Management, the Norwegian Tax Administration and NAV disbursed 45.1 million payments and received 10 million payments. This represents 81 percent of all payments made by the public sector in 2020 and 26 percent of all payments to the public sector in 2020 (Table A4.1).
Table A4.1 Number of payments to and from the public sector
|
Ingoing payments |
Outgoing payments |
|
|
NAV, the Norwegian Tax Administration and DFØ |
9 981 662 |
45 097 493 |
|
Total public sector |
38 545 547 |
55 726 663 |
|
Percentage of public sector |
26 |
81 |
Sources: Norges Bank, NAV, the Norwegian Tax Administration, the Norwegian Government Agency for Financial Management (DFØ), Oslo Municipality, Bærum Municipality, Asker Municipality, Mastercard Payment Services Norway and Statistics Norway29
Outgoing payments from NAV include financial support and benefits, as well as internal payments in the form of wages and travel allowances. Ingoing payments to the Norwegian Tax Administration include direct taxes (such as taxes on petroleum extraction, income tax, corporation tax, financial transaction tax, back taxes etc.), indirect taxes (eg employers’ national insurance contributions, private individuals’ national insurance contributions, value added tax, customs duties, taxes on alcohol and tobacco, CO2 tax), fines and occupational injury penalties.
Outgoing payments from the Norwegian Tax Administration include refunds of overpaid tax, refunds of deficits and exploration costs, scrap deposit, maintenance payments and advance payments, VAT credit (including transfers to municipalities and county municipalities, and grants to private and non-profit organisations). The Norwegian Government Agency for Financial Management’s payments are primarily related to the accounting and payroll services it provides to government agencies.
For the three agencies, the unit cost of sending payments is NOK 1.1, while the unit cost of receiving payments is NOK 3.7 (Table A4.2). Of the cost of NOK 1.1 to send payments, NOK 0.6 is the agency’s own costs, while NOK 0.5 is the cost of subcontracting. And of the NOK 3.7 unit cost for receiving payments, NOK 2.5 is the agency’s own costs, while NOK 1.2 is the cost of subcontracting.
Table A4.2 Unit costs for government of sending and receiving payments. 2020. In NOK
|
Unit costs |
Own costs |
Subcontracting |
|
|
Send payments |
1,1 |
0,6 |
0,5 |
|
Receive payments |
3,7 |
2,5 |
1,2 |
Sources: Norges Bank, the Norwegian Government Agency for Financial Management (DFØ), NAV and the Norwegian Tax Administration
Owing to economies of scale, unit costs for outgoing payments are much lower for the public sector than for private sector businesses (NOK 1.1 for the public sector compared with NOK 16.0 for businesses). The bulk of outgoing payments are made by NAV, which has largely automated its payment processes. NAV’s fixed costs are spread over a large number of payments. For businesses, costs are spread over a much lower volume of payments, and because of the low volume, it is also less profitable to make large investments to reduce the marginal cost of a payment. The costs of receiving a payment are on average NOK 1 higher for the public sector than for private sector businesses (NOK 3.7 for the public sector compared with NOK 2.7 for private sector businesses) (Chart A4.1).
Chart A4.1 Public sector. Private unit costs. 2020. In NOK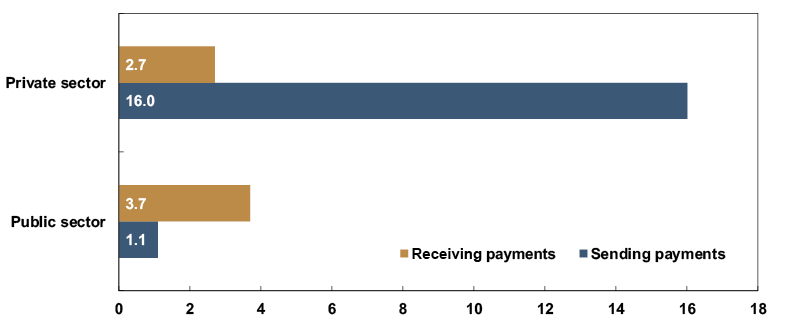
Norges Bank did not prepare a single government agency form for NAV, the Norwegian Government Agency for Financial Management and the Norwegian Tax Administration, as we did for banks and businesses. The three agencies have different missions and different systems. The three agencies were therefore asked to report their payment costs (both their own time consumption and system costs) and choose the method that was best suited to existing measurements and available information. Meetings and discussions were held with these government agencies both collectively and separately to ensure that the reports were comparable.30
The Norwegian Government Agency for Financial Management shared the underlying data from a benchmark survey conducted on behalf of the Agency by Ernst & Young, where government institutions with shared functions are compared. The method behind the survey shares some properties with the method used by banks in their reporting. The results of the benchmark survey are presented in the Norwegian Government Agency for Financial Management annual report (see for example the table on page 77 in the publication “Direktoratet for forvaltning og økonomistyring” (2021)). In the benchmark, various processes are first identified, such as managing wages and disbursing travel and expense refunds. Each process is then divided into different activities that support the process (such as recording working hours, monitoring changes in the tax base, answering pay-related questions, or processing payroll payments). Each process is divided into the following five cost elements: labour costs, system costs (licenses, software, IT infrastructure, depreciation of IT systems, etc.), indirect costs (rent of office space, water, gas, electricity, insurance, etc.), outsourced costs and other costs. The figures used here are adapted to the purpose of this survey, as the benchmark survey covers more than just payment costs. Among other things, costs have been adjusted according to the proportion of processes assumed to be directly related to receiving or sending payments.
NAV identified the IT systems and processes necessary to send and receive payments. Only those IT systems regarded as being directly related to sending and receiving payments were included. Internal time consumption was estimated.
The Norwegian Tax Administration has reported IT costs and internal time spent receiving and sending payments. Internal resource usage was calculated on the basis of logs of internal time spent on receiving and sending payments (from the ‘Tidbank’ time-tracking system). IT costs were calculated based on the TBM taxonomy. The IT systems the Norwegian Tax Administration reported for also serve functions other than simply sending and receiving payments. 11 percent of the Norwegian Tax Administration’s reported IT costs were included in the calculation basis.31
27 A cost survey conducted by the central bank of Albania in 2018 (see World Bank Group (2018)) has its own government agency sub-survey, where government agencies report fees for the use of various payment services, as well as time spent monitoring their own balance sheets.
28 The term ‘public sector’ refers here to government agencies and municipalities.
29 Ingoing payments to the municipalities are reported by Mastercard Payment Services Infrastructure Norway. The figures cover 12 months from July 2020 to June 2021. Outgoing payments from the municipalities are estimated on the basis of reporting by Oslo, Asker and Bærum municipality and the figures are aggregated up to country level based on the number of households.
30 The Norwegian Government Agency for Financial Management, the Norwegian Tax Administration and NAV were presented with each other’s reports and joint meetings were held to discuss which cost elements should be included and how.
31 The businesses reported both fixed and variable (which depends on the number of payments) costs associated with financial and accounting systems. The 11 percent is the share of variable costs in businesses’ expenditure on financial and accounting systems in 2020. For businesses, only the variable costs of financial and accounting systems are included in the calculation basis. The Norwegian Tax Administration’s systems are not directly comparable to the financial and accounting systems used by businesses, although there are some similarities.
Appendix 5. Questions to the businesses
References
Åmås, T. (2021), “Husholdningenes betalingsvaner” [Household payment habits], Bankplassen blogg (in Norwegian only).
Åmås T. (2022), “Husholdningenes betalingsvaner – netthandel og regninger” [Household payment habits – online shopping and bills], Bankplassen blogg (in Norwegian only).
Banco de Portugal (2007), “Retail Payment Instruments in Portugal: Costs and Benefits”, Study July 2007.
Bergman, M., Guibourg, G. and Segendorf, B. (2007), “The costs of paying: Private and social costs of cash and card systems”, Sveriges Riksbank Working Paper Series No. 212.
Danish Payments Council (2018), “Baggrund til serie om omkostninger ved betalinger i Danmark” [Background for the series on the cost of payments in Denmark] (in Danish only).
Danish Payments Council (2019), “Betalinger mellem virksomheder kostede samfundet 4,2 mia. Kr” [Business-to-business payments cost society DKK 4.2 billion] (in Danish only).
Danmarks Nationalbank (2012), “Costs of payments in Denmark”.
Directorate for Public Administration and Financial Management (2021), DFØs årsrapport 2021 [DFØ Annual Report 2021] (in Norwegian only).
Fevolden, M.B. and Nordal, P. (2021), “Statens konsernkontoordning – alt du ønsker å vite, men ikke våger å spørre om” [Everything you always wanted to know about the government’s consolidated account system but were afraid to ask], Bankplassen blogg (in Norwegian only).
Gresvik, O. and Haare, H. (2009), “Costs in the Norwegian payment system”, Norges Bank Staff Memo 4/2009.
Kosse, A. Chen, H. Felt, M-H., Jiongo, V. D., Nield, K. and Welte A. (2017), “The Costs of Point-of-Sale Payments in Canada”, Bank of Canada Staff Discussion Paper 2017-4.
Norges Bank (2014), “Costs in the Norwegian payment system”, Norges Bank Papers 5/2014.
Norges Bank (2021), “Retail payment services 2020”, Norges Bank Papers 2/2021.
Schmiedel, H., Kostova, G. and Ruttenberg, W. (2012), “The social and private costs of retail payment instruments: a European perspective”, ECB Occasional Paper No. 137.
Segendorf, B. and Jansson T. (2012), “The Cost of Consumer Payments in Sweden”, Sveriges Riksbank Working Paper Series No. 262.
Stewart, C., Chan, I., Ossolinski, C., Halperin, D. and Ryan, P. (2014), “The Evolution of Payment Costs in Australia”, Research Discussion Paper 2014-14.
Turján, A., Divéki, É., Kessy-Harmath, É., Kóczán, G. and Takács, K. (2011), “Nothing is Free: A Survey of the Social Costs of the Main Payment Instruments in Hungary”, MNG Occasional Papers 93.
World Bank Group (2016), “Retail payments: A practical guide for measuring retail payment costs”.
World Bank Group (2018), “The Retail Payment Costs and Savings in Albania”.