
Norges Bank’s Monetary and Financial Stability Committee decided to raise the policy rate from 4.25% to 4.5% at its meeting on 13 December. Based on the Committee’s current assessment of the outlook and the balance of risks, the policy rate will likely be kept at that level for some time ahead.
International inflation is receding
Consumer price inflation among Norway’s main trading partners has come down further in recent months but remains above central banks’ 2% inflation target. Underlying price inflation has also moderated and has been a little lower than projected in the September 2023 Monetary Policy Report. Energy prices and prices for a range of other commodities are substantially lower than in 2022. Since the previous Report, both oil and gas prices have declined.
Economic growth among our trading partners has overall been a little stronger than projected in September. While US GDP continued to improve, activity among several of our main European trading partners showed a slight decrease. Unemployment remains low, and wage growth is still high in many countries. Higher interest rates and elevated inflation are dampening international economic activity, but there are prospects for a pickup in growth in the course of 2024, with growth projected at a slightly higher pace than in September.
Policy rates and estimated forward rates. Percent
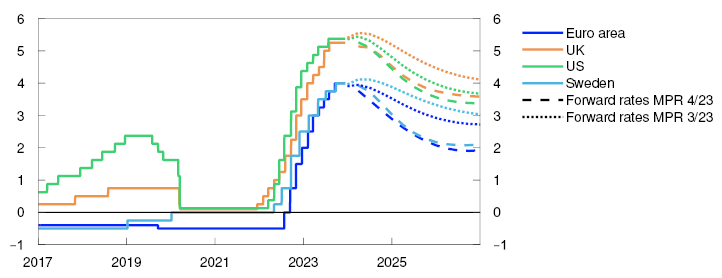
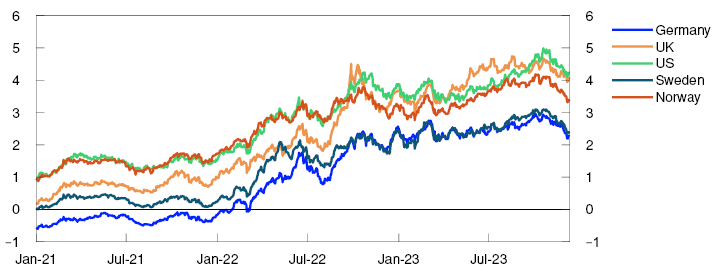
Policy rates among our main trading partners have been kept unchanged since September. Most central banks have emphasised the need to maintain a tight stance for some time in order to return inflation to target. At the same time, policy rate expectations have fallen internationally. Market pricing indicates that policy rates have peaked and that central banks are expected to start cutting policy rates in the course of spring 2024. Long-term government bond yields have decreased, while global equity indexes are little changed since September.
In Norway, market policy rate expectations have also fallen. The interest rate differential against our main trading partners has shown little change since September and is still low from a historical perspective. The Norwegian krone has depreciated and has on average been about 3% weaker than projected in the previous Report. The depreciation has coincided with a decline in oil prices. Corporate lending rates have continued upwards since September, and the average residential mortgage rate has risen broadly as projected.
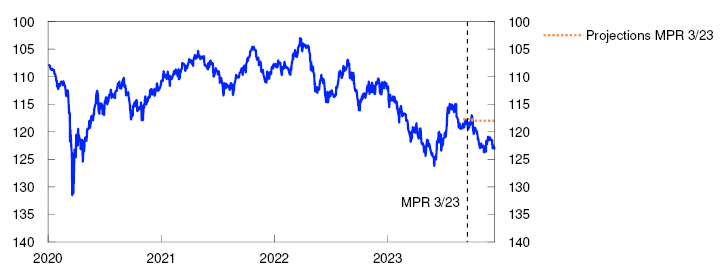
Import-weighted exchange rate index. I-44
Easing pressures in the Norwegian economy
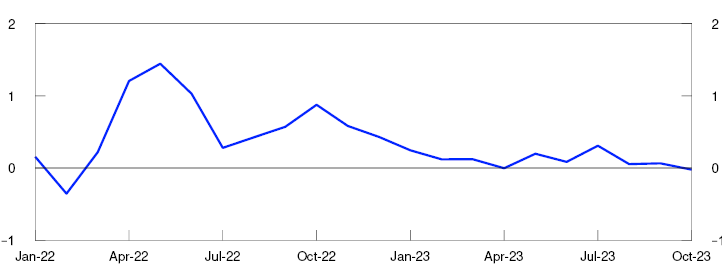
Growth in the Norwegian economy is low. After growth slowed in 2023 H1, mainland GDP was broadly unchanged between 2023 Q2 and Q3. Overall household consumption has declined so far this year and been slightly lower than projected in September.
GDP for mainland Norway. Three-month moving average. Percent
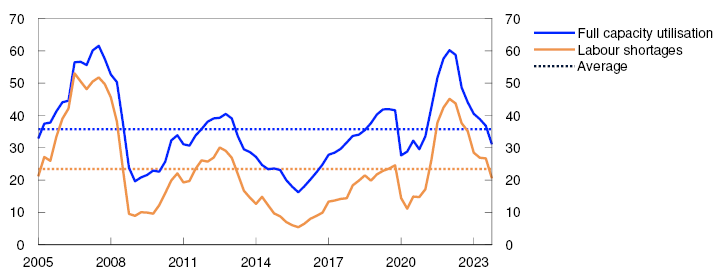
The employment rate is high. The unemployment rate remains low, broadly in line with that projected. At the same time, pressures in the Norwegian economy appear to be dissipating. Employment has been stable and slightly lower than projected in September. According to Norges Bank’s Regional Network, recruitment difficulties have eased. The share of firms reporting labour shortages as a constraint on production fell between Q3 and Q4.
Capacity utilisation and labour shortages according to the Regional Network. Percentage shares
Regional Network contacts expect an overall decline in activity in 2024 Q1, but there are wide differences across industries. Growth in oil services remains strong, reflecting the high level of investment in the petroleum industry. Contacts report that lower household demand and weak new home sales are weighing down on activity in retail trade and construction. In the secondary housing market, prices have increased a little in recent months and have been higher than expected, while the stock of unsold homes has increased.
The interest rate rises and elevated inflation will continue to restrain growth in the Norwegian economy ahead. Activity is expected to fall through winter and to lie slightly lower than projected earlier. Household consumption, housing investment and business investment are set to edge down in the coming period. On the other hand, the high level of petroleum investment and a further increase in export growth will contribute to supporting activity in the Norwegian economy in both 2023 and 2024.
Continued high underlying inflation
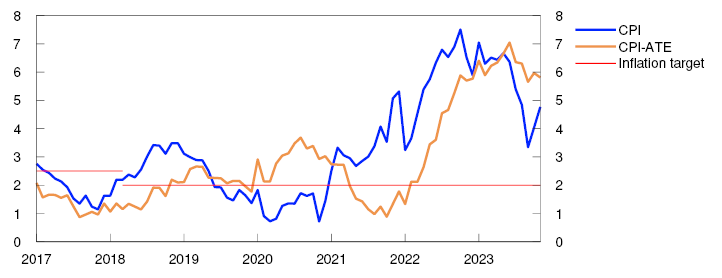
The pace of increase in the consumer price index (CPI) has slowed, reflecting the fall in energy prices. The 12-month rise in the CPI was 4.8% in November and was lower than projected in the September Report. Electricity prices, in particular, were lower than expected. The average of different underlying inflation indicators has decreased since summer. The 12-month rise in the CPI adjusted for tax changes and excluding energy products (CPI-ATE) was 5.8% in November and was also somewhat lower than projected.
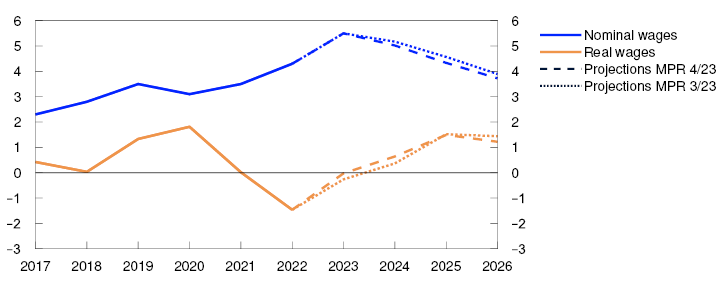
Wage growth is projected to reach 5.5% in 2023, as in the previous Report. The krone depreciation has improved manufacturing profitability, but wage growth will likely be lower in 2024 than projected in the previous Report given the prospects for somewhat lower consumer price inflation than projected earlier. Both Norges Bank’s Expectations Survey and Regional Network contacts indicate a decrease in wage expectations for 2024. According to the Expectations Survey, inflation expectations one to two years ahead have also fallen slightly. Long-term inflation expectations are still higher than the inflation target of 2%.
Inflation is projected to moderate ahead on the back of weaker international price impulses and lower energy prices. On the other hand, increased labour costs, continued high prices for many intermediate goods and the krone depreciation will contribute to keeping inflation elevated.
CPI and CPI-ATE. Twelve-month change. Percent
Policy rate raised to 4.5%
The operational target of monetary policy is annual consumer price inflation of close to 2% over time. Inflation targeting shall be forward-looking and flexible so that it can contribute to high and stable output and employment and to counteracting the build-up of financial imbalances.
Inflation has been somewhat lower than expected but is still markedly above target. At the same time, business costs have increased considerably over the past few years, and there are prospects for continued high wage growth. The krone has depreciated further. This will keep inflation elevated ahead despite an easing of international price impulses. Employment is high, and unemployment remains low.
The policy rate is likely close to the level required to return inflation to target within a reasonable time horizon. The Committee is concerned with balancing the risk of tightening too much against the risk of tightening too little. The economy is now cooling down, and the full effects of the past rate hikes have yet to be seen. On the other hand, inflation is high, and the krone depreciation makes it more challenging to bring down inflation. An increase in the policy rate now will reduce the risk of inflation remaining high for a long period of time.
The Committee assesses that a tight monetary policy stance will likely be needed for some time ahead in order to return inflation to target within a reasonable time horizon. Further out, when inflation falls back and economic conditions so warrant, the Committee can start lowering the policy rate.
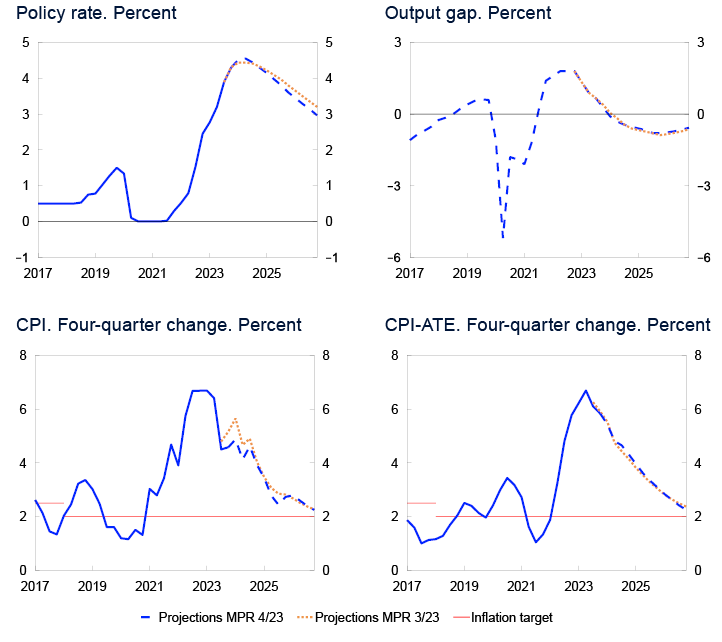
Compared with the forecast in the previous Report, the policy rate forecast is little changed in the near term but is somewhat lower further ahead. The forecast indicates that the policy rate will lie around 4.5% until autumn 2024 before gradually moving down. Economic growth is projected to remain low over the next year before picking up again. Unemployment is set to edge up. Inflation is projected to recede and approach the target somewhat further out.
There is uncertainty about future developments in the Norwegian economy. If cost inflation remains elevated or the krone turns out to be weaker than projected, price inflation may remain higher for longer than currently projected. In that case, the Committee is prepared to raise the policy rate again. If there is a more pronounced slowdown in the Norwegian economy or inflation declines more rapidly, the policy rate may be lowered earlier than currently envisaged.
The Committee decided unanimously to raise the policy rate by 0.25 percentage point to 4.5% at its meeting on 13 December. Based on the Committee’s current assessment of the outlook and balance of risks, the policy rate will likely be kept at that level for some time ahead.
Ida Wolden Bache
Pål Longva
Øystein Børsum
Ingvild Almås
Jeanette Fjære-Lindkjenn
13 December 2023
1. The global economy
Consumer price inflation has fallen considerably among all Norway’s main trading partners. Trading partner GDP growth is projected to pick up from a low level in the course of 2024. Oil prices are lower than in the September 2023 Monetary Policy Report. Policy rate expectations and long-term interest rates among Norway’s trading partners are markedly lower than in September.
Core inflation has declined
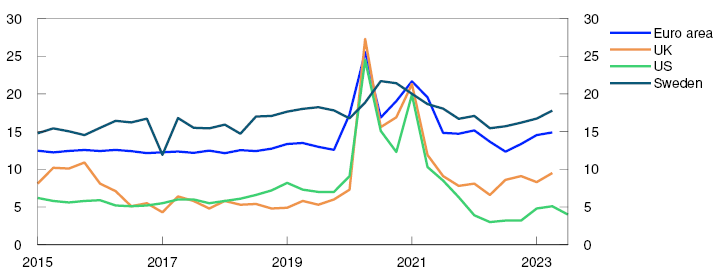
In recent months, consumer price inflation has fallen considerably, particularly in Europe. Headline inflation is 2.4% in the euro area and just over 3% in the US (Chart 1.1). Underlying inflation has slowed to 3.6% in the euro area and 4% in the US.
Consumer prices. Twelve-month change. Percent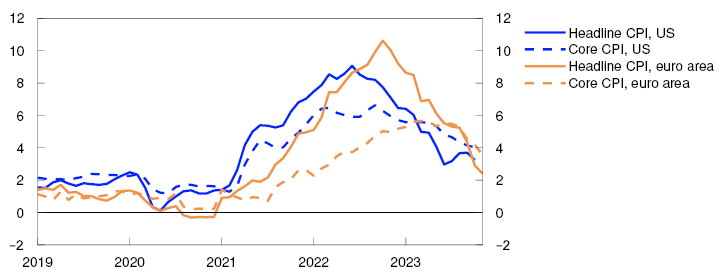
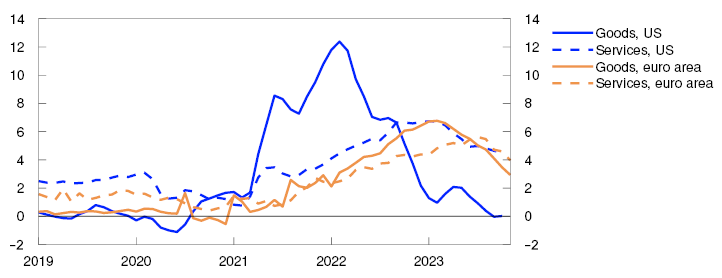
Goods inflation, in particular, has decelerated. In the US, the 12-month change in goods prices is close to zero (Chart 1.2). Services inflation excluding rent is higher. Overall, underlying price inflation among Norway’s main trading partners has been a little lower than projected in the September Report.
Consumer prices. Services and goods excluding food and energy. Twelve-month change. Percent
A number of factors will likely contribute to a further decline in goods inflation in Europe ahead. Tighter monetary policy and a shift towards more services consumption after the pandemic have weighed on demand for goods. Freight rates moved down to pre-pandemic levels in spring. Prices for energy and a number of other commodities are far lower than in 2022. Since the September Report, oil spot prices have fallen by about 20%. Energy and commodity price developments are discussed further in "Lower energy prices".
Neither in the US nor the euro area has services inflation fallen to the same extent, and high wage growth will likely contribute to keeping services inflation elevated for longer. Wage growth among Norway’s main trading partners as a whole is projected to rise to 5% in 2023. Wage and price inflation are expected to gradually drift down in the years ahead owing to lower capacity utilisation. Long-term market inflation expectations are close to both US and euro area inflation targets. Expectations have fallen slightly since the September Report. Underlying inflation for Norway’s main trading partners as a whole is projected at 5.3% in 2023, before slowing to about 3% in 2024 and to slightly above 2% in 2026.
Policy rates abroad have likely peaked
Central banks in Norway’s main trading partner countries have not changed their policy rates since September. Most central banks emphasise the need to keep rates higher for longer to return inflation to target.
Market policy rate expectations indicate that there will not be further rate hikes. Policy rate expectations are substantially lower than in the September Report, reflecting in part a marked fall in inflation in many countries. Market pricing indicates that central banks will begin to reduce policy rates in the course of spring 2024.
Long-term government bond yields are lower, while global equity indexes and credit premiums are little changed since the September Report (Chart 1.3).
Ten-year government bond yields. Percent
Pick-up in growth abroad in the course of 2024
Output in main trading partner countries is likely close to potential, and for some trading partners, unemployment has edged up from low levels. After remaining subdued for all of 2023, GDP growth is expected to pick up in the course of 2024 (Chart 1.4).
GDP for trading partners. Quarterly change. Percent
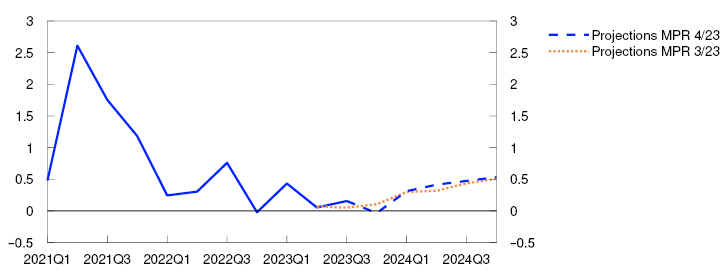
For trading partners as a whole, GDP growth in 2023 Q3 was slightly higher than projected in the September Report. Among Norway’s main trading partners, China and the US reported the strongest GDP growth. Activity showed little change in the UK and fell slightly in the euro area and Sweden.
In Europe, high inflation and higher interest rates have weighed on household purchasing power and consumption in 2023. Indicators for manufacturing and services point to a fall in activity in the near term. Both households and firms are facing tighter lending conditions, and credit growth has declined markedly. From 2024, higher real wages will likely lift household purchasing power.
In the US, household saving has fallen more than in Europe (Chart 1.5), which partly explains why US GDP growth has held up better. Monetary policy tightening is expected to weigh more heavily on activity ahead, and growth is projected to slow from the end of 2023 and remain low in 2024.
Saving ratios. Percent
Policy rates are assumed to move in line with market policy rate expectations, and commodity prices are assumed to move in line with futures prices. In both the US and Europe, a fall in policy rate expectations and lower energy prices will contribute to lifting activity somewhat in 2024 compared with the projections in the September Report.
Some fiscal tightening is assumed between 2023 and 2024. Higher defence spending and energy investment in Europe are likely to boost activity over the projection horizon. Growth in China is expected to slow in the coming years on the back of a weak real estate market, low demand for Chinese goods and the high debt levels facing the local government sector, real estate companies and state-owned firms. Trading partner GDP growth is projected to slow from 3.3% in 2022 to 1% in 2023, before annual growth picks up in 2025 (see Annex Table 1). The projections for 2023 and 2024 have been revised up slightly since the September Report.
Uncertainty surrounding the economic outlook
The full economic effects of the rate hikes are yet to be seen, and there is considerable uncertainty related to the response of households and firms to both substantial price increases and the rapid rise in interest rates that are now behind us. If wage earners are compensated for the high level of inflation to a larger extent than expected, or if firms increase their margins, price and wage inflation could prove higher than currently projected. To bring inflation down to target, central banks may have to keep their policy rates high for longer than currently assumed. The ongoing wars in some parts of the world, together with uncertainty surrounding economic developments in China, also add to the uncertainty about international developments ahead.
Lower energy prices
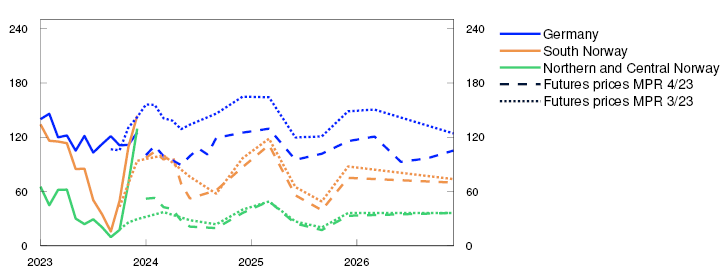
Spot and futures prices for oil have fallen since the September Report. Spot prices for gas and electricity on the continent are little changed, while futures prices have moved lower. Electricity prices in Norway have risen from the low levels in September, but futures prices further out are lower than in the September Report.
Oil prices have fallen since September (Chart 1.A). Despite the pick-up in global oil consumption, oil inventories have not fallen as much as expected owing to strong growth in non-OPEC+ oil production. Oil inventories could increase again in the first half of 2024. To prevent an increase in oil inventories and underpin oil prices, a number of OPEC+ countries decided at the end of November to increase oil production cuts for 2024 Q1. In addition, Saudi Arabia and Russia extended their additional cuts for the same period.
Chart 1.A Lower oil and gas prices1

USD/barrel
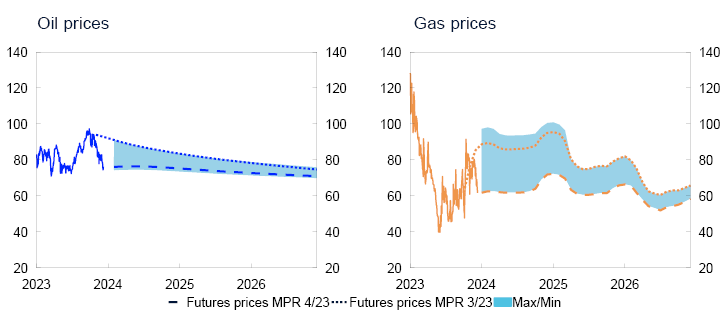
Oil futures prices have also declined since September and indicate that oil prices will edge down ahead (Table 1.A). The war between Israel and Hamas in Gaza has so far had little effect on oil production in the Middle East. If the war were to have larger regional consequences, the prospects for oil prices could change.
Table 1.A Energy prices
|
Percentage change from projections in Monetary Policy Report 3/23 in brackets |
Average price (2010–2019) |
Actual prices and futures prices1 |
|||||
|
2021 |
2022 |
2023 |
2024 |
2025 |
2026 |
||
|
Oil, USD/barrel |
80 |
71 |
101 |
82 (-3) |
76 (-13) |
74 (-9) |
72 (-6) |
|
Dutch gas, USD/barrel |
40 |
87 |
205 |
70 (-1) |
64 (-28) |
64 (-21) |
57 (-15) |
|
Petroleum2, USD/barrel |
63 |
85 |
163 |
77 (-2) |
70 (-21) |
69 (-15) |
65 (-10) |
|
Coal, EUR/tonne |
66 |
102 |
290 |
118 (0) |
102 (-16) |
103 (-15) |
101 (-16) |
|
Emission allowance prices, EUR/tonne |
10 |
53 |
81 |
83 (-2) |
69 (-19) |
72 (-19) |
75 (-19) |
|
German electricity, øre/kWh |
36 |
106 |
258 |
120 (-3) |
108 (-27) |
111 (-20) |
105 (-15) |
|
Nordic electricity, øre/kWh |
32 |
64 |
142 |
70 (12) |
58 (0) |
51 (-12) |
50 (-4) |
|
Electricity in South Norway, øre/kWh |
31 |
78 |
206 |
88 (8) |
80 (-3) |
70 (-12) |
70 (-6) |
|
Electricity in Northern Norway and Central Norway, øre/kWh |
32 |
40 |
38 |
47 (31) |
34 (5) |
31 (-6) |
36 (1) |
Sources: LSEG Datastream and Norges Bank
The European gas benchmark price is little changed since September but is much lower than one year ago (Chart 1.A). Gas consumption in Europe has decreased over the past year, and the supply of liquefied natural gas (LNG) has been adequate. Gas inventories have increased considerably and are at a high level for this time of year. Nevertheless, the fact that prices are little changed since September reflects special circumstances on the supply-side, such as the reduction of gas production in the Eastern Mediterranean, damage to the gas pipeline between Estonia and Finland and uncertainty related to LNG exports from Australia. The recent cold, calm and dry weather has also contributed.
Gas futures prices are lower than at the time of the September Report. High gas inventories could dampen a price rise if gas consumption were to pick up markedly in the course of winter or if LNG supply to Europe were to be reduced. Nevertheless, futures prices are higher than before Russia’s invasion of Ukraine, reflecting continued uncertainty about the gas supply facing Europe.
European wholesale electricity prices are little changed since September but are much lower than one year ago. The decline since 2022 reflects the fall in gas prices and the increased supply of nuclear and hydroelectric power and, at times, wind and solar power. In addition, emission allowance prices have fallen. The fact that wholesale electricity prices show little change since September reflects gas price developments and the recent cold, calm and dry weather.
European electricity futures prices are lower than at the time of the September Report, in line with developments in gas futures prices. Futures prices suggest that prices will be lower ahead than in 2022 but nevertheless remain at a level around three times the average for the period between 2010 and 2019.
Norwegian electricity prices have risen from the low levels in September (Chart 1.B). Cold, calm and dry weather through late autumn and at the beginning of winter have contributed to a drop in water reservoir levels. Nevertheless, futures prices for 2024 Q1 are broadly unchanged from the September Report for the southern parts of the country. For Northern Norway, futures prices for 2024 Q1 are higher than in September. As in continental Europe, futures prices for Norway further out are lower than in September. Nevertheless, futures prices for South Norway indicate prices ahead that are two to three times the average for the period between 2010 and 2019. Futures prices imply that prices in Northern Norway will be appreciably lower than in South Norway ahead.
Øre/kWh
2. Financial conditions
A higher policy rate is contributing to tighter financial conditions than at the time of the September 2023 Monetary Policy Report, but a fall in market policy rate expectations ahead is pulling in the opposite direction. The average residential mortgage rate is projected to rise to around 5.7% in 2024. The krone has been weaker that projected in the September Report.
2.1 The policy rate and market policy expectations
Market policy rate expectations edged up in September, after the policy rate was raised to 4.25% and the forecast was revised up somewhat. Since then, market expectations have varied as new information on economic developments has come to light. At the same time, lower policy rate expectations among Norway’s trading partners have likely contributed to reducing policy rate expectations in Norway. Overall, market policy rate expectations ahead are lower than the forecast in this Report, especially for 2024 and 2025.
2.2 Interest rates facing households and firms
Household interest rates have risen further
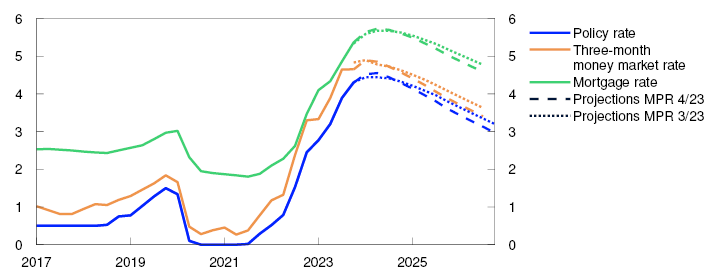
The average residential mortgage rate was 5.3% at the end of October, about 0.7 percentage point higher than in June (Chart 2.1). The average residential mortgage rate includes all floating- and fixed-rate loans. Quoted rates on new loans from Finansportalen indicate a further rise in mortgage rates since October. From the beginning of the tightening cycle in autumn 2021 until the end of October, around 90% of the increase in the policy rate passed through to mortgage rates. Broadly the same developments in the residential mortgage rate relative to the policy rate are expected in the period ahead. The policy rate forecast in this Report implies that the average residential mortgage rate will rise to 5.7% in 2024, before edging down in 2025.
Interest rates. Percent
From the beginning of the tightening cycle in autumn 2021 until the end of October this year, the average deposit rate rose by only 2.3 percentage points. Looking ahead, the average deposit rate is projected to approach the policy rate as competition in the market for deposits intensifies. This will contribute to a gradual fall in the total spread between banks’ lending and deposit rates towards a more normal level.
Higher borrowing costs for firms
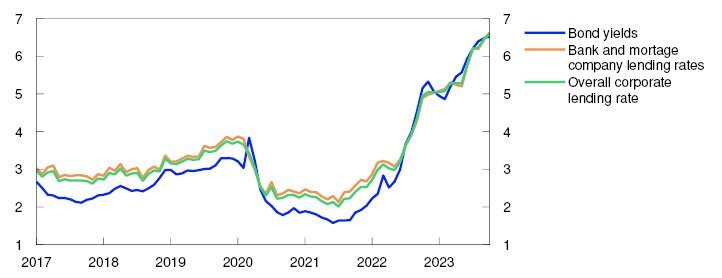
At the end of October, the interest rate on new floating-rate corporate loans was 6.6%, measured as a weighted average of bank and bond debt (Chart 2.2). Between June and October, the average rate rose by around 0.9 percentage point.
Interest rates on new floating-rate NOK finance for non-financial corporates. Percent
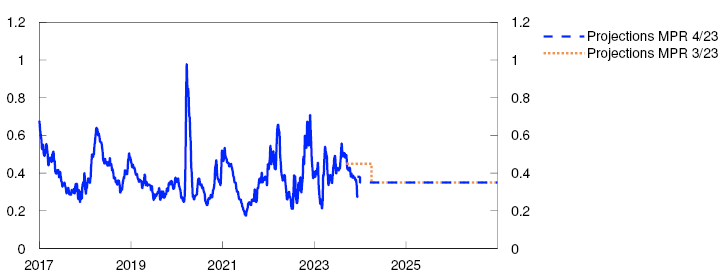
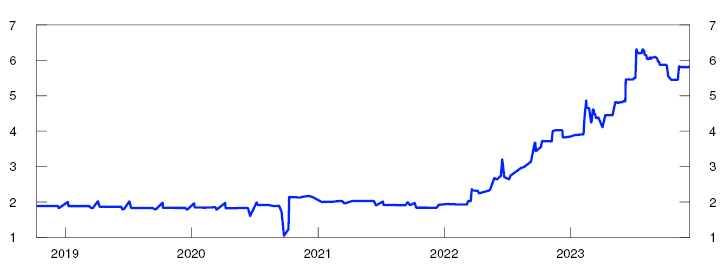
The interest rate on corporate bank loans is usually based on three-month Nibor, which has fallen since September, among other reasons because the risk premium in Nibor in excess of the expected policy rate has fallen (Chart 2.3). This money market premium is assumed to be unchanged in the years ahead at a slightly higher level than the current premium. The projections are close to the market’s pricing of the premium in forward money market rates.
Money market premium. Percentage points
Firms that borrow at a floating rate pay a margin above Nibor that partly reflects the individual firm’s credit risk. The average margin on new bank loans edged up between June and October.
Larger firms often combine bank loans with bond issuances. Risk premiums on corporate bonds are little changed since the September Report, for both banks and non-financial corporates. Premiums are particularly high for commercial real estate (CRE) firms, but premiums for this sector have fallen a little since the September Report. This likely reflects the recent renewed fall in long-term interest rates.
The rise in interest rates will not affect firms that borrow at a fixed rate, until their loans are refinanced. New fixed-rate corporate loans are priced based on swap rates with the corresponding tenor. Both short- and long-term swap rates have fallen since the September Report. Developments in swap rates in Norway have largely followed developments in corresponding international rates.
The Oslo Børs Benchmark Index is little changed overall since the September Report. The performance of sub-indexes has been mixed, but owing to the decline in the petroleum sector, the benchmark equity index in Norway has underperformed similar equity indexes in a number of other countries.
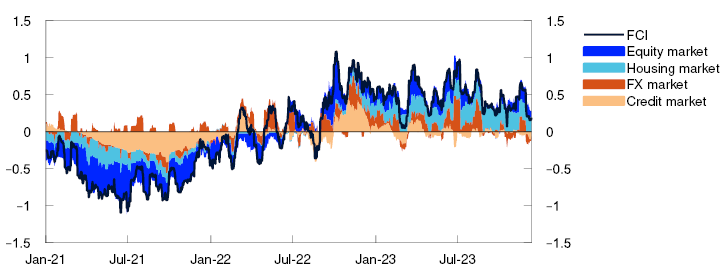
The fall in policy rate expectations for the coming years is contributing to looser financial conditions than at the time of the September Report. Other financial conditions of importance for households, banks and other firms have changed less overall. This is expressed in Norges Bank’s Financial Conditions Index (FCI), which has not changed substantially since September (Chart 2.4). According to the FCI, these other financial conditions were still a little tighter than their historical average, but the level is not particularly high.
Financial conditions index. Standard deviation from mean
2.3 Household and corporate access to credit
Growth in credit to households and corporates is now markedly lower than its historical average. In real terms, 12-month growth in credit to households has been negative since spring 2022 and is at its lowest since the beginning of the 1990s. Lower household demand for credit is probably due to higher interest rates and reduced housing market activity. Growth in credit to non-financial corporates fluctuates more over time. Since the beginning of 2023, it has also declined fairly markedly and in October was a little above 3%. The fall likely reflects the slowdown in business investment (see discussion in Section 3.1).
Creditworthy households and firms appear to have ample access to credit, reflecting the fact that Norwegian banks are solid, liquid and highly profitable. In Norges Bank’s lending survey for 2023 Q3, banks as a whole reported unchanged credit standards, and they do not expect any changes for the current quarter either. The exception is CRE, where banks report a somewhat higher risk that firms will breach the terms of existing loan agreements and are setting stricter equity and debt servicing capacity requirements for new loans (see further discussion in Financial Stability Report 2023 – H2).
2.4. Krone exchange rate
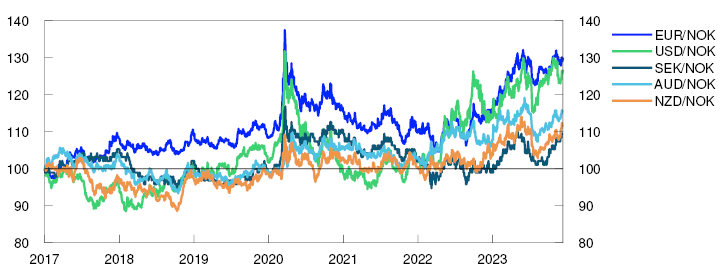
Measured by the import-weighted exchange rate index I-44, the krone depreciated by around 10% over the past year. The depreciation has been most marked against the euro and the US dollar (Chart 2.5). The krone depreciation against the US dollar has been ongoing since mid-2021, and a US dollar is nearly 30% more expensive in NOK terms than it was then. Over the past year, the krone has also depreciated against the currencies of other small open economies.
Index. 2 January 2017 = 100
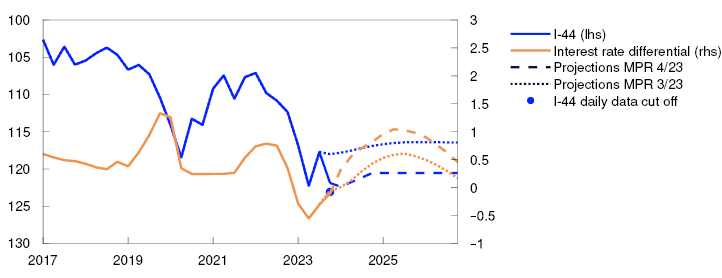
In the period since the September Report, the krone depreciated by around 4% measured in terms of the import-weighted exchange rate index I-44. The krone depreciation has coincided with a fall in oil spot and futures prices and in gas futures prices. The interest rate differential against Norway’s main trading partners is little changed since September but is still low in a historical perspective. The krone has depreciated somewhat more than implied by developments in the interest rate differential and petroleum prices. In the September Report, the krone was projected to appreciate a little between Q3 and Q4. So far in Q4, the krone has on average been around 3% weaker than projected.
The krone exchange rate is projected to appreciate somewhat in the near term, as the policy rate in this Report is higher than market policy rate expectations. The krone exchange rate is then assumed to remain fairly unchanged further out in the projection period (Chart 2.6). The projections are somewhat weaker than in the September Report. However, the Bank’s projections imply a slight appreciation of the real krone exchange rate, since in the coming years, inflation in Norway is projected to be somewhat higher than among trading partners.
Import-weighted exchange rate index (I-44). Difference between policy rate in Norway and among trading partners. Percentage points
The projections for the krone exchange rate are highly uncertain. Movements in the krone exchange rate may differ from the assumptions in this Report, in response to both a change in policy rate expectations and shifts in foreign exchange market risk premiums.
3. The Norwegian economy
Inflation is markedly above the target of 2%. Unemployment is low but has risen slightly since 2022. The employment rate is high.
Higher interest rates are dampening activity in the Norwegian economy and together with weaker international price impulses and lower energy prices, they will contribute to curbing inflation ahead. At the same time, a weaker krone and continued high wage growth contribute to keeping inflation elevated. Unemployment is expected to edge up.
3.1 Output and demand
Weak mainland economic growth
The Norwegian economy is assessed to have reached the peak of the upturn about one year ago. Growth has since slowed, and between 2023 Q2 and Q3, Norwegian mainland GDP was close to unchanged. Growth has been slightly weaker than projected in the September 2023 Monetary Policy Report.
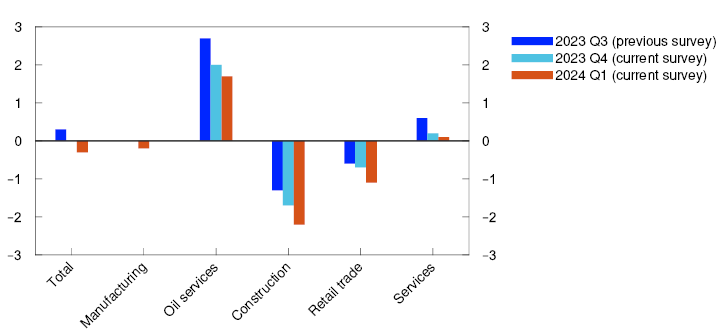
Overall, Norges Bank’s Regional Network contacts expect activity to remain unchanged in 2023 Q4 too, before declining in 2024 Q1 (Chart 3.1). There are still wide variations across industries. Oil services contacts expect high activity growth ahead owing to increased investment in Norwegian and foreign petroleum activity. On the other hand, construction activity has declined further, largely reflecting weak new home sales. Retail trade contacts also expect a further decline in activity ahead. The decline in construction and retail trade is now also dampening demand in other sectors, with services contacts now expecting lower growth.
Expected output growth according to the Regional Network. Seasonally adjusted. Percent
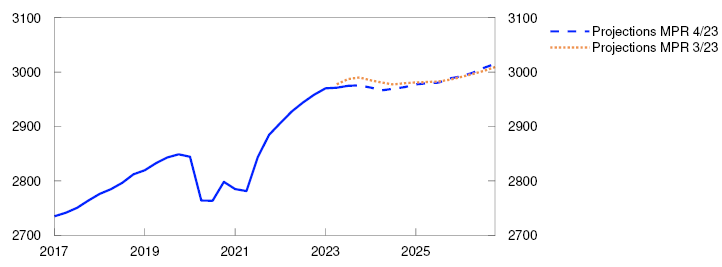
In line with information from Regional Network contacts, activity is set to decline through winter. Overall mainland GDP growth is projected to be 1% in 2023, with activity remaining broadly unchanged in 2024 (Chart 3.2). The projections for mainland GDP growth for 2023 and 2024 have been revised down slightly compared with the September Report.
GDP for mainland Norway. Annual change. Contribution to annual change. Percentage points
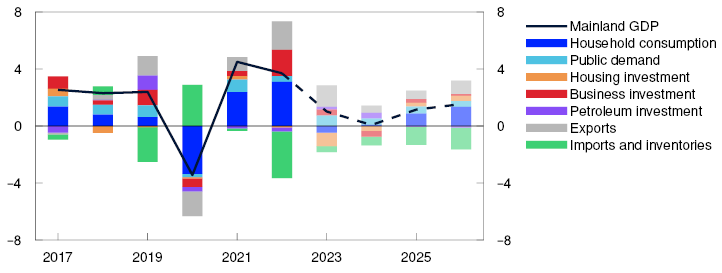
Higher interest rates and high inflation have dampened demand in the Norwegian economy, and weak developments in household consumption and housing investment are expected in 2023 and 2024. On the other hand, the krone depreciation has improved Norwegian firms’ cost competitiveness, which pulls in the direction of increased exports. A high level of activity in petroleum-related industries will boost activity in both 2023 and 2024, as will prospects for rising public demand throughout the projection period. Through 2025 and 2026, economic activity is expected to pick up gradually, primarily owing to higher private consumption. Mainland GDP projections for the years ahead are little changed from the September Report.
Weaker purchasing power curbs consumption
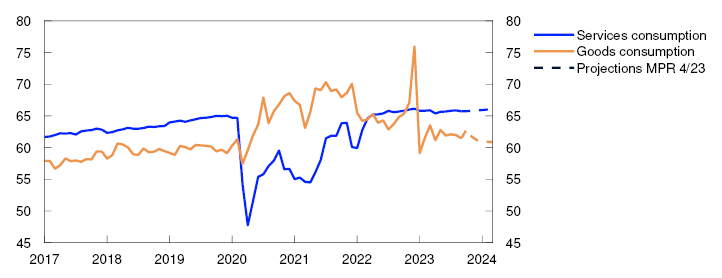
Household consumption fell markedly at the beginning of 2023 but has since edged up. In 2023 Q3, services consumption and spending abroad rose in particular, while goods consumption fell (Chart 3.3). Card transaction data suggest that goods consumption fell slightly further in November following a rise in October, while services consumption has remained broadly unchanged.
Household consumption of goods and services. Constant 2021 prices. Seasonally adjusted. In billions of NOK
Weak real wage growth and higher interest expenses are projected to lead to a fall in real household disposable income of 1.5% in 2023. Real wage growth is set to increase in 2024. Higher interest expenses and lower employment dampen purchasing power. The projection for growth in real disposable income in 2024 is approximately unchanged from the September Report, but owing to revisions back in time, the projection for the level of household purchasing power has been revised down. Owing to reduced household sector purchasing power, consumption falls in 2023 and declines further through winter and spring in 2024. This is consistent with information from the Regional Network, where household services contacts expect weak growth, while retail trade contacts expect a marked decline.
From 2025, lower inflation and higher employment lead to an increase in household real disposable income. Lower interest rates will also reduce household interest expenses further out. Higher real disposable income lifts consumption growth towards the end of the projection period. Overall, the projections for both household consumption and real disposable income are lower than in the September Report.
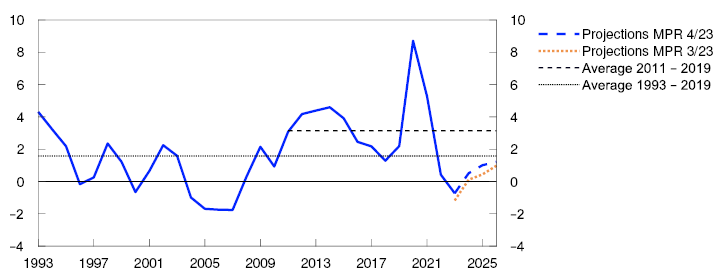
The saving ratio has fallen through 2023 and was negative in 2023 Q2 and Q3 (Chart 3.4), which means that households have maintained consumption either by drawing on savings or by borrowing. The Bank’s analyses of household tax returns for 2022 indicate that most households drew on bank deposits through 2022.4 In the projections, households draw on savings through 2024 before the saving ratio gradually moves up.
Household saving ratio excluding dividends. Percent
Marked fall in housing investment
House prices have held steady through autumn and have been higher than anticipated in September. Existing home sales have been approximately at a normal level, while the stock of unsold homes has increased.
House prices are set to be approximately unchanged in 2023 and fall slightly in the beginning of 2024 in response to higher lending rates and a faster increase in the stock of unsold homes than in turnover. In the projections, weak house price developments combined with high inflation leads to a marked fall in real house prices (Chart 3.5). House price inflation accelerates thereafter, partly owing to low residential construction activity and because mortgage rates are expected to stabilise and decline further out. The projections for both nominal and real house prices are little changed since the September Report.
Housing investment and real house prices. Annual change. Percent
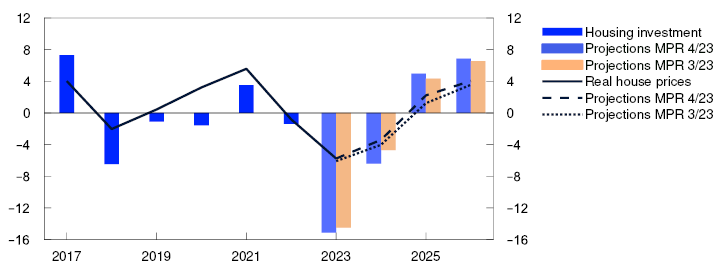
Housing investment has fallen markedly since spring 2022. The decline deepened in 2023 Q3, when the level was a little more than 20% lower than in 2022 Q1. The fall reflects weak developments in new home sales and higher construction costs. Higher interest rates are also dampening housing investment (see "The interest rate sensitivity of consumption and investment"). Housing investment is expected to continue to fall in 2024 H1. Against the background of lower interest rates, higher house prices and a slower rise in construction costs relative to other prices, a rise in housing investment is expected through autumn 2024. Further out, housing investment is projected to rise further, but the level is slightly lower than in the September Report.
Household interest burdens have risen substantially
The policy rate has been raised considerably over the past two years. Higher interest rates combined with high debt burdens, primarily at floating rates, have contributed to a marked rise in household interest expenses (Chart 3.6). This has reduced household disposable income, which is partly why many households have to tighten consumption. Norges Bank’s analyses nevertheless indicate that the vast majority of households have the financial means to cope with higher interest expenses.7 Interest burdens are expected to increase slightly further through 2024 before declining gradually further out in the projection period as a consequence of a lower debt ratio and lower policy rate over time.
Percent
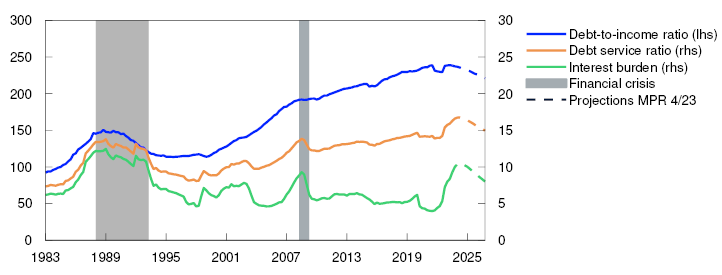
Household borrowing has declined since summer. Owing to higher interest rates, lower residential construction activity and lower house prices, credit is also projected to rise less than income in the years ahead. This means that household debt ratios are expected to decline further out in the projection period. The projections for household borrowing and interest burdens are little changed compared with the September Report.
Lower business investment in 2024
Mainland business investment has increased substantially since 2020 (Chart 3.7) but declined in 2023 Q3. Mainland business investment is projected to fall further through 2024, owing to higher interest rates, strong cost growth and the rapid growth in investment in recent years. It is primarily services sector investment that is set to fall, in line with information from Regional Network contacts and empirical relationships between interest rates and investment (see "The interest rate sensitivity of consumption and investment"). The decline in business investment is expected to be cushioned by higher investment in manufacturing and power supply ahead as part of the climate and energy transition. Lower business investment is curbing demand for credit.
Business investment in mainland Norway. Annual change. Contribution to annual change. Percentage points
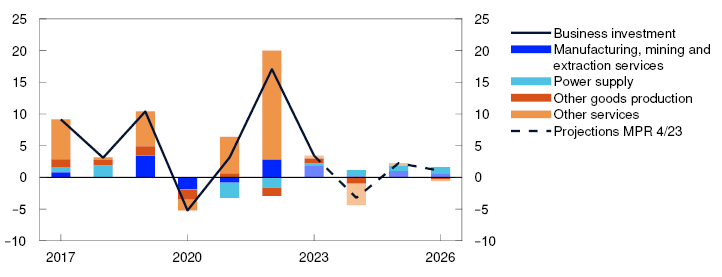
The projections for business investment and corporate credit have been revised up somewhat since the September Report, as interest rates further out are expected to be somewhat lower than in the September Report. However, the projections for investment in manufacturing and electricity production have been revised down owing to the delay or cancellation of a number of projects in these sectors.
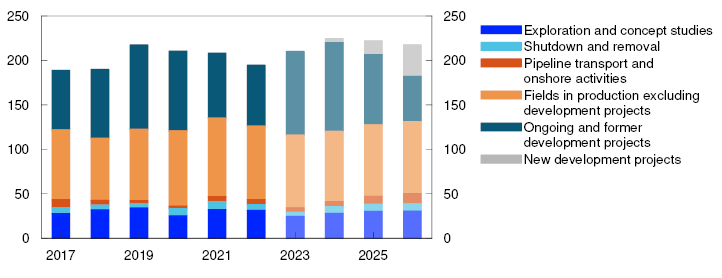
Investment in the oil and gas sector has increased considerably in 2023 after falling over several years. Oil and gas sector investment is expected to increase sharply in 2024 before edging lower in the next few years (Chart 3.8). The increase reflects the launch of a number of development projects in 2022 in response to the petroleum tax package and high oil and gas prices. Petroleum investment is projected to be higher in 2023 and 2024 than projected in the September Report, as the forecast for ongoing development projects has been raised in the light of the investment intentions survey for Q4. Overall investment is then expected to be somewhat lower than projected in September, reflecting some decline in oil and gas prices in recent months. This effect will be dampened by the fact that prices are still high enough to ensure good profitability for oil companies and for new petroleum projects.
Petroleum investment. Constant 2023 prices. In billions of NOK
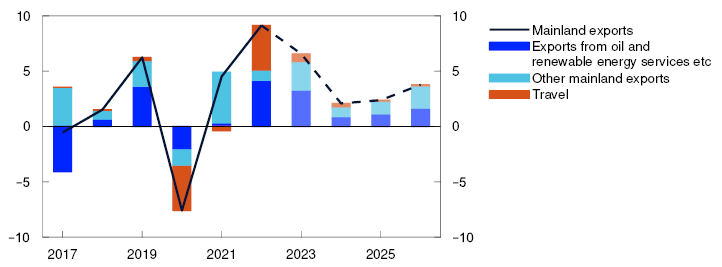
Continued export growth
Mainland exports increased considerably in 2022, and the rise has continued so far in 2023. Export growth has been driven in particular by increased foreign tourism in Norway and increased exports from providers of services to oil, gas and renewable energy companies (Chart 3.9). Growth in tourism and oil services exports are expected to be less pronounced in 2024, while growth in other mainland exports is expected to be weak on the back of weak growth abroad despite the weaker krone over the past year. Further ahead, export growth is projected to be higher on the back of increased growth among Norway’s trading partners and higher demand facing the Norwegian renewables providers. Overall, the projections for export growth ahead are slightly higher than in the September Report, as the krone is projected to be weaker than in September.
Mainland exports. Percent. Contribution to annual change. Percentage points
Imports picked up markedly through 2022, driven by higher demand and increased travel abroad. So far in 2023, imports have fallen slightly, and weak demand and a weaker krone are expected to keep imports broadly unchanged for the rest of 2023 and into 2024. Further out in the projection period, imports are expected to pick up again in pace with higher activity in the Norwegian economy. The import projections are lower than in the September Report, primarily reflecting a weaker krone throughout projection period.
Higher public sector demand
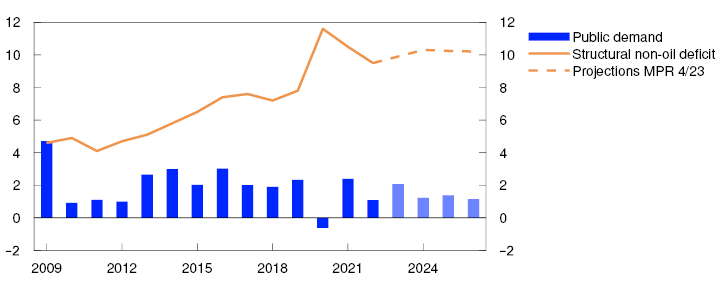
Public sector demand has increased so far in 2023, driven in particular by high consumption growth in the local government sector. Growth is expected to slow somewhat in 2024. This is in line with the central government budget for 2024, which entails lower growth in public demand than in 2023. Further out, growth is assumed to remain broadly unchanged. In isolation, prospects for lower capacity utilisation suggest that public demand will be sustained.
The structural non-oil deficit as a percentage of trend GDP has declined somewhat since the pandemic (Chart 3.10). The deficit is expected to increase slightly in 2023. The increase in the deficit is assumed to slow slightly thereafter. The projections for public spending and the structural non-oil deficit are little changed since the September Report.
Public demand. Annual change. Structural non-oil deficit. Share of trend mainland GDP. Percent
The projections are uncertain
The wide differences across industries make it difficult to interpret the growth prospects for the overall economy. There is also considerable uncertainty related to households’ response to higher prices and higher interest rates. Household interest expenses have risen considerably through 2023 and are expected to rise further in 2024. If households reduce their consumption more than the Bank’s analyses suggest, the economic slowdown could be more abrupt than envisaged. The longer-term effects of monetary policy on business investment are also uncertain (see "The interest rate sensitivity of consumption and investment"). If the rise in the policy rate affects investment with a longer lag than assumed, mainland economic growth could be lower ahead than projected.
On the other hand, the effects of a weaker krone are also uncertain. If the krone depreciation stimulates export industries more than assumed, employment and thereby consumption could receive a boost. In that case, mainland economic growth may prove higher ahead than projected.
SMART – System for Model Analysis in Real Time
Empirical models are an important tool for forecasting developments in the Norwegian and international economy. The System for Model Analysis in Real Time (SMART) is Norges Bank’s platform for forecasting models. In SMART, forecasts from a broad set of empirical models are averaged based on their historical forecasting properties. The SMART forecasts for GDP have been revised down from the September Report. The model forecasts for CPI-ATE inflation are little changed.
The economics literature shows that averaged forecasts from several models are often more accurate than forecasts from individual models. In SMART, we average information from many models for CPI-ATE inflation and mainland GDP based on how well the models have previously forecast economic developments. Read more about SMART in Staff Memo 7/2023.1 Forecasts from models are an important tool in evaluating the outlook for the Norwegian economy, but multiple factors may contribute to differences between the model forecasts and the final projections. For example, deviations may be due to judgement-based assessments of drivers that differ from what the historical relationships would suggest.
The SMART forecasts for inflation, measured as the four-quarter change in the CPI-ATE, are little changed compared with the September Report (left panel in Chart 3.A). SMART indicates that inflation will remain high but is on the decline ahead. The modelling system forecasts a four-quarter change of 5.8% in 2023 Q4 and 5.3% in 2024 Q1. The small changes in the forecasts largely reflect the fact that actual inflation has been in line with the SMART forecasts in the September Report.
Four-quarter change. Percent
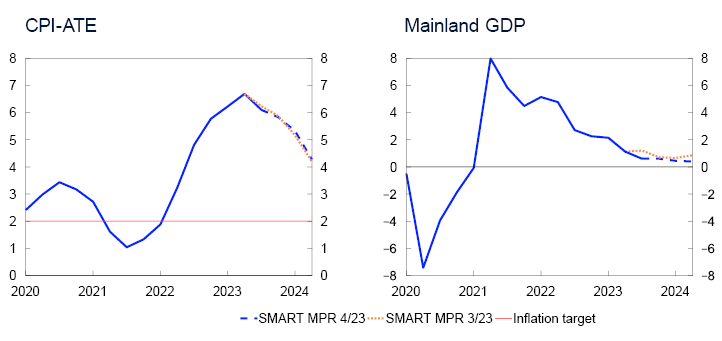
The SMART mainland GDP forecasts are lower than in the September Report (right panel in Chart 3.A). SMART forecasts four-quarter growth of 0.6% in 2023 Q4 and 0.4% in 2024 Q1. The downward revision of the SMART mainland GDP forecasts largely reflects weaker reported activity than the modelling system expected in Q3.
The forecasts for 2023 Q4 have been revised up substantially since the beginning of 2022, in pace with accelerating inflation (Chart 3.B). The forecast for Q4 was at its highest at the end of July. After lower inflation data for July were published on 10 August 2023, the forecast for Q4 has gradually declined.
SMART forecasts for CPI-ATE in 2023 Q4 at different times. Four-quarter change. Percent
3.2 Labour market
Employment is high
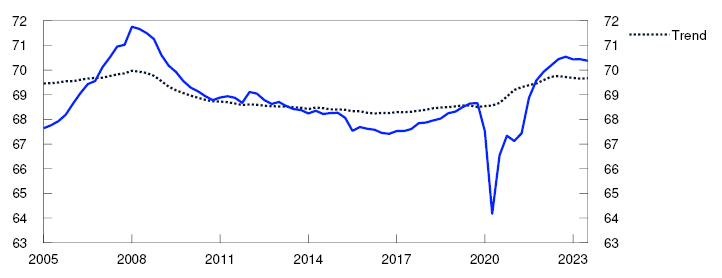
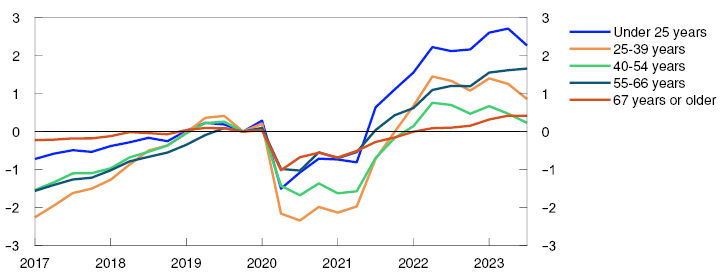
Unemployment is low, and the employment rate is high (Chart 3.11). Relative to pre-pandemic rates, employment has increased for all age groups, particularly youth employment (Chart 3.12). In recent years, the immigrant employment rate has also increased considerably.
Employed as a share of the population aged 15–74. Percent
Change in employment rate from 2019 Q4. Percentage points
There are now signs of easing labour market pressures. After expanding briskly for a period, employment has been rising at a slower pace since the turn of the year. In 2023 Q3, employment was slightly lower than projected in the September Report.
Unemployment has picked up gradually from its lowest level in summer 2022. In recent months, unemployment has shown little change, in line with projections in the September Report. In November, 53 100 persons were registered as fully unemployed, ie 1.9% of the labour force adjusted for normal seasonal variations. After unemployment began to rise, there has been a particular increase in the number of unemployed in construction. The share of unemployed has also risen somewhat across most other occupations. Some of the rise reflects the increased number of Ukrainians that have entered the labour market over the past year.
The fact that there are slightly more unemployed and more people in work than in 2022 implies an increase in the total labour supply, which partly reflects increased immigration and a small rise in the number of temporary foreign workers over the past year.
Improved labour supply
Labour demand remains high, but firms are finding it easier to recruit staff. The share of enterprises in Norges Bank’s Regional Network reporting shortages of qualified labour fell markedly in the period between 2023 Q3 and Q4 and is now slightly below its historical average (Chart D). Recruitment difficulties have eased in all sectors except for oil services.
On the other hand, the number of job vacancies is still high. The number of vacancies in Statistics Norway’s job vacancy survey remained at a high level in 2023 Q3. NAV statistics, which measure the number of new vacancies, remained elevated after edging down earlier in 2023.
Unemployment has remained low
Administrative data indicate that employment rose further in October, while lower capacity utilisation among Regional Network contacts suggests weaker employment prospects, and contacts expect employment to begin declining after the new year. Norges Bank’s Expectations Survey also points to weaker employment ahead. Low growth prospects for the Norwegian economy suggest that employment will decline through 2024. Employment is expected to rebound further ahead on the back of higher activity growth.
The number of temporary foreign workers has declined in 2023. There were approximately 4 500 fewer temporary foreign workers, adjusted for seasonal variations, in Q3 than at the beginning of the year. Developments have been weaker than envisaged in the September Report. The number of temporary foreign workers is expected to rise slightly in the coming years. The krone depreciation over the past year may dampen this rise, but it is highly uncertain how strong this effect will be.
Owing to the war in Ukraine, the number of Ukrainians in Norway has risen markedly. The Norwegian authorities expect this number to increase further in 2024, and the projection for 2024 has been revised up since the September Report. The number of Ukrainians that have found work has risen somewhat, but it will likely take some time for most of this group to enter the labour market.
Employed in thousands. Seasonally adjusted
Sources: Statistics Norway and Norges Bank As employment growth is expected to be weak in the coming years unemployment is set to edge up. Unemployment is projected to rise to around 2.3% in the course of the next few years, remaining close to this level thereafter. Unemployment will then be broadly at pre-pandemic levels. The unemployment projections are slightly lower than in the September Report throughout the projection period. This reflects our assessment that labour market efficiency has continued to improve, and the unemployment level consistent with output at potential is estimated to be just over 2% (see box below).
Registered unemployed as share of the labour force. Seasonally adjusted. Percent
Capacity utilisation is declining
Capacity utilisation has declined recently, with output falling towards potential. There are prospects that output will remain below potential throughout the projection period. The near-term projection is a little lower than in the September Report.
The output gap is a measure of the percentage difference between actual output (mainland GDP) and potential mainland output. Potential output is determined by productivity growth and potential employment. Potential employment can be interpreted as the highest level of employment that can be maintained over time without driving up wage growth and inflation. Since the output gap cannot be observed, the Bank estimates the output gap based on an overall assessment of various indicators and models, where particular weight is given to labour market developments.
Output was assessed as being well over potential through 2022 (Chart 3.C). In this period, unemployment was low, job vacancies were high, wage growth accelerated and a large share of Norges Bank’s Regional Network enterprises reported capacity constraints.
Percent
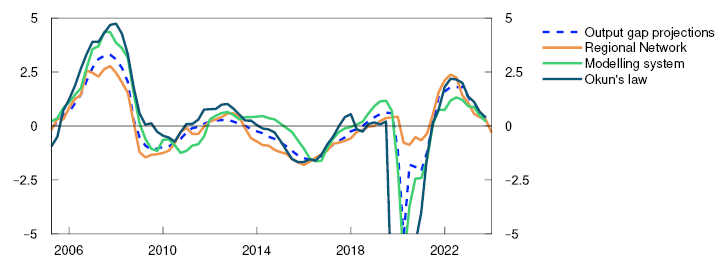
There are a number of signs that capacity utilisation has declined through 2023. Growth in the Norwegian economy has fallen, and unemployment has edged higher. The share of Regional Network enterprises reporting capacity constraints and labour shortages has declined markedly in Q4 and is now a little lower than its historical average. This indicates that capacity utilisation may fall faster in the months ahead than envisaged earlier. On the other hand, unemployment remains low and below what was previously estimated to be consistent with output at potential.
The fact that enterprises are reporting that it is easier to recruit needed labour while unemployment remains so low may indicate that the labour market is more efficient than previously assumed. Regional Network and labour market signals are being interpreted as evidence that the level of unemployment consistent with output at potential is a little lower than estimated earlier. This level is now estimated to be just above 2%. This may be due to a number of factors, such as the fact that technological advances have made it easier to match job vacancies with relevant job seekers. A larger number of immigrants and a higher educational attainment level in the labour force may also have contributed to increasing labour market flexibility.
Norges Bank’s modelling system for estimating the output gap, which is based on information about such variables as mainland GDP, unemployment, wage growth and domestic inflation, indicates a decline in capacity utilisation in 2023 Q4. In the Bank’s overall assessment, the output gap has declined to 0.3% in Q4, a little lower than in the September Report. As labour market indicators are pointing in different directions, the output gap estimate is uncertain.
Looking ahead, activity is set to slow and capacity utilisation to be lower on the back of a decline in household consumption and lower investment. The output gap is projected to bottom out at negative 0.8% at the end of 2025. Compared with the September Report, the capacity utilisation projections are a little lower in 2024 and little changed thereafter.
In recent years, productivity developments have been weak across most sectors and have been lower than expected (Chart 3.D). The projection for potential output has therefore been revised down somewhat for 2024 (Table 3.A). In addition, potential employment is projected to be somewhat lower in the near term, owing to a smaller number of temporary foreign workers and because it takes some time before the Ukrainian refugees find work. Potential output growth in 2025 and 2026 has been revised up, reflecting prospects for slightly higher population growth.
Productivity. Quarterly change. Moving average. Percent
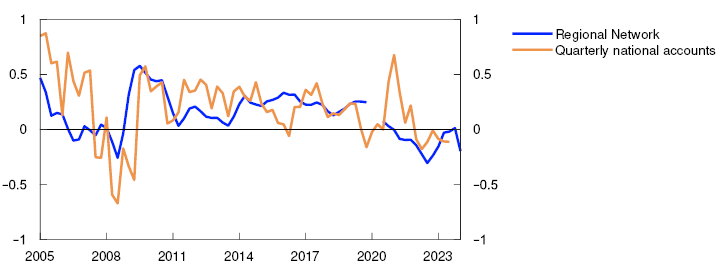
Table 3.A Output and potential output1
|
Change from projections in Monetary Policy Report 3/23 in brackets |
Percentage change from previous year |
|||||
|
1995–2009 |
2010–2022 |
2023 |
2024 |
2025 |
2026 |
|
|
GDP, mainland Norway |
3.1 |
2.0 |
1.0 (-0.3) |
0.1 (-0.2) |
1.2 (0.4) |
1.5 (0.1) |
|
Potential output |
3.1 |
1.8 |
2.0 (-0.2) |
1.2 (-0.2) |
1.5 (0.2) |
1.5 (0.1) |
|
Potential employment |
0.8 |
1.1 |
1.1 (-0.4) |
0.8 (0.1) |
0.9 (0.2) |
0.9 (0.2) |
|
Trend productivity |
2.3 |
0.7 |
0.8 (0.1) |
0.5 (-0.1) |
0.6 (0.0) |
0.6 (0.0) |
The modelling system for the output gap includes information about GDP, employment, unemployment, wage growth, inflation, investment, house prices and credit. For a more detailed description of the models, see Furlanetto et al (2023) “Norges Bank Output Gap Estimates: Forecasting Properties, Reliability, Cyclical Sensitivity and Hysteresis.” Oxford Bulletin of Economics and Statistics, 85.1, 238–267. Okun’s law is calculated with the following formula: 


3.3 Prices and wages
Inflation is high
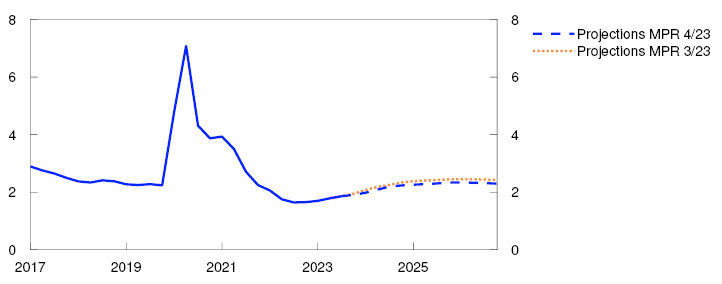
Consumer price inflation has receded since spring but is still high (Chart 3.15). In November, the consumer price index (CPI) was 4.8% higher than in the same month one year earlier. This was 0.6 percentage point lower than projected in the September Report, primarily reflecting lower-than-expected energy prices.
CPI and underlying inflation indicators. Twelve-month change. Percent
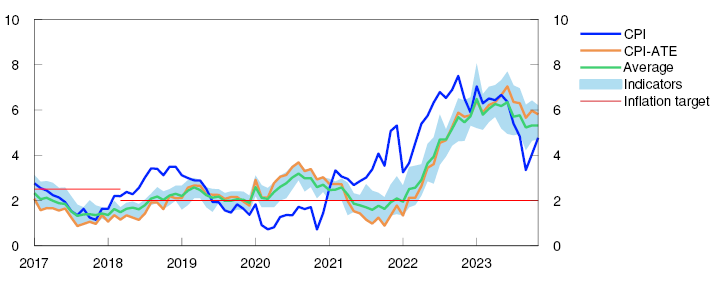
The 12-month rise in the CPI adjusted for tax changes and excluding energy products (CPI-ATE) is also lower than this spring but has fallen more slowly than overall inflation. In November, the 12-month rise in the CPI-ATE was 5.8%, lower than projected in the September Report. Other underlying inflation indicators have also decreased since the peak in spring.
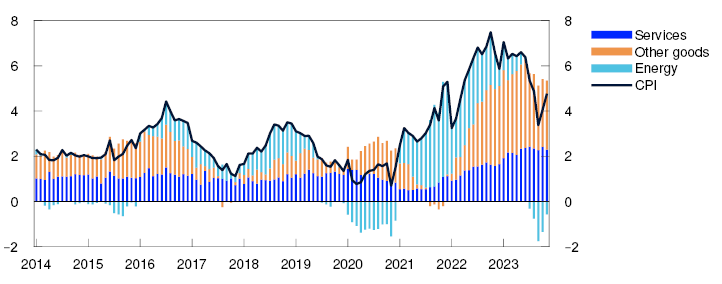
Goods inflation has slowed since 2023 H1 but remains high. Services inflation has remained elevated, partly reflecting the continued rise in rent inflation.
Lower energy prices dampen inflation
Through 2021 and 2022, energy prices rose markedly and pushed up inflation considerably (Chart 3.16). Since spring, energy prices have fallen. Lower energy prices have been pulling down CPI inflation and are expected to dampen CPI-ATE inflation somewhat further out.
CPI. Twelve-month change. Percent. CPI subcomponents. Percentage points
Projections for consumer energy prices are based on futures prices for electricity and petroleum products and also take into account other factors such as electricity distribution charges and taxes. Electricity prices in Norway have been higher than implied by futures prices in the September Report (Table 1.A). At the same time, energy prices in the CPI have been lower than assumed. In isolation, the difference pulls down the Bank’s projection for energy prices ahead. Futures prices have also declined and will contribute to somewhat lower energy price inflation in the years ahead than assumed in the September Report (Chart 3.17).
Energy index. Twelve-month change. Percent
International price impulses are weakening
International inflation is on the decline, and price impulses to domestic consumer goods have weakened markedly over the past year. Global freight rates have continued to fall, and global producer prices have declined. International price impulses to imported consumer goods appear to have moderated in 2023. In the coming years, price impulses are expected to be close to pre-pandemic growth rates (Chart 3.18).
International price impulses for imported consumer goods (IPK) with freight rates in NOK and foreign currency terms. Annual change. Percent
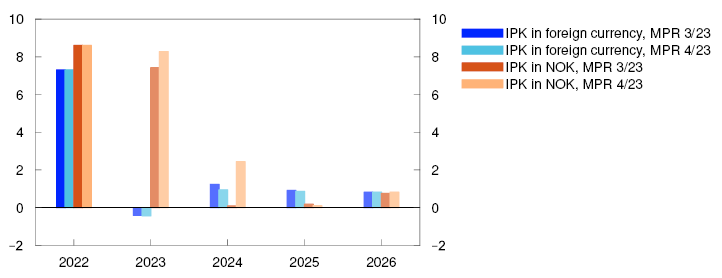
In isolation, this helps dampen inflation in the years ahead. Overall, international price impulses to imported consumer goods in foreign currency terms were slightly weaker than expected in the September Report.
At the same time, the krone has depreciated and is weaker than projected in the September Report. The depreciation counters the effects of weaker international price impulses. Imported inflation is projected to slow gradually from 2024 and pull down overall inflation. The projections for imported inflation are nevertheless higher than in the September Report owing to a weaker krone than previously assumed.
Since the September Report, international price impulses to intermediate goods have also weakened (Chart 3.19). The impulses to intermediate prices affect costs faced by Norwegian businesses, and thereby domestic inflation. Over the past year, imported intermediate goods inflation fell sharply and is now negative. Looking ahead, imported input price inflation is expected to normalise gradually. It takes time for international price impulses to intermediate goods to pass through to domestic inflation (see further discussion in "Imported price impulses to intermediate and capital goods"). Lower input price inflation is expected to curb the rise in prices for domestically produced goods and services ahead.
Twelve-month change in the IPI. Percent
Domestic conditions are keeping inflation elevated
The rise in prices for domestically produced goods and services is still high (Chart 3.20). In addition to high input price inflation, this likely reflects increased wage growth amid low productivity growth. High capacity utilisation has likely also pushed up the rise in domestic prices in recent years.
Domestically produced goods and services and imported goods in the CPI-ATE. Four-quarter change. Percent
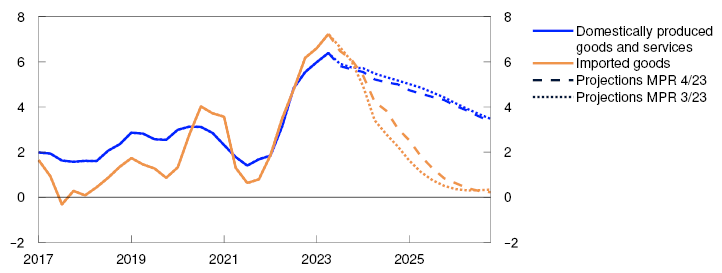
The rise in prices for domestically produced goods and services is expected to moderate more slowly than imported inflation, partly owing to prospects for continued high wage growth. Looking further ahead, slower wage growth, lower capacity utilisation and easing growth in intermediate goods prices facing businesses will dampen the rise in domestic prices. The rise in domestic prices is projected to be slightly lower than in the September Report, primarily reflecting the downward revision of the wage growth projections throughout projection period.
Higher energy prices are expected to lead to a higher 12-month rise in the CPI in the coming months, but both underlying and overall inflation are expected to moderate starting in 2024. Owing to prospects for lower energy prices, overall inflation is projected to be a little lower throughout projection period than in the September Report, while the projections for underlying inflation are little changed.
Prospects for somewhat lower wage growth
Wage growth has increased over the past few years, likely reflecting high inflation, a tight labour market and strong profitability in some business sectors.
Wage growth is projected to increase further to 5.5% in 2023, somewhat above the wage norm and unchanged from the September Report. Wage statistics for 2023 Q3 indicate that wage growth has accelerated in line with projections in the September Report. According to Norges Bank’s Expectations Survey, the social partners have lowered their wage growth expectations for 2023, while Regional Network contacts still expect wages in their own enterprises to increase by 5.4% in 2023.
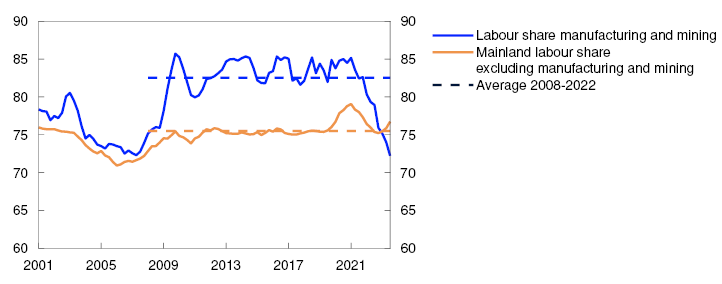
The krone depreciation and a rapid rise in export prices have contributed to strong profitability in manufacturing, and the labour cost share has declined sharply (Chart 3.21). This will push up wage growth in 2024. On the other hand, prospects for slower inflation, lower capacity utilisation and weak non-tradable sector profitability will dampen wage growth. On the whole, wage growth is projected to fall to 5.0% in 2024.
Labour costs as a share of GDP corrected for depreciation. Four-quarter moving average. Percent
The projection for wage growth in 2024 is slightly lower than in the September Report. The downward revision is in line with the Expectations Survey, where the social partners have lowered their wage expectations for 2024. Wage expectations for 2024 among Regional Network contacts have also declined slightly.
Real wage growth in 2024 is projected at 0.6%, somewhat higher than in the September Report (Chart 3.22). Real wage growth is expected to rise to around 1.5% thereafter, as imported price impulses weaken and productivity growth picks up somewhat. For 2025 and 2026, the projections for real wage growth are slightly lower than in the September Report.
Annual change. Percent
Uncertainty surrounding price and wage inflation
Recent movements in the krone exchange rate are a source of uncertainty about price and wage inflation ahead.
Wide differences in profitability across sectors are a source of uncertainty for the wage growth projections. The low labour cost share in manufacturing may result in a high wage norm and higher-than-assumed overall wage growth. On the other hand, low non-tradable sector profitability may dampen wage growth more than assumed.
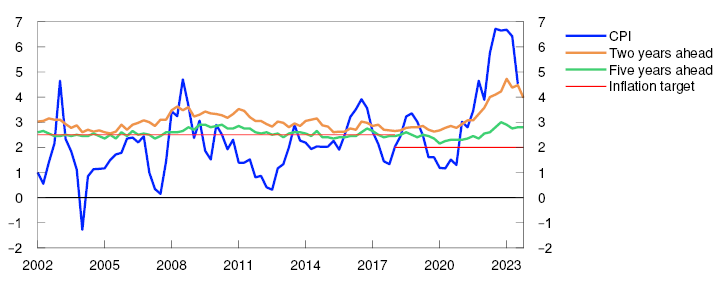
According to Norges Bank’s Expectations Survey, overall inflation expectations further out fell slightly in 2023 Q4 (Chart 3.23). The share of respondents that expected higher inflation ahead declined, and the differences among respondents narrowed (see "Inflation expectations in a period of high inflation"). This may indicate a slightly lower risk that inflation expectations will by themselves contribute to sustaining inflation. The Bank’s model estimates of uncertainty regarding the price projections also indicate that the risk that inflation will prove higher than projected has recently declined (see "Indicators of uncertainty in the near and medium term").
Inflation expectations ahead. Percent
There is also considerable uncertainty regarding future productivity growth, which has been weak in in recent years and is projected to rise gradually throughout the projection period yet remain at a historically low level. If productivity growth turns out to be weaker than projected, inflation may remain elevated for longer than currently envisaged. On the other hand, a sharper rise in productivity growth could lead to lower inflation and higher real wage growth.
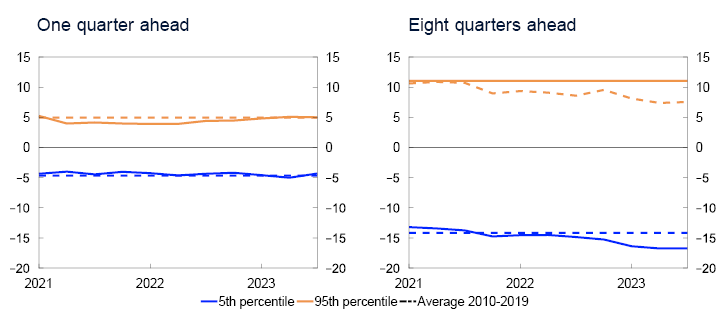
Indicators of uncertainty in the near and medium term
Expectations and projections of future economic developments will always be subject to considerable uncertainty. As an aid in understanding macroeconomic uncertainty, Norges Bank uses a model framework to quantify the uncertainty surrounding developments in three key macroeconomic variables: mainland GDP growth, house price inflation and consumer price inflation.1 The models help shed light on uncertainty around a set of point estimates but do not give us any information about the most probable developments ahead. The simple model framework provides a number of indicators of risk developments over time. Our overall assessments of risk ahead will always be a combination of judgement and model estimates.
In this box, we use the difference between the median and the 95th and 5th percentiles, respectively, in the model framework’s estimated sample space ahead as a measure of upside and downside risk. The charts below show developments over time in estimated upside and downside risk for the different variables. They illustrate both changes in the size of the estimated sample space, as measured by the difference between the 95th and 5th percentiles, and whether there is meaningful upside or downside asymmetry.
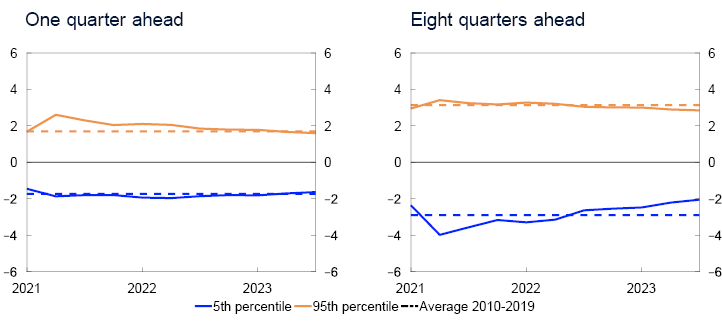
According to the models, inflation uncertainty has risen considerably in recent years (Chart 3.E). Both near-term and medium-term uncertainty are a little lower compared with the September Report but uncertainty is still fairly high compared with the historical average. The uncertainty surrounding inflation has also become somewhat more balanced along both horizons. The improvement is being driven in particular by weakening international price impulses. In the medium-term, there is still a slightly greater risk that inflation will be significantly higher than expected than significantly lower.
Spread between percentiles and median from quantile regressions. Four-quarter change in CPI-ATE. Percentage points
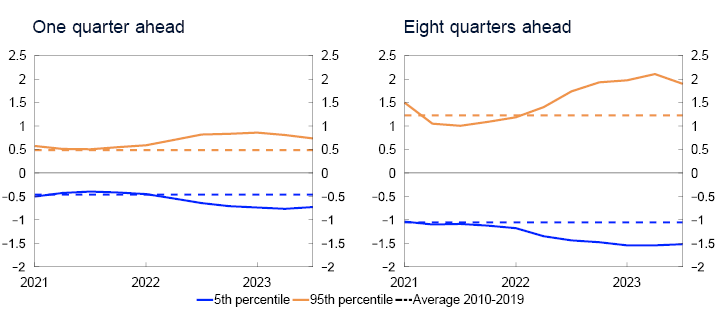
For mainland GDP growth, the model indicates that the uncertainty surrounding developments is balanced and at a normal level (Chart 3.F). Downside uncertainty in the longer term is somewhat lower than normal, and medium-term uncertainty is therefore slightly more skewed to the upside than in the September Report. These developments are due in particular to weaker growth in household credit. This may reflect the fact that rapid build-up of credit has historically increased the probability of a financial crisis. Low credit growth may therefore contribute to reducing the downside risk related to output growth.
Spread between percentiles and median from quantile regressions. Four-quarter change in mainland GDP. Percentage points
In both the near and medium term, there are minor changes in the indicators of uncertainty surrounding house price inflation. The models indicate that near-term uncertainty is close to its historical average (left panel in Chart 3.G). In the medium term there is a slight bias to the downside (right panel in Chart 3.G). The fall in real household disposable income and weaker growth in household credit are contributing to a slight downside shift in uncertainty.
Spread between percentiles and median from quantile regressions. Four-quarter change in house prices. Percentage points
Imported price impulses to intermediate and capital goods
Norges Bank has constructed an indicator of international price impulses to capital and intermediate goods (IPI). The purpose of constructing the indicator is to capture impulses from abroad at an early stage that affect Norwegian firms’ costs. This can help improve the Bank’s understanding of what affects developments in prices for domestically produced goods and services and may be useful when assessing how quickly consumer price inflation recedes.
The recent years’ inflation surge has coincided with a faster rise in business costs. Chart 3.H shows how simple model estimates can illustrate the approximate contribution from different cost components to the rise in inflation. The decomposition is based on simple historical relationships1 and does not capture all individual factors relevant for inflation. Normally, fluctuations in unit labour costs (ULC), price impulses to imported consumer goods (IPK) and the krone exchange rate have explained a large share of the fluctuations in inflation. Recently, on the other hand, there have been signs that other cost components have had a not insignificant impact on inflation. In Chart 3.H, we identify two of these cost components: freight rates and electricity prices.
Contribution to four-quarter change in CPI-ATE. Percentage points
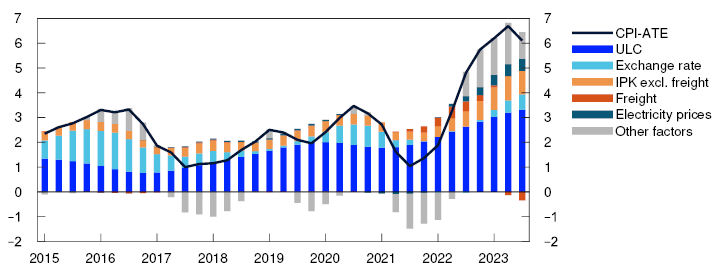
Sources: Statistics Norway and Norges Bank In addition, “other factors” have also made a substantial contribution to the rise in inflation since the beginning of 2022. “Other factors” may include the effects of a possible stronger and faster pass-through from different cost changes to selling prices in an environment of strong demand and high capacity utilisation. In addition, increased costs owing to higher intermediate goods prices are included in “other factors”. Although the decomposition takes into account international price impulses directly to consumer goods through the IPK3, it does not take directly into account international price impulses to Norwegian firms’ intermediate goods.
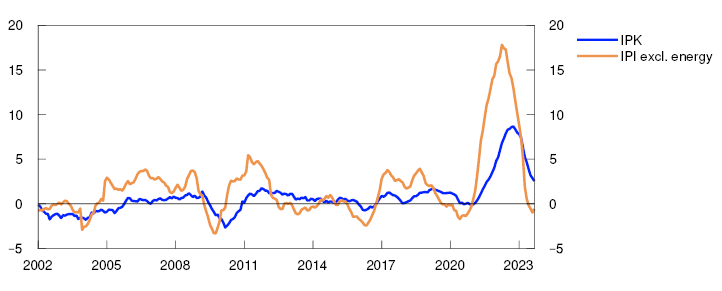
To improve understanding of how international impulses affect prices for intermediate and capital goods, the Bank has developed an index of prices for imported intermediate and capital goods (IPI). The purpose is to capture changes in the impulses early on by taking into account price changes at the early stages of the value chain. The index consists of monthly producer price indexes from different trading partners, with focus on imported intermediate and capital goods. The producer price indexes are sorted into five main groups of goods: transport, capital, food, other intermediate goods and energy. The indexes from the main groups are averaged to form an aggregate index, both including and excluding energy.4 The IPI excluding energy rose both earlier and more than the IPK between 2021 and 2022 (Chart 3.I). The rise in the IPI also slowed both faster and earlier than the IPK.
Chart 3.I IPI has risen more than IPK5

12-month change. Percent
We quantify the effect of the IPI on the rise in prices for domestically produced goods and services in CPI inflation adjusted for tax changes and excluding energy products (CPI-ATE) by using a vector autoregressive (VAR) model with six variables: domestic consumer price inflation, exchange rate (I-44), ULC, unemployment, energy prices and freight rates. The VAR model is estimated using Bayesian methods and is estimated using monthly data from the period between January 2002 and September 2023.6
To illustrate the importance of price developments for imported intermediate goods on domestic inflation, price developments can be compared under two different assumptions about movements in the IPI. In the first scenario, the IPI is assumed to rise in line with its historical pattern of an approximately 2.5% annual rise between 2021 and autumn 2023. In the second scenario, actual developments in the IPI are applied over the same period.7 This results in two different paths for the rise in prices for domestically produced goods and services. The difference between the two represents the estimated effect that the sharp rise in prices for imported intermediate goods has had on domestic prices since 2021.
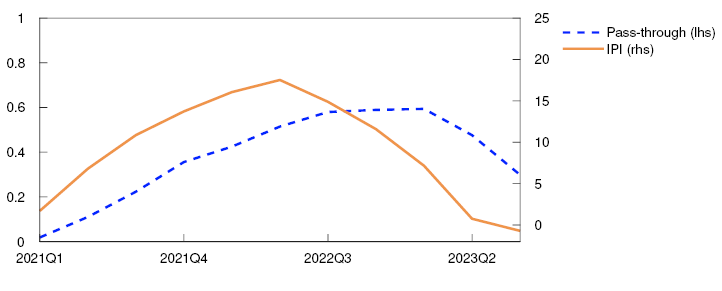
The model exercise indicates that the IPI alone may explain about 0.6 percentage point of the 12-month rise in the CPI-ATE in recent years (Chart 3.J). Imported intermediate goods prices measured using the IPI affect inflation with a considerable lag. The largest impact on underlying inflation was almost one year after the 12-month rise in the IPI peaked. Imported intermediate and capital goods enter the production chain at different stages, and it is therefore reasonable that it may take a long time before changes in intermediate prices pass through to consumer prices. The results from the model exercise indicate that the IPI contribution was largest between 2022 Q3 and 2023 Q2. This is the same period when “other factors” contributed the most to inflation in the simple decomposition in Chart 3.H. By taking into account developments in the IPI, we can therefore explain a larger share of the rise in inflation. In the models, it is difficult to identify the effects of the IPI without data for recent years. This is probably because the IPI has not been a key driver of inflation in the decades preceding 2020. Based on the lessons from these model exercises, we are likely better equipped to project how future fluctuations may affect the inflation outlook.
Chart 3.J Slow pass-through from the IPI to underlying inflation8
12-month change in the IPI. Percent (rhs). Contribution to the 12-month change in CPI-ATE. Percentage points (lhs)
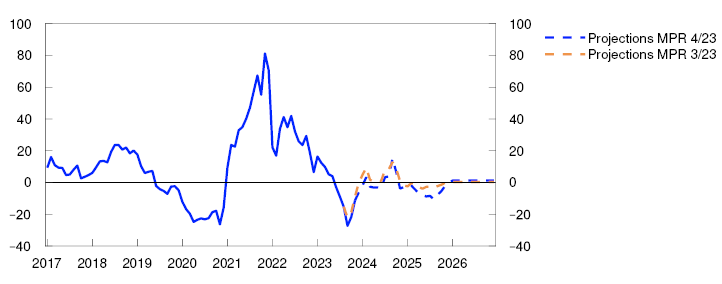
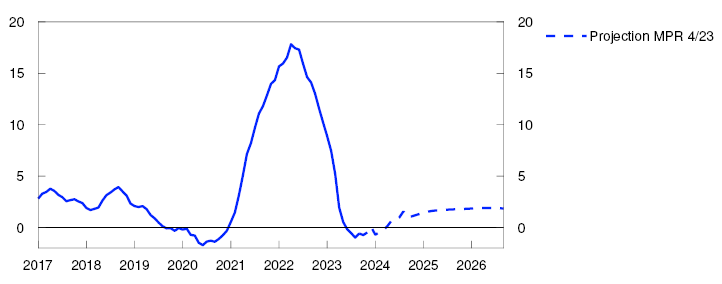
Over the past year, 12-month growth in the IPI excluding energy products, has fallen sharply. By using an equation that takes into account the dynamics in the IPI, historical developments and futures prices for some key commodity prices, growth in the IPI can be estimated for the period ahead. The estimates indicate that 12-month growth in the IPI will remain slightly below zero in the coming months (Chart 3.19). The IPI is then expected to pick up and approach its historical growth pattern. This implies that the level of the IPI will only fall slightly from the peak in autumn 2022 before picking up further. Even though the level will remain high, the sharp decline in IPI growth is expected to dampen consumer price inflation ahead (see further discussion of the CPI projections in Section 3.3).
Inflation expectations in a period of high inflation
An analysis of Norges Bank’s Expectations Survey indicates that long-run inflation expectations react to some degree to developments in actual inflation when inflation is high. However, after rising moderately through 2022, long-run inflation expectations, the share of respondents expecting higher inflation and disagreement among respondents, have recently fallen back a little.
The expectations of households, firms and market participants regarding the future path of inflation may have an impact on actual inflation. If inflation is expected to remain high, firms might increase the prices of their products more and the social partners might negotiate higher wages than if inflation is expected to remain low and stable. This may then reinforce inflation, which means it may take more time before inflationary pressures ease.
In the literature, a number of possible criteria are proposed for deciding whether inflation expectations are anchored. These criteria can be grouped into three broad categories: Inflation expectations are anchored if 1) average inflation forecasts at medium and long horizons remain stable and close to the inflation target,1 2) medium- and long-run expectations show little response to new information,2 and 3) the dispersion in the distribution of inflation expectations is low.3 We have looked more closely at the degree to which these criteria are met for inflation expectations, as measured by Norges Bank’s Expectations Survey.
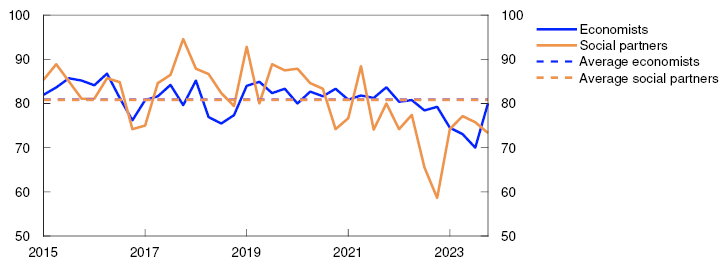
Norges Bank’s Expectations Survey has been conducted every quarter since 2002 Q1.4 In the survey, four target groups – households, business leaders, economists (in the financial industry and academia), and representatives of the social partners (the main employer and employee organisations) – are queried about their inflation expectations at different horizons.5 The responses from the survey indicate that inflation expectations started to increase after actual consumer price inflation picked up at the end of 2021 (Chart 3.23). Medium-run expectations increased more than long-run expectations. When consumer price inflation began to move down earlier this year, inflation expectations followed. Nevertheless, they are still above Norges Bank’s inflation target.
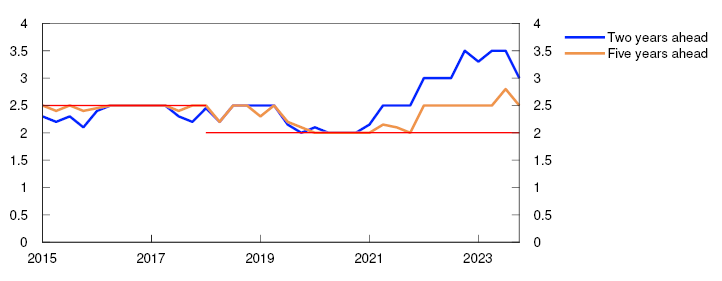
Medium- and long-term inflation expectations, measured at the median, have been relatively stable and close to the target over time (Chart 3.K). The median has edged up in recent years, but less for inflation expectations five years ahead than two years ahead. The share of respondents expecting inflation five years ahead to lie close to the target fell when inflation accelerated but has picked up in recent quarters and now lies close to a historical average (Chart 3.L).
Inflation expectations two and five years ahead. Economists and social partners. Median
Percentage share of respondents expecting inflation in five years to be between 1% and 3%
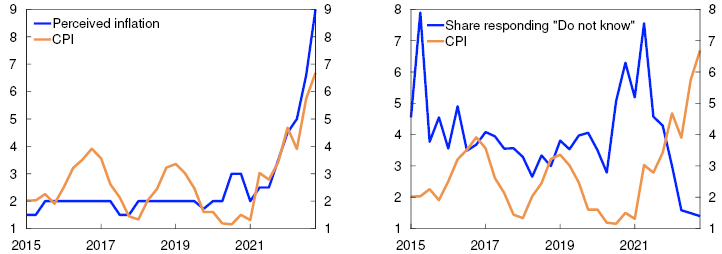
The inflation environment at the time might affect how agents form their expectations. Several studies suggest that agents will pay more attention to price developments when inflation is high.8 Recent years’ Expectations Survey data show that when inflation is high, households’ inflation perceptions are closer to actual inflation and fewer households are uncertain about the current inflation rate (Chart 3.M). In theory, increased attention to current inflation may conceivably also affect long-run inflation expectations.
Chart 3.M Households become more attentive when inflation is high9
Household response to inflation over the past twelve months and CPI.
Four-quarter change. Percent
To test this hypothesis, we estimate how much long-run inflation expectations move following changes in actual inflation.10 When we look at inflation expectations five years ahead for the entire sample, we find that inflation expectations are relatively insensitive to actual inflation. The correlation between inflation expectations five years ahead and current inflation is very low (0.03).11 However, we also find that the correlation increases somewhat (to 0.12) in periods where actual inflation is above 3%. In other countries too, there is a higher correlation between inflation expectations and actual inflation when inflation is high.12 Even though the correlation is higher when inflation is high, it is still relatively low. This may indicate that the respondents believe inflation will eventually return to target, albeit more slowly, than when inflation is low.
The dispersion in the distribution of long-run inflation expectations is an indication of the “agreement” among respondents. A number of studies have found that if dispersion is high, inflation expectations may be higher ahead.13 For the economists and social partners, the variance has come down in 2023 Q4 after peaking in 2022 Q2. Furthermore, the distribution of long-run inflation expectations shows that most values lie close to the inflation target (Chart 3.N). When inflation was at its highest in 2023 Q1, a larger share of respondents expected inflation of over 4%. In Q4, the share expecting high inflation five years ahead has edged down.14
Inflation expectations 5 years ahead. Estimated distribution
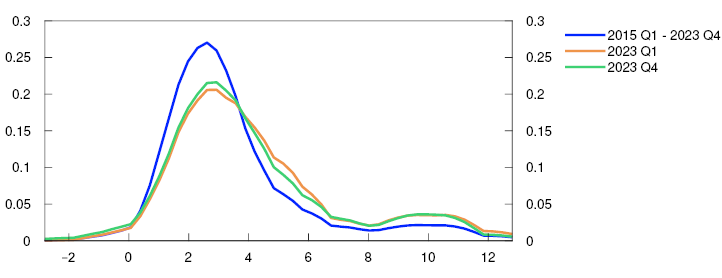
The analysis presented in this box indicates that inflation expectations do not react to actual inflation until inflation is high. Since mid-2021, the long-run inflation expectations of the median respondent have edged higher, rising above the target. In the same period, both the share of respondents expecting higher inflation and the disagreement among respondents have risen. Recently, however, there have been signs of a slight reversal. This may indicate that there is slightly less risk that inflation expectations in and of themselves will contribute to keeping inflation elevated.
The interest rate sensitivity of consumption and investment
Norges Bank works continuously to deepen its understanding of the effects of monetary policy on the economy. Among other things, this requires a broad set of methods and approaches to quantify effects of policy rate changes. This box presents a new analysis that, along with the rest of the Bank’s modelling system, is used as a cross-check of the consumption and investment projections. It also sheds light on the consumption and investment components that are the most interest rate sensitive.
Consumption and investment are an important part of the monetary policy transmission mechanism. An extensive international literature, but also previous Norges Bank analyses, shows that a policy rate increase over time will gradually dampen growth in both household demand and business investment. Lower aggregate demand growth in the economy will, in turn, contribute to curbing price and wage inflation. However, different studies yield different quantitative responses to the question of how quickly and how much a given change in the policy rate influences consumption and investment.
Uncovering the purely causal relationship between the policy rate and economic variables is difficult. Ordinarily, changes in the policy rate will come as a reaction to developments in target variables, such as employment, output and inflation. For example, the policy rate will normally be raised if demand is high and there are prospects for accelerating inflation, in which case, high demand will normally coincide with a policy rate increase. In other words, we may from time to time observe a positive correlation between eg interest rates on the one hand and consumption and investment on the other, but this does not mean that a policy rate hike contributes to higher demand.
When seeking to quantify the causal effect of monetary policy, we must therefore control for changes in the policy rate that are a part of the normal response pattern. What is left are changes in the policy rate that are not a direct reaction to actual and expected changes in the target variables. This is often referred to in the economics literature as monetary policy surprises or monetary policy shocks. Holm et al (2021)1 identify monetary policy shocks for Norway as residuals in a regression of the policy rate on variables including actual and expected inflation and GDP growth.
In the following, we use a modified variant of these monetary policy shocks to analyse how the policy rate influences consumption and investment.2 For each demand component, we quantify 20 regressions where the change in the given demand component in quarter t to quarter t+h (h= 1,…,20) is explained by monetary policy shocks in quarter t. In addition, we include back-dated values for both monetary policy shocks and changes in the given demand component:

Chart 3.O shows how different investment aggregates over time respond to a monetary policy shock. To provide an idea of the overall monetary policy impulse, we also show the response in the policy rate following a monetary policy shock in quarter t.-1 In isolation, a policy rate shock in quarter t contributes over time to curbing investment. The response is fastest for housing investment, where the maximum impact occurs after around one and a half years. For business investment overall, the results suggest that it takes a relatively long time before the full effect fades. Real estate sector investment in particular, and primarily commercial real estate, pull down on business investment. Investment of this type, which accounts for a considerable portion of business investment, is largely debt-financed and will naturally be sensitive to interest rate changes.
Initial monetary policy shock corresponding to 1 percentage point
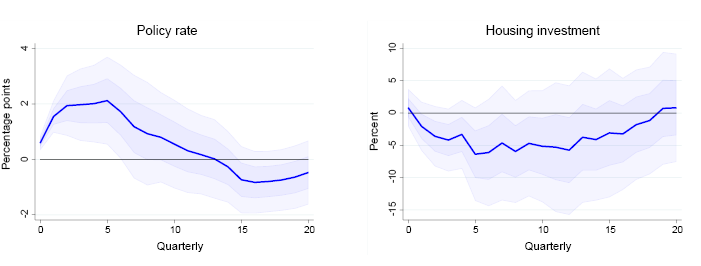
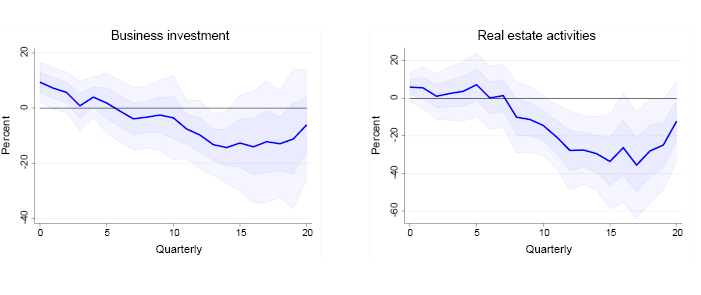
The results for overall business investment are well in line with previous studies that use similar methods. For instance, based on administrative data for Norwegian firms and the same methodological approach, Cao et al (2023)-1 find marked effects of unexpected changes in the policy rate on business investment in the aggregate. They also report that interest rate sensitivity is strongest for firms that at the outset have limited access to credit. In two recent studies, Durante et al (2022)-1 and Nolan et al (2023)-1 estimate in part substantial effects of monetary policy surprises on business investment in the euro area-1 and Australia, respectively.
A policy rate increase also contributes to dampening consumption (Chart 3.P). However, as is the case for business investment, it takes time before the full impact is realised. The maximum effect on overall private consumption is reached after close to three years. The results show that consumption of durables, such as cars and furniture, is particularly sensitive to policy rate changes. This is consistent with a similar analysis by Cernis and Luu (2018)-1. But services consumption is relatively interest rate sensitive too. The results of the analysis otherwise show a relatively large degree of heterogeneity in the policy rate response across goods and services categories. For some goods categories, such as food and beverages, we find that a higher policy rate contributes to a moderate rise in consumption. A possible explanation is that households eat and drink more at home rather than go to restaurants when their real disposable income falls.
Initial monetary policy shock corresponding to 1 percentage point
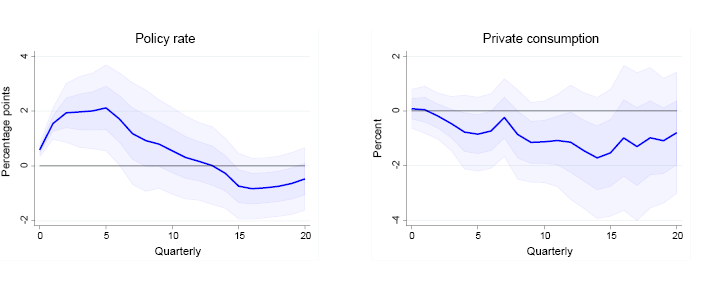
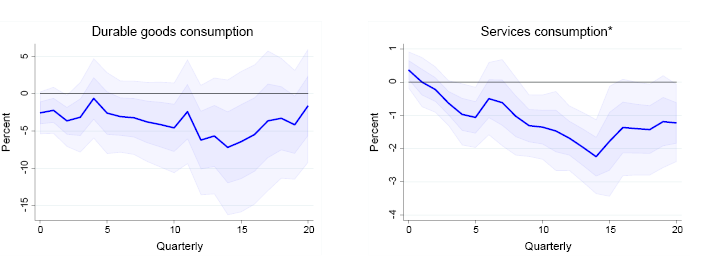
The estimated impulse responses are uncertain. This is probably partly because monetary policy surprises account for a very small proportion of the variation in the policy rate, which matters for the statistical precision of the estimated impulse responses. Similar studies therefore often report relatively broad confidence intervals around the estimated average responses.-1 However, to assess whether the monetary policy surprises have a significant effect, it is necessary to begin with the joint distribution of the response estimates instead of looking at the significance of the estimates individually. This is because these estimates will typically be correlated over the response horizon.-1 For all consumption and goods categories shown above, we can reject a hypothesis that the response coefficients are simultaneously equal to zero.-1
Over the past two years, the policy rate has been raised both rapidly and significantly. The policy rate increase must be viewed as a reaction to high imported inflation but also to strong domestic demand growth in the wake of the pandemic. The effects of the policy rate changes are beginning to be visible. In line with the results shown above, we now see a marked fall in housing investment. There are also signs of lower consumption and, to some extent, lower business investment, even though surprisingly, both these demand components have long held up well. We expect a further dampening of both consumption and investment ahead. However, how pronounced this dampening will be is uncertain.
The estimated average responses in this analysis are included in the basis of cross-checks of the consumption and investment projections in this Report. The analysis supports the assessment that it can take a long time before the effects of the policy rate increase fade but at the same time illustrates the uncertainty associated with how the policy rate affects different consumption and investment aggregates.
*Services consumption is services consumption less foreign nationals’ consumption in Norway.


4. Monetary policy analysis
On balance, Norges Bank’s analyses indicate a policy rate path that is broadly unchanged from the September 2023 Monetary Policy Report in the coming year, followed by a somewhat lower policy rate path. According to the model analysis, the path is pushed down by lower-than-projected consumption and lower energy prices and international interest rates. A weaker krone and higher oil investment than projected in the September Report in isolation pulls in the direction of a higher policy rate path.
4.1 The policy rate forecast and monetary policy objectives
The operational target of monetary policy is annual consumer price inflation of close to 2% over time. Inflation targeting shall be forward-looking and flexible so that it can contribute to high and stable output and employment and to countering the build-up of financial imbalances. The Committee’s monetary policy strategy is discussed further on Norges Bank’s website.
Compared with the September Report, the policy rate forecast is little changed in the near term but is somewhat lower further out. The policy rate was raised by 0.25 percentage point to 4.5% at the meeting of the Monetary Policy and Financial Stability Committee on 13 December. The forecast indicates that it will remain at this level until autumn 2024, before gradually declining. At the end of the projection period, the policy rate is projected to be 3%.
The projections are uncertain. The uncertainty surrounding the inflation projections is especially high now that inflation is high, and inflation expectations lie above the inflation target.1 The Bank’s forecasts have been revised substantially over the past year. If the economic outlook, the balance of risks or the assessment of the functioning of the economy changes, the policy rate may prove to be different from the one projected.
4.2 New information and new assessments
New information suggests a slightly lower policy rate path
To shed light on how new information affects the economic outlook, new information and assessments of the economic situation are incorporated into the modelling system, while conditioning on the policy rate path from the September Report. This exercise shows the forecasts that the modelling system would have produced if the policy rate path were unchanged. Here the main focus is on the output gap and inflation outlook.
In the exercise with an unchanged rate path, the capacity utilisation projection has been revised down since the September Report (Chart 4.1). CPI-ATE inflation has been a little lower than projected, and inflation is also set to be lower towards the end of the projection period. The exercise thus indicates a slightly lower policy rate path than in the September Report, especially towards the end of the projection period.
Projections conditioned on new information concerning economic developments and the policy rate forecast in MPR 3/23
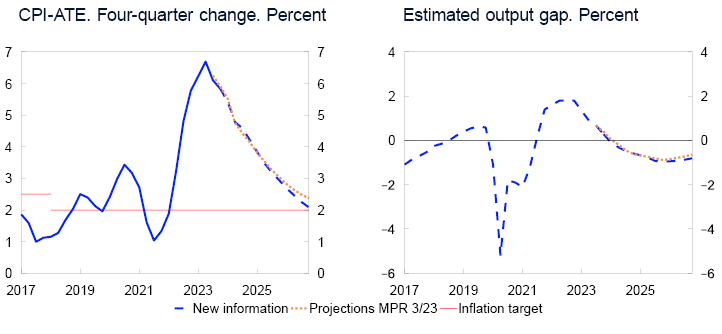
Market policy rate expectations have fallen
Market policy rate expectations further out can provide an indication of how market participants have interpreted new information and how they expect Norges Bank will react.
Market expectations now indicate a rate peak at a little above 4.25% (Chart 4.2). Policy rate expectations have fallen since the September monetary policy meeting and now lie well below the policy rate path in the September Report throughout the projection period.
Policy rate. Percent
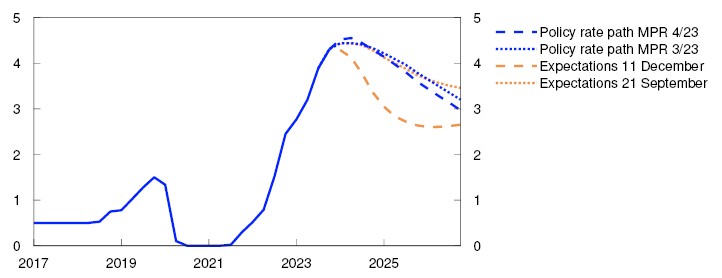
Some of the fall in Norwegian money market rates may be related to the marked decline in market policy rate expectations among Norway’s main trading partners since the September Report, particularly towards the end of the projection period (Chart 4.3). This in turn may reflect the marked fall in international consumer price inflation. Norges Bank’s policy rate path is higher than indicated by market pricing, and in the Bank’s forecast, the policy rate differential against other countries is now higher than in the September Report.
Policy rates in Norway and among Norway’s main trading partners. Percent
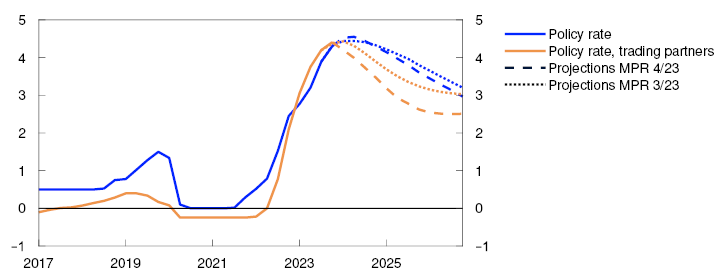
A simple rule indicates a broadly unchanged policy rate path
A simple policy rate rule shows the monetary policy reaction to changes in the output gap and inflation (see Monetary Policy Report 2/2022). The estimated rule is based on data for the period 2009–2021. The near-term output gap and inflation projections have been revised down a little, but the changes from the September Report are minor. The simple rule therefore indicates a broadly unchanged policy rate path in the coming quarters compared with the September Report5 (Chart 4.4).
Three-month money market rate. Percent
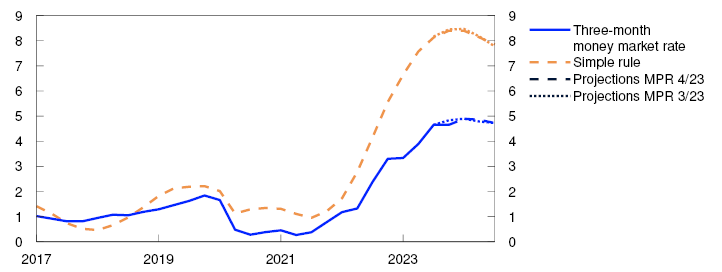
CPI-ATE: CPI adjusted for tax changes and excluding energy products.
The output gap measures the difference in percentage terms between GDP for mainland Norway and projected potential GDP for mainland Norway.
4.3 Monetary policy stance and drivers behind the changes in the policy rate path
Interest rates have risen substantially over the past two years. This has had a tightening effect on the economy. The average residential mortgage rate has risen broadly in pace with the policy rate, which reduces household disposable income and contributes to dampening household consumption. Higher interest rates also pull down business investment through increased financing costs. See "The interest rate sensitivity of consumption and investment" for a further discussion of the effect of interest rates on consumption and investment.
Compared with the September Report, the policy rate forecast overall has been revised down more than the inflation projections. The estimate of the expected real interest rate is therefore somewhat lower than in the September Report (Chart 4.5). The neutral real interest rate is an uncertain variable but is estimated to lie in the upper part of the range between -0.5% and 0.5% (see Monetary Policy Report 2/2023 for a further description). The real interest rate is projected to lie above its neutral level from the current quarter. This means that monetary policy, as measured by the real interest rate, will have a tightening effect on the economy throughout the projection period.
Estimate of the expected real money market rate. Percent
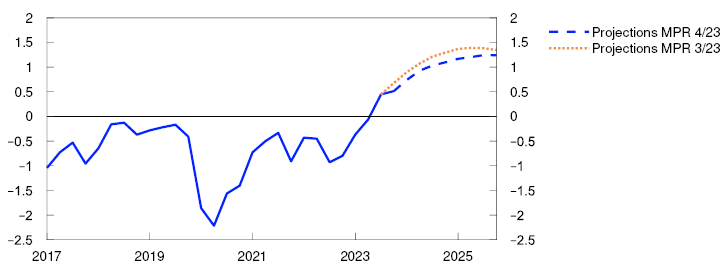
The model-based analysis implies a somewhat lower policy rate path further out in the projection period
The Committee’s reasoning for the policy rate decision and forward guidance on the policy rate are presented in the "Monetary policy assessment" . In the decomposition in Chart 4.6, we use our main model NEMO to break down the main drivers behind the change in the policy rate path since the previous Report. The bars show contributions to changes in the model-based path, and the broken line shows the sum of the bars. The solid line shows the actual change in the rate path.
Cumulative contributions. Percentage points
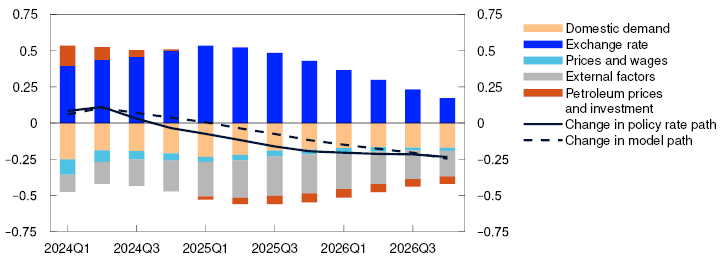
Forward rates indicate that international policy rates will be lower throughout the projection period than previously assumed, which contributes in isolation to a stronger krone. Economic growth among Norway’s trading partners is set to be a little stronger than previously projected, which in isolation will lead to higher exports of Norwegian goods and services. Underlying inflation among trading partners has been a little lower than assumed in the September Report. Overall, external factors suggest a somewhat lower model-based path (grey bars).
Since the September Report, oil spot prices have fallen, while gas spot prices are little changed. Oil and gas futures prices are lower further out in the projection period. Lower petroleum prices contribute in isolation to a lower policy rate path by contributing to lower activity in oil-related industries and dampening wage growth. Even so, the projection for petroleum investment has been revised up for the first part of the projection period, in line with Statistics Norway’s investment intentions survey. In isolation, this suggests a slightly higher model-based path at the beginning of the projection period. Overall, factors relating to petroleum prices and petroleum investment pull up the model-based path next year and then push it down a little for the remainder of the projection period (red bars).
The krone has been weaker than projected in the September Report and weaker than implied by changes in the interest rate differential against other countries and oil and gas prices. A weaker krone leads to higher imported goods inflation and improves Norwegian firms’ cost competitiveness. This stimulates Norwegian net exports and overall activity and contributes to higher wage growth. Overall, exchange rate factors pull up the model-based path (dark blue bars).
Capacity utilisation is projected to be a little lower than envisaged in September. Developments in consumption are assumed to be somewhat weaker as real disposable income is projected to be lower than in the September Report. This effect is not sufficiently captured in the Bank’s main model NEMO. Domestic demand factors therefore push down more than they would have done if this mechanism were captured better in the model, and price and wage factors push down less than they otherwise would have done. Overall, domestic demand contributes to a slightly lower model-based path throughout the projection period (orange bars).
Core inflation has been a little lower than envisaged in September. Lower energy prices also pull down price and wage inflation ahead. Price and wage factors on the whole suggest a lower model-based path (light blue bars).
The model analysis implies a slightly higher policy rate in the coming year, followed by a somewhat lower policy rate in the remainder of the projection period. The policy rate path has been revised down to approximately the same extent as the model-based path further out in the projection period.
Annex
Detailed tables of projections
TABLe 1 International projections
|
Change from projections in Monetary Policy Report 3/23 in brackets |
Weights1 Percent |
Percentage change from previous year |
||||
|
2022 |
2023 |
2024 |
2025 |
2026 |
||
|
GDP |
||||||
|
US |
12 |
1.9 (-0.2) |
2.4 (0.2) |
1.5 (0.4) |
1.5 (0) |
1.7 (-0.1) |
|
Euro area |
47 |
3.4 (0) |
0.4 (0) |
0.9 (0) |
1.9 (0.1) |
1.6 (0) |
|
UK |
15 |
4.3 (0.2) |
0.5 (0.1) |
0.5 (0.1) |
1.1 (-0.3) |
1.5 (-0.2) |
|
Sweden |
18 |
3 (0.1) |
-0.3 (0.2) |
0.2 (-0.3) |
2.2 (-0.1) |
2 (0) |
|
China |
8 |
3.2 (0) |
5.5 (0.6) |
4.3 (0.4) |
3.9 (-0.2) |
3.6 (-0.4) |
|
5 trading partners1 |
100 |
3.3 (0.1) |
1 (0.2) |
1.1 (0.1) |
1.9 (-0.1) |
1.8 (-0.1) |
|
Prices |
||||||
|
Underlying inflation2 |
4.8 (0) |
5.3 (-0.1) |
2.9 (0) |
2.3 (-0.1) |
2.1 (0) |
|
|
Wage growth2 |
4.3 (0) |
5 (0) |
4 (-0.1) |
3.4 (-0.1) |
3.1 (0) |
|
|
Prices for consumer goods imported to Norway3 |
7.3 (0) |
-0.4 (0.0) |
0.9 (-0.3) |
0.9 (0) |
0.8 (0) |
|
Sources: LSEG Datastream and Norges Bank
Table 2a Consumer prices. Twelve-month change. Percent
|
2023 |
2024 |
||||||
|
Sep |
Oct |
Nov |
Dec |
Jan |
Feb |
Mar |
|
|
Consumer price index (CPI) |
|||||||
|
Actual |
3.3 |
4.0 |
4.8 |
||||
|
Projections MPR 3/23 |
4.2 |
4.4 |
5.4 |
5.7 |
|||
|
Projections MPR 4/23 |
4.9 |
4.8 |
5.3 |
4.6 |
|||
|
CPI-ATE |
|||||||
|
Actual |
5.7 |
6.0 |
5.8 |
||||
|
Projections MPR 3/23 |
6.1 |
6.0 |
6.1 |
5.8 |
|||
|
Projections MPR 4/23 |
5.6 |
5.4 |
5.5 |
5.2 |
|||
|
Imported consumer goods in the CPI-ATE |
|||||||
|
Actual |
5.9 |
6.1 |
6.2 |
||||
|
Projections MPR 3/23 |
6.4 |
6.2 |
6.2 |
5.8 |
|||
|
Projections MPR 4/23 |
5.8 |
5.4 |
5.5 |
5.0 |
|||
|
Domestically produced goods and services in the CPI-ATE |
|||||||
|
Actual |
5.5 |
5.8 |
5.7 |
||||
|
Projections MPR 3/23 |
5.8 |
5.8 |
5.9 |
5.7 |
|||
|
Projections MPR 4/23 |
5.6 |
5.5 |
5.6 |
5.5 |
|||
Sources: Statistics Norway and Norges Bank
Table 2b House prices. Monthly change. Seasonally adjusted. Percent
|
2023 |
2024 |
||||||
|
Sep |
Oct |
Nov |
Dec |
Jan |
Feb |
Mar |
|
|
Actual |
-0.2 |
0.2 |
0.1 |
||||
|
Projections MPR 3/23 |
-0.4 |
-0.3 |
-0.2 |
-0.1 |
|||
|
Projections MPR 4/23 |
0.0 |
-0.2 |
-0.2 |
-0.1 |
|||
Sources: Eiendomsverdi, Finn.no, Real Estate Norway and Norges Bank
Table 2c Registered unemployment (rate). Percent of labour force. Seasonally adjusted
|
2023 |
2024 |
||||||
|
Sep |
Oct |
Nov |
Dec |
Jan |
Feb |
Mar |
|
|
Actual |
1.9 |
1.9 |
1.9 |
||||
|
Projections MPR 3/23 |
1.9 |
1.9 |
2.0 |
2.0 |
|||
|
Projections MPR 4/23 |
1.9 |
1.9 |
2.0 |
2.0 |
|||
Sources: Norwegian Labour and Welfare Administration (NAV) and Norges Bank
Table 2d GDP for mainland Norway. Monthly change. Seasonally adjusted. Percent
|
2023 |
2024 |
||||||
|
Sep |
Oct |
Nov |
Dec |
Jan |
Feb |
Mar |
|
|
Actual |
0.3 |
||||||
|
Projections MPR 3/23 |
-0.1 |
0.1 |
0.1 |
0.1 |
|||
|
Projections MPR 4/23 |
0.3 |
-0.3 |
-0.2 |
-0.2 |
0.1 |
0.2 |
|
Sources: Statistics Norway and Norges Bank
Table 2e GDP for mainland Norway. Quarterly change.1 Seasonally adjusted. Percent
|
2023 |
2024 |
|||
|
Q2 |
Q3 |
Q4 |
Q1 |
|
|
Actual |
0.0 |
0.1 |
||
|
Projections MPR 3/23 |
0.3 |
0.1 |
-0.1 |
|
|
Projections MPR 4/23 |
0.0 |
-0.3 |
||
Sources: Statistics Norway and Norges Bank
Table 3 Projections for main economic aggregates
|
Change from projections in Monetary Policy Report 3/23 in brackets |
Percentage change from previous year (unless otherwise stated) |
|||||
|
In billions of NOK 2022 |
2022 |
Projections |
||||
|
2023 |
2024 |
2025 |
2026 |
|||
|
Prices and wages |
||||||
|
CPI |
5.8 |
5.5 (-0.3) |
4.4 (-0.4) |
2.8 (-0.3) |
2.5 (0.0) |
|
|
CPI-ATE |
3.9 |
6.2 (-0.1) |
4.8 (0.1) |
3.5 (0.1) |
2.5 (-0.1) |
|
|
Annual wages |
4.3 |
5.5 (0.0) |
5.0 (-0.2) |
4.3 (-0.3) |
3.7 (-0.2) |
|
|
Real economy1 |
||||||
|
Gross domestic product (GDP) |
5685 |
3.0 |
0.6 (-0.8) |
0.8 (0.4) |
1.2 (0.2) |
0.7 (-0.4) |
|
GDP, mainland Norway2 |
3635 |
3.7 |
1.0 (-0.3) |
0.1 (-0.2) |
1.2 (0.4) |
1.5 (0.1) |
|
Output gap, mainland Norway (level) |
1.8 |
0.8 (0.0) |
-0.4 (-0.1) |
-0.7 (0.1) |
-0.7 (0.0) |
|
|
Employment, persons, QNA |
3.9 |
1.3 (-0.2) |
-0.1 (0.0) |
0.4 (0.3) |
0.7 (0.1) |
|
|
Registered unemployment (rate, level) |
1.8 |
1.8 (0.0) |
2.1 (-0.1) |
2.3 (-0.1) |
2.3 (-0.1) |
|
|
Demand1 |
||||||
|
Mainland demand2 |
3782 |
5.1 |
-0.3 (0.0) |
-0.2 (-0.1) |
1.8 (0.0) |
2.2 (0.1) |
|
– Household consumption |
1817 |
6.3 |
-0.9 (-0.3) |
0.2 (0.1) |
1.8 (-0.1) |
2.7 (0.2) |
|
– Business investment |
451 |
17.1 |
3.4 (1.1) |
-3.2 (-0.2) |
2.2 (0.3) |
1.0 (-0.5) |
|
– Housing investment |
235 |
-1.4 |
-15.1 (-0.6) |
-6.4 (-1.7) |
5.0 (0.6) |
6.9 (0.3) |
|
– Public demand |
1279 |
1.1 |
2.1 (0.5) |
1.2 (-0.1) |
1.4 (0.2) |
1.1 (0.1) |
|
Petroleum investment2 |
177 |
-7.2 |
8.0 (2.0) |
7.0 (1.0) |
-1.0 (-3.0) |
-2.0 (-1.0) |
|
Mainland exports2 |
946 |
9.1 |
6.6 (-1.4) |
2.1 (1.0) |
2.4 (-0.6) |
3.8 (0.6) |
|
Imports |
1541 |
12.3 |
2.0 (-0.3) |
-0.3 (-0.1) |
2.2 (-1.7) |
2.4 (0.2) |
|
House prices and debt |
||||||
|
House prices |
4.9 |
-0.2 (0.1) |
1.0 (0.2) |
5.1 (0.8) |
6.5 (0.5) |
|
|
Household credit (C2) |
4.1 |
3.4 (-0.1) |
2.8 (-0.1) |
2.5 (0.0) |
2.7 (0.2) |
|
|
Interest rate, exchange rate and oil price |
||||||
|
Policy rate (level) |
1.3 |
3.5 (0.0) |
4.5 (0.1) |
3.9 (-0.1) |
3.2 (-0.2) |
|
|
Import-weighted exchange rate (I-44) (level) |
110.0 |
119.7 (1.0) |
121.5 (4.1) |
120.5 (4.0) |
120.5 (4.1) |
|
|
Policy rate, trading partners (level) |
0.7 |
3.9 (0.1) |
3.9 (-0.3) |
2.9 (-0.5) |
2.5 (-0.6) |
|
|
Oil price, Brent Blend. USD per barrel |
101.0 |
81.9 (-2.3) |
75.9 (-10.3) |
73.6 (-6.4) |
71.5 (-4.2) |
|
|
Household income and saving1 |
||||||
|
Real disposable income excl. dividend income |
1.7 |
-1.5 (0.6) |
0.8 (0.1) |
2.5 (0.2) |
3.1 (0.2) |
|
|
Saving ratio excl. dividend income (rate, level) |
0.4 |
-0.7 (0.5) |
0.5 (0.4) |
1.0 (0.6) |
1.2 (0.2) |
|
|
Fiscal policy |
||||||
|
Structural non-oil deficit as a percentage of GPFG3 |
2.7 |
3.0 (0.0) |
2.7 (0.0) |
2.6 (0.0) |
2.6 (0.1) |
|
|
Structural non-oil deficit as a percentage of trend GDP |
9.5 |
9.9 (-0.3) |
10.3 (0.0) |
10.2 (0.0) |
10.2 (0.1) |
|
Sources: Eiendomsverdi, Finn.no, LSEG Datastream, Ministry of Finance, Norwegian Labour and Welfare Administration (NAV), Real Estate Norway, Statistics Norway and Norges Bank