Norges Bank’s Monetary Policy and Financial Stability Committee decided to raise the policy rate from 3.25% to 3.75% at its meeting on 21 June. The Committee’s current assessment of the outlook and balance of risks implies that the policy rate will most likely be raised further in August.
Further rise in interest rates internationally
Consumer price inflation among Norway’s main trading partners has slowed further but is still high. Underlying inflation has remained elevated and been higher than expected. Global freight rates have returned to pre-pandemic levels, and prices for a range of commodities, such as metals and food, have fallen. This could curb the rise in imported goods inflation in Norway. Gas and electricity prices have fallen somewhat since March, while oil prices have edged up
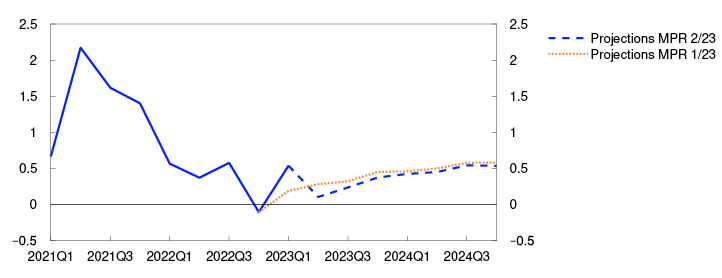
Policy rates and estimated forward rates. Percent
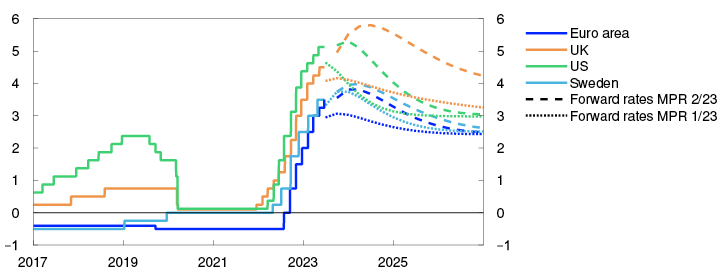
Sources: Bloomberg, Refinitiv Datastream and Norges Bank Central banks in many trading partner countries have raised their policy rates further with the aim of curbing inflation. High inflation and reduced banking sector stress have raised policy rate expectations abroad since March. Policy rates are expected to peak towards the end of the year. Long-term interest rates and international equity indexes have also advanced, while bond risk premiums have fallen since March. At the same time, it appears that banks in the US and Europe have further tightened household and corporate credit standards.
Economic activity among trading partners has been higher than expected, amid continued tight labour markets. Economic growth is expected to be subdued in 2023, partly reflecting tighter financial conditions and weak developments in household purchasing power. There are prospects that economic activity will remain slightly higher than projected in the March 2023 Monetary Policy Report.
The krone has been weaker than expected
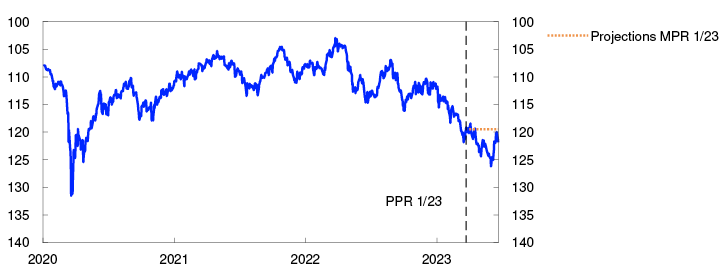
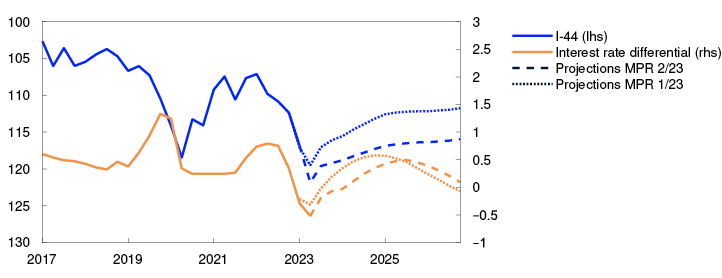
The krone has depreciated appreciably over the past year, partly reflecting a larger rise in foreign interest rates than in Norwegian rates and a low interest rate differential. The krone has been weaker than projected in the March Report but has appreciated again in recent weeks, coincident with a rise in Norwegian market rates. Market-implied rates indicate expectations of a further policy rate rise ahead. Corporate lending rates have increased a little more since March, and residential mortgage rates have moved up broadly in line with expectations.
Import-weighted exchange rate index. I-44
Gradually easing pressures in the Norwegian economy
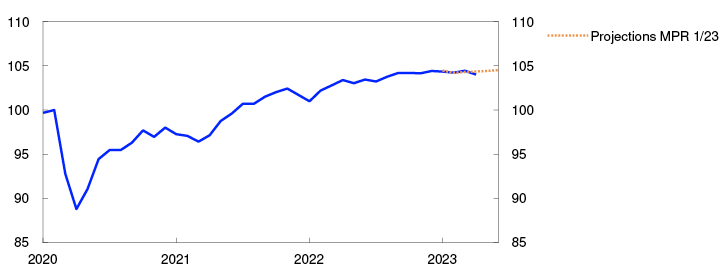
Growth in the Norwegian economy has slowed. Mainland GDP has been a little lower than projected in the March Report. After rising sharply towards the end of last year, household consumption has declined so far in 2023.
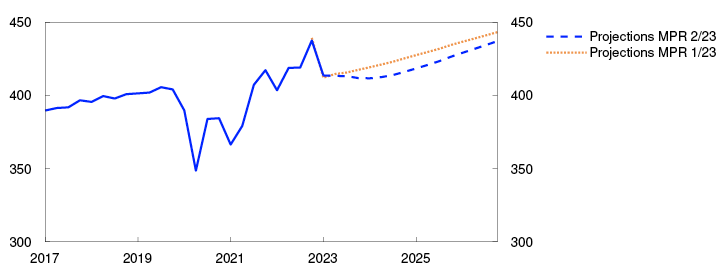
GDP for mainland Norway. Seasonally adjusted. Index. February 2020 = 100
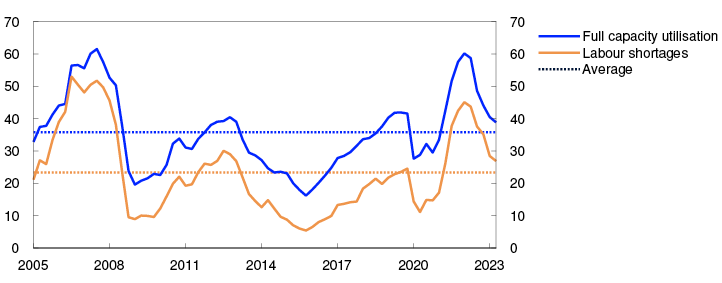
Employment has risen further and been slightly higher than expected. The labour market remains tight, but several indicators now suggest some easing. As expected, registered unemployment has edged up and was 1.8% in May. The share of enterprises in Norges Bank’s Regional Network reporting that labour shortages are a constraint on production fell further in Q2.
Regional Network enterprises report a slightly improved outlook compared with last winter and now expect activity to pick up through summer. There are wide differences across industries. Growth in oil services is strong thanks to vigorous investment in the petroleum industry. Many enterprises report that the krone depreciation is improving cost competitiveness and boosting tourism. At the same time, retail trade contacts expect a fall in activity ahead and indicate that a weaker krone is pushing up costs and that higher selling prices will dampen demand. The construction industry expects a further fall in activity owing to continued weak new home sales. In the market for existing homes, turnover has remained buoyant and house prices have been higher than expected. House prices are expected to show little change in the near term.
The Norwegian economy is projected to grow cautiously ahead, with activity supported by high petroleum investment and increased exports. Higher public expenditure and increased transfers to households will also lift activity. At the same time, household real disposable income is projected to be lower than in 2022, leading to a fall in consumption this year. The saving ratio has moved down from the high levels observed during the pandemic, and households are expected to continue drawing down on existing savings this year. Further ahead, major investments related to climate transition are set to lift activity.
Capacity utilisation and labour shortages according to the Regional Network. Percentage shares
Inflation has been markedly higher than expected
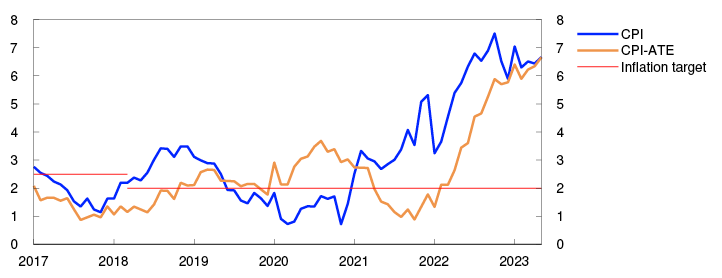
In Norway, inflation is high. Prices have increased for a range of goods and services. The 12-month rise in the consumer price index (CPI) has edged up and was 6.7% in May, which was higher than projected in the March Report. Energy and food prices in particular have been higher than expected. Various indicators of underlying inflation have risen since the March Report. The 12-month rise in the CPI adjusted for tax changes and excluding energy products was 6.7%, which was also higher than projected. Prices for both imported goods and domestically produced goods and services have risen more than expected.
Wage growth is set to be higher than projected in March. Annual wage growth in 2023 is now projected at 5.5%, which is slightly higher than the wage expectations of the social partners and the enterprises in the Bank’s Regional Network.
Weaker international inflationary impulses will help curb the rise in prices for imported goods, but imported inflation is nevertheless expected to be higher ahead than envisaged in March owing to a weaker-than-projected krone. That, combined with higher wage growth, suggests that underlying inflation is likely to remain elevated longer than envisaged earlier.
Inflation expectations have increased over the past year according to Norges Bank’s Expectations Survey. Long-term inflation expectations fell slightly over spring but are still higher than 2%.
CPI and CPI-ATE. Twelve-month change. Percent
Policy rate raised to 3.75%
The objective of monetary policy is annual consumer price inflation of close to 2% over time. Inflation targeting shall be forward-looking and flexible so that it can contribute to high and stable output and employment and to counteracting the build-up of financial imbalances.
Inflation is markedly above the target. Wage growth is set to be higher than in 2022. Activity remains high amid continued tightness in the labour market, but pressures in the Norwegian economy are easing.
The Committee judges that a higher policy rate than previously signalled is needed to bring inflation down to target. Inflation has been markedly higher than projected in the March Report. International interest rates have risen more than anticipated. Higher wage growth and a weaker krone than projected earlier will push up inflation ahead. The Committee gave weight to the risk that prices and wages could continue to rise rapidly and inflation become entrenched if monetary policy is not tightened. It may then become more costly to bring inflation down again.
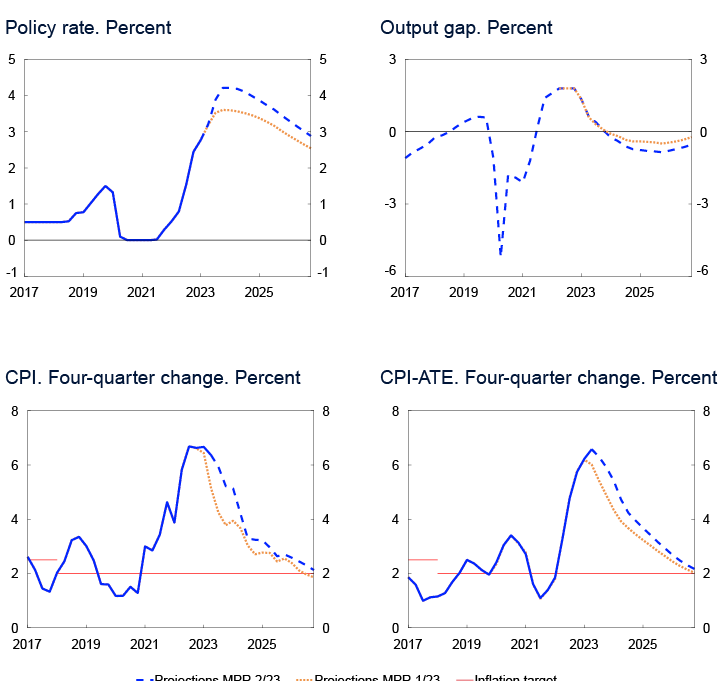
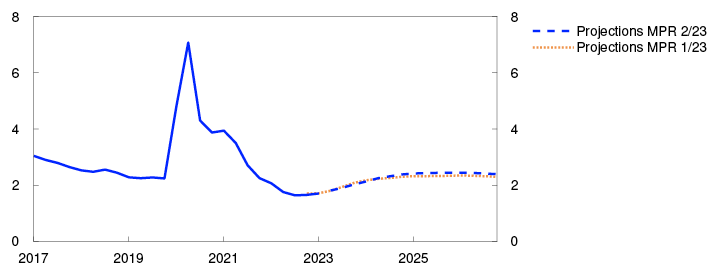
The policy rate forecast has been revised up since the March Report and indicates a rise in the policy rate to 4.25% in the course of autumn. Higher interest rates and elevated inflation are expected to curb demand in the Norwegian economy. Economic growth is projected to be subdued this year, before picking up gradually again towards the end of next year. Unemployment is likely to edge up ahead. Inflation is projected to moderate and approach the target somewhat further ahead.
The interest rate path ahead will depend on economic developments. If the krone turns out to be weaker than assumed or pressures in the economy persist, a higher-than-projected policy rate may be needed to bring inflation down towards the target. At the same time, the effects of the past rate hikes are not yet fully evident. Looking ahead, the tightening effect of high inflation and higher interest rates on household consumption is uncertain. If inflation declines more rapidly or there is a more pronounced slowdown in the Norwegian economy, the policy rate may be lower than currently envisaged.
The Committee decided unanimously to raise the policy rate by 0.50 percentage point to 3.75% at its meeting on 21 June. The Committee’s current assessment of the outlook and balance of risks implies that the policy rate will most likely be raised further in August.
Ida Wolden Bache
Pål Longva
Øystein Børsum
Ingvild Almås
Jeanette Fjære-Lindkjenn
21 June 2023
1 Period: 1 January 2017 – 31 December 2026. Daily data through 20 June. Quarterly data from 2023 Q2 for MPR 1/23 and 2023 Q3 for MPR 2/23. Forward rates at 21 March 2023 for MPR 1/23 and at 20 June 2023 for MPR 2/23. ECB’s deposit facility rate for the euro area.
2 Period: 1 January 2020 – 20 June 2023. A higher I-44 index indicates a weaker krone exchange rate. Projections from 1 April 2023 for MPR 1/23.
3 Period: January 2020 – June 2023. Projections from 17 March 2023 for MPR 1/23.
4 Period: 2005 Q1 – 2023 Q2. Share of contacts that will face some or considerable difficulty meeting increased demand and share of contacts citing labour shortages as a constraint on production. The question about labour is asked only of the enterprises reporting full capacity utilisation, but the series shows the share of all contacts included in the interview period.
5 Period: January 2017 – May 2023. CPI-ATE: CPI adjusted for tax changes and excluding energy products.
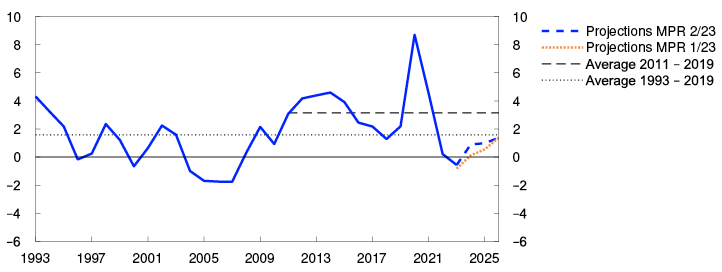
6 Period: 2017 Q1 – 2026 Q4. Projections from 2023 Q1 for MPR 1/23 and 2023 Q2 for MPR 2/23 for the policy rate, CPI and CPI-ATE. The output gap measures the percentage deviation between mainland GDP and estimated potential mainland GDP. CPI-ATE: CPI adjusted for tax changes and excluding energy products.
1. The global economy
Consumer price inflation is moving down from very high levels in many countries. Trading partner GDP growth is projected to be low in 2023, but given the solid growth at the beginning of the year, activity is higher than projected in the March 2023 Monetary Policy Report. Policy rate expectations among Norway’s trading partners have risen markedly since the March Report.
Consumer price inflation expected to decline ahead
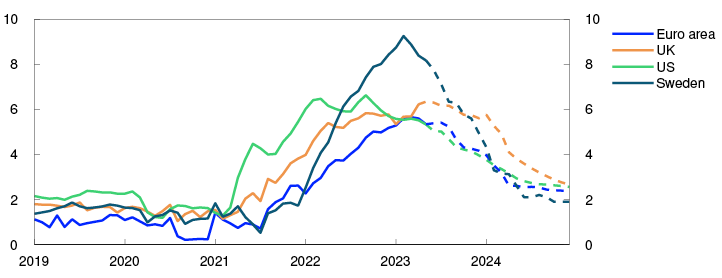
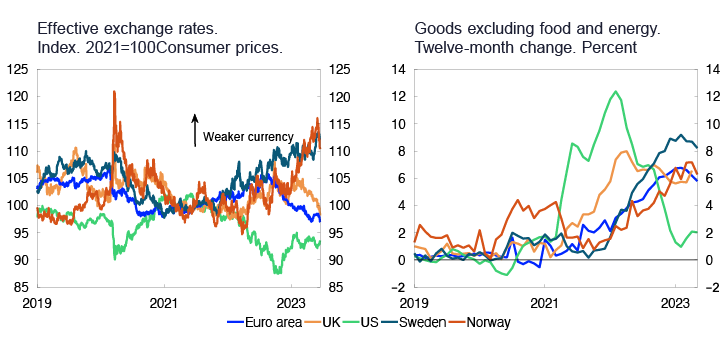
Pandemic-related supply and demand conditions and the war in Ukraine have led to high inflation among Norway’s main trading partners since autumn 2021, but 12-month CPI inflation has fallen considerably in both the US and Europe in recent months (Chart 1.1).
Consumer prices. Twelve-month change. Percent
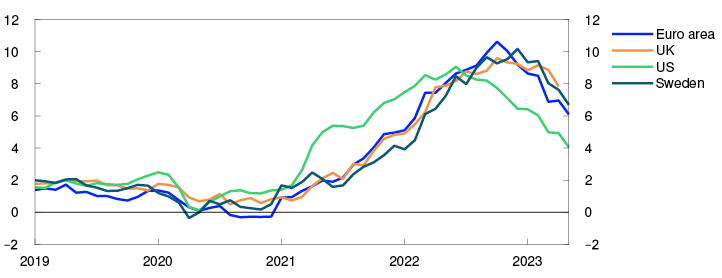
Underlying consumer price inflation fell to 5.3% in the euro area and the US in May but rose to over 6% in the UK in April (Chart 1.2). In Sweden, food products are included in the measure of underlying inflation, while they are excluded in the other countries, thereby contributing to higher underlying inflation in Sweden. In recent months, underlying inflation in the UK and Sweden has been far higher than expected.
Underlying consumer prices. Twelve-month change. Percent
Freight rates are now down to pre-pandemic levels, and energy prices have shown a marked decline over the past year. Prices for a range of commodities, including metals and food, have also fallen since the turn of the year, which in isolation will curb consumer goods inflation. Developments in energy and commodity prices are discussed further in "Gas and electricity prices are somewhat lower than in March". Wage growth among Norway’s main trading partners is projected to rise to 5% in 2023 and then drift down gradually in the course of the projection period owing to higher interest rates and lower capacity utilisation. Long-term market-based inflation expectations are close to the inflation targets in both the US and the euro area. Since the March Report inflation expectations have risen slightly in the euro area, while they are little changed in the US. Underlying inflation for trading partners as a whole is projected to increase from 4.8% in 2022 to 5.3% in 2023, before gradually slowing to around 2% in 2026. The 2023 and 2024 projections for both price and wage inflation have been revised up from the March Report.
Higher policy rate expectations
Since the March Report, central banks abroad have continued to tighten monetary policy. Central banks in the US, euro area, UK and Sweden have all raised policy rates further. However, the US Federal Reserve kept the federal funds target rate unchanged at the Federal Open Market Committee (FOMC) meeting in June. This is the first FOMC meeting since January 2022 without a rate hike. Both forward rates and the committee members’ projections indicate a further rise in the federal funds rate target range.
Financial market developments since the March Report must be viewed in the context of a sharp fall in policy rate expectations and equity indexes in the weeks before the publication of the Report. The fall was in response to the turbulence related to problems at some US and Swiss banks. In recent months, the turbulence seems to have abated and now appears to be primarily related to certain US regional banks. Policy rate expectations among Norway’s main trading partners have risen markedly since the March Report, in part reflecting continued high inflation and reduced turbulence in banking markets, but they are nonetheless slightly lower than before the banking turmoil started. Long-term government bond yields have also risen since the March Report, but these are also mostly lower than before the banking turmoil (Chart 1.3). Corporate bond risk premiums have fallen since the March Report, while global equity indexes have risen.
GDP for trading partners. Quarterly change. Percent
Weak near-term growth prospects
Among Norway’s trading partners, capacity utilisation was likely higher than normal in 2022. Labour markets are tight. Weak GDP growth is expected in the coming quarters before picking up towards the end of 2023 and into 2024 (Chart 1.4).
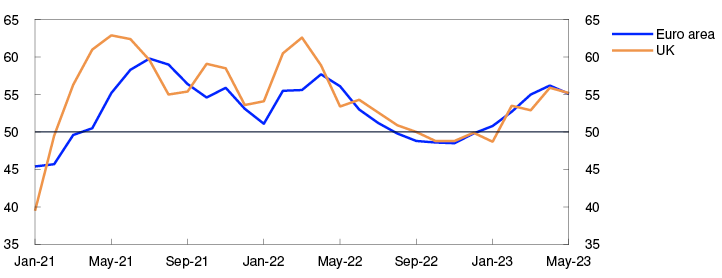
PMI services
For trading partners as a whole, GDP growth in 2023 Q1 was higher than projected in the March Report. GDP growth was particularly strong in Sweden, China and some other emerging economies.
In the US, the problems related to regional banks is contributing to a tightening of credit supply to households and firms. In addition, the agreement to suspend the debt ceiling entails government spending cuts ahead. US activity is projected to remain little changed in the second half of 2023 before growth picks up in the course of 2024.
High consumer price inflation and higher policy rates are weighing on European households’ purchasing power and consumption in 2023. Economic indicators suggest that near-term developments will be more favourable for the services sector than for retail trade (Chart 1.5). In Sweden, household consumption fell in 2023 Q1. As Swedish households are highly indebted and a large share hold floating-rate loans, interest payments rise markedly when the policy rate is raised. House prices are more than 10% lower than at the same time in 2022, and housing starts have fallen sharply. Developments are projected to continue on a weak path over the next year, with the activity level projected to fall through summer and autumn.
In China, household demand for services in particular rose markedly in 2023 Q1 after the lifting of pandemic-related restrictions. Low demand for Chinese goods both in and outside China and continued weak housing market developments are expected to dampen growth ahead.
Policy rates are assumed to move in line with market policy rate expectations and commodity prices to move in line with futures prices. Higher real wages and lower interest payments will lift household purchasing power ahead, while higher defence and energy investment in Europe will also likely boost activity through the projection period. In the UK, there are plans for fiscal tightening. Trading partner GDP growth is projected to slow from 3.5% in 2022 to 1.1% in 2023, before picking up again in 2024 (see Annex Table 1). The projection for 2023 has been revised up from the March Report, while the projection for 2024 has been revised down.
Uncertainty surrounding the economic outlook
The effects of monetary policy tightening are uncertain both because rate hikes have been large and rapid and because many countries are tightening monetary policy at the same time. If financial market stress were to flare up again, there is a risk of a further tightening of credit supply. Higher costs faced by households and businesses may lead to lower consumption and investment among trading partners than currently envisaged. Consumer price inflation may then also fall more rapidly. On the other hand, growth may prove to be stronger than expected if households spend a larger share of the excess savings accumulated during the pandemic than assumed. If wage earners are compensated for the high level of inflation to a larger extent than projected, or if firms increase their margins, price and wage inflation could prove higher than currently projected. The ongoing war in Ukraine is still a source of uncertainty over developments ahead, as are geopolitical tensions between the US and China.
1 Period: January 2019 – May 2023. For the UK, January 2019 – April 2023
2 Period: January 2019 – December 2024. Projections from June 2023. For the US, energy, food products and beverages are excluded from consumer prices in underlying CPI, for the euro area and the UK, energy, food products, tobacco and alcohol are excluded, and for Sweden, energy prices are excluded.
3 Period: 2021 Q1 – 2024 Q4. Projections from 2023 Q1 for MPR 1/23 and 2023 Q2 for MPR 2/23. Export weights. 13 trading partners.
4 Period: January 2021 – May 2023. Survey of purchasing managers. Diffusion index centred around 50.
Gas and electricity prices are somewhat lower than in March
Energy and non-energy commodity prices have fallen sharply from the record levels seen in 2022 but remain high.
The European gas benchmark price has edged down since March. Until the beginning of June, lower gas consumption and an ample supply of liquefied natural gas (LNG) to Europe had contributed to considerably lower prices. Recently, however, much of the price decline has been reversed due to hot and dry weather. Dutch gas production has been reduced further, and the plan now is to shut down production completely in the course of 2023. In addition, LNG prices have moved up again
Futures prices indicate somewhat lower prices for the remainder of 2023 compared with March. For subsequent years, futures prices are higher than in March (Table 1.A). The high level of gas inventories may dampen a rise in prices if gas consumption were to pick up or if LNG supply to Europe were to be reduced. Futures prices well above the historical average despite abundant gas inventories indicate that there is still considerable uncertainty ahead.
Table 1.A Energy and commodity prices
|
Percentage change from projections in Monetary Policy Report 1/23 in brackets |
Average price (2010–2019) |
Actual prices and futures prices1 |
|||||
|
2021 |
2022 |
2023 |
2024 |
2025 |
2026 |
||
|
Oil, USD/barrel |
80 |
71 |
101 |
78 (4) |
73 (5) |
71 (3) |
69 (2) |
|
Dutch gas, USD/barrel |
40 |
87 |
205 |
74 (-9) |
89 (4) |
77 (10) |
61 (11) |
|
Petroleum2, USD/barrel |
63 |
85 |
163 |
77 (-2) |
83 (5) |
75 (6) |
65 (6) |
|
Coal, EUR/tonne |
66 |
102 |
277 |
114 (-8) |
103 (-15) |
101 (-11) |
100 (-9) |
|
Emission allowance prices, EUR/tonne |
10 |
53 |
81 |
89 (2) |
95 (6) |
99 (5) |
103 (4) |
|
German electricity, øre/kWh |
36 |
106 |
258 |
134 (-7) |
167 (7) |
148 (13) |
120 (5) |
|
Nordic electricity, øre/kWh |
32 |
64 |
142 |
80 (10) |
78 (2) |
66 (0) |
54 (-3) |
|
Electricity in southern Norway, øre/kWh |
31 |
79 |
206 |
108 (3) |
108 (-3) |
96 (-1) |
80 (-4) |
|
Electricity in northern Norway, øre/kWh |
32 |
41 |
38 |
50 (13) |
41 (-9) |
40 (-10) |
40 (-6) |
|
Aluminium, in thousands of USD/tonne |
1.9 |
2.5 |
2.7 |
2.3 (-1) |
2.4 (-3) |
2.5 (-3) |
2.6 (-3) |
|
Copper, in thousands of USD/tonne |
6.8 |
9.3 |
8.8 |
8.6 (0) |
8.6 (0) |
8.6 (0) |
8.5 (0) |
|
Wheat, USD/tonne |
210 |
258 |
331 |
254 (-5) |
271 (0) |
273 (2) |
- |
|
Maize, USD/tonne |
183 |
227 |
271 |
247 (1) |
229 (3) |
210 (1) |
198 (3) |
1 Futures prices at 16 June 2023.
2 An estimated Norwegian petroleum export price. The price has been estimated based on the share of oil and gas in historical export figures. For futures prices, oil and gas are calculated on the basis of expected market prices.
Sources: Refinitiv Datastream and Norges Bank
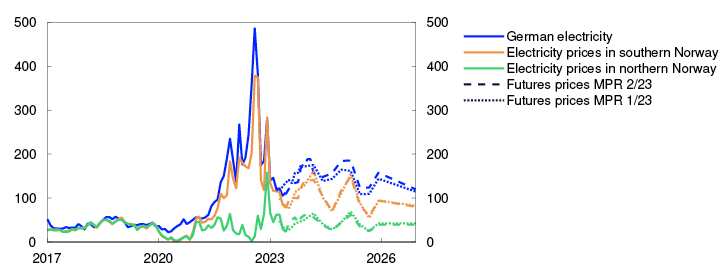
European wholesale electricity prices have largely moved in line with gas prices as gas-fired power plants are often the production technology that determines electricity prices. However, as wind and solar capacity continues to expand, electricity prices may vary considerably over short periods. Futures prices for European electricity indicate somewhat lower prices for the remainder of 2023 compared with March, but somewhat higher prices in subsequent years.
Electricity prices in southern Norway have moved in line with developments in European wholesale electricity prices. Water reservoir levels are now close to the historical average for this time of the year. Recent dry weather has pushed up futures prices in the near term compared with March. Further out, these prices show little change (Chart 1.A). Wholesale electricity prices in northern Norway are still considerably lower than in southern Norway. Futures prices in northern Norway are also significantly lower than in southern Norway, albeit somewhat higher than the historical average.
Øre/kWh
Oil prices have risen slightly since March and are around USD 75 per barrel, which is nonetheless lower than average oil prices so far in 2023. Oil prices fell in response to financial market turbulence related to problems in some US and Swiss banks in March. OPEC+ countries have cut oil production, most recently at the beginning of June, in order to underpin prices. Uncertainty about developments in the global economy pulls in the opposite direction. Futures prices are little changed since March.
Overall, industrial metals prices have fallen since March. Futures prices are also lower but still indicate somewhat higher price levels than prior to the pandemic. Weak global manufacturing activity may have pushed down prices.
Overall, global agricultural commodity prices are slightly lower than in March. Futures prices are little changed. Partly owing to climate change, geopolitical uncertainty and high intermediate goods prices, futures prices indicate higher prices ahead than in pre-pandemic years.
1 Period: January 2017 – December 2026. Futures prices at 17 March 2023 for MPR 1/23 og 16 June 2023 for MPR 2/23.
2. Financial conditions
Financial conditions in Norway are tighter than at the time of the March 2023 Monetary Policy Report. In the period ahead, a higher policy rate will lead to higher household and corporate lending rates. The average residential mortgage rate is set to rise to around 5.4% in the course of 2024. There has been considerable volatility in the krone exchange rate in recent months, and on average, the krone has been weaker than projected in the March Report. The krone is expected to appreciate ahead but remain weaker than projected in March.
2.1 Monetary policy since March
Financial conditions are tighter
At the monetary policy meeting in March, the Monetary Policy and Financial Stability Committee raised the policy rate from 2.75% to 3%. At the meeting in May, the policy rate was raised further to 3.25%. At the same time, the Committee signalled that the policy rate would most likely be raised again in June.
In response to the turmoil at some banks in the US and Switzerland, market policy rate expectations fell markedly ahead of the policy rate meeting in March. Policy rate expectations edged up again after the March Report was published. They rose further through spring, reflecting in part reduced banking sector stress and higher interest rates abroad. Expectations also rose after the consumer price index for May was published, which showed that inflation was higher than most forecasters had anticipated. Even though market policy rate expectations have risen, they are still a little lower than the policy rate forecast in this Report.
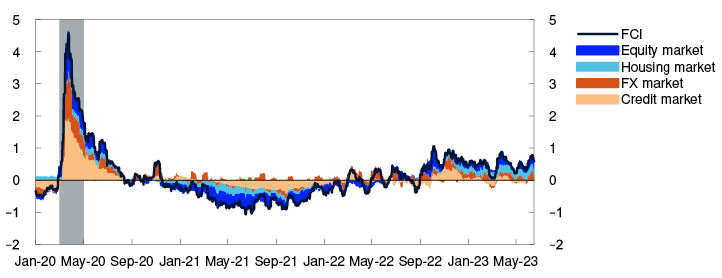
Financial conditions summarise developments in the financing terms for banks, households and firms. A higher policy rate and expectations of a further policy rate increase have contributed to tighter financial conditions than in March. Financial conditions beyond these, as measured by Norges Bank’s financial conditions index (FCI), are broadly unchanged from the March Report (see discussion of the FCI in "Financial conditions index (FCI)").
2.2 Household and corporate lending rates
Residential mortgage rates have risen in response to a higher policy rate
Household lending rates have risen in response to increases in the policy rate. At the end of April, the average residential mortgage rate was 4.2%, that is, close to 90% of the increase in the policy rate since September 2021 had passed through to the average residential mortgage rate. Data from Finansportalen indicate that the rate on new floating-rate residential mortgages rose further following the policy rate hike in May. Overall developments in residential mortgage rates have been broadly as projected in the March Report.
Interest rates. Percent
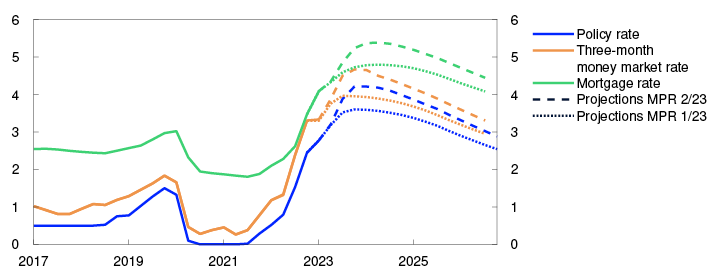
Sources: Refinitiv Datastream, Statistics Norway and Norges Bank The policy rate pass-through to household deposit rates was weak for a long time but has picked up markedly since December 2022. At the end of April, the average household deposit rate was close to 1.8%. The spread between banks’ residential mortgage rates and household deposit rates has thus narrowed somewhat in recent months.
In the projections, residential mortgage rates continue to increase in the coming years in response to further policy rate hikes. Given the policy rate forecast in this Report, the average residential mortgage rate is projected to rise to 5.4% in the course of 2024, before falling back towards the end of the projection period.
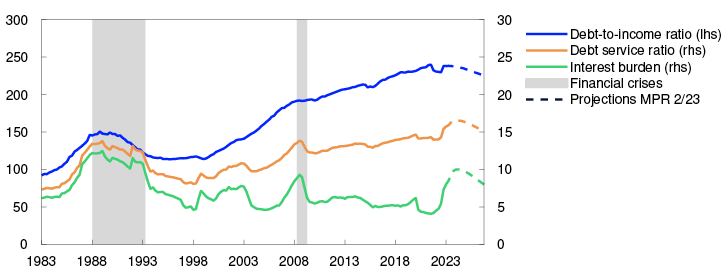
Household debt is projected to rise ahead, but at a slower pace than in recent years. Measured as a share of disposable income, household debt is projected to fall from just under 240% in 2023 to somewhat below 230% in 2026 (Chart 2.2). Nevertheless, the projected increase in lending rates implies that households will have to spend more of their income on interest payments ahead. In the projections, household interest burdens rise from 9% in 2023 to 10% in 2024. This will be the highest interest burden since the early 1990s, Towards the end of the projection period, the interest burden is projected to decline again.
Percent
Further rise in corporate lending rates
In pace with the general interest rate rise, firms have had to pay more for new loans in recent years (Chart 2.3). At the end of April, the interest rate on new floating-rate corporate loans was 5.3%, measured as a weighted average of bank and bond debt.
Interest rates on new floating-rate NOK finance for non-financial enterprises. Percent
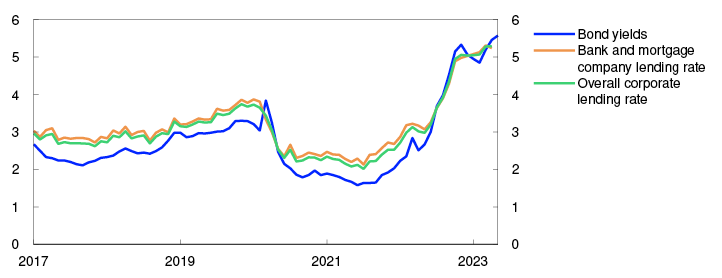
The interest rate on new floating-rate corporate funding is closely linked to the three-month money market rate Nibor. Since March, Nibor has increased further in response to a higher policy rate and expectations of a further policy rate increase in summer.
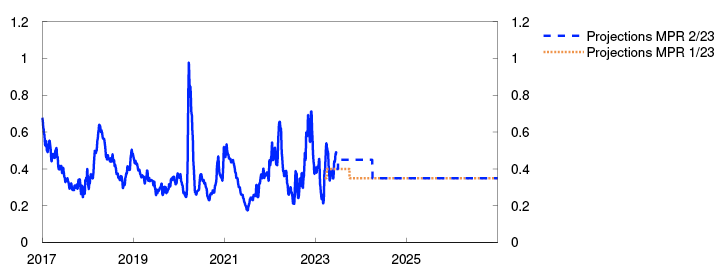
Nibor also reflects a risk premium in addition to the expected policy rate. So far in 2023 Q2, this money market premium has averaged 0.40 percentage point, as projected in the March Report. In the coming quarters, the premium is set to remain somewhat higher, declining thereafter to 0.35 percentage point (Chart 2.4). The projections are close to the market’s pricing of the premium on forward money market rates.
Money market premium. Percentage points
In addition to Nibor, firms pay a premium on new funding in the form of a margin on bank funding or a bond risk premium. Lending spreads on new bank loans edged up in 2023 Q1, in line with what banks reported in Norges Bank’s lending survey. Bond market risk premiums are broadly unchanged from the March Report. For commercial real estate (CRE) firms, risk premiums are high and have risen a little since the March Report. Looking ahead, costs for new floating-rate corporate loans are expected to evolve in pace with the policy rate.
The level of long-term interest rates is important. Since the March Report, long-term interest rates have risen by up to 0.90 percentage point, which means that new fixed-rate loans have become more costly.
Overall equity prices on Oslo Børs have edged up since the March Report. Equities have rallied in most sectors, but consumer goods, financial and petroleum industry stocks have made the largest contribution to the rise in the Benchmark Index.
1 Period: 2017 Q1 – 2026 Q4. Projections from 2023 Q1 for MPR 1/23 and 2023 Q2 for MPR 2/23. The mortgage rate is the average rate on outstanding mortgage loans to households from the sample of banks and mortgage companies included in Statistics Norway’s monthly interest rate statistics.
2 Period: 1983 Q1 – 2026 Q4. Projections from 2023 Q2 for MPR 2/23. Debt-to-income ratio is debt as a share of disposable income. Disposable income is after-tax income less interest expenses. Debt service ratio is interest and estimated principal payments on loan debt to after-tax income. Interest burden is interest payments as a share of after-tax income.
3 Period: January 2017 – May 2023. Bank and mortgage company lending rates and overall corporate lending rates up to and including April 2023. Bond yields up to and including May 2023.
4 Period: 1 January 2017 – 31 December 2026. Five-day moving average. Latest observation on 16 June 2023. Projections from 2023 Q1 for MPR 1/23 and 2023 Q2 for MPR 2/23. The premium in the Norwegian money market rate is the difference between the three-month money market rate and the expected policy rate.
2.3 Supply of credit to households and firms
Ample supply of credit to households and firms
Banks are the primary source of credit for Norwegian households and firms. Norwegian banks are solid, liquid and highly profitable (see Financial Stability Report – 2023 H1). This enables banks to lend to creditworthy firms and households, also if banks’ funding conditions weaken. The turbulence surrounding some foreign banks in March did not have any appreciable impact on funding conditions for banks and other financial institutions in Norway.
Creditworthy households and firms have access to ample credit. The banks in Norges Bank’s lending survey in April reported unchanged credit standards for households, after they tightened a little towards the end of 2022. Overall corporate credit standards have been broadly unchanged. However, over the past three quarters, banks have reported somewhat tighter credit standards for CRE firms. The outlook for property prices is more uncertain than normal, and banks’ large CRE exposures are a key vulnerability in the Norwegian financial system (see Financial Stability Report – 2023 H1).
2.4 Krone exchange rate
The krone has been weaker than projected
Measured by the import-weighted exchange rate index I-44, the krone exchange rate has been around 2.4% weaker so far in Q2 than projected in March. Recently, the krone has regained some strength. The appreciation coincided with the increase in market policy rate expectations after the consumer price inflation data for May came in higher than expected. Measured by the I-44, the krone is now a little weaker than at the time of the March Report.
Since the beginning of the year, the krone has depreciated by around 7% as measured by the I-44. The depreciation in this period reflects the low interest rate differential against other countries and the fall in petroleum prices. However, the depreciation has been more pronounced than implied by the historical relationship with these variables. In light of this, the krone is now projected to remain weaker than in the March Report throughout the projection period. In Norges Bank’s modelling system, this is accounted for by assuming a weaker real equilibrium exchange rate. The equilibrium exchange rate is unobservable and difficult to estimate. When updating the estimate of the equilibrium exchange rate, one eye is therefore kept on developments in the actual real exchange rate over time (see box on the krone exchange rate in the March Report). In the Bank’s judgement, there is still a positive risk premium on the krone, which is contributing to keeping the exchange rate weaker than its equilibrium level. In the period ahead, the risk premium is expected to decline gradually and the krone to appreciate by around 5% in the course of the projection period (Chart 2.5).
Import-weighted exchange rate index (I-44). Difference between policy rate in Norway and among trading partners. Percentage points
Further movements in the krone are uncertain. Renewed financial market uncertainty abroad or in Norway may contribute to keeping the krone weaker than projected. On the other hand, the krone may appreciate more if the interest rate differential against other countries increases more than projected or the risk premium falls faster.
Financial conditions index (FCI)
The financial conditions index (FCI) provides an overall picture of the price and availability of different types of financing beyond that indicated by the policy rate and policy rate expectations further out. It provides an indication of the tightness or accommodativeness of financial conditions compared with a historical average. For more on the Norwegian FCI, see Monetary Policy Report 4/22 and Staff Memo 1/20231.
The FCI rose through autumn 2022. This indicates that the impact of monetary tightening in the period was amplified by a tightening of other financial conditions. The FCI fell at the beginning of 2023 but rose again in response to the international banking sector turmoil. The overall FCI is little changed since the March Report (Chart 2.A). Lower credit and money market premiums led to more accommodative conditions for a period, but premiums have recently risen slightly, and weaker equity markets and increased foreign exchange market volatility have led to a tightening of financial conditions.
Financial conditions index. Standard deviation from mean
1 Bowe, F., K.R. Gerdrup, N. Maffei-Faccioli and H. Olsen (2023) “A high-frequency financial conditions index for Norway” Norges Bank Staff Memo 1/2023.
2 Period: 1 January 2020 – 16 June 2023.
5 Period: 2017 Q1 – 2026 Q4. Projections from 2023 Q1 for MPR 1/23 and 2023 Q2 for MPR 2/23. A higher index value for I-44 denotes a weaker krone exchange rate. Left-hand scale is inverted. Interest rate differential against Norway’s main trading partners.
3. The Norwegian economy
Consumer price inflation is markedly above the target of 2%. Unemployment is low, and the employment rate is high.
Looking ahead, inflation is expected to fall and approach the target on the back of higher interest rates, weaker external inflationary pressures and lower energy price inflation. Unemployment is expected to edge up.
3.1 Output and demand
Weak growth ahead
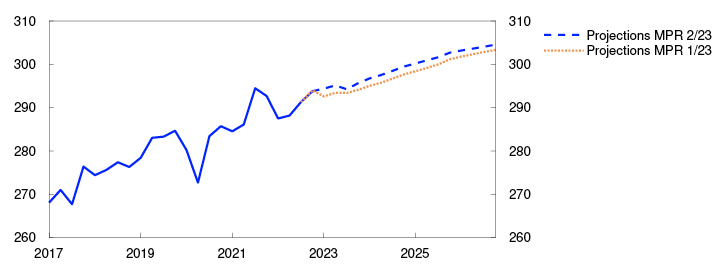
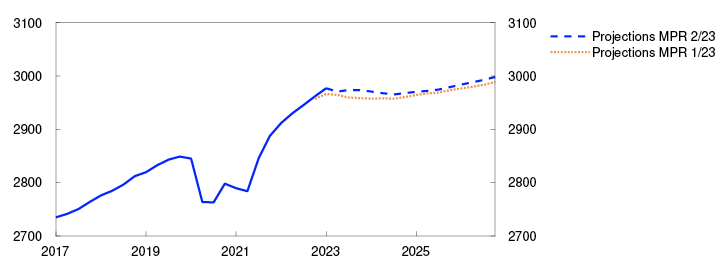
Following solid growth through 2022, mainland GDP growth has slowed in 2023. Mainland GDP fell in April and was slightly lower than projected.
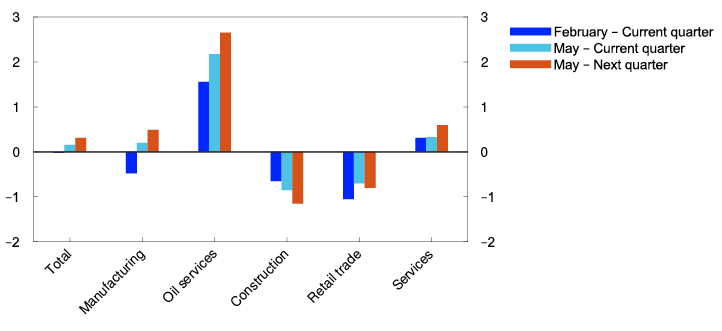
Overall, Norges Bank’s Regional Network contacts expect activity to rise through summer, but there are wide variations across sectors (Chart 3.1). Oil services contacts expect a sharp rise owing to higher petroleum sector investment in Norway and abroad. The krone depreciation is improving prospects for many contacts in manufacturing and services. On the other hand, the decline in construction has accelerated, largely reflecting continued weak new home sales. Retail trade contacts also expect lower demand in the period ahead.
Expected growth according to the Regional Network. Annualised. Seasonally adjusted. Percent
The Norwegian economy is assessed to have reached a cyclical peak in the second half of 2022, and growth is projected be subdued ahead. The projections for the current and subsequent quarters are in line with the expectations of Regional Network contacts and slightly lower overall than the forecasts from Norges Bank’s System for Model Analysis in Real Time (SMART) (See "SMART – System for Model Analysis in Real Time").
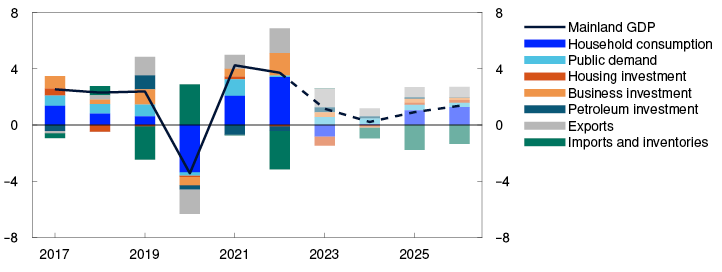
In the projection, mainland GDP increases by 1.2% in 2023 (Chart 3.2). Higher interest rates and high inflation dampen demand in the Norwegian economy and contribute to a decline in household consumption and housing investment in 2023. On the other hand, a weaker krone has improved Norwegian firms’ cost competitiveness, pulling in the direction of higher activity. Expansionary fiscal policy also boosts activity in 2023. Through 2025 and 2026, economic growth is expected to pick up gradually, primarily due to increased exports and consumption. The mainland GDP projections are little changed from the March Report.
GDP for mainland Norway. Annual change. Percent. Contribution to annual change. Percentage points
High inflation and higher interest rates curb consumption growth ahead
Household consumption rose substantially towards the end of 2022, but fell in 2023 Q1, reversing the rise in 2022 Q4 (Chart 3.3). Developments have primarily been driven by volatility in household car purchases. Overall, consumption has been slightly stronger than expected owing to a smaller-than-projected fall in goods consumption.
Household consumption. Constant 2019 prices. Seasonally adjusted. In billions of NOK
Given prospects for a decline in real wages and higher interest expenses, household real disposable income is projected to fall by over 2% in 2023, with the decline cushioned by increased pensions and other central government transfers. In the projections, consumption falls by 1.6% in 2023 due to weaker purchasing power. Goods consumption shows the largest decline, while services consumption shows a weak rise through 2023. This is in line with information from Regional Network contacts, where household-oriented firms expect increased demand, while retail trade contacts expect a marked decline in the period ahead.
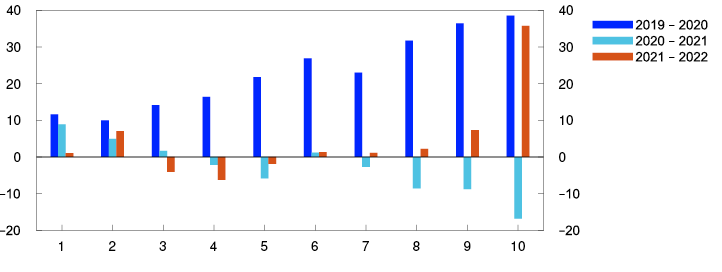
Higher real wage growth pushes up household real disposable income in the years ahead. However, higher interest expenses dampen income growth in the coming years. The projections for household consumption have been revised down as real disposable income is set to be lower than previously projected. The saving ratio fell through 2022 and was negative in autumn, which means that households maintained their consumption by drawing on savings or by borrowing. In the projection, households do not reduce their consumption by as much as the decline in income in 2023 either, but saving increases again from 2024 (Chart 3.4). Preliminary analyses of a share of Norwegian households’ tax returns for 2022 indicate that most households still hold more bank deposits than they did before the pandemic. By income group, households near the middle of the income distribution have drawn the most on their bank deposits (Chart 3.5).
Household saving ratio excluding dividends. Percent
Change in median bank deposits from the previous year by income deciles. In thousands of NOK
Close to zero growth in house prices in 2023
House prices have risen since the beginning of 2023 after having fallen slightly in autumn 2022. In the market for existing homes, turnover has remained elevated so far in 2023, while the number of homes listed for sale has increased. House prices have been higher than projected. Low unemployment and growth in real disposable income so far in 2023 have likely contributed to underpinning housing demand.
House prices are expected to edge down in the second half of 2023, reflecting, among other things, higher lending rates and an increase in the stock of unsold homes. However, house prices are expected to be almost 18% higher at the end of 2023 than pre-pandemic levels. House prices are expected to rebound through 2024, as residential construction activity is low and mortgage rates are set to stabilise and eventually decline. House price projections for the coming years are higher than in the March Report as demand for existing homes has remained higher than previously assumed. Developments in real house prices are less changed since the March Report. Real house prices are projected to fall in both 2023 and 2024, before they start to pick up again in 2025 (Chart 3.6).
Housing investment and real house prices. Annual change. Percent
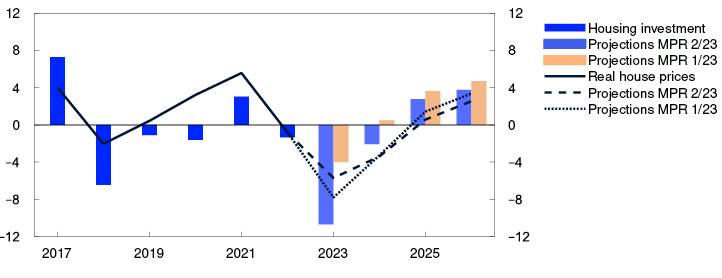
Despite the rise in nominal house prices, housing investment fell in 2023 Q1, likely curbed by high construction costs. Developments in housing investment reflect movements in real house prices. The decline in housing investment was more pronounced than projected in the March Report. Housing investment is expected to move down further ahead owing to lower real property prices and weak new home sales. New home sales are down sharply since the beginning of 2022, and housing starts have fallen appreciably in recent months. Further out, housing investment is projected to recover somewhat.
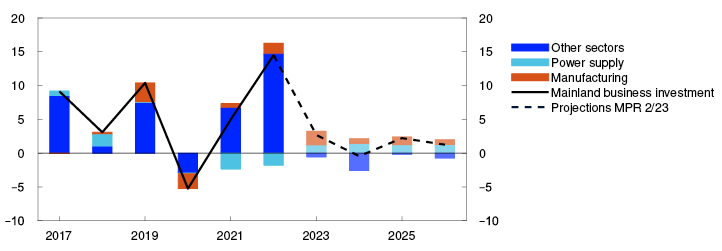
Weaker growth in business investment
Mainland business investment increased substantially in 2022, mainly driven by services sector investment.
In the projection, growth in business investment is appreciably lower in 2023. Strong cost inflation, higher interest rates and weaker profitability for many firms weigh on investment. Prices for investment goods will likely rise further in response to the krone depreciation in 2023. Services investment falls from the high level observed in 2022. On the other hand, the climate and energy transition will push up investment in manufacturing and power supply in the coming years (Chart 3.7). Overall, mainland business investment increases moderately through the projection period. The projections are little changed compared with the March Report.
Business investment in mainland Norway. Annual change. Percent. Contribution to annual change. Percentage points
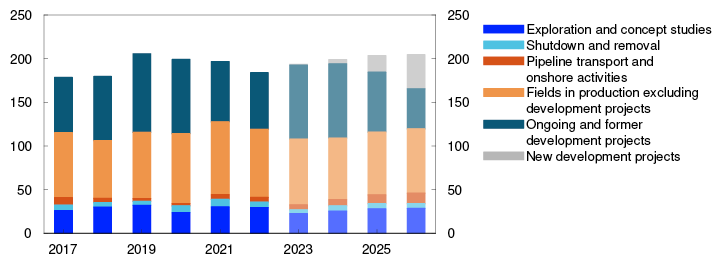
Following the completion of several large projects on the Norwegian shelf, petroleum investment fell each year between 2019 and 2022. However, oil companies submitted a number of development plans towards the end of 2022 in response to the petroleum tax package and high oil and gas prices. Given the new projects, petroleum investment is expected to rise significantly until the mid-2020s (Chart 3.8). However, the projected rise is somewhat lower than in the March Report, reflecting the cancellation of one development project.
Petroleum investment. Constant 2023 prices. In billions of NOK
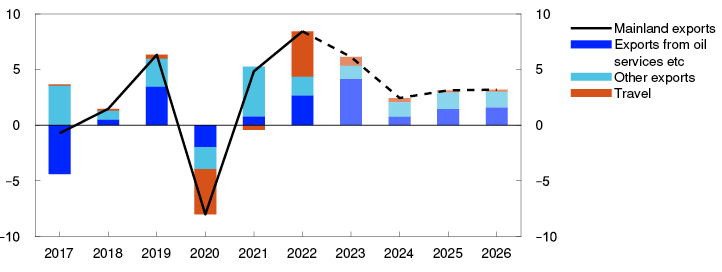
Exports continue to rise
Mainland exports picked up substantially in 2022, driven in particular by increased inbound travel and exports from suppliers of services related to oil, gas and renewable energy. Growth in travel activity and energy services exports is expected to be strong in 2023, but more moderate in subsequent years (Chart 3.9). The krone depreciation over the past year and stronger growth abroad will lift mainland exports ahead. Overall, export growth is also projected to be relatively high in 2023 and lower in the years ahead. The projections for exports are higher than in the March Report, primarily reflecting a weaker krone than previously assumed.
Mainland exports. Percent. Contribution to annual change. Percentage points
Foreign travel increased markedly through 2022 and contributed to strong import growth. The rise in foreign spending by Norwegian residents is expected to continue in 2023 and push up imports. Weaker growth in mainland demand and a weaker krone will likely dampen import growth in 2024. Import growth is expected to pick up again thereafter as demand recovers.
Higher public sector demand
Public demand picked up towards the end of 2022, and the rise continued into 2023 Q1. The Revised National Budget for 2023 indicates a somewhat more expansionary fiscal policy than in the 2022 budget. Transfers to private individuals and public sector allocations will be price- and wage-adjusted. Increased support for Ukraine has also been announced. A number of the budgetary measures were announced at the beginning of the year and were incorporated into the projections in March, but the adjustments to the Revised National Budget nevertheless pull up the structural non-oil deficit somewhat compared with the projections in the March Report.
In line with the Revised National Budget, growth in public demand is projected to be higher in 2023 than in 2022. The projections for public demand and transfers are revised up slightly from March (Chart 3.10).
Public demand. Constant 2019 prices. Seasonally adjusted. In billions of NOK
The projections are uncertain
The projections for the Norwegian economy are uncertain. There is considerable uncertainty related to households’ response to higher prices and higher interest rates. Monetary policy operates with a lag, and the extent to which households will maintain their consumption when their purchasing power declines further is unclear. Consumption may prove higher than projected if households save a smaller share of their income than assumed. The longer-term effects of a weaker krone are also uncertain. In the short term, a weaker krone is expected to boost activity in the Norwegian economy, but in the slightly longer term, increased costs can dampen investment more than assumed. In that case, mainland economic growth may be lower than projected ahead.
SMART – System for Model Analysis in Real Time
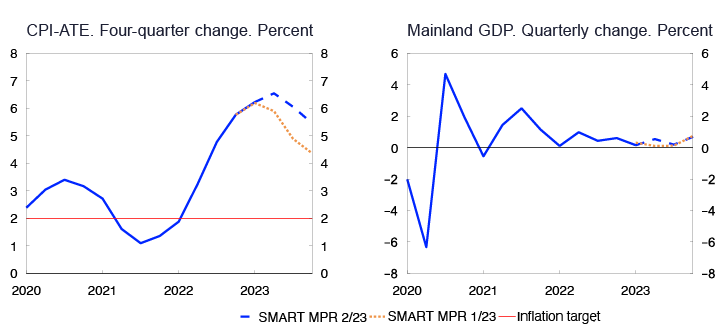
Norges Bank has developed a new platform for forecasting models: the System for Model Analysis in Real Time (SMART). In SMART, forecasts from a broad set of empirical models are averaged based on their historical forecasting properties. The SMART forecasts for both CPI-ATE inflation and GDP are higher than in the March Report.
The economics literature shows that averaged forecasts from several models are often more accurate than forecasts from individual models.1 In SMART, we average information from many models for CPI-ATE inflation and mainland GDP based on how well the models have previously forecast economic developments. Read more about SMART in Staff Memo 7/2023.2
The SMART mainland GDP forecasts are higher than in the March Report (right panel in Chart 3.A). SMART forecasts quarterly growth of 0.5% in 2023 Q2 and 0.2% in Q3. The upward revisions reflect in particular a slightly improved outlook among Regional Network enterprises. The SMART forecasts are higher than the GDP projections in this Report, partly because the monthly national accounts, which showed weak developments in April, are given little weight in SMART.
According to the SMART forecasts, inflation measured as the four-quarter change in the CPI-ATE will peak at 6.6% in 2023 Q2, declining thereafter (left panel in Chart 3.A). The SMART forecasts are up to 1.2 percentage points higher than in the March Report. The upward revision reflects the fact that actual inflation has been higher than the SMART forecasts from the March Report, in addition to a weaker-than-projected krone exchange rate and higher-than-projected wage growth. The SMART forecasts for the rise in prices for both domestically produced goods and services and imported goods are higher than in the March Report.
Chart 3.A Higher SMART forecasts3
Sources: Statistics Norway and Norges Bank
1 See eg Timmermann, A. (2006) “Forecast combinations”. In: Elliott, G., C. W. J. Granger and A. Timmermann (Eds.) Handbook of Economic Forecasting. Volume 1. Elsevier, pp 136–196.
2 Bowe, F., I.N. Friis, A. Loneland, E. Njølstad, S.S. Meyer, P. Kenneth og Ø. Robstad (2023) “A SMARTer way to forecast”. Norges Bank Staff Memo 7/2023.
3 Period: 2020 Q1 – 2023 Q4. CPI-ATE: The consumer price index adjusted for tax changes and excluding energy products. Projections from 2023 Q1 for MPR 1/23 and from 2023 Q2 for MPR 2/23. The SMART modelling system for short-term projections is based on historical relationships. It averages empirical models based on previous forecasting properties.
1 Period: February 2023 – May 2023. Expected growth current and next quarter.
2 Period: 2017 – 2026. Projections from 2023. Petroleum investment includes investment in international shipping.
3 Period: 2017 Q1 – 2026 Q4. Projections from 2023 Q1 for MPR 1/23 and 2023 Q2 for MPR 2/23.
4 Period: 1993 – 2026. Projections from 2023 for MPR 1/23 and MPR 2/23.
5 Period: 2019–2022. Preliminary analysis of the tax returns of a sample of Norwegian households.
6 Period: 2017 – 2026. Projections from 2023. Real house price inflation is nominal house price inflation adjusted for CPI growth.
7 Period: 2017 – 2026. Projections from 2023. Data for 2017–2022 from Statistics Norway’s investment intentions survey, deflated by the price index for petroleum investment in the national accounts. The price index is projected to increase by 4 percent in 2023 and by 2 percent in 2024.
8 Period: 2017 – 2026. Projections from 2023.
9 Period: 2017 Q1 – 2026 Q4. Projections from 2023 Q1 for MPR 1/23 and 2023 Q2 for MPR 2/23.
3.2 Labour market
Continued tight labour market
Unemployment is low, and the employment rate is high (Chart 3.11). Employment increased markedly through 2022, and the rise has continued into 2023. In 2023 Q1, there were 65 000 more people employed than one year earlier. Employment has been slightly higher than projected in the March Report.
Employed as a share of the population aged 15–74. Percent
At the end of May, 48 800 persons were registered as fully unemployed, ie 1.8% of the labour force adjusted for normal seasonal variations. The level is unchanged from April, but slightly higher than in March, in line with the projections in the March Report. In recent months, unemployment has risen primarily in construction, but the number of unemployed in other cyclically sensitive occupations has also risen somewhat.
Slight improvement in labour supply
The number of people that have found work over the past year is larger than the decline in unemployment, reflecting an increase in labour supply. The increase in labour supply likely reflects a higher labour force participation rate (see Monetary Policy Report 1/2023), but also an increase in the inflow of immigrants and temporary foreign workers to Norway.
Labour demand is still high (Chart 3.12). According to Statistics Norway’s sample vacancy survey, the number of job vacancies rose significantly in 2023 Q1. At the same time, NAV statistics, which measure the number of new vacancies, continued to decline. As the two statistics series show different developments, interpreting the data becomes more difficult, but the decline in new vacancies indicates that labour demand is probably declining.
Number of job vacancies in thousands
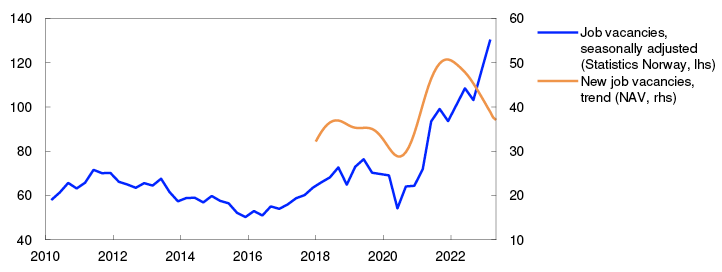
The share of Regional Network contacts reporting labour shortages fell between 2023 Q1 and Q2 (see Chart D) and is now appreciably lower than at the same time in 2022 in most sectors. Enterprises in NAV’s Enterprise Survey also reported that labour shortages had eased compared with 2022, even though labour demand is still high compared with previous years.
Prospects for higher unemployment
Following several months of solid employment growth, employment is expected to decline somewhat in the period ahead (Chart 3.13). Register-based data indicate that employment declined somewhat in April. Norges Bank’s Expectations Survey indicates slower employment growth ahead. From the end of 2024, employment is expected to gradually pick up again on the back of stronger economic growth.
Employed in thousands. Seasonally adjusted
In 2023 Q1, the number of temporary foreign workers increased somewhat, and the rise was slightly higher than expected. Seasonally adjusted, there are approximately 18 000 more temporary foreign workers than at the same time one year ago, and the number is expected to rise somewhat in the coming years. A weaker krone than previously assumed may, albeit with high uncertainty, dampen the increase in temporary foreign workers.
Unemployment is projected to rise to approximately 2.4% through the projection period (Chart 3.14). Unemployment will then be slightly above the levels observed in the years leading up to the pandemic. The unemployment projections for the coming years have been revised up slightly from the March Report.
Registered unemployed as share of the labour force. Seasonally adjusted. Percent
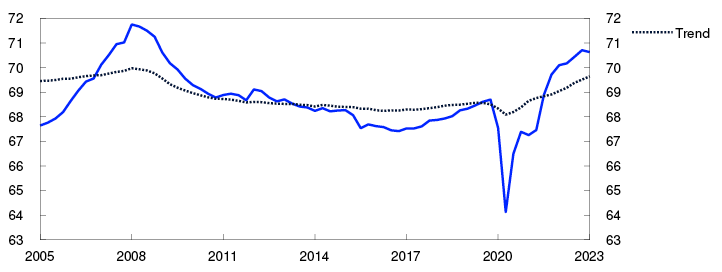
1 Period: 2005 Q1 – 2023 Q1. The trend is based on model estimates for different population groups and are extrapolated based on a population projection from Statistics Norway. See box in MPR 3/21 for details.
2 Period: Statistics Norway: 2010 Q1 – 2023 Q1. NAV: January 2018 – May 2023. As a result of missing data in NAV’s statistics at the start of 2018, only data since January 2018 are shown.
3 Period: 2017 Q1 – 2026 Q4. Projections for employment from 2023 Q1 for MPR 1/23 and from 2023 Q2 for MPR 2/23.
4 Period: 2017 Q1 – 2026 Q4. Projections from 2023 Q1 for MPR 1/23 and 2023 Q2 for MPR 2/23.
Capacity utilisation has declined
Capacity utilisation is expected to decline ahead, with output falling below potential in the course of 2023. There are prospects that output will remain below potential throughout the projection period, but edge higher in 2026.
The output gap is a measure of the difference between actual output (GDP) and potential output. Potential output is determined by productivity growth and potential employment. Potential employment may be interpreted as the highest level of employment that can be maintained over time without driving up wage growth and inflation. Potential output and the output gap cannot be observed and must therefore be estimated. The Bank’s output gap estimates are based on an overall assessment of various indicators and models. Particular weight is given to labour market developments.
The output gap is assessed to have risen into 2022, with output remaining well above potential through the year (Chart 3.B). In this period, unemployment was low, job vacancies were high and a large share of Regional Network enterprises reported capacity problems. In addition, wage growth accelerated. So far in 2023, there are signs that the output gap has begun to decline. In Q1, growth in the Norwegian economy slowed. At the same time, fewer Regional Network contacts have reported capacity problems and labour shortages. Unemployment has also risen a little. Norges Bank’s modelling system for estimating the output gap, which is based on information about such variables as mainland GDP, unemployment, wage growth and domestic inflation, indicates that capacity utilisation in the Norwegian economy edged down in Q1. In the Bank’s overall assessment, the output gap declined further to 0.6% in Q2 (Chart F).
Percent

Looking ahead, the output gap is expected to decline further and bottom out at negative 0.9% at the end of 2025. Prospects for a decline in household consumption and lower housing investment are the main reason we expect a further fall in output. The projections for capacity utilisation are little changed for 2023 but lower for the years ahead.
Owing to high immigration, population growth this year is likely to be higher than projected earlier (Chart 3.C). Moreover, the number of temporary foreign workers has increased somewhat more than envisaged. The projection for potential employment has therefore been revised up. Productivity is projected to grow at a somewhat slower pace in 2023 than previously assumed, on the back of weak productivity developments so far this year. Overall, the projection for potential output is little changed compared with the March Report (Table 3.B).
Total past four quarters. In thousands
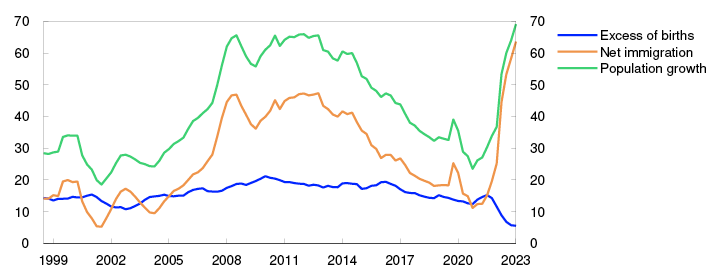
Table 3.B Output and potential output3
|
Change from projections in Monetary Policy Report 1/23 in brackets |
Percentage change from previous year |
||||||
|
1995–2009 |
2010–2021 |
2022 |
2023 |
2024 |
2025 |
2026 |
|
|
GDP, mainland Norway |
3.1 |
1.8 |
3.7 (0.0) |
1.2 (0.1) |
0.2 (-0.2) |
0.9 (-0.1) |
1.4 (0.0) |
|
Potential output |
3.1 |
1.8 |
1.6 (0.0) |
2.3 (0.1) |
1.3 (0.0) |
1.2 (0.0) |
1.2 (0.0) |
|
Potential employment |
0.8 |
1.0 |
1.8 (0.0) |
1.4 (0.3) |
0.5 (0.0) |
0.6 (0.0) |
0.6 (0.0) |
|
Trend productivity |
2.3 |
0.8 |
-0.3 (0.0) |
0.9 (-0.2) |
0.8 (0.0) |
0.6 (0.0) |
0.6 (0.0) |
1 Period: 2005 Q2 – 2023 Q3. Regional Network is the average of the capacity utilisation indicators in the Regional Network after they have been converted to output gaps using a simple model estimation.
The modelling system for the output gap includes information about GDP, employment, unemployment, wage growth, inflation, house prices and credit. For a more detailed description of the models, see Furlanetto et al. (2023). “Norges Bank Output Gap Estimates: Forecasting Properties, Reliability, Cyclical Sensitivity and Hysteresis.” Oxford Bulletin of Economics and Statistics, 85.1, 238–267.
2 Period: 1998 Q3 – 2023 Q1.
3 The contributions from potential employment and trend productivity do not necessarily sum exactly to the annual change in potential output due to rounding.
3.3 Prices and wages
Inflation is high
Price inflation has moderated slightly since autumn but is still high. In May, the consumer price index (CPI) was 6.7% higher than in the same month one year earlier, appreciably higher than projected in the March Report.
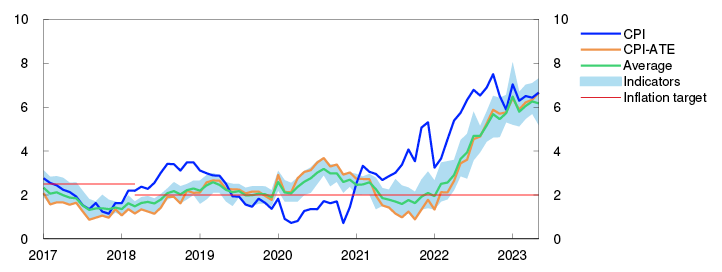
The 12-month rise in the CPI adjusted for tax changes and excluding energy products (CPI-ATE) has also remained elevated in recent months. In May, 12-month CPI-ATE inflation was 6.7%, 0.7 percentage point higher than projected in the March Report. Other underlying inflation indicators have also risen overall (Chart 3.15).
CPI and underlying inflation indicators. Twelve-month change. Percent
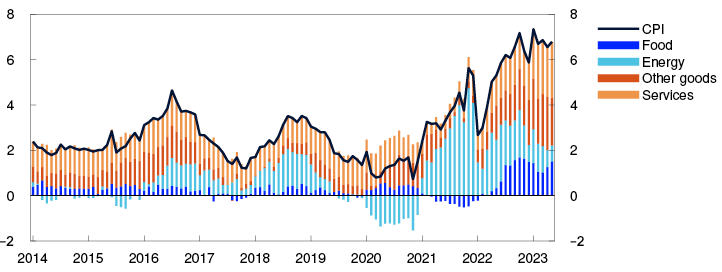
The rapid rise in prices reflects high commodity prices and supply shocks in recent years. In 2021, high energy prices in particular pushed up inflation, and through 2022, food prices increased considerably (Chart 3.16). Over the past year, inflation has broadened and is now being pushed up by a rapid rise in prices for a wider range of goods and services. This reflects the time it takes for international price pressures to feed through to consumer prices but should also be viewed in the light of high capacity utilisation and rising labour costs (see box in Monetary Policy Report 1/2023). Some of the rise in prices in recent months may also be attributable to the depreciation of the krone exchange rate.
CPI. Twelve-month change. Percent. CPI subcomponents. Percentage points.
Krone depreciation counteracting the effects of receding external inflationary impulses
In autumn 2022, electricity prices surged. They have fallen back this spring, and futures prices have fallen slightly further. Nevertheless, electricity prices in the CPI have not fallen as much as projected in the March Report. There are many stages between market electricity prices and electricity prices as measured in the CPI. Consumer prices depend, for example, on the type of contract entered into by consumers, the scale of electricity bill support, different taxes and electricity distribution charges. This means that developments in electricity prices in the CPI do not always reflect changes in market prices and are at times difficult to project, with the wide monthly variations amplifying uncertainty.
External price pressures are expected to be subdued ahead (Chart 3.17). Global freight rates have returned to normal levels after having risen sharply in the wake of the pandemic, and energy and non-energy commodity prices have fallen. In isolation, weaker external price pressures will curb the rise in prices for imported goods and services ahead.
IPK with freight rates in NOK and foreign currency terms. Annual change. Percent
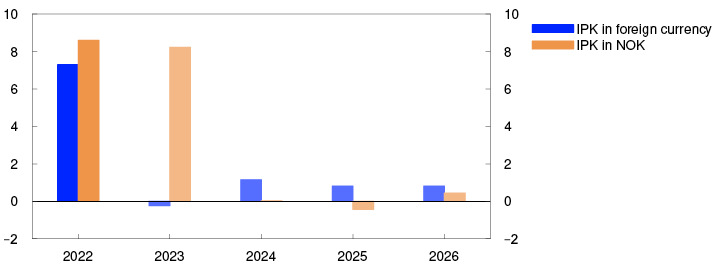
At the same time, the krone has been weaker than projected. A weaker krone increases the cost of imported goods. In NOK terms, external inflationary pressures are projected to increase substantially in 2023. On the whole, imported inflation is projected to decline from 2023 Q3, but compared with the March projection, inflation is projected to be higher throughout the projection period owing to a weaker krone.
Domestic price pressures will push up inflation
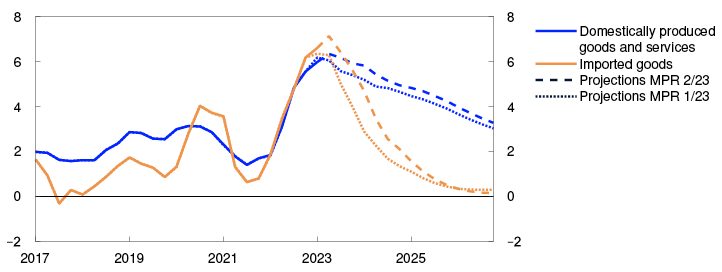
Owing to higher growth in labour costs, domestically produced goods and services inflation is expected to rise in the years ahead. At the same time, the rise in prices for domestically produced goods and services is also projected to begin to moderate on the back of lower capacity utilisation from 2024 (Chart 3.18). So far, there is little to suggest that higher profit margins have contributed significantly to the rise in prices (see further discussion in "Limited impact from higher profit margins to inflation"). The projections are slightly higher than in the March Report, reflecting higher domestic inflation than projected in the March Report and prospects for slightly higher wage growth ahead.
Domestically produced goods and services and imported goods in the CPI-ATE. Four-quarter change. Percent
Since the March Report, the inflation projections from the SMART modelling system have been revised up due to new information (Chart 3.19). In the SMART forecast, 12-month CPI-ATE inflation moves down from 2023 Q3 (see "SMART – System for Model Analysis in Real Time"). The projections in this Report are slightly higher than the model forecasts, reflecting somewhat higher expected rents ahead.
CPI-ATE. Four-quarter change
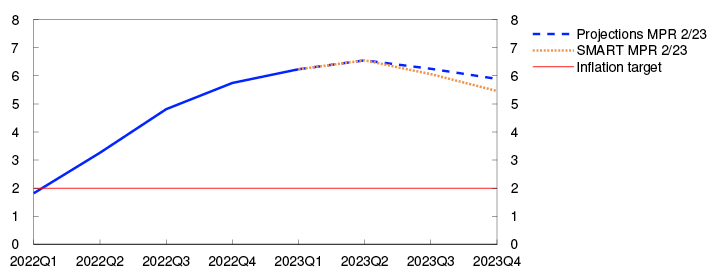
Four-quarter CPI-ATE inflation is projected to reach 6.6% in 2023 Q2, edging down thereafter. The projections for CPI-ATE inflation are higher than in the March Report. CPI inflation is projected to moderate ahead. Energy prices in the CPI have fallen less than expected earlier and will likely contribute to slower decline in CPI inflation in 2023 than projected in the March Report. Inflation, as measured by both the CPI and the CPI-ATE, is projected to be close to 2% at the end of 2026, which is a slightly slower decline than among many of Norway’s trading partners (see further discussion in "High inflation abroad and in Norway").
Wage growth is rising
A tight labour market and solid earnings in some business sectors pushed up wage growth to 4.3% in 2022. In this year’s wage negotiations, the wage norm was set at 5.2% for manufacturing, and most of the large bargaining areas have agreed on a corresponding norm.
Manufacturing sector profitability is an important precondition for the wage norm. Considerable improvements in Norway’s terms of trade in 2022 and higher export prices are pushing up the ability of some manufacturing segments to pay higher wages. A weaker krone also increases the ability to pay higher wages.
At the same time, the outlook for mainland business profitability is somewhat more mixed. In 2023 Q2, Regional Network contacts reported prospects for weaker profitability than at the same time in 2022 (Chart 3.20). In the Expectations Survey, business leaders expect profitability to decline somewhat in the coming year, but they expect a slower decline ahead than at the beginning of 2023. On the whole, the profitability of Norwegian firms is assessed to be close to normal levels, with prospects for a slight decline through 2023.
Change in operating margins according to the Regional Network and the Expectations Survey
Wage growth expectations have increased since the March Report (Chart 3.21). Regional Network contacts expect wages in their own enterprises to increase by 5.4% in 2023. According to Norges Bank’s Expectations Survey, the social partners now expect overall wage growth of 5.3% in 2023.
Annual wage growth. Percent
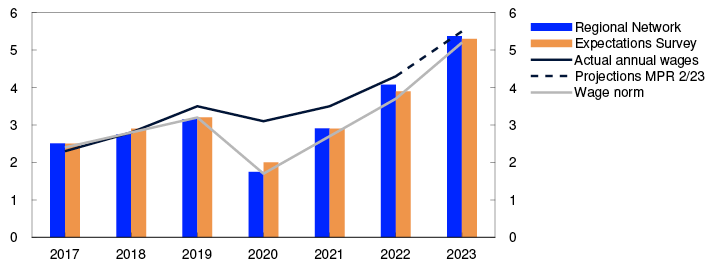
Wage growth is projected to rise to 5.5% in 2023, which is somewhat higher than in the March Report. Wage growth is expected to decline gradually from 2024 owing to lower inflation and an easing of labour market pressures further out. Norges Bank’s Expectations Survey shows that the social partners also expect wage growth to slow in 2024. The Bank’s wage growth projections are slightly higher than in the March Report throughout the projection period.
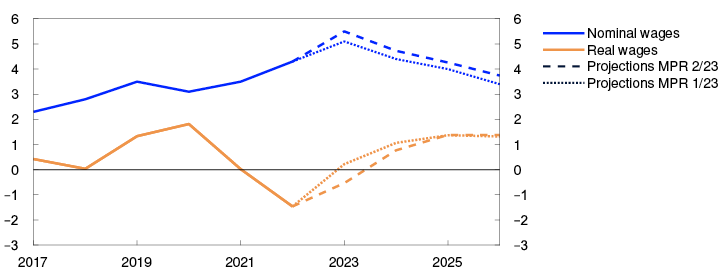
According to the Expectations Survey, the social partners expect real wages to edge up in 2023. Real wages are projected to decline by 0.5% (Chart 3.22), reflecting prospects for a further increase in inflation during the year. In the period between 2024 and 2026, real wages increase by an annual average of just above 1%, in line with projected productivity growth and expected developments in Norway’s terms of trade.
Annual change. Percent
Uncertainty is greater when inflation is high
There is considerable uncertainty about price and wage inflation ahead. There is particular uncertainty related to profitability in sectors that are highly sensitive to the wide swings in petroleum prices. The future pass-through of petroleum price fluctuations to wage growth among mainland firms is also uncertain.
Inflationary pressures have recently been unusually strong. The lack of historical comparisons makes it difficult to estimate their effect on consumer prices, even as some of these pressures are now easing. Energy prices, for example, have declined substantially from the peaks this winter. It is uncertain how quickly the decline will pass through to business costs and profitability, and in turn, to both selling prices and wage growth.
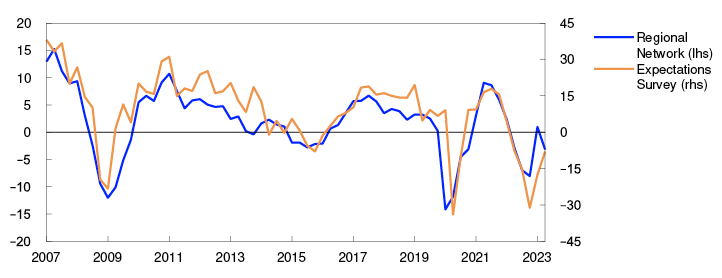
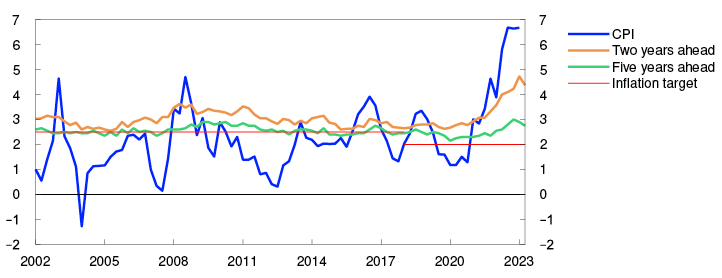
In addition, inflation expectations have recently been above the inflation target. If inflation expectations remain high, it could take longer for inflationary pressures to ease than currently envisaged. However, according to Norges Bank’s Expectations Survey for 2023 Q2, inflation expectations have fallen slightly (Chart 3.23).
Inflation expectations further out. Percent
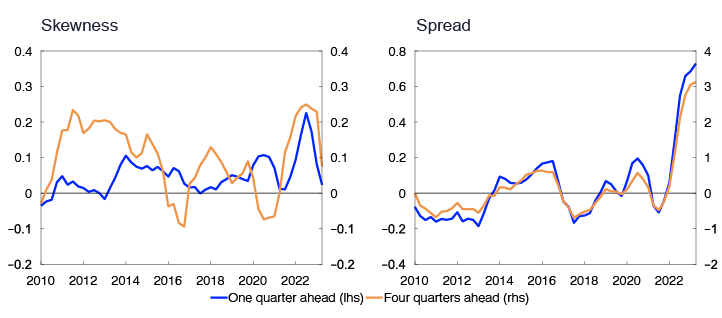
Many underlying factors are contributing to the Bank’s judgement that the uncertainty surrounding the future path of inflation is particularly high at this time. In a new analysis, several of these factors are combined in order to estimate how the uncertainty surrounding inflation projections has developed over time.10 According to this analysis, the uncertainty surrounding inflation developments ahead has risen sharply since autumn 2021. The analysis also shows that the uncertainty has been skewed to the upside, which means that the risk of inflation becoming substantially higher than expected is higher than the risk of it becoming substantially lower than expected. In 2023 Q2, uncertainty rose further from an already record-high level (right panel in Chart 3.24). At the same time, the risk outlook appears to have become more balanced in recent quarters (left panel in Chart 3.24), which means that the magnitude of the upside risk now appears more equal to the downside risk. Since the beginning of the year, declining external inflationary impulses have helped reduce the ratio of the upside risk compared to the downside risk.
Uncertainty indicator for inflation projections. One and four quarters ahead. Percentage points
1 Period: January 2017 – May 2023. CPI-ATE: CPI adjusted for tax changes and excluding energy products. Average: Average value of 12-month change for other underlying inflation indicators (CPIM, CPIXE, 20 percent trimmed mean, weighted median, CPIXV and CPI-sticky prices and CPIF) and CPI-ATE. Indicators: Highest and lowest 12-month change for other underlying inflation indicators.
2 Period: January 2014 – May 2023. In the statistics, some differences occur between the sum of the components and overall inflation.
3 Period: 2022 – 2026. Prices for imported consumer goods. Projections from 2023.
4 Period: 2017 Q1 – 2026 Q4. CPI-ATE: CPI adjusted for tax changes and excluding energy products. Projections from 2023 Q1 for MPR 1/23 and 2023 Q2 for MPR 2/23.
5 Period: 2022 Q1 – 2023 Q4. CPI-ATE: CPI adjusted for tax changes and excluding energy products. Projections from 2023 Q2. The SMART modelling system for short-term projections is based on historical relationships. It averages empirical models based on previous forecasting properties.
6 Period: 2007 Q1 – 2023 Q2. Regional Network: Change in operating margins past three months compared with same period a year earlier. Percent. Expectations Survey: Profitability next 12 months. Share of enterprises that report prospects for improved profitability minus the share that report prospects for lower profitability.
7 Period: 2017 – 2023. Annual wages: Actual annual wages from Statistics Norway. Norges Bank’s projections for 2023. Norges Bank’s Expectations Survey: Social partners’ wage growth expectations for the current year as measured by Norges Bank’s Expectations Survey in Q2 each year. Regional Network: Expected annual wage growth for own business in current year as reported in Q2 each year.
8 Period: 2017 – 2026. Projections from 2023 for MPR 2/23 and MPR 1/23. Real wages: Nominal annual wage growth adjusted for CPI inflation.
9 Period: 2002 Q1 – 2023 Q2. Inflation expectations two years ahead are the average of expectations among households, business leaders, economists and social partners. Inflation expectations five years ahead are the average of expectations among economists and social partners.
10 The analysis is discussed in detail in Bowe, F., S.J. Kirkeby, I.H. Lindalen, K.A. Matsen, S.S. Meyer and Ø. Robstad (2023) “Quantifying macroeconomic uncertainty in Norway”. Norges Bank. Staff Memo 13/2023. Forthcoming.
11 Period: 1. kv. 2010 – 2. kv. 2023. “Spread” indicates the difference between 95th and 5th percentile in the predicted distribution around the projections measured in percentage points. A value above zero indicates how many percentage points higher the spread is than the average in the period 2000–2019. “Skewness” indicates how many percentage points higher the average of the distribution is compared with the median.
High inflation abroad and in Norway
Owing to the krone depreciation combined with the high activity level in the Norwegian economy, underlying inflation is expected to moderate more slowly than among Norway’s main trading partners.
Inflation has recently been high, both in Norway and among Norway’s main trading partners. Overall inflation has moderated appreciably in a number of countries, but underlying inflation has remained elevated. In Norway, the CPI adjusted for tax changes and excluding energy products (CPI-ATE) was 6.7% higher in May than in the same month one year earlier, the highest 12-month rise recorded since calculations began in 2001. This is higher than the most recent data for underlying inflation in the US, euro area and UK, but lower than for Sweden (Chart 1.2).
Underlying inflation in Norway and Sweden includes food prices, which have generally shown a sharp rise in the recent period. However, excluding both food and energy prices, goods price inflation in the two countries is still relatively high (right panel in Chart 3.D), which may reflect weaker exchange rates. Compared with average levels for 2021, the Norwegian krone and Swedish krona have depreciated to approximately the same extent, although the Swedish krona depreciation started somewhat earlier (left panel in Chart 3.D). This may partly explain the faster rise in goods price inflation in Sweden. At the same time, this raises the prospect that goods price inflation could remain high in Norway somewhat further ahead.
By comparison, goods price inflation in the US, where inflation surged already in spring 2021, has shown a marked decline. This partly reflects domestic factors, for example, pronounced changes in used car prices. However, a stronger US dollar may also have had a dampening effect. The US dollar exchange rate has weakened somewhat since autumn 2022 but is still considerably stronger than in 2021.
The rise in services prices has also picked up and moved more in parallel across economies than goods prices (left panel in Chart 3.E). The UK is the only country where services prices are rising faster than in Norway. The UK has also seen the highest wage growth recently. Wage growth in Norway appears to be somewhat higher in 2023 than in 2022 (right panel in Chart 3.E).
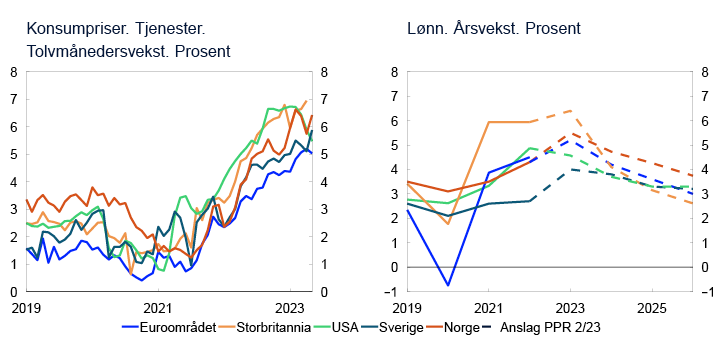
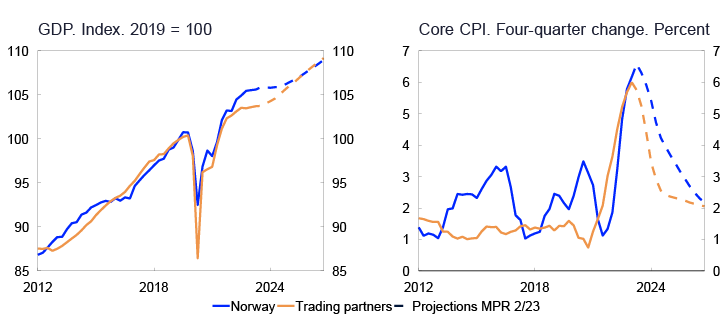
Wage growth is expected to decline both in Norway and among trading partners in the coming years, but there are prospects that wage growth will be highest in Norway, owing to stronger economic growth than among trading partners (left panel in Chart 3.F). Capacity utilisation in the Norwegian economy has likely been higher than among trading partners overall. In addition, the weaker krone provides room for somewhat higher wage increases.
On balance, underlying inflation in Norway is expected to decline at a somewhat slower pace than among trading partners owing to the krone depreciation, the relatively high activity level in the Norwegian economy and prospects for somewhat higher wage growth (right panel in Chart 3.F). Inflation in Norway has also been somewhat higher than among trading partners in earlier periods when the krone was weak. This was the case following the decline in oil prices and the krone depreciation in 2014, and again after the temporary krone depreciation in the first phase of the pandemic in 2020.
1 Period: 1 January 2019 – 16 June 2023 for effective exchange rates. January 2019 – May 2023 for consumer prices.
2 Period: 2019 – 2026. Projections from 2023. Consumer price for services excludes owner-occupiers’ estimated housing costs.
3 Period: 2012 Q1 – 2026 Q4. Projections from 2023 Q2 for MPR 2/23.
Limited impact from higher profit margins to inflation
The increase in inflation in 2022 has been accompanied by a decline in the contribution from profit margins. This applies both to private firms as a whole and for consumer-oriented sectors such as retail trade and private services.
Several factors have led to high inflation both in Norway and internationally. Strong demand for goods during the pandemic led to global supply chain bottlenecks. Prices for many imported goods rose sharply, a development that was amplified by the war in Ukraine. At the same time, demand for goods and services has remained robust, which has led to low unemployment and increased wage pressures in many countries. Recently, several international commentators1 have suggested that some of the rise in prices also reflects an attempt by some firms to use the general rise in prices as an excuse to raise the prices of their products well in excess of what is warranted by the increase in costs.
In theory, it is easier for firms to increase prices in a situation where inflation is broad-based and they can expect their competitors to follow suit. Strong demand and shortages of goods and services have the same effect. The extent to which higher profit margins have fuelled inflation is still an open question. The few formal analyses2 performed so far are largely based on national accounts data that show contributions from labour costs and profit margins to total domestic inflation, measured using the gross output deflator3. A marked increase in inflation that is also accompanied by a corresponding rise in profit margins may be an indication that some firms are using the situation of a high and general rise in prices to boost margins.
The left panel in Chart 3.G shows developments in the gross output deflator for the aggregate of all private mainland firms excluding electricity supply. We see that the gross output deflator picked up moderately through 2022 and far less than the rise in consumer prices. The increase primarily reflected an increase in unit labour costs. However, the rise in unit labour cost inflation is not due to an increase in hourly labour costs, but rather to a decline in labour productivity growth to zero in 2022 (right panel in Chart 3.G). The chart also shows that the contribution from profit margins was lower in 2022 than in the two preceding years and was well below a historical average, in both absolute terms and relative to labour costs. A preliminary conclusion must therefore be that Norwegian firms on average do not appear to have been tempted to increase prices beyond that implied by cost inflation. However, it is possible that at a more disaggregated level, there may be examples of sectors and firms where profit margins have risen a good deal over the past few years. For example, it may be the case that consumer-oriented industries in private services and retail trade may have taken the opportunity to increase profit margins to a greater degree.
Percentage points contribution to the GDP deflator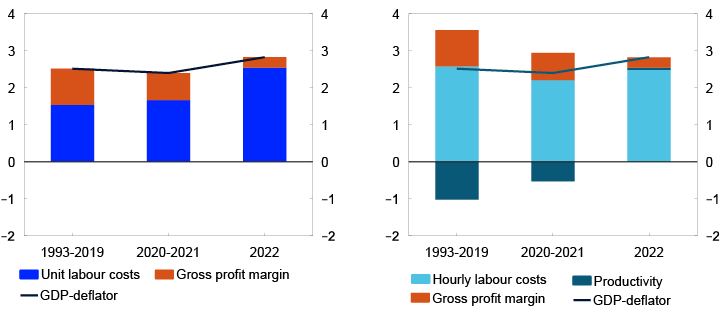
In retail trade, a marked increase in profit margins contributed to lifting inflation through the pandemic, while the contribution in the services sector was negative (Chart 3.H). At the same time, we know that it was a period of moderate consumer price inflation. However, for 2022, we see few signs that higher profit margins were an important driver of the increase in inflation. In private services, a fall in profit margins in isolation pulled down the gross output deflator. In retail trade, the contribution from profit margins was marginally positive and well below a historical average. The increase in the gross output deflator in retail trade through 2022 can primarily be explained by an increase in unit labour costs. National accounts data suggest that unit costs rose on account of a marked fall of hourly productivity and were not so much a result of higher wage growth.
Percentage points contribution to the GDP deflator
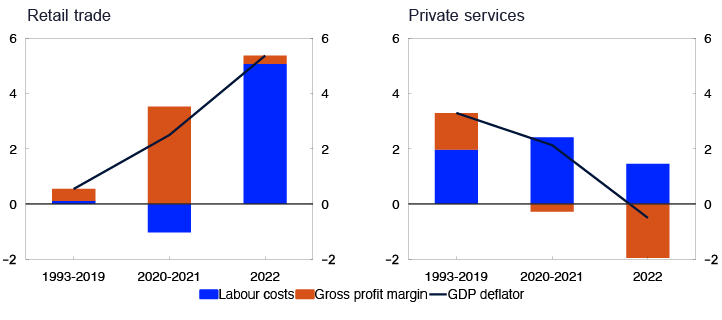
Here we have focused on how the GDP deflator in the aggregate and in different sectors has been affected by changes in profit margins and labour costs. Consumer price inflation also depends on changes in input prices. As has been shown, the change in the GDP deflator has been relatively moderate compared with consumer price inflation. This suggests that a not insignificant part of the increase in inflation must be explained by an increase in input prices.
1 See eg Panetta (2023).
2 See eg Panetta (2023) and Haskel (2023).
3 In brief, the gross output deflator is the price of output (turnover less factor inputs) in a given sector. When it covers the output of the entire country, it is called the gross domestic product (GDP) deflator. Since output is matched by labour costs and operating profit, the gross output deflator can be expressed as the sum of labour costs per unit of output (gross product) and the profit margin, defined here as the operating profit per unit of output (gross product).
4 Period: 1993 – 2022.
5 Period: 1993 – 2022. Private services excluding services related to crude oil and natural gas.
4. Monetary policy analysis
The policy rate path is higher than in the March 2023 Monetary Policy Report. According to Norges Bank’s model analyses, the path is pushed up primarily by higher inflation than projected in March and higher imported inflation owing to the weaker-than-projected krone. Higher economic activity and interest rates abroad, as well as higher domestic wage growth, also pull up the path. Lower petroleum investment and a larger fall in housing investment and consumption contribute in isolation to a lower policy rate path.
4.1 The policy rate forecast and monetary policy objectives
The operational target of monetary policy is annual consumer price inflation of close to 2% over time. Inflation targeting shall be forward-looking and flexible so that it can contribute to high and stable output and employment and to countering the build-up of financial imbalances. The Committee’s monetary policy strategy is discussed further in "Norges Bank’s monetary policy strategy".
The policy rate forecast has been revised up from the March Report. The policy rate was raised by 0.5 percentage point to 3.75% at the meeting of the Monetary Policy and Financial Stability Committee on 21 June, and the forecast indicates that it will rise to 4.25% in the course of autumn. The policy rate is projected to be slightly below 3% around the end of the projection period.
If the economic outlook, the balance of risks or the assessment of the functioning of the economy changes, the policy rate may prove to be different from the one now indicated by the policy rate path. It is more difficult than normal to project inflation and capacity utilisation ahead, and the Bank’s forecasts have been revised substantially over the past year.
4.2 New information and new assessments
Model-based interpretation of new information
To shed light on how new information affects the economic outlook, new information and assessments of the economic situation are incorporated into the modelling system, while conditioning on the policy rate path from the March Report. This exercise shows the forecasts that the modelling system would have produced if the policy rate path were unchanged. Here the main focus is on the outlook for developments in the output gap and inflation, two important considerations to which the Committee gives weight in the conduct of monetary policy.
In the exercise with an unchanged rate path, the inflation projections are much higher than the March projections throughout the forecast period (Chart 4.1). CPI-ATE inflation is pulled up by a weaker krone and higher wage growth. The output gap is at broadly the same level as in the March Report. The output gap is pulled up in particular by higher exports owing to a weaker krone and somewhat higher public demand, while lower investment pulls it down.
Projections conditioned on new information concerning economic developments and the policy rate forecast in MPR 1/23
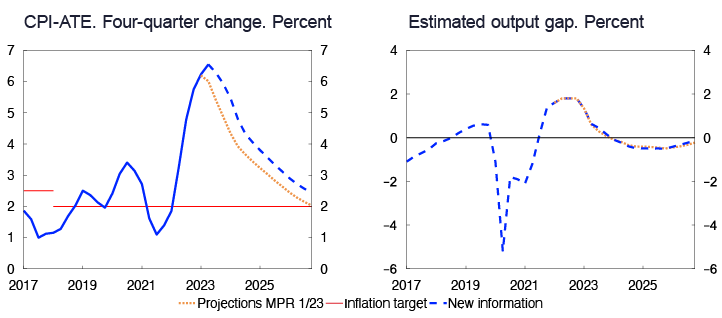
Market policy rate expectations have risen considerably
Market policy rate expectations further out can be estimated on the basis of market rates. These policy rate expectations can provide an indication of how market participants have interpreted new information and how they believe Norges Bank will react.
Market expectations have risen considerably since the monetary policy meeting in March and now indicate a peak of around 4% (Chart 4.2). Policy rate expectations are now higher than the policy rate path in the March Report throughout the projection period. Since the March Report, market policy rate expectations have been revised up more than the Bank’s policy rate path, which likely reflects the banking sector turmoil in the period leading up to the March monetary policy meeting, which led to a transient fall in policy rate expectations.
Policy rate. Percent
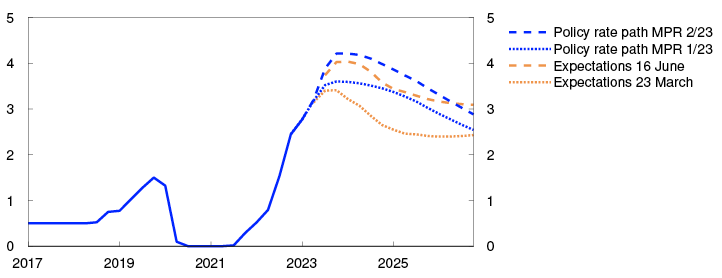
A simple rule indicates a higher policy rate
A simple monetary policy rule shows the policy rate reaction to changes in the output gap and inflation (see Monetary Policy Report 2/2022). The rule is based on data for the period 2009–2021.
The near-term inflation projection has been revised up. This implies that the simple rule now indicates a higher money market rate in the coming quarters than implied by the rule in the March Report (Chart 4.3). The upward revision is a little larger than the upward revision of the policy rate path in this Report.
Money market rate. Percent
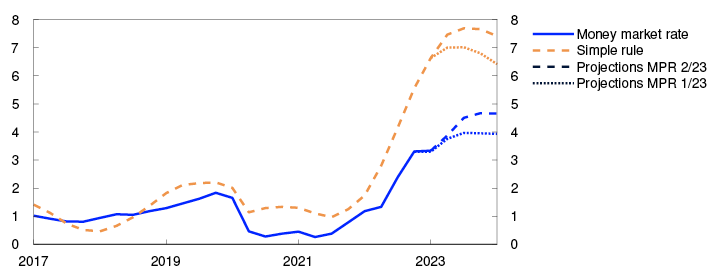
In "An illustration of monetary policy trade-offs" we illustrate the trade-off between inflation and the output gap behind the policy rate forecast. The inflation gap projections are at a historically high level. At the same time there are prospects for a weaker real economy.
1 Period: 2017 Q1 – 2026 Q4. Projections from 2023 Q1 for MPR 1/23 and 2023 Q2 for MPR 2/23. CPI-ATE: CPI adjusted for tax changes and excluding energy products. The output gap measures the difference in percentage terms between GDP for mainland Norway and projected potential GDP for mainland Norway.
2 Period: 2017 Q1 – 2026 Q4. Expectations from 23 March for MPR 1/23. Expectations from 16 June for MPR 2/23.
3 Period: 2017 Q1 – 2024 Q1. Projections from 2023 Q1 for MPR 1/23 and 2023 Q2 for MPR 2/23.
4.3 Monetary policy stance and drivers behind the changes in the policy rate path
Monetary policy influences the economy through both nominal and real interest rates. The average residential mortgage rate has risen broadly in pace with the policy rate, which reduces household disposable income. Some households will likely have to reduce consumption. This applies especially to those unable to draw on savings or increase borrowing.
Compared with the March Report, the policy rate forecast has been revised up approximately to the same extent as the inflation projections in the near-term, but to a somewhat greater extent further out in the projection period. This means that the projection for the expected real interest rate is unchanged in the near term but revised up further out in the projection period (Chart 4.4). The real interest rate is projected to lie above its neutral level from the end of 2023. This means that monetary policy, as measured by the real interest rate, will have a contractionary effect on the economy through the remainder of the projection period. See "Estimates of the neutral real interest rate" for a further discussion of the range for the neutral real interest rate.
Estimate of the expected real money market rate. Percent
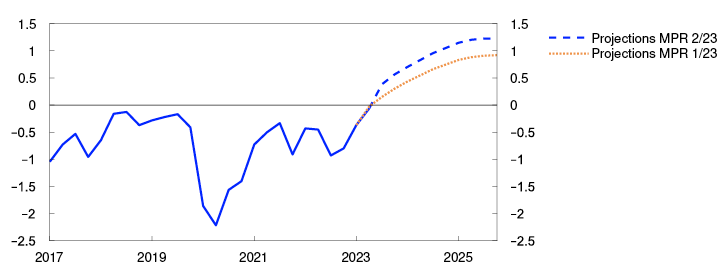
Decomposition of changes in the policy rate path
The Committee’s reasoning for the policy rate decision and forward guidance on the policy rate are presented in "Monetary policy assessment". The decomposition in Chart 4.5 illustrates some of the main drivers behind the change in the policy rate path from our main model NEMO since the March Report. The bars show contributions to changes in the model-based path, and the broken line shows the sum of the bars. The solid line shows the actual change in the rate path.
Cumulative contributions. Percentage points
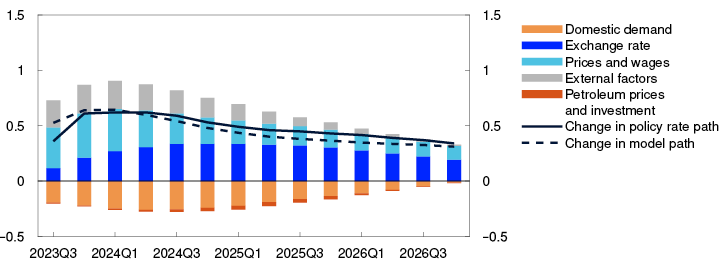
Policy rates abroad are expected to be higher than previously assumed, which contributes in isolation to a krone depreciation. Economic growth among trading partners has been higher than previously projected, but is expected to be somewhat weaker going forward. External factors therefore suggest a higher model-based path through the projection period (grey bars).
Since the March Report, both oil and gas futures prices are little changed overall, while the projections for petroleum investment in the coming years have been revised down. Overall, factors relating to petroleum prices and investment pull down the model-based path slightly (red bars).
The krone has been weaker than implied by changes in the interest rate differential against other countries and in oil and gas prices since the March Report. In the model, this is interpreted as a continued positive krone risk premium. At the same time, the krone is now expected to remain weaker throughout the projection period. This is implemented by assuming a weaker equilibrium rate (Section 2.4). A weaker krone increases imported goods inflation and helps sustain economic activity by boosting exports and by shifting demand towards domestically produced goods and services. This contributes to holding up wage growth and domestic inflation. Overall, factors relating to the exchange rate pull up the model-based path (dark blue bars).
Inflation has been higher than projected in March and even higher than implied by the krone depreciation. The wage growth projection for 2023 has also been revised up. Overall, factors relating to prices and wages suggest a higher model-based path throughout the projection period (light blue bars).
Capacity utilisation is projected to be broadly at the same level as envisaged in March. Lower-than-expected housing starts and new home sales lead to a steeper fall in housing investment than in the March Report. A steeper-than-expected fall in real household income pulls down consumption. This effect is not sufficiently strong in our main model NEMO. Factors related to domestic demand therefore pull down more than they would have if this mechanism were better captured by the model, and factors related to prices and wages pull up more than they otherwise would. Housing investment and consumption pull down on the rate path. On the other hand, higher public demand than projected earlier contributes in isolation to a higher rate path. Overall, domestic demand contributes to a lower model-based path through much of the projection period (orange bars).
The model analysis implies a higher policy rate than projected in the March Report throughout the projection period.
4 Period: 2017 Q1 – 2025 Q4. The expected real interest rate is the projected money market rate over the next four quarters less expected CPI-ATE inflation over the same period. For Q2 and in the projection period, the expected real interest rate is estimated based on the projections in this Report.
For all previous periods, the expected real interest is based on the most up-to-date Monetary Policy Report at the time in question.
5 Period: 2023 Q3 – 2026 Q4. Projections. The contributions are based on model estimates from the NEMO model, but there is no mechanistic link between news and changes in the bars. The effects of news feed through with a lag and the interaction between economic variables may result in a reversal of the effects over time. In addition, projections for the near term may entail news with different signs at different times. The effect on the rate path is therefore shown most clearly by the cumulative contributions.
An illustration of monetary policy trade-offs
Monetary policy is mandated to stabilise inflation around the 2% target, while being flexible and forward looking, so that it can promote high and stable output and employment and counter the build-up of financial imbalances. The consideration of countering the build-up of financial imbalances derives from the consideration of stable output and employment, because the build-up of financial imbalances increases the risk of a sharp downturn further out.
In the long run, there is no conflict between the price stability objective and high and stable output and employment. In the short and medium run, however, the central bank will have to strike a balance between these considerations in response to shocks. In the literature, the trade-off between low and stable inflation and high and stable output and employment is usually represented by a loss function with an inflation gap πt (the difference between inflation and the inflation target) and an output gap yt (the difference between output and potential output). If we let the parameter λ measure the weight given by Norges Bank to the output gap relative to the inflation gap, the loss function could be represented as follows:

The farther the two gaps are from zero, the greater the total loss. As losses are squared, particularly large deviations result in relatively larger gaps than small deviations. In practice it takes time before policy rate changes affect inflation and production and employment, with a substantial effect not appearing until after about one year. Along with the mandate that specifies that monetary policy must be forward-looking, this suggests that the policy rate must be set on the basis of inflation and output forecasts, eg at the one-to-three-year horizon.
Chart 4.A shows the CPI-ATE inflation gap and output gap projections in Monetary Policy Report 2/23. The shaded areas show the chosen horizon. The horizon has been chosen to enable comparisons of gap size over time, but in practice, the entire period will be relevant. In this Report, the inflation gap is above zero over the entire period. The output and inflation gaps will be affected by the shocks impacting the economy and the Committee’s trade-offs between monetary policy considerations. A positive inflation gap will indicate that a higher policy rate is necessary to bring the inflation gap to zero. At the same time, the output gap in the chosen horizon is negative, which in isolation suggests a lower policy rate.
Projections for output gap and deviations from inflation target
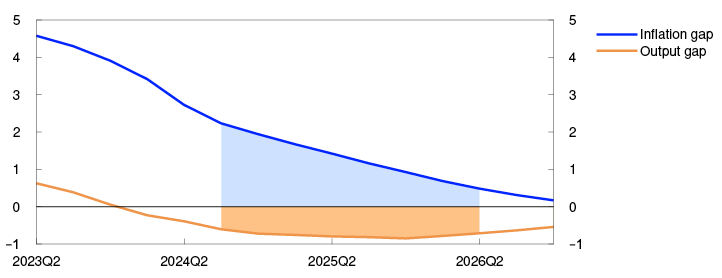
Chart 4.B shows the average output gap (orange line) and inflation gap (blue line) projections five to 12 quarters ahead for reports going back to 2005. Since policy rate setting influences the two gaps in the same direction, a better result might normally have been obtained if the two gaps have the same sign. Historically, however, the projections for the two gaps have periodically had the same sign. This indicates that periodically, the policy rate has been set based on considerations other than those that might be warranted by the inflation and output gap projections in isolation. These include countering the build-up of financial imbalances or uncertainty surrounding the effect of the policy rate. Another reason is that Norges Bank considers the costs associated with a negative output gap to be greater than the costs associated with a correspondingly positive output gap, so that the Bank does not necessarily seek to close a positive output gap. The weight given to the output gap relative to the inflation gap may also have changed over time, so that the relative sizes of the gaps are not necessarily going to be constant. See box on page 44 of Norges Bank’s Monetary Policy Handbook for how the gaps can be averaged to produce an overall indicator of the trade-offs.
Average inflation and output gap. Percentage points
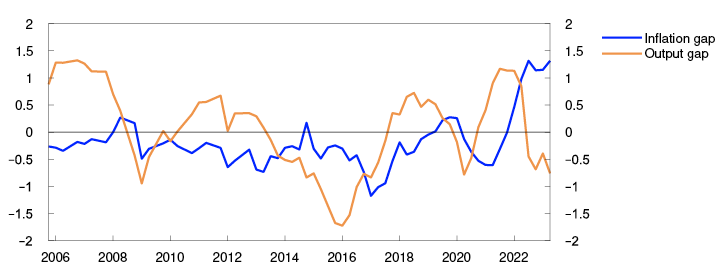
The end point of the lines at the far right of the chart represent the average gaps illustrated in Chart 4.A. The inflation gap projections at the chosen horizon are now at a historically high level. At the same time, there are prospects for a weaker real economy, and the projections indicate a negative output gap.
1 Period: 2023 Q2 – 2026 Q4. Output gap measures the percentage deviation between estimated mainland GDP and projected potential mainland GDP. Inflation gap measures the deviation between inflation as measured by the CPI-ATE and the inflation target.
2 Period: 2005 Q4 – 2023 Q2. The lines represent average value of the output gap and inflation gap 5–12 quarters ahead.
Estimates of the neutral real interest rate
Over the past two years, interest rates have risen sharply in Norway and other countries from historically low levels. At the same time, the increase in inflation has kept the real interest rate, defined as the interest rate less expected inflation, low. As an aid in gauging the monetary policy stance, we estimate the neutral real rate of interest (r*), defined as the real interest rate that is consistent with output at potential and inflation at the target in the medium term. An actual real interest rate that is higher (lower) than the neutral real interest rate may indicate a contractionary (expansionary) monetary policy.
The neutral real interest rate is not observable and must therefore be estimated. Our analyses assume that the neutral real interest rate is primarily determined by factors other than monetary policy. Owing to cross-border capital mobility, it is reasonable to assume that r* in Norway lay in the upper part of the range between -0.5% and 0.5%.
Estimations of the neutral real interest rate are regularly performed by academics and central banks in many countries. Owing to the sizeable shocks affecting the global economy in recent years and methodological uncertainty, estimations of r* are highly uncertain. Estimations of the neutral real interest rate have fallen over time both in Norway and in many other countries. In the April 2023 World Economic Outlook, the International Monetary Fund (IMF) concludes that r* will also likely remain low ahead, at around zero.1 This is because the primary drivers of r*, lower productivity growth and an ageing population, pull in the direction of high saving relative to investment. Factors that may pull in the direction of a higher r* are high fiscal deficits, higher government debt levels and persistently higher risk premiums. The transition to a low-emissions economy may also have ramifications for r*. The sign of an eventual change depends on whether total investment in the economy rises or falls relative to saving. A higher r* is possible in response to a sharp increase in investment related to climate transition. On the other hand, the neutral real interest rate may fall if higher carbon taxes or other tightening measures lead to a sharp fall in investment, owing to a lower return on capital. A more fragmented international financial market and less global trade may lead to a wider cross-country divergence in r*, because the real interest rate will reflect saving and investment in individual countries to a greater degree.
To assess the neutral real interest rate, we look at both market- and model-based measures. Implied five-year yields five years forward are often used as a measure of market expectations of short-term interest rates in the medium term, when the effect of economic shocks has faded. Implied five-year yields in Norway have largely tracked yields among trading partners over time. Adjusted for market-based measures of inflation expectations, these yields can serve as the basis for a market-based measure of r*. Since there is no market-based measure of expected inflation in Norway, we first look at US and euro area real interest rates (Chart 4.C).
Percent
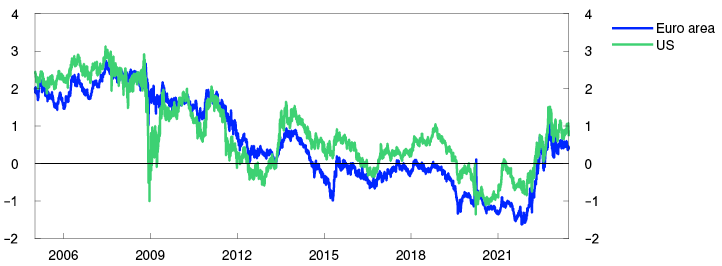
Through 2022, the market-based measure of expected real interest rates rose markedly in both the US and the euro area. In 2023, expected real interest rates have been at around 0.5% in the euro area and 0.9% in the US. In Norway, the nominal five-year yield five years forward has been at around 3%–3.5% so far this year. If we assume that market inflation expectations are close to the inflation target, this suggests an expected real interest rate of around 1%–1.5% in Norway.
As an alternative to market-based measures, r* can be estimated with the aid of economic models, where the aim is to estimate r* as the real interest rate consistent with balanced developments in the economy in the absence of shocks. We use a number of different models to estimate r*.3 Some of the models are time series models, while others impose correlations between variables based on economic theory to a greater extent. The models are estimated on data up to and including 2022. All models in the model portfolio indicate that the neutral real interest rate has fallen in recent decades. The average of the model estimates fell from 3.5% in 1995 to -1% in 2022. Lower estimates of long-run growth in the Norwegian economy are a contributing factor.
The model estimates of the neutral real interest rate are highly uncertain and are dependent on model specifications. Market-based measures can be influenced by term premiums and inflation risk that can be difficult to estimate, and market participants can be wrong about r*. Over the past year, changes in central bank asset purchase programmes may have led to a rise in the term premium in long-term interest rates, which means that expected real interest rates may be lower than indicated by market-based measures. We therefore make a judgement-based assessment of the different measures. Chart 4.D presents the average of the estimates from our model portfolio together with the market-based measure, with inflation expectations assumed to be in line with the inflation target. The chart also includes Norges Bank’s estimations of r* over time. Over the past year, the gap between the market-based and model-based measure has widened. Overall, these analyses do not provide grounds for changing the assessments of the neutral real interest rate from the March Report. 4
Percent
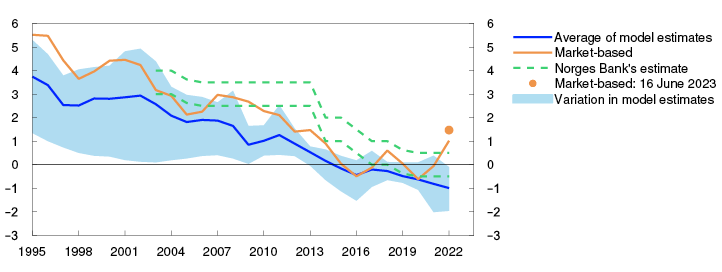
1 See Chapter 2 of International Monetary Fund (2023): World Economic Outlook, April 2023.
2 Period: 1 Janury 2005 – 16 June 2023. Implied five-year rates five years ahead based on swap rates less inflation swaps for the same period.
3 See Meyer, S. S., Ulvedal, P. B. and Erik. S. Wasberg (2022): “The neutral real interest rate: An updated view of r*”, Norges Bank Staff Memo 7/2022.
4 See box in Section 4 of Monetary Policy Report 2/2022 for more information about the assessments behind this range.
5 Period: 1995 – 2023. The broken green line shows a discretionary interval for the estimate of the neutral real interest rate.
Annex
Detailed tables of projections
TABLe 1 International projections
|
Change from projections in Monetary Policy Report 1/23 in brackets |
Weights1 Percent |
Percentage change from previous year |
||||
|
2022 |
2023 |
2024 |
2025 |
2026 |
||
|
GDP |
||||||
|
US |
9 |
2.1 (0.0) |
1.6 (0.1) |
1.0 (-0.2) |
1.7 (0.0) |
1.7 (0.0) |
|
Euro area |
35 |
3.5 (0.0) |
0.6 (-0.1) |
1.4 (0.0) |
1.7 (0.0) |
1.6 (0.0) |
|
UK |
11 |
4.1 (0.1) |
0.3 (0.3) |
0.6 (-0.3) |
1.6 (-0.2) |
1.7 (-0.1) |
|
Sweden |
13 |
2.9 (0.1) |
-0.1 (0.7) |
0.8 (-0.5) |
2.2 (0.1) |
1.8 (-0.2) |
|
China |
6 |
3.2 (0.2) |
5.2 (0.0) |
4.5 (-0.3) |
4.0 (0.1) |
3.7 (-0.1) |
|
13 trading partners1 |
100 |
3.5 (0.1) |
1.1 (0.2) |
1.6 (-0.2) |
2.1 (-0.1) |
2.0 (-0.1) |
|
5 trading partners2 |
3.3 (0.1) |
1.1 (0.1) |
1.5 (-0.2) |
2.0 (-0.1) |
1.9 (0.0) |
|
|
Prices |
||||||
|
Underlying inflation3 |
4.8 (0.0) |
5.3 (0.3) |
2.8 (0.2) |
2.3 (0.1) |
2.1 (0.0) |
|
|
Wage growth3 |
4.3 (-0.2) |
5.0 (0.4) |
4.0 (0.3) |
3.5 (0.2) |
3.1 (0.0) |
|
|
Prices for consumer goods imported to Norway4 |
7.3 (0.0) |
-0.2 (-0.3) |
1.1 (-0.1) |
0.8 (0.0) |
0.8 (0.0) |
|
1 The aggregate includes: Euro area, China, UK, Sweden, US, Brazil, Denmark, India, Poland, South Korea, Singapore, Thailand and Turkey. Export weights.
2 The aggregate includes: Euro area, China, Sweden, UK and US. Export weights.
3 The aggregate includes: Euro area, Sweden, UK and US. Import weights.
4 In foreign currency terms. Including composition effects and freight rates.
Sources: Refinitiv Datastream and Norges Bank
TABle 2a Consumer prices. Twelve-month change. Percent
|
2023 |
|||||||
|
Mar |
Apr |
May |
Jun |
Jul |
Aug |
Sep |
|
|
Consumer price index (CPI) |
|||||||
|
Actual |
6.5 |
6.4 |
6.7 |
||||
|
Projections MPR 1/23 |
6.0 |
5.6 |
5.4 |
4.4 |
|||
|
Projections MPR 2/23 |
6.0 |
6.2 |
6.1 |
5.5 |
|||
|
CPI-ATE |
|||||||
|
Actual |
6.2 |
6.3 |
6.7 |
||||
|
Projections MPR 1/23 |
6.2 |
6.1 |
6.0 |
5.9 |
|||
|
Projections MPR 2/23 |
6.6 |
6.3 |
6.4 |
6.2 |
|||
|
Imported consumer goods in the CPI-ATE |
|||||||
|
Actual |
7.0 |
7.5 |
6.8 |
||||
|
Projections MPR 1/23 |
6.5 |
6.8 |
6.3 |
6.1 |
|||
|
Projections MPR 2/23 |
6.9 |
6.5 |
6.5 |
6.2 |
|||
|
Domestically produced goods and services in the CPI-ATE |
|||||||
|
Actual |
5.8 |
5.8 |
6.6 |
||||
|
Projections MPR 1/23 |
6.2 |
6.0 |
6.0 |
5.9 |
|||
|
Projections MPR 2/23 |
6.6 |
6.3 |
6.3 |
6.0 |
|||
Sources: Statistics Norway and Norges Bank
TABLE 2b House prices. Monthly change. Seasonally adjusted. Percent
|
2023 |
|||||||
|
Mar |
Apr |
May |
Jun |
Jul |
Aug |
Sep |
|
|
Actual |
0.5 |
0.8 |
0.0 |
||||
|
Projections MPR 1/23 |
0.0 |
-0.4 |
-0.4 |
-0.4 |
|||
|
Projections MPR 2/23 |
0.0 |
0.0 |
-0.1 |
-0.2 |
|||
Sources: Eiendomsverdi, Finn.no, Real Estate Norway and Norges Bank
TABLE 2c Registered unemployment (rate). Percent of labour force. Seasonally adjusted
|
2023 |
|||||||
|
Mar |
Apr |
May |
Jun |
Jul |
Aug |
Sep |
|
|
Actual |
1.7 |
1.8 |
1.8 |
||||
|
Projections MPR 1/23 |
1.7 |
1.8 |
1.8 |
1.8 |
|||
|
Projections MPR 2/23 |
1.8 |
1.9 |
1.9 |
2.0 |
|||
Sources: Norwegian Labour and Welfare Administration (NAV) and Norges Bank
TABLE 2d GDP for mainland Norway. Monthly change. Seasonally adjusted. Percent
|
2023 |
|||||||
|
Mar |
Apr |
May |
Jun |
Jul |
Aug |
Sep |
|
|
Actual |
0.2 |
-0.4 |
|||||
|
Projections MPR 1/23 |
0.1 |
0.1 |
0.1 |
0.1 |
|||
|
Projections MPR 2/23 |
0.4 |
0.3 |
0.0 |
-0.1 |
-0.1 |
||
Sources: Statistics Norway and Norges Bank
TABLE 2e GDP for mainland Norway. Quarterly change.1 Seasonally adjusted. Percent
|
2022 |
2023 |
|||
|
Q4 |
Q1 |
Q2 |
Q3 |
|
|
Actual |
0.5 |
0.1 |
||
|
Projections MPR 1/23 |
-0.1 |
0.1 |
0.0 |
|
|
Projections MPR 2/23 |
0.1 |
0.2 |
||
Sources: Statistics Norway and Norges Bank
1 Quarterly figures based on monthly national accounts.
TABle 3 Projections for main economic aggregates
|
Change from projections in Monetary Policy Report 1/23 in brackets |
Percentage change from previous year (unless otherwise stated) |
|||||
|
In billions of NOK 2022 |
2022 |
Projections |
||||
|
2023 |
2024 |
2025 |
2026 |
|||
|
Prices and wages |
||||||
|
CPI |
5.8 |
6.0 (1.1) |
3.9 (0.6) |
2.9 (0.3) |
2.4 (0.3) |
|
|
CPI-ATE |
3.9 |
6.3 (0.7) |
4.6 (0.8) |
3.3 (0.4) |
2.4 (0.2) |
|
|
Annual wages |
4.3 |
5.5 (0.4) |
4.7 (0.3) |
4.3 (0.3) |
3.7 (0.3) |
|
|
Real economy1 |
||||||
|
Gross domestic product (GDP) |
5 542 |
3.2 |
1.3 (-0.1) |
0.5 (-0.1) |
1.1 (0.2) |
1.0 (0.1) |
|
GDP, mainland Norway2 |
3 558 |
3.7 |
1.2 (0.1) |
0.2 (-0.3) |
0.9 (-0.2) |
1.4 (0.1) |
|
Output gap, mainland Norway (level) |
1.8 |
0.6 (0.0) |
-0.5 (-0.2) |
-0.8 (-0.4) |
-0.7 (-0.4) |
|
|
Employment, persons, QNA |
3.9 |
1.2 (0.3) |
-0.2 (-0.1) |
0.2 (-0.1) |
0.6 (0.1) |
|
|
Registered unemployment (rate, level) |
1.8 |
1.9 (0.0) |
2.3 (0.1) |
2.4 (0.1) |
2.4 (0.1) |
|
|
Demand1 |
||||||
|
Mainland demand2 |
3 762 |
4.9 |
-0.6 (-0.4) |
0.3 (-0.9) |
1.8 (-0.1) |
1.9 (0.1) |
|
– Household consumption |
1 806 |
6.9 |
-1.6 (-0.5) |
0.1 (-1.6) |
2.1 (0.0) |
2.6 (0.5) |
|
– Business investment |
449 |
14.5 |
2.7 (0.9) |
-0.4 (-0.5) |
2.2 (-0.7) |
1.3 (-0.1) |
|
– Housing investment |
232 |
-1.4 |
-10.7 (-6.7) |
-2.1 (-2.6) |
2.8 (-0.8) |
3.8 (-0.9) |
|
– Public demand |
1 275 |
0.3 |
1.6 (0.5) |
1.1 (0.1) |
1.1 (0.0) |
0.8 (-0.2) |
|
Petroleum investment2 |
176 |
-6.5 |
5.0 (-1.0) |
3.0 (-1.0) |
2.0 (0.0) |
0.5 (2.5) |
|
Mainland exports2 |
934 |
8.4 |
6.1 (1.9) |
2.4 (0.7) |
3.1 (-0.1) |
3.2 (-0.2) |
|
Imports |
1 516 |
9.1 |
3.1 (1.2) |
0.6 (-1.6) |
3.8 (-0.1) |
2.1 (0.1) |
|
House prices and debt |
||||||
|
House prices |
4.9 |
0.3 (3.2) |
0.6 (0.6) |
3.5 (-0.6) |
4.9 (-0.5) |
|
|
Household credit (C2) |
4.5 |
4.0 (0.3) |
3.4 (0.2) |
3.0 (0.0) |
2.8 (0.0) |
|
|
Interest rate, exchange rate and oil price |
||||||
|
Policy rate (level) |
1.3 |
3.5 (0.2) |
4.1 (0.6) |
3.7 (0.5) |
3.1 (0.4) |
|
|
Import-weighted exchange rate (I-44) (level) |
110 |
119.4 (2.0) |
118.1 (3.8) |
116.6 (4.3) |
116.2 (4.2) |
|
|
Policy rate, trading partners (level) |
0.7 |
3.8 (0.4) |
4.0 (1.0) |
3.2 (0.5) |
2.8 (0.2) |
|
|
Oil price, Brent Blend. USD per barrel |
101 |
78.0 (2.2) |
73.4 (2.0) |
71.0 (1.6) |
69.2 (1.2) |
|
|
Household income and saving1 |
||||||
|
Real disposable income excl. dividend income |
2.6 |
-2.4 (-0.5) |
0.9 (-1.2) |
2.3 (-0.3) |
2.8 (-0.1) |
|
|
Saving ratio excl. dividend income (rate, level) |
0.2 |
-0.6 (0.2) |
0.9 (0.8) |
1.0 (0.4) |
1.4 (0.0) |
|
|
Fiscal policy |
||||||
|
Structural non-oil deficit as a percentage of GPFG3 |
2.7 |
3.0 (0.2) |
2.6 (0.1) |
2.6 (0.2) |
2.5 (0.1) |
|
|
Structural non-oil deficit as a percentage of trend GDP |
9.5 |
10.1 (0.5) |
10.1 (0.4) |
10.1 (0.7) |
10.0 (0.4) |
|
1 All figures are working-day adjusted.
2 Annual figures based on monthly national accounts.
2 Government Pension Fund Global measured at the beginning of the year.
Sources: Eiendomsverdi, Finn.no, Ministry of Finance, Norwegian Labour and Welfare Administration (NAV), Real Estate Norway, Refinitiv Datastream, Statistics Norway and Norges Bank