Monetary policy assessment
Norges Bank’s Monetary Policy and Financial Stability Committee decided to raise the policy rate from 2.75% to 3% at its meeting on 22 March. There is considerable uncertainty about future economic developments, but the Committee’s current assessment of the outlook and balance of risks implies that the policy rate will most likely be raised further in May.
Improved international growth prospects
Consumer price inflation among Norway’s main trading partners has receded somewhat in recent months but is still high. Gas and electricity prices have fallen substantially, and futures prices are lower than in December. The decline in energy prices has contributed to curbing consumer price inflation, and in some countries underlying inflation has also moderated slightly. Global freight rates have declined further and are close to pre-pandemic levels.
Economic activity among trading partners softened a little in 2022 Q4. High consumer price inflation and rising interest rates are weakening household purchasing power and dampening activity. At the same time, lower gas and electricity prices will help underpin activity in 2023, particularly in the euro area. The lifting of containment measures in China will also provide additional impetus to global activity. GDP growth among Norway’s trading partners is expected to be subdued in 2023 but somewhat higher than anticipated earlier. Labour markets are tight, and wage growth is high in many countries. This may contribute to sustaining underlying inflation.
Øre/kWh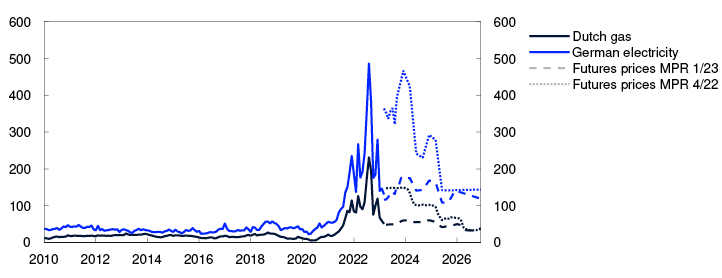
High inflation has prompted central banks in many of Norway’s trading partner countries to raise policy rates to the highest levels since the 2008 financial crisis. In recent weeks, problems at certain banks in the US and Switzerland have led to heightened financial market volatility. Global equity indexes have declined, oil prices have dropped and expectations for both Norwegian and international policy rates have decreased markedly. Market-based expectations for policy rates among Norway’s main trading partners are nevertheless somewhat higher overall than in December.
Policy rates and estimated forward rates. Percent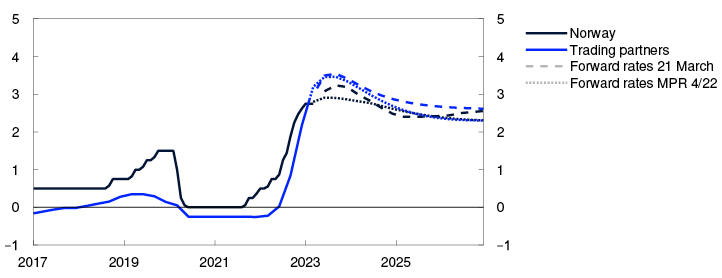
Significantly weaker krone
Over the past year, international interest rates have risen more than Norwegian interest rates. Combined with the recent increase in financial market turbulence, this has likely caused the krone exchange rate to depreciate, and the krone is now significantly weaker than projected in the December Report. The risk premiums in the money market and bond market have increased a little in recent weeks. Norwegian banks are well poised to weather losses and market turbulence given their solid profitability, capital adequacy and liquidity. Creditworthy households and firms appear to have ample access to credit. Interest rates on corporate loans have increased a little since December, and residential mortgage rates have risen broadly in line with expectations.
Import-weighted exchange rate index. I-44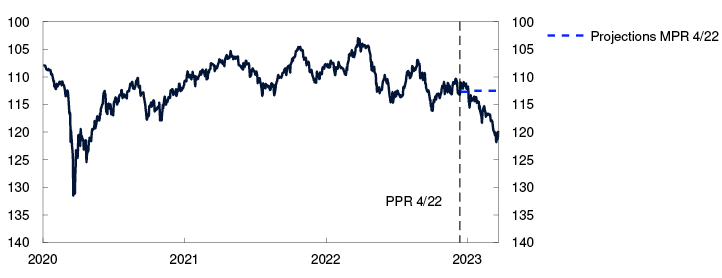
Improved growth outlook for Norway too
There is a high level of activity in the Norwegian economy. Norwegian mainland GDP increased further in 2022 Q4 and was higher in January than projected in December. Around the end of 2022, car purchases contributed to a marked increase in household consumption, most likely because car purchases were brought forward due to the announced car tax changes from 2023. Low car sales so far this year are expected to push down economic activity a little in 2023 Q1.
GDP for mainland Norway. Seasonally adjusted. Index. February 2020 = 100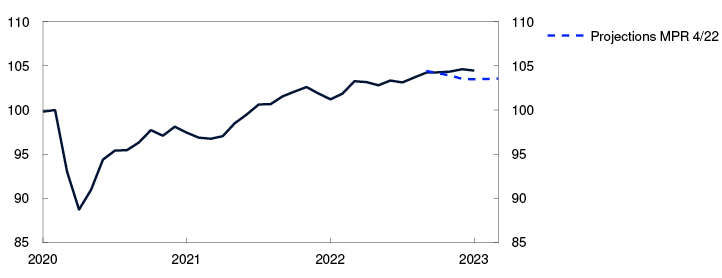
The labour market is tight. Employment has risen further and has been higher than projected. Unemployment has remained low. At the same time, labour shortages appear to have eased. The share of enterprises in Norges Bank’s Regional Network reporting that labour shortages are limiting output fell further in 2023 Q1.
Regional Network enterprises report some improvement in the outlook since the end of 2022, and now expect activity to hold steady in the period to summer. Enterprises also report slightly stronger profitability. There are wide differences across industries. Oil services contacts expect a sharp rise in activity as a result of high investment in the petroleum industry, while the construction industry expects a fall in production, partly owing to weak new home sales. Prices for existing homes have been higher than expected, and the number of unsold homes has declined. Nevertheless, house prices are expected to fall slightly ahead.
Capacity utilisation and labour shortages according to the Regional Network. Percentage shares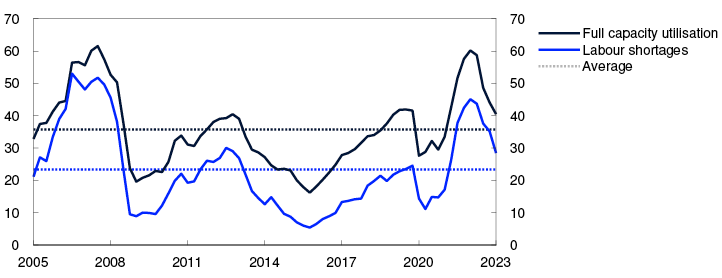
There are prospects that growth in the Norwegian economy will slow in 2023, but that activity will be higher than projected in the December Report. Strong petroleum investment and a rise in exports are expected to contribute to sustaining activity, while a substantial decline in household real disposable income pushes down consumption in 2023. The saving ratio fell markedly towards the end of 2022, and the current projections indicate that households will continue to draw on savings this year. Higher real wage growth is expected to push up consumption further ahead. Substantial investments related to climate transition are also expected to boost activity further out.
Prospects of high inflation for a longer period
Inflation in Norway is high and markedly above the target of 2%. The 12-month rise in the consumer price index (CPI) has slowed slightly since autumn and was 6.3% in February, lower than projected in the December Report. Underlying inflation indicators have risen a little since December. The 12-month rise in the CPI adjusted for tax changes and excluding energy products (CPI-ATE) was 5.9% in February, as projected earlier. Prices for many goods have risen rapidly, and higher services prices have recently become an increasingly prominent driver of inflation.
Inflation expectations have risen over the past year, according to Norges Bank’s expectations survey. Long-term expectations are somewhat above 2%.
Wage growth increased to 4.3% in 2022 and was higher than projected. The rise in wage growth must partly be seen in the context of a tight labour market. At the same time, wage expectations for 2023 have increased, and the social partners expect wage growth to be higher in 2023 than in 2022. Annual wage growth in 2023 is now projected at 5.1%, which is higher than in the December Report.
Lower energy prices are expected to curb consumer price inflation ahead, while the past depreciation of the krone and higher wage growth will contribute to sustaining underlying inflation for longer.
CPI and CPI-ATE. Twelve-month change. Percent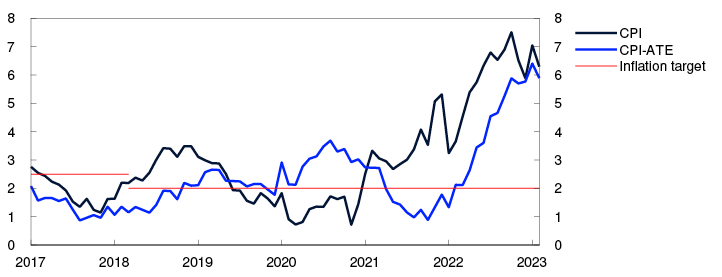
Policy rate raised to 3%
The objective of monetary policy is annual consumer price inflation of close to 2% over time. Inflation targeting shall be forward-looking and flexible so that it can contribute to high and stable output and employment and to counteracting the build-up of financial imbalances.
The Committee assesses that a higher policy rate is needed to curb inflation. Inflation is markedly above target. Growth in the Norwegian economy is slowing, but economic activity remains high. The labour market is tight, and wage growth is on the rise.
Since the December Report, energy prices have shown a pronounced fall, and consumer price inflation has been lower than projected. On the other hand, unemployment has been a little lower than projected, and there are signs that the slowdown in the Norwegian economy will be less pronounced than expected in December. Higher wage growth and a weaker krone than projected earlier push up inflation ahead. It is therefore the Committee’s view that the policy rate needs to be increased to a somewhat higher level ahead than projected earlier in order to bring inflation down to target.
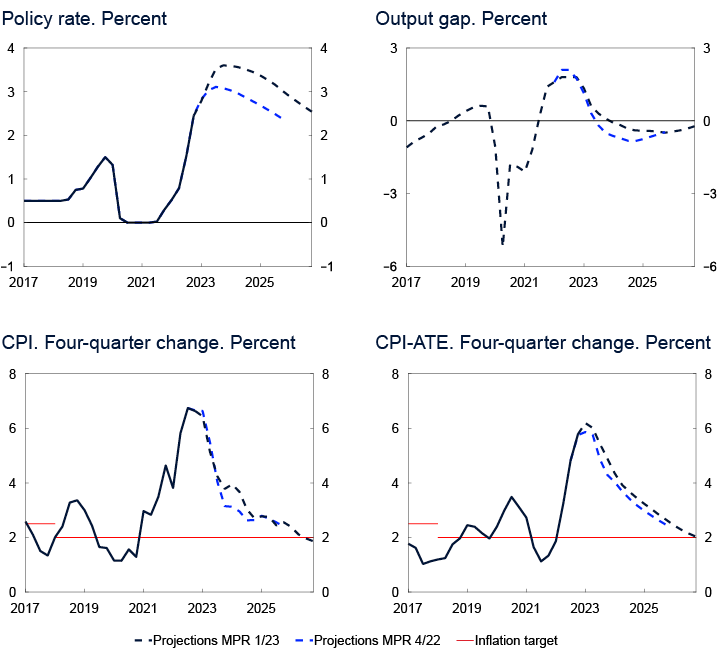
The policy rate forecast has been revised up from the December Report and indicates a rise in the policy rate to around 3.5% in summer. Inflation is projected to moderate and approach the target somewhat further ahead. Capacity utilisation is expected to decline and lie somewhat below a normal level in the coming years. Unemployment is set to increase somewhat, albeit from a low level.
The future path of the policy rate will depend on economic developments. In its discussion of the balance of risks, the Committee was concerned with the substantial uncertainty over the potential impact of the turbulence in financial markets on financial conditions and the prospects for the Norwegian economy. There is also uncertainty about the future path of the krone and the potential effects of high inflation on wage and price formation. At the same time, the effects of the past rate hikes are not yet fully evident. Moreover, it is uncertain to what extent households will tighten consumption in response to high inflation and higher interest rates.
If the krone proves weaker than projected, or pressures in the economy persist, a higher policy rate than currently projected may be needed to bring inflation down to target. If inflation falls faster or unemployment rises more than projected, the policy rate may be lower than projected.
The Committee voted unanimously to raise the policy rate by 0.25 percentage point to 3% at its meeting on March 22. There is considerable uncertainty about future economic developments, but the Committee’s current assessment of the outlook and balance of risks implies that the policy rate will most likely be raised further in May.
Ida Wolden Bache
Pål Longva
Øystein Børsum
Ingvild Almås
Jeanette Fjære-Lindkjenn
22 March 2023
1 Period: January 2010 – December 2026. Futures prices at 13 December 2022 for MPR 4/22 and at 21 March 2023 for MPR 1/23.
2 Period: January 2017 – December 2026. Trading partners comprise the US, UK, euro area and Sweden. I-44 weights.
3 Period: 1 January 2020 – 21 March 2023. A higher I-44 index value indicates a weaker krone exchange rate.
4 Period: January 2020 – March 2023. Projections from December 2022 for MPR 4/22.
5 Period: 2005 Q1 – 2023 Q1. Share of contacts that will face some or considerable difficulty meeting increased demand and share of contacts citing labour shortages as a constraint on production. The question about labour is asked only of the enterprises reporting full capacity utilisation, but the series shows the share of all contacts included in the interview period.
6 Period: January 2017 – February 2023. CPI-ATE: CPI adjusted for tax changes and excluding energy products.
7 Period: 2017 Q1 – 2026 Q4. Projections from 2022 Q4 for MPR 4/22 and 2023 Q1 for MPR 1/23 for the policy rate, CPI and CPI-ATE. The output gap measures the percentage deviation between mainland GDP and estimated potential mainland GDP. CPI-ATE: CPI adjusted for tax changes and excluding energy products.
1. The global economy
Consumer price inflation is moving down from very high levels in many countries. Trading partner GDP growth is projected to be low in 2023, but the reopening of China’s economy and lower energy prices are boosting activity more than projected in the December 2022 Monetary Policy Report. The recent turbulence related to problems at certain US and Swiss banks has caused substantial volatility in international financial markets.
Lower gas and electricity prices are lifting growth prospects
Among Norway’s trading partners, capacity utilisation was likely higher than normal in 2022. Labour markets are tight. For trading partners as a whole, GDP fell slightly in the period between 2022 Q3 and Q4, as projected in the December Report. Activity rose in the US, while it fell in Sweden. In the euro area, UK and China, GDP was unchanged.
In mid-December 2022, Chinese authorities lifted nearly all pandemic-related restrictions in the space of a short period of time. The reopening of the Chinese economy occurred faster than envisaged and higher growth is expected in the first half of 2023 (Chart 1.1). Increased Chinese demand for goods and an upswing in Chinese holidaying abroad are likely to make a positive contribution to activity levels in other countries.
PMI, composite, manufacturing and services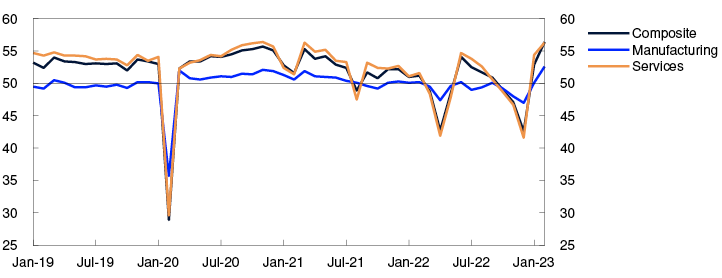
A warm winter in Europe has pushed down demand for gas and electricity. Combined with an adequate supply of liquefied natural gas (LNG), this has led to a marked fall in prices (see "Lower energy and non-energy commodity prices"). European gas prices in the period to summer 2023 are close to 70% lower than in December. Lower energy prices will boost activity in European economies. At the same time, consumer price inflation is still high and interest rates have risen, weakening household purchasing power and dampening activity.
Activity indicators for both services and manufacturing in Europe are low, despite having risen somewhat in recent months (Chart 1.2). Euro area activity levels are expected to show little change in the coming quarters. The near-term outlook is more favourable than projected in the December Report. In Sweden, higher interest rates have contributed to a substantial decline in house prices, and GDP is expected to fall in the period to autumn.
PMI, manufacturing (output) and services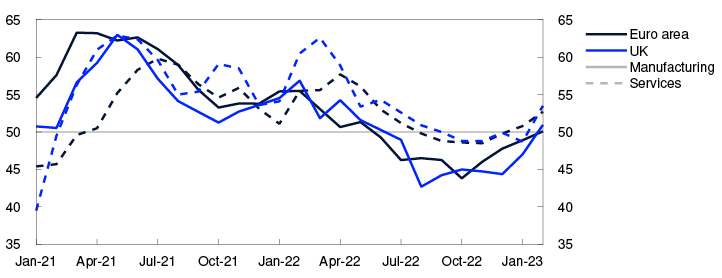
In the US, higher interest rates have led to a significant downturn in the housing market. Households have drawn on savings accumulated during the pandemic, and the continued rise in private consumption contributed to solid GDP growth towards the end of 2022. US households are expected to increase savings ahead, and relatively low GDP growth is expected through 2023.
Policy rates are assumed to move in line with market policy rate expectations and commodity prices to move in line with futures prices. Higher defence and energy investments in Europe are likely to boost activity further out in the projection period. In the UK, there are plans for fiscal tightening, while public infrastructure and climate investments in the US are making a positive contribution to activity. Trading partner GDP growth is projected to decline from 3.4% in 2022 to 0.9% in 2023, before picking up again in 2024 (see Annex Table 1). The projection for 2023 has been revised up from the December Report (Chart 1.3).
GDP for trading partners. Quarterly change. Percent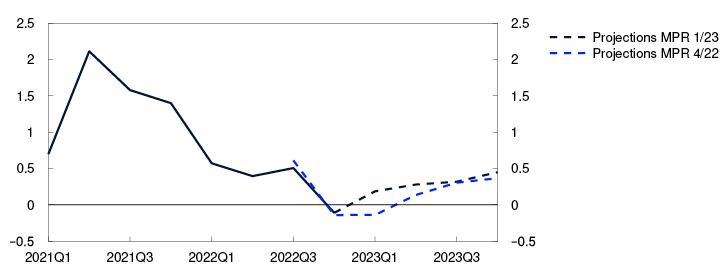
Consumer price inflation has declined
Pandemic-related supply and demand conditions and the war in Ukraine have contributed to high inflation among Norway’s main trading partners since autumn 2021, but consumer price inflation has now passed the peak in a number of countries. In both the US and Europe, 12-month CPI inflation has fallen in recent months (Chart 1.4).
Consumer prices. Twelve-month change. Percent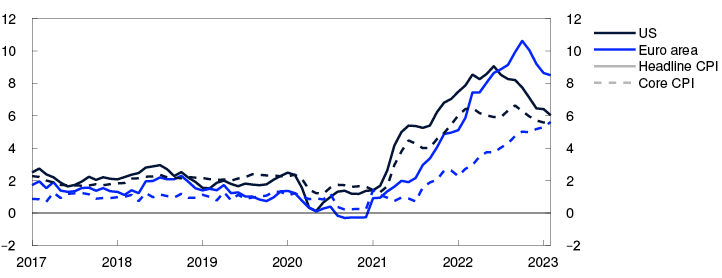
Underlying consumer price inflation is around 5.5% in both the US and the euro area, but over 9% in Sweden. In recent months, underlying inflation has been higher than expected in the euro area and Sweden. This likely reflects a stronger pass-through from high energy prices in autumn and winter than assumed in the December Report and will likely push up underlying inflation in the period ahead too. In Sweden, very high food inflation is contributing to sustaining underlying inflation at a high level. On the other hand, goods freight rates are almost down to pre-pandemic levels and prices for many commodities, including metals and food products, have declined, which alone will dampen consumer goods inflation.
In many countries, unemployment is lower than before the pandemic. Wage growth among Norway’s main trading partners is projected to remain elevated at around 4.5% in 2023. Wage growth is expected to drift down gradually to 3% during the projection period owing to the rise in interest rates and lower capacity utilisation. Long-term market-based inflation expectations are little changed since the December Report and are close to inflation targets in both the US and euro area. Underlying inflation for trading partners as a whole is projected to remain elevated at 5% in 2023, before gradually drifting down to around 2% in 2026. The 2023 projections for the euro area and Sweden have been revised up significantly from the December Report.
Considerable volatility in financial markets
Since the December Report, central banks abroad have continued to tighten monetary policy, primarily in response to persistently high inflation. Central banks in the US, euro area, UK and Sweden have all raised their policy rates to the highest levels since the financial crisis. Improved growth prospects and persistently high inflation pulled up market policy rate expectations for some time, but expectations fell back sharply in response to the turbulence related to problems at certain US and Swiss banks. Policy rates are expected to peak at a somewhat higher level in the euro area than expected in the December Report, while US policy rate expectations have fallen. Long-term interest rates are slightly higher in the euro area and Sweden but slightly lower in the US than at the time of the December Report (Chart 1.5). Global equity indexes have also fluctuated in the period since December. At the beginning of 2023, equity indexes gained ground on the back of improved growth prospects but have since fallen in response to the turmoil in the banking sector. On the whole, equity indexes have shown little change since the December Report. Corporate bond risk premiums have risen.
Yields on 10-year government bonds in selected countries. Percent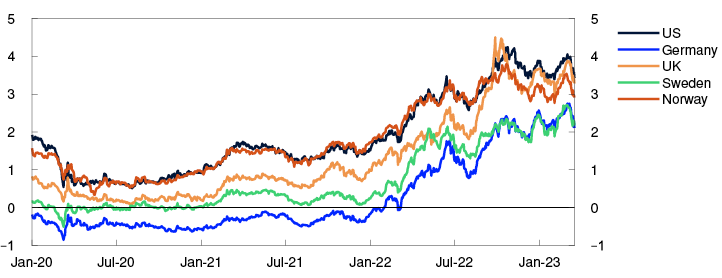
Uncertainty surrounding the economic outlook
Heightened financial market uncertainty may lead to a tightening of financial conditions and weaken growth more than projected in this Report. The effects of monetary policy tightening are uncertain both because rate hikes have been large and rapid and because there has been a globally synchronised tightening. The higher costs faced by households and businesses may lead to lower consumption and investment among trading partners than currently envisaged. Consumer price inflation may then also fall more rapidly. On the other hand, growth may prove to be stronger than expected if households spend a larger share of their savings. If wage earners are compensated for the high level of inflation to a larger extent than projected, or if firms increase their margins, price and wage inflation could remain high for longer than currently projected. In addition, the reopening of the Chinese economy may lead to higher commodity prices than indicated by futures prices. The ongoing war in Ukraine is still a source of uncertainty over developments ahead, as are political tensions between the US and China.
1 Period: January 2019 – February 2023. Survey of purchasing managers. Diffusion index centred around 50.
2 Period: January 2021 – February 2023. Survey of purchasing managers. Diffusion index centred around 50.
3 Period: 2021 Q1 – 2023 Q4. Projections from 2022 Q4 for MPR 4/22 and 2023 Q1 for MPR 1/23. Export weights. 13 trading partners.
4 Period: January 2017 – February 2023. Core CPI is consumer prices excluding energy and food in the US and consumer prices excluding energy, food, tobacco and alcohol in the euro area.
5 Period: 1 January 2020 – 17 March 2023.
Lower energy and non-energy commodity prices
Energy and non-energy commodity prices have fallen back from the record levels seen in 2022 but remain high.
The European gas benchmark price has continued to fall since the December 2022 Monetary Policy Report (see Chart A in “Monetary policy assessment”). Gas consumption has been reduced owing to a mild winter in much of Europe, lower activity in energy-intensive industries and energy saving policy measures. In addition, the supply of liquefied natural gas (LNG) to Europe has been good thanks to lower Chinese LNG imports. European gas inventories are now at a high level for this time of year.
Futures prices indicate that wholesale gas prices will be substantially lower in the years ahead than assumed in the December Report but still higher than the historical average (see Table 1.A). Prices may rise again if gas consumption were to pick up or if LNG supply to Europe falls. However, the current high level of gas inventories will likely prevent a rise in prices from being as sharp as last year and may result in a further decline in gas prices if developments in gas consumption remain weak.
Table 1.A Energy and commodity prices
|
Percentage change from projections in Monetary Policy Report 4/22 in brackets |
Average price (2010–2019) |
Actual prices and futures prices1 |
|||||
|
2021 |
2022 |
2023 |
2024 |
2025 |
2026 |
||
|
Oil, USD/barrel |
80 |
71 |
101 |
75 (-2) |
70 (-6) |
69 (-5) |
68 (-4) |
|
Dutch gas, USD/barrel |
40 |
87 |
205 |
81 (-65) |
85 (-53) |
71 (-41) |
55 (-18) |
|
Petroleum2, USD/barrel |
63 |
85 |
163 |
79 (-61) |
79 (-48) |
71 (-33) |
61 (-14) |
|
Coal, EUR/tonne |
66 |
102 |
277 |
124 (-49) |
121 (-48) |
114 (-47) |
110 (-48) |
|
Emission allowance prices, EUR/tonne |
10 |
53 |
81 |
86 (-3) |
90 (-5) |
94 (-5) |
99 (-6) |
|
German electricity, Øre/kWh |
36 |
106 |
258 |
144 (-63) |
155 (-48) |
131 (-32) |
115 (-20) |
|
Nordic electricity, Øre/kWh |
32 |
64 |
142 |
73 (-65) |
77 (-22) |
66 (-16) |
56 (-26) |
|
Electricity in southern Norway, Øre/kWh |
31 |
78 |
206 |
105 (-59) |
111 (-18) |
97 (-9) |
83 |
|
Electricity in northern Norway, Øre/kWh |
32 |
41 |
38 |
44 (-12) |
45 (-10) |
44 (-11) |
42 |
|
Aluminium, in thousands of USD/tonne |
1.9 |
2.5 |
2.7 |
2.3 (-7) |
2.4 (-6) |
2.6 (-5) |
2.7 (-4) |
|
Copper, in thousands of USD/tonne |
6.8 |
9.3 |
8.8 |
8.7 (1) |
8.6 (1) |
8.6 (1) |
8.5 (1) |
|
Wheat, USD/tonne |
210 |
258 |
331 |
268 (-3) |
272 (-3) |
267 (0) |
- |
|
Maize, USD/tonne |
183 |
227 |
271 |
245 (-1) |
221 (-4) |
208 (-3) |
192 |
1 Futures prices at 17 March 2023.
2 An estimated Norwegian petroleum export price. The price has been estimated based on the share of oil and gas in historical export figures. For futures prices, oil and gas have shares calcualted on the basis of expected market prices.
Sources: Refinitiv Datastream and Norges Bank
European wholesale electricity prices have also fallen. Gas plants are often the marginal production technology in the power sector and lower gas prices thereby lead to lower electricity prices. In addition, wind power production has at times been high and French nuclear power production has increased following extensive reactor shutdowns. Electricity consumption has been restrained by the same conditions that apply to gas.
As with gas, futures prices for European electricity have fallen but are still substantially higher than the historical average (Table 1.A). Developments in European electricity prices going forward will continue to follow gas prices closely.
Lower European wholesale electricity prices have led to lower wholesale electricity prices in southern Norway (Chart 1.A). In addition, water reservoir levels are significantly higher than at the same time in 2022. The fall in electricity futures prices in Norway has coincided with the fall elsewhere in Europe. Yet, they still indicate that prices will remain substantially higher than the historical average (Table 1.A). Wholesale electricity prices in northern Norway have also fallen. Futures prices in these regions are significantly lower than in southern Norway, albeit somewhat higher than the historical average.
Øre/kWh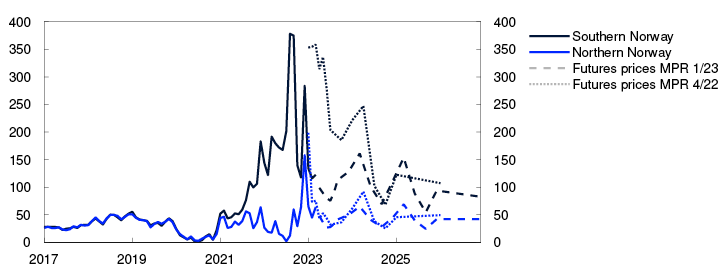
Oil prices fell in response to financial market turbulence and are lower than in December (Chart 1.B). The reopening of the Chinese economy could lead to higher prices, but monetary policy tightening in advanced economies and financial market turbulence have so far pulled in the opposite direction. Uncertainty surrounding Russian oil exports is high, following the inclusion of refined products in the sanctions from February. However, in recent years, OPEC+ has shown that it seeks to adjust production to dampen the impact on oil prices.
USD/barrel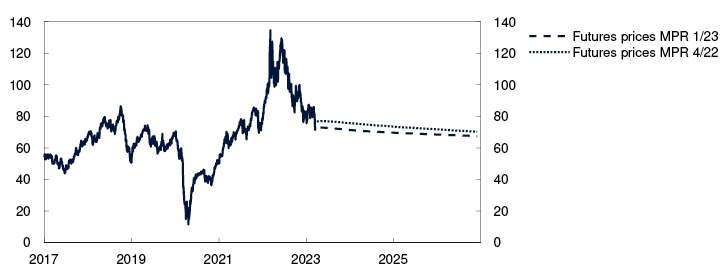
Prices for copper are little changed since December, whereas prices for other industrial metals are lower. Futures prices are somewhat lower but indicate that prices in the coming years will be higher than pre-pandemic levels. The reopening of the Chinese economy may lead to higher metal prices than indicated by futures prices, but the rise in prices could moderate if growth is mainly concentrated in the services sector, thereby limiting spillovers to the rest of the world. In addition, monetary policy tightening in advanced economies and turbulence in financial markets may weigh down on metal prices.
Global agricultural commodity prices, including futures prices are little changed from December. Climate change, geopolitical uncertainty and high intermediate goods prices are keeping prices elevated, with futures prices indicating higher prices than before the pandemic.
2. Financial conditions
Financial conditions in Norway are a bit tighter than at the time of the December 2022 Monetary Policy Report. A higher policy rate has led to a further rise in household and corporate lending rates. The problems in certain US and Swiss banks have led to heightened financial market volatility. The krone exchange rate has weakened significantly since December and is expected to remain weaker in the years ahead than projected in the December Report.
2.1 Monetary policy since December
Financial conditions are slightly tighter
At the monetary policy meeting on 14 December, the Monetary Policy and Financial Stability Committee raised the policy rate from 2.5% to 2.75%. At the meeting on 17 January, the policy rate was kept unchanged, but the Committee signalled that it would most likely be raised further in March.
Market-based policy rate expectations rose markedly after the New Year but fell back amid turbulence in the international financial sector. Market-based policy rate expectations are now a little higher in the near term than at the time of the December Report and a little lower further out. The expectations have increased less than among trading partners. Market-based policy rate expectations are lower than the policy rate forecast in this Report.
Financial conditions provide an indication of the ease with which finance can be accessed by banks, households and firms and on what terms. A higher policy rate and expectations of a further policy rate increase in March have contributed to tightening financial conditions since December. Financial conditions beyond these, as measured by Norges Bank’s financial conditions index (FCI), have recently tightened in response to the turbulence in financial markets. The FCI is now close to the levels prevailing in December (see "Financial Conditions Index (FCI)").
2.2 Household and corporate lending rates
Residential mortgage rates have risen in response to a higher policy rate
Household interest payments have risen, reflecting the rise in the policy rate, but banks’ lending rates have not been raised to the same degree as the policy rate (Chart 2.1). Around 85% of the policy rate increase since September 2021 has so far passed through to residential mortgage rates. According to the current information from Finansportalen, the interest rate on new floating-rate residential mortgages has risen further, by just under ¼ percentage point since the December Report. At the end of January, the average interest rate on outstanding mortgages was 4.1%.
Interest rates. Percent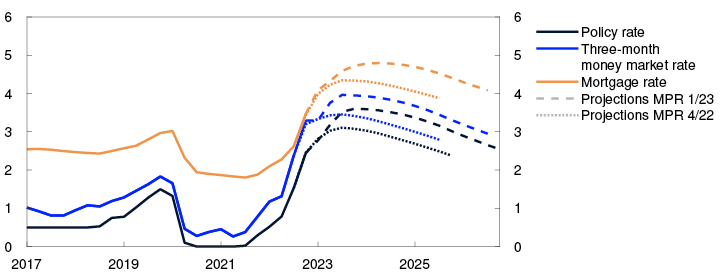
The average household deposit rate was 1.6% at the end of January. Over the past year, the policy rate pass-through to deposit rates has been substantially lower than the pass-through to lending rates but has recently increased. The lower pass-through to deposit rates than to mortgage rates has enabled banks to increase underlying profitability.
Developments in interest rates facing households have been broadly as expected. In the projections, residential mortgage rates continue to increase in response to further increases in the policy rate, but still somewhat less than the rise in the policy rate. The forecast implies a rise in the average residential mortgage rate to 4.8% early next year.
Given higher lending rates, households will have to spend on average a larger share of income on interest payments ahead. The projections imply an increase in household interest burdens from close to 7% in 2022 Q4 to close to 9% in the course of 2023.
Small rise in corporate lending rates
The cost of new corporate bank and bond finance has gradually increased over the past year. Interest rates on banks’ floating-rate corporate finance was just over 5% at the end of January (Chart 2.2).
Interest rates on new floating-rate NOK financing for non-financial enterprises. Percent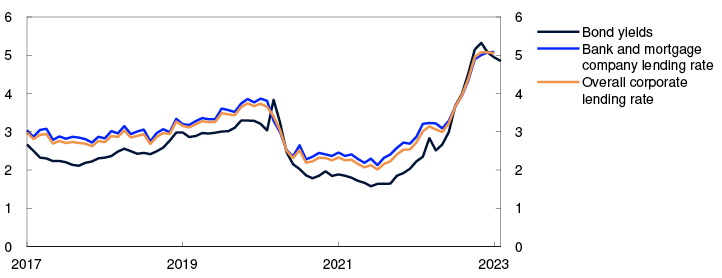
The interest rate on new floating-rate corporate funding is closely linked to the money market rate three-month Nibor. Since December, Nibor has increased somewhat, in pace with a higher policy rate and expectations of a further policy rate increase in March.
So far in 2023 Q1, the risk premium in the money market has averaged close to 0.35 percentage point (Chart 2.3). The premium is expected to hover around 0.4 percentage point in the near term, moving down to 0.35 percentage point thereafter. The projections are close to the market’s pricing of the premium on forward money market rates.
Money market premium. Percentage points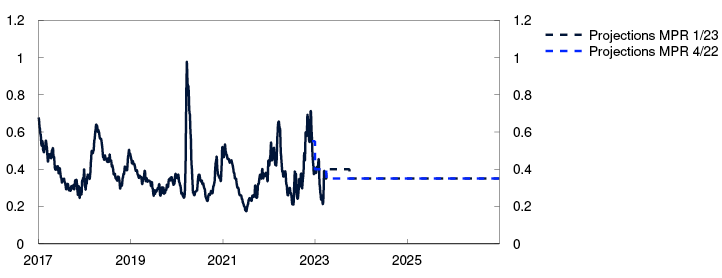
In addition to the money market rate, firms pay a premium on new funding in the form of a margin on bank funding and a bond risk premium. Bank lending spreads, as reflected in Statistics Norway’s interest rate statistics, edged down in 2022. However, banks’ responses to Norges Bank’s lending survey may indicate that lending spreads will rise somewhat from the current level. Risk premiums on new bond market financing rose markedly in 2022, but fell at the beginning of 2023. Risk premiums have recently risen a bit and are close to the levels prevailing in December. The premiums on total corporate bank and bond debt are expected in the near term to be close to the average for the past ten years.
A number of firms pay fixed rates on portions of their debt. For these loans, the level of long-term interest rates will have a particular bearing on the cost of new finance. Long-term rates are little changed compared with the December Report.
The Oslo Børs Benchmark Index has fallen since the December Report. The energy sub-index has declined as a result of lower energy prices. Most sub-indexes rallied in early 2023, but a number, including the financials index, have pulled back a little in response to increased market stress.
1 Period: 2017 Q1 – 2026 Q4. Projections from 2022 Q4 for MPR 4/22 and 2023 Q1 for MPR 1/23. The mortgage rate is the average rate on outstanding mortgage loans to households from the sample of banks and mortgage companies included in Statistics Norway’s monthly interest rate statistics.
2 Period: January 2017 – February 2023. Bank and mortgage company lending rates and overall corporate lending rates up to January 2023. Bond yields up to February 2023.
3 Period: 1 January 2017 – 31 December 2026. Five-day moving average. Latest observation on 17 March 2023. Projections from 2022 Q4 for MPR 4/22 and 2023 Q1 for MPR 1/23. The premium in the Norwegian money market rate is the difference between the three-month money market rate and the expected policy rate.
2.3 Household and corporate access to credit
Ample access to credit despite market turbulence
Norwegian banks are well poised to weather any losses and market turbulence given their solid profitability, capital and liquidity coverage. They are subject to stricter regulation and have lower interest rate risk than the US banks that were in trouble earlier this month (see "Turbulence surrounding certain US and Swiss banks"). The uncertainty in international banking markets has led to a slight increase in the risk premiums banks pay for new wholesale funding.
Creditworthy households and firms appear to have ample access to credit. The banks in Norges Bank’s lending survey report slightly tighter credit standards for households in 2022 Q4. The banks expected broadly unchanged household credit standards in 2023 Q1, but some banks pointed out that the relaxation of the debt-servicing capacity requirement in the Lending Regulation from 1 January will provide some households with easier access to credit. Banks’ corporate credit standards have been broadly unchanged.
Net bond issuance fell owing to higher risk premiums in 2022. Net issuance has been moderate so far this year, and despite the recent rise in risk premiums, there are no signs of bond market exclusion of creditworthy companies.
Over the coming years, much of commercial real estate (CRE) firms’ bond debt will mature. Owing to tighter financial conditions, some CRE firms have found it difficult to obtain new bond funding. Some banks reported somewhat tighter credit standards for CRE firms.
The turbulence in the international financial sector is not expected to have a meaningful effect on the Norwegian credit supply ahead. If the uncertainty associated with the financial sector intensifies and spreads, it may become more costly for Norwegian banks to obtain market funding. Such a situation may lead to tighter credit standards for households and firms.
2.4 The krone exchange rate
The krone is weak
There have been large movements in the foreign exchange market. The krone exchange rate, as measured by the import-weighted exchange rate index I-44, has depreciated by around 7% since the December Report and has been significantly weaker than projected (Chart 2.4). Trading partner policy rates rose markedly over the past year, and policy rate expectations are now higher than in December. Interest rates have risen more abroad than in Norway. The decline in the interest rate differential has likely contributed to the depreciation of the krone.
Import-weighted exchange rate index. I-44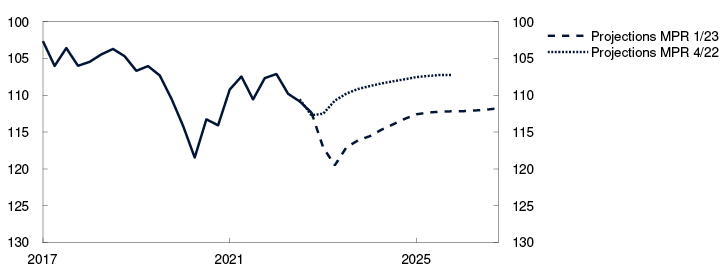
The turbulence in global financial markets has recently pushed up the NOK risk premium and led to a further depreciation of the krone.
The fall in petroleum prices since December has likely also contributed to the depreciation of the krone, even though the effect of changes in the terms of trade on the krone exchange rate has been considerably smaller over the past year than historical correlations might suggest.
The krone exchange rate is projected to remain close to the current level in the near term and then to appreciate as the NOK risk premium gradually fades. The krone is projected to be weaker over the entire forecast horizon than in the December Report. See "The krone exchange rate in Norges Bank’s models" for more on developments in the krone and how the Bank projects the path for the krone.
There is considerable uncertainty about future movements in the krone exchange rate. Both petroleum prices and risk appetite in global financial markets may change quickly and result in a different path for the krone than projected. If policy rate expectations fall more abroad than in Norway, the krone could appreciate more than projected. On the other hand, should the turbulence in the financial sector persist, financial market uncertainty could contribute to a weaker krone.
Financial Conditions Index (FCI)
The financial conditions index (FCI) provides an overall picture of the price and availability of different types of financing beyond that indicated by the policy rate and policy rate expectations further out. It provides an indication of the tightness or accommodativeness of financial conditions compared with a historical average. For more on the Norwegian FCI, see Monetary Policy Report 4/22 and Bowe et al (2023)1.
The FCI rose through autumn 2022. This indicates that the impact of monetary tightening in the period was amplified by a tightening of other financial conditions. The FCI fell at the beginning of 2023 but has increased a little recently. The FCI is broadly unchanged since December (Chart 2.A). Lower credit and money market premiums led to more accommodative conditions for a period, but premiums have recently risen slightly again. Moreover, the equity market turmoil, in conjunction with a sluggish housing market since December, have led to a tightening of financial conditions.
Financial conditions index. Standard deviation from mean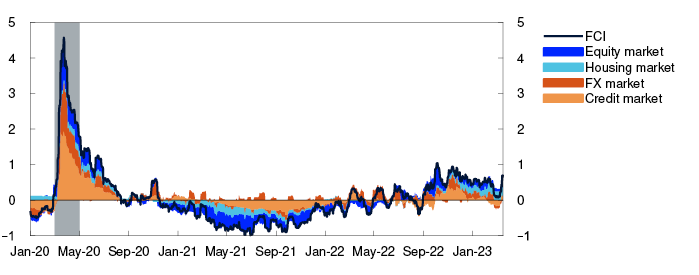
1 Bowe, F., K.R. Gerdrup, N. Maffei-Faccioli and H. Olsen (2023) “A high-frequency financial conditions index for Norway”. Norges Bank Staff Memo 1/2023.
2 Period: 1 January 2020 – 17 March 2023.
Turbulence surrounding certain US and Swiss banks
In recent weeks, there has been turbulence in the US and Swiss banking sector after certain US banks got into trouble and had to close. These incidents have led to considerable financial market volatility. Norwegian banks are subject to strict regulatory requirements and are well positioned to meet market stress and increased losses.
Since the start of the pandemic, deposits in US banks have risen. Silicon Valley Bank (SVB) held particularly large deposits from technology companies. A substantial portion of SVB’s deposits was invested in long-dated fixed-rate bonds. The increase in the federal funds rate through 2022 has driven down the value of these bonds. When depositors made large withdrawals, SVB was forced to sell the bonds at a loss. This prompted more depositors to withdraw funds, and the US authorities placed the bank under administration.
Smaller US banks are exempt from a number of regulatory requirements. This enabled SVB to maintain considerable interest rate and liquidity risk on its balance sheet. The problems at SVB prompted customers of smaller US banks to withdraw their funds. After large withdrawals of deposits from Signature Bank (SBNY), the US authorities also placed this institution under administration.
The US authorities have guaranteed all deposits at SVB and SBNY, and the Federal Reserve has established a new lending facility to prevent more banks from having to sell assets at loss to cover withdrawals.
Nevertheless, the turbulence has led to considerable uncertainty in global financial markets and marked volatility in interest rate expectations. Policy rate expectations have declined. Financial equity prices have fallen.
The share price of the Swiss bank Credit Suisse Group AG in particular fell markedly. The Swiss authorities and UBS have since made a deal for UBS to acquire the bank. Under the terms of the deal, Credit Suisse’s Additional Tier 1 (AT1) capital was written down to zero. The write-down created uncertainty about the value of other European banks’ AT1 capital. The European authorities have clarified that the EU capital rules do not permit similar write-downs until bank equity capital is depleted.
Capital and liquidity requirements for Norwegian and other European banks reduce the risk that these banks will experience liquidity problems if depositors make large withdrawals. Norwegian banks largely lend and borrow at floating rates, and the interest rate risk on their balance sheets is therefore limited. Norwegian banks are well-capitalised, liquid and profitable. This makes them well positioned to meet market stress and increased losses.
4 Period: 2017 Q1 – 2026 Q4. Projections from 2022 Q4 for MPR 4/22 and 2023 Q1 for MPR 1/23. A higher index value for I-44 indicates a weaker krone.
The krone exchange rate in Norges Bank’s models
The krone exchange rate has depreciated markedly over the past year, reflecting a faster rise in foreign interest rates and a higher krone risk premium owing to heightened global uncertainty. In the projections, the risk premium is now abnormally high, and the krone appreciates gradually.
Exchange rates are relative prices of different countries’ currency units. In the Bank’s Monetary Policy Report, the main index used is the I-44, which measures a weighted average of the currencies of the countries accounting for the bulk of Norway’s imports.
The krone exchange rate is important for developments in inflation, output and employment. The projections for economic developments in Norway must therefore be conditioned on a projected krone exchange rate path. The exchange rate can be influenced via the Bank’s monetary policy, but the exchange rate is also affected by actual and expected developments in both real and financial variables, internationally as well as domestically. Many of these variables cannot be controlled or projected with a high degree of accuracy. The Bank’s exchange rate projections are derived from both empirical models and the Bank’s main macro model NEMO.
Norges Bank’s projections for the krone exchange rate are based on an assessment of the equilibrium real krone exchange rate. The real exchange rate is equal to the nominal exchange rate adjusted for the price level in Norway and abroad, so that it shows the price of Norwegian goods relative to the price of foreign goods, expressed in a common currency.1 The real exchange rate can appreciate by 1% either when the price level in Norway increases by 1% more than the price level abroad, or when the krone exchange rate appreciates by 1%.
It is difficult to estimate the equilibrium real krone exchange rate as it depends on a number of unobservable structural conditions. Theoretical models may vary slightly, but the equilibrium real exchange rate is often based on the rate that attains external balance over the long term.2 Forces will pull the real exchange rate back to equilibrium in the long run. If the real krone exchange rate is, for example, weaker than its equilibrium level, this will stimulate net exports and push the real exchange rate towards equilibrium. This may occur via a stronger nominal exchange rate, higher inflation in Norway than abroad, or a combination of the two. The equilibrium real exchange rate can change if the conditions for external balance change over time, for example sustained changes in Norway’s terms of trade or changes in the size of petroleum reserves.
In the literature it is customary to assume that monetary policy cannot influence the equilibrium real exchange rate. This assumption also applies to our models. However, monetary policy can influence how, and how fast, it returns to equilibrium. If the expected interest rate level abroad rises more than in Norway, krone demand will normally fall because it becomes more profitable to invest in foreign currencies. The krone exchange rate then depreciates. This will in turn stimulate economic activity and push up prices for imported consumer goods. Both developments pull up inflation. Higher inflation in Norway than abroad will over time contribute to an appreciation of the real exchange rate. Over time, the real exchange rate will therefore return to equilibrium through a combination of stronger krone exchange rate and a higher price level in Norway relative to other countries. If Norges Bank also raises its policy rate so that expectations for Norwegian interest rates increase, this will contribute to countering a krone depreciation in the near term and at the same time reduce inflation.
The left panel in Chart 2.B shows developments in the real exchange rate since 2010 and the equilibrium rate assumed in the Bank’s macro model NEMO. The equilibrium real exchange rate is estimated to have weakened since 2010. As a simplification, most of the adjustment has been incorporated as a shift in 2014, given the change in Norway’s terms of trade. In 2014, oil prices fell sharply, gradually stabilising at a lower level. Lower petroleum revenues pulled the equilibrium real exchange rate in a weaker direction. Oil prices later rose again, but the krone did not appreciate back to its former level. A possible interpretation is that FX agents still assumed that Norway’s petroleum revenues would remain permanently lower than envisaged earlier. Since the equilibrium real exchange rate is unobservable and very difficult to estimate, the Bank will also consider actual developments in the real exchange rate over time.
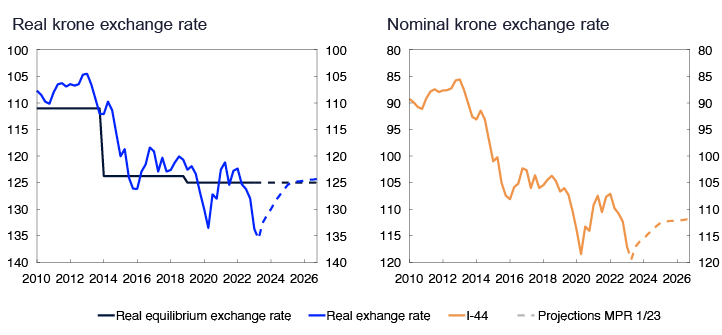
As shown in Chart 2.B, the real exchange rate and the nominal exchange rate have both depreciated considerably over the past year. The real exchange rate is now markedly weaker than the Bank’s estimated equilibrium level. NEMO can help us understand the causes behind such deviations to only a certain extent. Therefore, the Bank also uses other estimated equations for the krone exchange rate4, information from market participants and judgement. In the Bank’s view, the recent krone depreciation is ascribable to several factors:
- The expected interest rate differential against Norway’s trading partners has narrowed to a low level (left panel in Chart 2.C). Over the past year, trading partner policy rates have been raised faster than in Norway. The fall in the interest rate differential has been larger than the market had priced in and likely caused the krone to depreciate against other currencies. This mechanism is consistent with economic theory and estimated equations for the krone exchange rate.
- Financial market uncertainty increased owing to Russia’s invasion of Ukraine and high inflation in multiple countries and has recently increased further on the back of problems at certain US and Swiss banks. This has likely resulted in a higher krone risk premium and hence a weaker krone exchange rate. The Bank does not have an indicator that fully captures such a risk premium, but the heightened uncertainty is reflected in the decline in global equity indexes (middle panel in Chart 2.C). In periods over recent years, a fairly close co-movement between the krone exchange rate and global equity indexes has been observed.
- Oil prices have fallen since summer 2022. Historically, there has been a close relationship between movements in the krone exchange rate and oil prices (right panel in Chart 2.C).
For the years ahead, Norges Bank’s macro model NEMO is used to project the krone exchange rate (Chart 2.B). The model assumes that the future path of the krone is determined by changes in the expected interest rate differential against other countries after a policy rate decision and the krone risk premium. The krone is now weaker than implied by the expected interest rate differential and the Bank’s estimate of the equilibrium exchange rate. The model analyses therefore indicate that the krone risk premium is higher than normal.
I-44 against 12-month swap rate differential against major trading partners, the S&P 500 and oil prices (1st contract Brent Blend).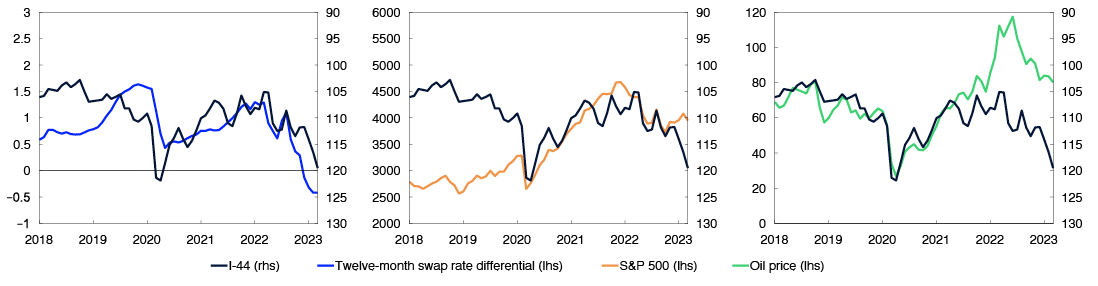
In the Bank’s projections, this risk premium fades, so that the real exchange rate reaches its equilibrium level further out. Inflation is projected to be a little higher in Norway than among trading partners. The nominal exchange rate appreciation needed to bring the exchange rate back to its estimated long-term equilibrium level will then be smaller.
1 The equilibrium real exchange rate can be written in log form as e* = v + pUTL - p, where v is the log of the nominal exchange rate, pUTL is the log of the foreign price level and p is the log of the domestic price level. e* is the value of the real exchange rate in equilibrium.
2 See for example Akram (2004), Oil wealth and real exchange rates: The FEER for Norway, Norges Bank Working Paper 16/2004.
3 Period: 2010 Q1 – 2026 Q4. The real exchange rate is equal to the nominal exchange rate (I-44) adjusted for quartely inflation among trading partners. A higher index value for I-44 indicates a weaker krone.
4 See Martinsen (2017): “Norges Bank’s BEER models for the Norwegian effective exchange rate”, Norges Bank Staff Memo 7/2017.
5 Period: January 2018 – March 2023. A higher index value for I-44 indicates a weaker krone.
3. The Norwegian economy
Consumer prices have risen substantially over the past year, and inflation is markedly above the target of 2%. At the same time, unemployment is low, and capacity utilisation appears to be above a normal level.
In the period ahead, inflation is projected to fall and approach the inflation target, on the back of lower capacity utilisation, weaker external price pressures and a fall in energy prices. Unemployment is expected to edge up, albeit from a low level.
3.1 Output and demand
Mainland GDP growth tapering off
Mainland GDP increased by 3.7% in 2022 and GDP growth was 0.7% in Q4, higher than projected earlier. The rise was primarily driven by growth in retail trade and other private services.
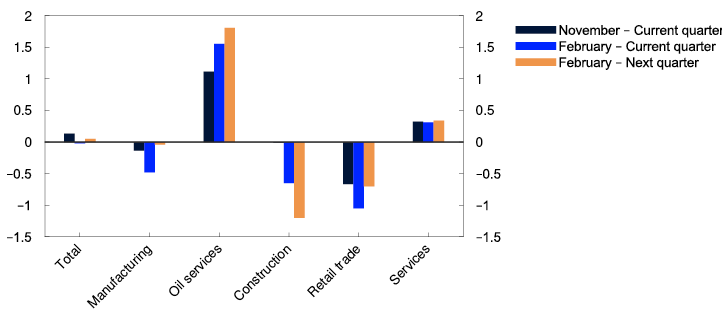
Overall, Norges Bank’s Regional Network contacts expect activity to be stable in the period to summer, but there are wide variations across sectors (Chart 3.1). Oil services contacts expect activity to rise substantially, given higher petroleum sector investment in Norway and abroad. In addition, renewable energy investment is pushing up activity. Services contacts also expect output to increase but to a lesser extent than in autumn 2022. On the other hand, contacts in the construction industry expect output to fall in the first half of 2023, largely reflecting weak new home sales and lower public demand. Overall, contacts in retail trade and manufacturing also expect a decline this spring.
Expected growth according to the Regional Network. Seasonally adjusted. Percent
The Norwegian economy is assessed to have reached a cyclical peak, and growth is projected to slow. The pronounced upturn in the mainland economy in 2022 Q4 was partly due to temporary factors, which then reversed in January 2023. In 2023 Q2, activity is expected to be broadly unchanged. Overall, projections for mainland GDP in the first half of 2023 lie slightly below the forecasts from Norges Bank’s modelling system for short-term forecasting (SMART) (Chart 3.2 and "SMART – System for Model Analysis in Real Time").
GDP for mainland Norway. Quarterly change. Percent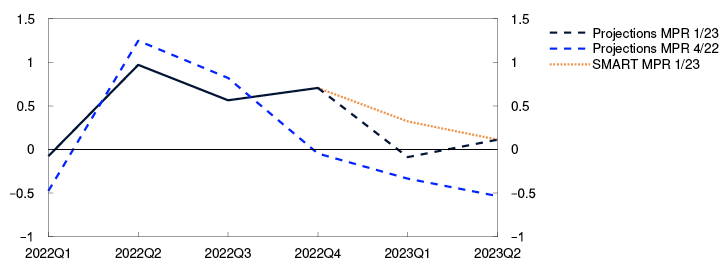
In the projections, mainland GDP growth slows to 1.1% in 2023 (Chart 3.3). Higher interest rates dampen demand in the Norwegian economy, partly by reducing household consumption and housing investment. On the other hand, a weaker krone helps to improve the cost competitiveness of Norwegian firms. This may push up net exports and boost business investment. Through 2024, mainland growth picks up gradually. Increased investment in the petroleum industry and activity related to climate transition push up growth in the years ahead. The projections for mainland GDP are somewhat higher than in the December 2022 Monetary Policy Report.
GDP for mainland Norway. Annual change. Contribution to annual change. Percentage points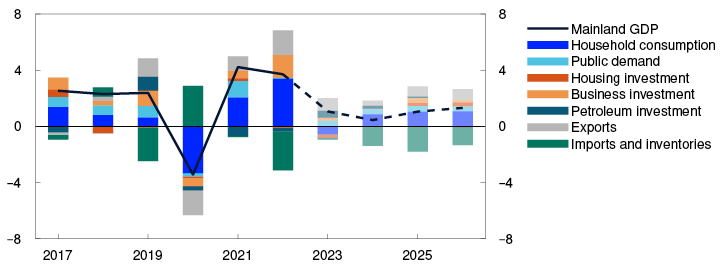
High inflation and higher interest rates curb household consumption
Household consumption rose substantially through 2022 and picked up pace in Q4 (Chart 3.4). Both household consumption and real disposable income have been higher than projected in the December Report. Car sales in particular boosted consumption towards the end of 2022, likely because car purchases were brought forward owing to car tax changes from 1 January 2023. Despite income growth, some consumption, particularly towards the end of 2022, was financed by drawing on accumulated savings or by borrowing.
Household consumption. Constant 2019 prices. Seasonally adjusted. In billions of NOK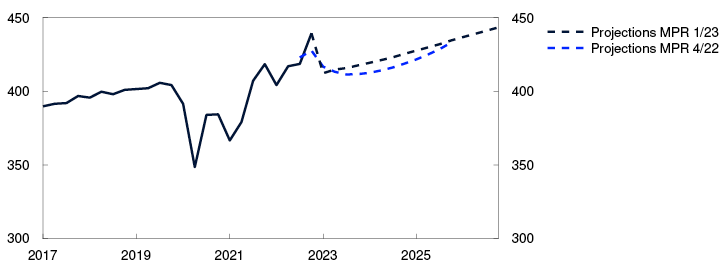
Given prospects for weak real wage growth and higher interest expenses, a decline in real disposable income of almost 2% is projected for 2023. In the projections, household consumption falls by 1.1% in 2023 on the back of weaker purchasing power. Goods consumption shows the largest decline, while services consumption rises slightly through the year. Households continue to draw on accumulated savings in 2023 before saving picks up gradually (Chart 3.5).
Household saving ratio excluding dividends. Percent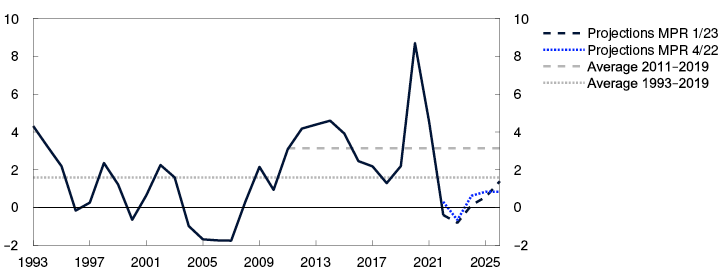
High real wage growth pushes up real household disposable income in the years ahead. Higher interest rate costs curb the rise in disposable income until 2026. The projections for household consumption have been revised up as real disposable income is now set to remain higher than previously projected.
Lower house prices in 2023
House prices have edged up over winter after having fallen through autumn. Turnover in the market for existing homes has been sustained, while the number of homes listed for sale has declined slightly. House prices have been higher than projected. A strong labour market has likely contributed to underpinning housing demand. In addition, a softening of debt-servicing capacity requirements from 1 January 2023 may have had a larger impact on house prices than assumed.
Owing to higher lending rates and a large stock of unsold homes, house prices are expected to fall in 2023 (Chart 3.6). House prices are projected to fall by 4% from their current level over the period to 2023 Q4 but will still be over 12% higher than prior to the pandemic. From the start of 2024, house prices are expected to rebound as residential mortgage rates stabilise and decline further out. A fairly low level of residential construction is pulling in the same direction. The house price projections for the coming years are slightly lower than in the December Report, primarily because the residential mortgage rate is now projected to be higher than in December.
Housing investment and real house prices. Annual change. Percent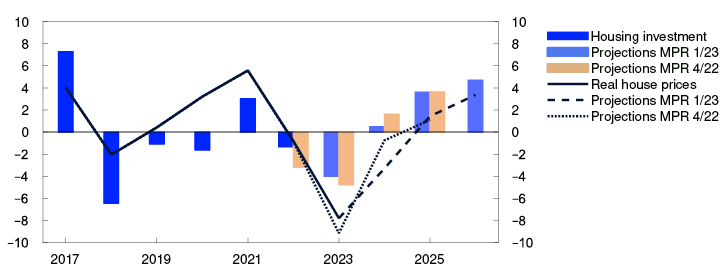
Falling house prices and continued high construction costs have contributed to reducing housing investment. In 2022, housing investment fell by 1.3%. The decline was somewhat less pronounced than projected in the December Report. Housing investment is expected to continue to fall in 2023 on the back of lower house prices and very low new home sales. Further out, housing investment is projected to pick up again. Household credit growth is expected to continue to drift down ahead, reflecting weaker housing market developments and higher lending rates.
Strong business investment
Mainland business investment increased substantially in 2022, primarily owing to substantial service sector investment. Business investment as a share of mainland GDP is now at its highest level since before the 2008 financial crisis.
Regional Network contacts expect investment in retail trade and other services to fall in 2023 and then level off in 2024. Prospects for substantial investments related to climate transition push up investment in manufacturing and power supply ahead (Chart 3.7). Overall, mainland business investment is projected to increase further throughout the projection period.
Business investment in mainland Norway. Annual change. Contribution to annual change. Percentage points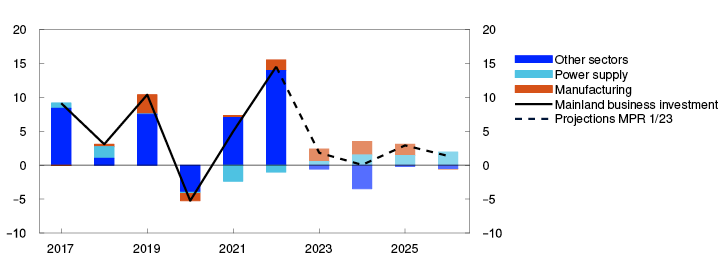
Petroleum investment fell by more than 10% between 2019 and 2022, reflecting the completion of various large development projects at the same time as the number of development starts was relatively low. However, oil companies submitted a number of development plans towards the end of 2022. Oil and gas investment is therefore expected to rise significantly until the mid-2020s (Chart 3.8). However, the projected rise is weaker than in the December Report, owing to the fall in oil and gas futures prices since December, and also because the latest investment intentions survey indicates that investment will be lower in 2024 than previously anticipated.
Petroleum investment. Constant 2023 prices. In billions of NOK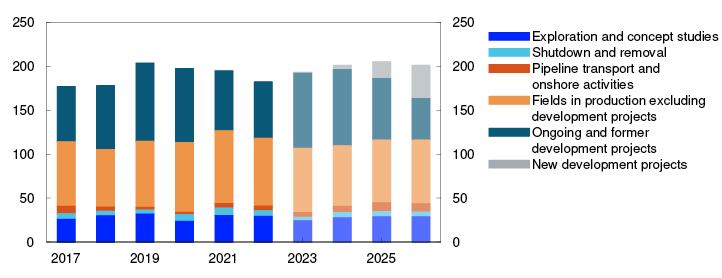
Exports continue to rise
Mainland exports increased substantially in 2022, driven by a normalisation of travel activity and global petroleum investment after the pandemic. The upswing in the global petroleum industry is expected to provide additional impetus to exports in 2023, despite weak growth prospects among Norway’s trading partners. Further ahead, stronger growth abroad, a weak krone and battery cell exports are expected to lift exports. Exports are projected to remain higher than in the December Report, primarily reflecting higher projections for global activity and a weaker krone than previously assumed.
The normalisation of travel habits after the pandemic also boosted imports in 2022. In addition, the extraordinary jump in car sales pushed up imports towards the end of 2022. A drop in car sales is expected to push down imports in 2023 Q1, followed by a gradual rise in imports in pace with activity in the Norwegian economy.
Stronger growth in public demand
High cost inflation likely dampened public demand through 2022, and demand was broadly unchanged from 2021. As price and wage inflation has been signficantly higher than assumed in the central government budget for 2023, the Government has announced that allocation increases will be proposed in connection with the Revised National Budget. The Government has also announced higher allocations to households, and increased support to Ukraine. This will add to the structural non-oil deficit.
Growth in public demand is expected to be higher in 2023 (Chart 3.9). Owing to weaker cyclical developments, growth in public demand is assumed to continue in the years ahead. The projections for public demand are revised up from December.
Public demand. Constant 2019 prices. Seasonally adjusted. In billions of NOK
The projections are uncertain
The projections for the Norwegian economy are uncertain. There are wide variations among Norges Bank’s Regional Network contacts concerning their view of the growth outlook ahead, making it difficult to interpret the overall growth outlook. There is also considerable uncertainty related to households’ response to high inflation and higher interest rates. Monetary policy operates with a lag, and the extent to which households will draw on savings when their purchasing power declines is unclear. Consumption may prove higher than projected if households save a smaller share of their income than assumed. On the other hand, there is a risk of increased turbulence in international banking markets and tighter financial conditions, which could lead to lower-than-projected investment.
SMART – System for Model Analysis in Real Time
Norges Bank has developed a new platform for forecasting models: the System for Model Analysis in Real Time (SMART). In SMART, forecasts from a broad set of empirical models are averaged based on their historical forecasting properties. The SMART forecasts for both CPI-ATE inflation and GDP are higher than in the December Report.
The economics literature shows that averaged forecasts from several models is often more accurate than forecasts from individual models.1 In SMART, we average information from many models for CPI-ATE inflation and mainland GDP based on how well the models have previously forecast economic developments.
In SMART, the models are estimated on real-time data. That is, the system only uses information that was available when the forecast was made. SMART builds on our old System for Averaging short-term Models (SAM), but includes more explanatory variables, more model types and also provides forecasts of both quarterly and monthly data, in addition to subcomponents of the CPI-ATE and GDP.
Evaluated over the past 15 years, SMART forecasts are more accurate than the SAM system and about as accurate as Norges Bank’s Monetary Policy Report projections (Table 3.A). See Norges Bank Staff Memo 6/23, “A SMARTer way to forecast” for further details on SMART.2
Table 3.A RMSE1. Four-quarter change. Percent 2010–2019
|
SMART Prices |
MPR |
SAM |
SMART GDP |
MPR |
SAM |
|
|
t+1 |
0.10 |
0.10 |
0.10 |
0.58 |
0.55 |
0.58 |
|
t+2 |
0.29 |
0.31 |
0.32 |
0.55 |
0.50 |
0.59 |
|
t+3 |
0.40 |
0.42 |
0.48 |
0.60 |
0.64 |
0.71 |
|
t+4 |
0.54 |
0.55 |
0.61 |
0.69 |
0.77 |
0.84 |
1 Root mean square error (RMSE) is a measure of the mean forecasting error over time. Values near zero indicate accurate forecasts.
The SMART mainland GDP forecasts are higher than in the December Report (right panel in Chart 3.A). This reflects higher growth in 2022 Q4 than in Q3 and a slightly brighter outlook among Regional Network enterprises than in autumn 2022. The forecasts continue to imply that growth will slow from 2022 Q4.
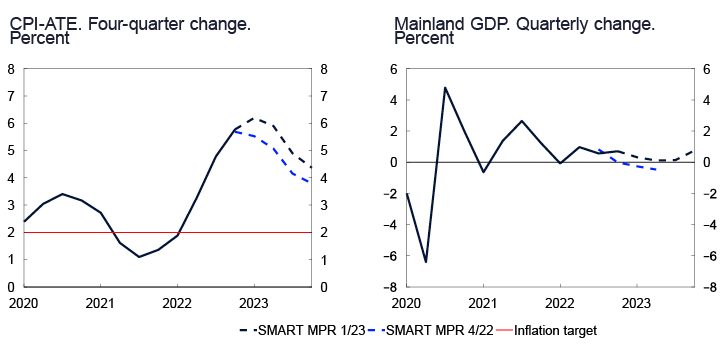
The SMART forecasts imply that inflation measured as the four-quarter change in the CPI-ATE will peak at 6.2% in 2023 Q1, declining thereafter (left panel in Chart 3.A). The SMART forecasts are up to 0.8 percentage point higher than at the time of the December Report. The upward revision reflects the fact that actual inflation has been higher than the SMART forecasts from the December Report, that the krone has depreciated considerably and wage growth was higher in 2022 now than projected earlier. The SMART forecasts for the rise in prices for both imported goods and domestically produced goods and services are higher than at the time of the December Report.
1 See eg Timmermann, A., (2006) “Forecast combinations”. In: Elliott, G., C. W. J. Granger and A. Timmermann (Eds.) Handbook of Economic Forecasting. Volume 1. Elsevier, pp 136–196.
2 Bowe, F., I.N. Friis, A. Loneland, E. Njølstad, S.S. Meyer, K. Paulsen and Ø. Robstad (2023) “A SMARTer way to forecast”. Norges Bank Staff Memo 6/23. Forthcoming.
3 Period: 2020 Q1 – 2023 Q4. CPI-ATE: CPI adjusted for tax changes and excluding energy products. Projections from 2023. The SMART modelling system for short-term projections is based on historical relationships. It averages empirical models based on previous forecasting properties.
1 Period: November 2022 and February 2023. Growth current quarter and expected growth next quarter.
2 Period: 2022 Q1 – 2023 Q2. Projections from Norges Bank’s forecasting system SMART.
3 Period: 2017 – 2026. Projections from 2023. Petroleum investment includes investment in international shipping.
4 Period: 2017 Q1 – 2026 Q4. Projections from 2022 Q4 for MPR 4/22 and 2023 Q1 for MPR 1/23.
5 Period: 1993 – 2026. Projections from 2022 for MPR 4/22 and from 2023 for MPR 1/23.
6 Period: 2017 – 2026. Projections from 2022 for MPR 4/22 and from 2023 for MPR 1/23. Real house price inflation is nominal house price inflation deflated by the CPI.
7 Period: 2017 – 2026. Projections from 2023.
8 Period: 2017 – 2026. Projections from 2023. Data for 2017–2022 from Statistics Norway’s investment intentions survey, deflated by the price index for petroleum investment in the national accounts. The price index is projected to increase by 3% in 2023 and by 2% in 2024.
9 Period: 2017 Q1 – 2026 Q4. Projections from 2022 for MPR 4/22 and 2023 for MPR 1/23.
3.2 Labour market
Continued tight labour market
Unemployment is low, and employment is high. The employment rate is at its highest level in more than ten years (Chart 3.10). Employment rose markedly through 2022, with close to 70 000 more people employed in 2022 Q4 than one year earlier. Employment has been higher than projected in the December Report.
Employed as a share of the population aged 15–74. Percent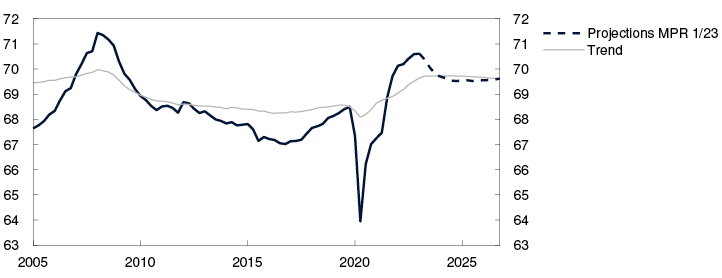
The rise in employment through 2022 was higher than implied by the fall in unemployment, suggesting that the supply of labour has increased. The labour force normally expands when job prospects improve. However, the current rise likely reflects a sustained increase in the labour supply from some demographic groups (see "Capacity utilisation is declining"). The number of temporary foreign workers edged down in Q4.
At the end of February, 54 700 persons were registered as fully unemployed. Adjusted for normal seasonal variations, this accounts for 1.7% of the labour force. Unemployment was thus unchanged from January to February, and slightly lower than projected in the December Report.
There are nevertheless signs that unemployment will rise somewhat ahead. Since before summer 2022, the ratio of job vacancies to short-term unemployed has fallen, and the unemployment trend measured by Statistics Norway’s Labour Force Survey (LFS) has edged up. In recent months, the number of new job seekers has also picked up. At the same time, notifications of layoffs and redundancies to NAV have increased somewhat.
Labour shortages have eased
Labour demand is still high. The number of job vacancies in Statistics Norway’s sample vacancy survey has not been higher since the survey started in 2010 (Chart 3.11). On the other hand, NAV statistics indicate that the number of new job vacancies has declined somewhat in recent months. The difference between the two statistics is greater than normal, but the decline in new vacancies may indicate that labour demand is declining somewhat.
Number of job vacancies in thousands
In addition, fewer Regional Network contacts report labour shortages. The share reporting labour constraints has fallen from about 45% in spring 2022 to just below 30% in 2023 Q1. The decline has been particularly marked in services and construction. Nevertheless, the share of enterprises reporting labour constraints is higher than the average since this was first measured in 2005.
Unemployment projected to edge up
Register-based data indicate that employment rose further in January. According to Regional Network contacts, employment growth is slowing in 2023 Q1 compared with the previous quarter. The level of employment is projected to decline somewhat ahead. This reflects the Bank’s assessment that the Norwegian economy has reached a cyclical peak and capacity utilisation is declining. This implies that employment growth will soften in the near term and that the number of employed will begin to decline further out (Chart 3.12). As economic activity picks up again, employment is also expected to rise from the end of 2024.
Employed. In thousands. Seasonally adjusted
In December and January, the number of temporary foreign workers appears to have risen and is projected to increase gradually in the coming years. The war in Ukraine has led to a rise in the number of refugee arrivals in Norway and many of them will eventually enter the Norwegian labour market.
In the projections, the unemployment rate rises gradually ahead and peaks at around 2.3% in 2024 (Chart 3.13). This is close to the unemployment levels prevailing during the last few years prior to the pandemic. Unemployment is also set to remain close to this level in the subsequent years. The unemployment projections are slightly lower than in the December Report.
Registered unemployed as share of the labour force. Seasonally adjusted. Percent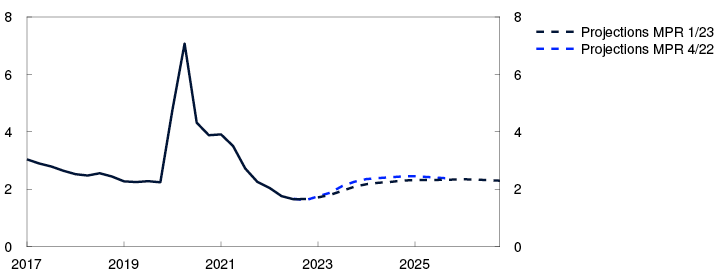
Capacity utilisation is declining
Output is assessed to be above potential, but the output gap is now declining. Output is projected to fall through 2023 and remain somewhat below potential in the following years. In 2026, output is projected to be close to potential.
The output gap is a measure of the difference between actual output (GDP) and potential output. Potential output is determined by productivity growth and potential employment. Potential employment may be interpreted as the highest level of employment that can be maintained over time without driving up wage growth and pushing inflation above the inflation target. Potential output and the output gap cannot be observed and must therefore be estimated. The Bank’s output gap estimates are based on an overall assessment of various indicators and models. Particular weight is given to labour market developments.
Output is assessed to have reached potential in autumn 2021 and continued rising into 2022, remaining high through the year. In this period, unemployment remained low and wage growth was high. Capacity utilisation does not appear to have declined towards year-end, as previously assumed. Our overall assessment is that the output gap in 2022 Q4 was broadly unchanged from Q3.
Through the latter half of 2022, output and employment in the Norwegian economy rose, and developments were stronger than expected. In the same period, Regional Network enterprises reported a marked decline in capacity utilisation and increased labour supply. Lower capacity utilisation in the network normally coincides with weaker employment growth (Chart 3.B). Recently, employment has continued to rise and has been higher than expected, while network contacts have reported that labour shortages have eased. Some of the rise in employment over the past year is probably due to a normal increase in the labour supply when output is above potential. Nevertheless, employment and the labour supply have increased considerably more than implied by the historical relationship between capacity utilisation and the labour supply. For this Report, we have therefore revised up potential employment. Over the past 20 years, the employment rate among immigrants in particular has increased and showed a markedly rising trend (Chart 3.C). The increase in immigrants’ labour market participation rate over time may have lifted potential employment in Norway.
Labour shortages and employment gap. Percent
Share of the population. Percent
Higher potential employment also entails an upward revision of the estimate of potential output. Higher potential output now implies a slightly lower output gap estimate for 2022 than in the December Report. The Bank’s overall assessment is that the output gap in 2022 Q3 and Q4 was just below 2%. The modelling system, which is based on information about such variables as mainland GDP, unemployment, wage growth and domestic inflation, has estimated lower capacity utilisation than the Bank’s estimate. This is because the Bank’s estimates have given considerable weight to the Regional Network capacity utilisation indicators. Towards the end of 2022, the gap between the Bank’s estimate and the modelling system has narrowed (Chart 3.D).
Percent
So far in Q1, there are a number of signs that the output gap is declining. The number of Regional Network enterprises reporting lower capacity utilisation has risen further and fewer are experiencing labour shortages. In addition, the ratio of job vacancies to short-term unemployed has edged lower.
The output gap is expected to decline gradually and bottom out at negative 0.5% during 2025. Demand and output are projected to be lower in the coming year, primarily owing to an expected decline in household consumption. At year-end 2026, output is expected to be close to potential. The projections for capacity utilisation are a little higher than in the December Report throughout the projection period.
Owing to the upward revision of potential employment, growth in potential output is projected to be higher in 2022 and 2023 than in the December Report (Table 3.B). The projection for trend productivity growth is a bit higher overall than assumed earlier, which reflects stronger-than-expected developments in productivity. For the years ahead, the projection for growth in potential output is little changed.
Table 3.B Output and potential output
|
Change from projections in Monetary Policy Report 4/22 in brackets |
Percentage change from previous year |
||||||
|
1995–2009 |
2010–2021 |
2022 |
2023 |
2024 |
2025 |
2026 |
|
|
GDP, mainland Norway |
3.1 |
1.8 |
3.7 (0.1) |
1.1 (1.3) |
0.5 (0.3) |
1.1 (-0.3) |
1.3 |
|
Potential output |
3.1 |
1.8 |
1.5 (0.3) |
2.3 (0.7) |
1.3 (0.1) |
1.2 (0.0) |
1.2 |
|
Potential employment |
0.8 |
1.0 |
1.8 (0.4) |
1.1 (0.4) |
0.6 (0.0) |
0.6 (0.0) |
0.6 |
|
Trend productivity |
2.3 |
0.8 |
-0.3 (-0.1) |
1.2 (0.3) |
0.7 (0.1) |
0.6 (0.0) |
0.6 |
1 Period: 2006 Q1 – 2023 Q1. Share of Regional Network contacts citing shortage of labour as a constraint on output. Only contacts that have specified full capacity utilisation have been asked about labour supply, but the series shows the share of all contacts in the interview period. The employment gap is defined as the gap between actual employment and potential employment in percentage terms.
2 Period: 2001 – 2022.
3 Period: 2005 Q2 – 2023 Q2. Regional Network is the average of the capacity utilisation indicators in the Regional Network after they have been converted to output gaps using a simple model estimation. The modelling system for the output gap includes information about GDP, employment, unemployment, wage growth, inflation, house prices and credit. For a more detailed description of the models, see Furlanetto et al. (2023). Norges Bank Output Gap Estimates: Forecasting Properties, Reliability, Cyclical Sensitivity and Hysteresis. Oxford Bulletin of Economics and Statistics, 85.1, 238–267
1 Period: 2005 Q1 – 2026 Q4. Projections from 2023 Q1.
2 Period: Statistics Norway: 2010 Q1 – 2022 Q4. NAV: January 2018 – February 2023. As a result of missing data in NAV’s statistics at the start of 2018, only data since January 2018 are shown.
3 Period: 2017 Q1 – 2026 Q4. Projections from 2022 Q4 for MPR 4/22 and from 2023 Q1 for MPR 1/23.
4 Period: 2017 Q1 – 2026 Q4. Projections from 2022 Q4 for MPR 4/22 and 2023 Q1 for MPR 1/23.
3.2 Labour market
Continued tight labour market
Unemployment is low, and employment is high. The employment rate is at its highest level in more than ten years (Chart 3.10). Employment rose markedly through 2022, with close to 70 000 more people employed in 2022 Q4 than one year earlier. Employment has been higher than projected in the December Report.
Employed as a share of the population aged 15–74. Percent
The rise in employment through 2022 was higher than implied by the fall in unemployment, suggesting that the supply of labour has increased. The labour force normally expands when job prospects improve. However, the current rise likely reflects a sustained increase in the labour supply from some demographic groups (see "Capacity utilisation is declining"). The number of temporary foreign workers edged down in Q4.
At the end of February, 54 700 persons were registered as fully unemployed. Adjusted for normal seasonal variations, this accounts for 1.7% of the labour force. Unemployment was thus unchanged from January to February, and slightly lower than projected in the December Report.
There are nevertheless signs that unemployment will rise somewhat ahead. Since before summer 2022, the ratio of job vacancies to short-term unemployed has fallen, and the unemployment trend measured by Statistics Norway’s Labour Force Survey (LFS) has edged up. In recent months, the number of new job seekers has also picked up. At the same time, notifications of layoffs and redundancies to NAV have increased somewhat.
Labour shortages have eased
Labour demand is still high. The number of job vacancies in Statistics Norway’s sample vacancy survey has not been higher since the survey started in 2010 (Chart 3.11). On the other hand, NAV statistics indicate that the number of new job vacancies has declined somewhat in recent months. The difference between the two statistics is greater than normal, but the decline in new vacancies may indicate that labour demand is declining somewhat.
Number of job vacancies in thousands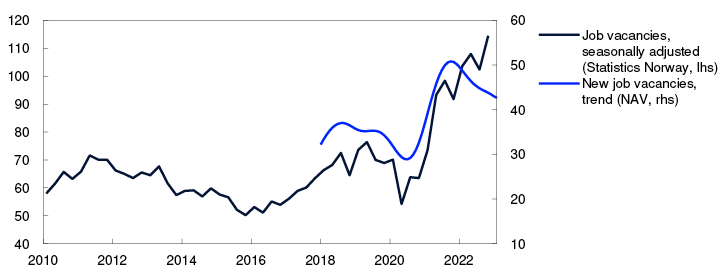
In addition, fewer Regional Network contacts report labour shortages. The share reporting labour constraints has fallen from about 45% in spring 2022 to just below 30% in 2023 Q1. The decline has been particularly marked in services and construction. Nevertheless, the share of enterprises reporting labour constraints is higher than the average since this was first measured in 2005.
Unemployment projected to edge up
Register-based data indicate that employment rose further in January. According to Regional Network contacts, employment growth is slowing in 2023 Q1 compared with the previous quarter. The level of employment is projected to decline somewhat ahead. This reflects the Bank’s assessment that the Norwegian economy has reached a cyclical peak and capacity utilisation is declining. This implies that employment growth will soften in the near term and that the number of employed will begin to decline further out (Chart 3.12). As economic activity picks up again, employment is also expected to rise from the end of 2024.
Employed. In thousands. Seasonally adjusted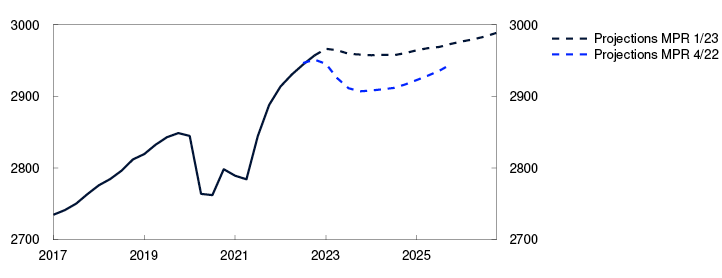
In December and January, the number of temporary foreign workers appears to have risen and is projected to increase gradually in the coming years. The war in Ukraine has led to a rise in the number of refugee arrivals in Norway and many of them will eventually enter the Norwegian labour market.
In the projections, the unemployment rate rises gradually ahead and peaks at around 2.3% in 2024 (Chart 3.13). This is close to the unemployment levels prevailing during the last few years prior to the pandemic. Unemployment is also set to remain close to this level in the subsequent years. The unemployment projections are slightly lower than in the December Report.
Registered unemployed as share of the labour force. Seasonally adjusted. Percent
Capacity utilisation is declining
Output is assessed to be above potential, but the output gap is now declining. Output is projected to fall through 2023 and remain somewhat below potential in the following years. In 2026, output is projected to be close to potential.
The output gap is a measure of the difference between actual output (GDP) and potential output. Potential output is determined by productivity growth and potential employment. Potential employment may be interpreted as the highest level of employment that can be maintained over time without driving up wage growth and pushing inflation above the inflation target. Potential output and the output gap cannot be observed and must therefore be estimated. The Bank’s output gap estimates are based on an overall assessment of various indicators and models. Particular weight is given to labour market developments.
Output is assessed to have reached potential in autumn 2021 and continued rising into 2022, remaining high through the year. In this period, unemployment remained low and wage growth was high. Capacity utilisation does not appear to have declined towards year-end, as previously assumed. Our overall assessment is that the output gap in 2022 Q4 was broadly unchanged from Q3.
Through the latter half of 2022, output and employment in the Norwegian economy rose, and developments were stronger than expected. In the same period, Regional Network enterprises reported a marked decline in capacity utilisation and increased labour supply. Lower capacity utilisation in the network normally coincides with weaker employment growth (Chart 3.B). Recently, employment has continued to rise and has been higher than expected, while network contacts have reported that labour shortages have eased. Some of the rise in employment over the past year is probably due to a normal increase in the labour supply when output is above potential. Nevertheless, employment and the labour supply have increased considerably more than implied by the historical relationship between capacity utilisation and the labour supply. For this Report, we have therefore revised up potential employment. Over the past 20 years, the employment rate among immigrants in particular has increased and showed a markedly rising trend (Chart 3.C). The increase in immigrants’ labour market participation rate over time may have lifted potential employment in Norway.
Labour shortages and employment gap. Percent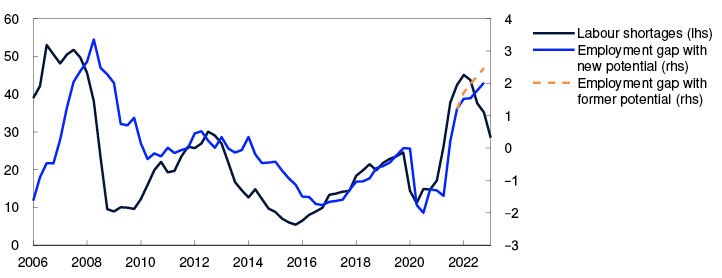
Share of the population. Percent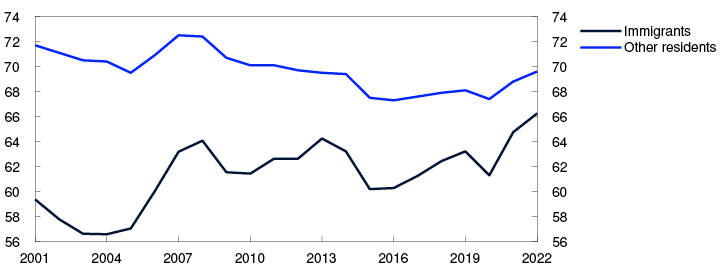
Higher potential employment also entails an upward revision of the estimate of potential output. Higher potential output now implies a slightly lower output gap estimate for 2022 than in the December Report. The Bank’s overall assessment is that the output gap in 2022 Q3 and Q4 was just below 2%. The modelling system, which is based on information about such variables as mainland GDP, unemployment, wage growth and domestic inflation, has estimated lower capacity utilisation than the Bank’s estimate. This is because the Bank’s estimates have given considerable weight to the Regional Network capacity utilisation indicators. Towards the end of 2022, the gap between the Bank’s estimate and the modelling system has narrowed (Chart 3.D).
Percent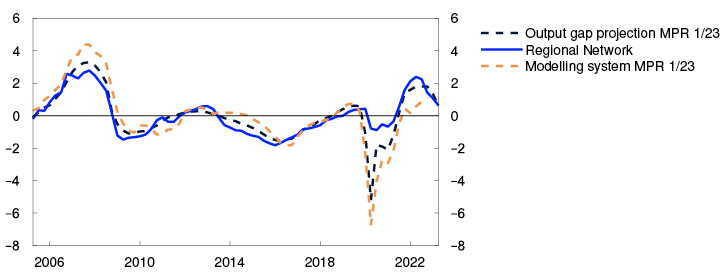
So far in Q1, there are a number of signs that the output gap is declining. The number of Regional Network enterprises reporting lower capacity utilisation has risen further and fewer are experiencing labour shortages. In addition, the ratio of job vacancies to short-term unemployed has edged lower.
The output gap is expected to decline gradually and bottom out at negative 0.5% during 2025. Demand and output are projected to be lower in the coming year, primarily owing to an expected decline in household consumption. At year-end 2026, output is expected to be close to potential. The projections for capacity utilisation are a little higher than in the December Report throughout the projection period.
Owing to the upward revision of potential employment, growth in potential output is projected to be higher in 2022 and 2023 than in the December Report (Table 3.B). The projection for trend productivity growth is a bit higher overall than assumed earlier, which reflects stronger-than-expected developments in productivity. For the years ahead, the projection for growth in potential output is little changed.
Table 3.B Output and potential output
|
Change from projections in Monetary Policy Report 4/22 in brackets |
Percentage change from previous year |
||||||
|
1995–2009 |
2010–2021 |
2022 |
2023 |
2024 |
2025 |
2026 |
|
|
GDP, mainland Norway |
3.1 |
1.8 |
3.7 (0.1) |
1.1 (1.3) |
0.5 (0.3) |
1.1 (-0.3) |
1.3 |
|
Potential output |
3.1 |
1.8 |
1.5 (0.3) |
2.3 (0.7) |
1.3 (0.1) |
1.2 (0.0) |
1.2 |
|
Potential employment |
0.8 |
1.0 |
1.8 (0.4) |
1.1 (0.4) |
0.6 (0.0) |
0.6 (0.0) |
0.6 |
|
Trend productivity |
2.3 |
0.8 |
-0.3 (-0.1) |
1.2 (0.3) |
0.7 (0.1) |
0.6 (0.0) |
0.6 |
1 Period: 2006 Q1 – 2023 Q1. Share of Regional Network contacts citing shortage of labour as a constraint on output. Only contacts that have specified full capacity utilisation have been asked about labour supply, but the series shows the share of all contacts in the interview period. The employment gap is defined as the gap between actual employment and potential employment in percentage terms.
2 Period: 2001 – 2022.
3 Period: 2005 Q2 – 2023 Q2. Regional Network is the average of the capacity utilisation indicators in the Regional Network after they have been converted to output gaps using a simple model estimation. The modelling system for the output gap includes information about GDP, employment, unemployment, wage growth, inflation, house prices and credit. For a more detailed description of the models, see Furlanetto et al. (2023). Norges Bank Output Gap Estimates: Forecasting Properties, Reliability, Cyclical Sensitivity and Hysteresis. Oxford Bulletin of Economics and Statistics, 85.1, 238–267
1 Period: 2005 Q1 – 2026 Q4. Projections from 2023 Q1.
2 Period: Statistics Norway: 2010 Q1 – 2022 Q4. NAV: January 2018 – February 2023. As a result of missing data in NAV’s statistics at the start of 2018, only data since January 2018 are shown.
3 Period: 2017 Q1 – 2026 Q4. Projections from 2022 Q4 for MPR 4/22 and from 2023 Q1 for MPR 1/23.
4 Period: 2017 Q1 – 2026 Q4. Projections from 2022 Q4 for MPR 4/22 and 2023 Q1 for MPR 1/23.
3.3 Prices and wages
Wage growth has been higher than expected
A tight labour market and solid earnings in some business sectors pushed up wage growth in 2022. According to national accounts figures, annual wage growth was 4.3%, 0.4 percentage point higher than projected in the December Report. The register-based wage statistics underlying the December projections indicated considerably lower wage growth. Wage growth was the highest since 2011, partly owing to large bonus payments.
According to both Norges Bank’s Regional Network survey and the Expectations Survey, wage growth is expected to increase further in 2023, and to turn out higher than foreseen in 2022 Q4 (Chart 3.14). According to the Expectations Survey, employee organisations expect a rise in real wages in 2023, while employer organisations expect a decline.
Annual wage growth. Percent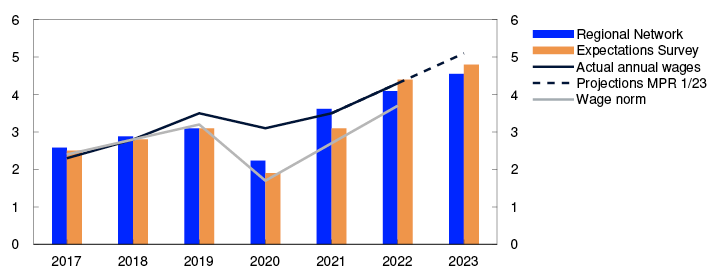
Norway’s terms of trade improved considerably in 2022. Wage capacity has increased in some manufacturing segments. Survey responses from businesses indicate a slightly improved profitability outlook (Chart 3.15). A weaker krone inceases manufacturing’s ability to pay wages. Together with prospects for high inflation and a persistently tight labour market, this will likely lead to a further rise in wage growth in 2023. Wage growth is projected to rise to 5.1% in 2023.
Change in operating margins according to the Regional Network and the Expectations Survey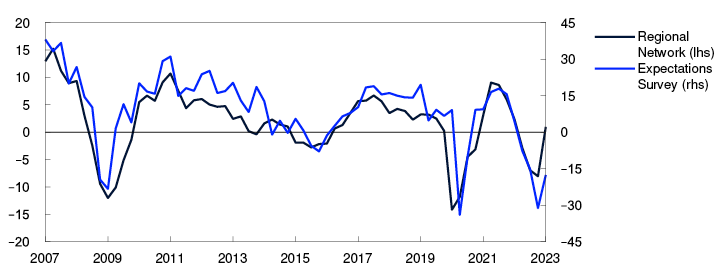
The strong terms-of-trade gains in 2022 are likely to push up wage growth somewhat in the years ahead too. Higher productivity growth ahead will also push up wage growth. Nevertheless, wage growth is expected to decline gradually from 2024 owing to lower inflation and an easing of labour market pressures further out. The wage growth projections are higher than in the December Report.
Inflation is high
The consumer price index (CPI) was 5.8% higher in 2022 than in 2021, while the CPI adjusted for tax changes and excluding energy products (CPI-ATE) was 3.9% higher than in the previous year. This was markedly higher than the inflation target of 2%.
Inflation picked up through 2022 and turned out to be higher than projected in Norges Bank’s monetary policy reports, reflecting elevated energy and non-energy commodity prices, strong external price pressures, high demand and little spare capacity in the Norwegian economy (see "Why is inflation high?").
Recently, services prices have become an increasingly prominent driver of inflation (Chart 3.16). The strong rise in intermediate goods costs is beginning to spill over into services prices. In addition, high capacity utilisation through 2022 is likely contributing to the rise in services prices.
CPI. Twelve-month change. Percent. CPI subcomponents. Percentage points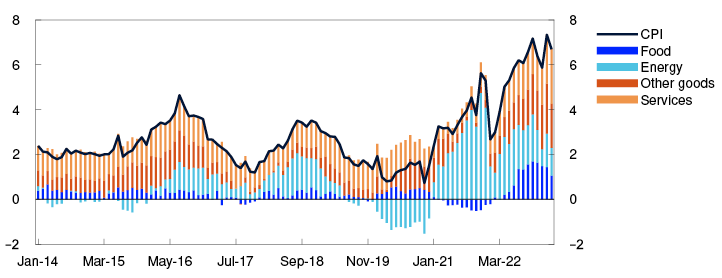
Price inflation has moderated slightly since autumn. In February, the CPI was 6.3% higher than in the same month one year earlier, lower than projected in the December Report. The 12-month rise in the CPI-ATE was 5.9%, compared with 6.4% in January. In February, CPI-ATE inflation was approximately as projected in the December Report. Other underlying inflation indicators fell a little in February (Chart 3.17).
CPI and underlying inflation indicators. Twelve-month change. Percent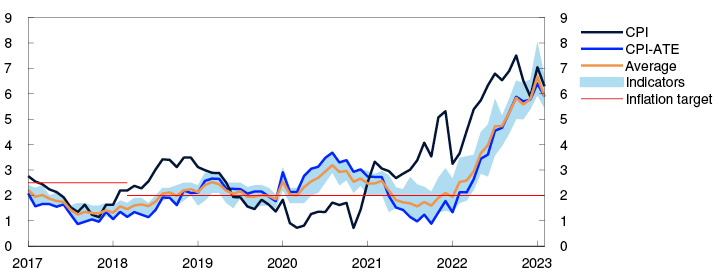
At the same time, inflation appears to have moderated a little in recent months. Norges Bank’s measure of inflation is normally the 12-month change in the CPI, with equal weight given to the change in each of the past 12 months. This strips out seasonal variations and noise from growth rates, but at the same time results in a slow change in the measured rate of inflation. A more up-to-date picture of recent inflation developments is obtained if more weight is given instead to inflation over the past few months than inflation further back. Measured by this method, CPI-ATE inflation is high, but the rate has moderated a little more than measured by the 12-month rate (Chart 3.18).
CPI-ATE. Annualised monthly change. Percent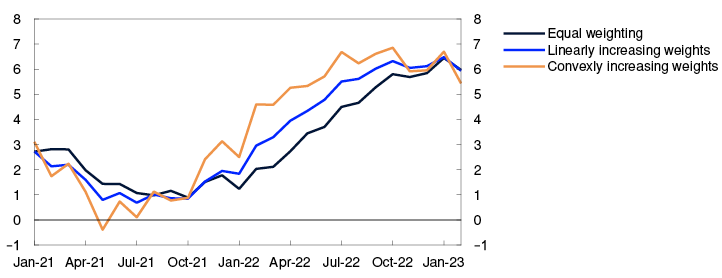
Decline in energy prices and external price impulses, but weak krone
Over autumn 2022, electricity prices surged. Since December, electricity prices have declined, and futures prices have fallen. The projection for CPI inflation in 2023 has therefore been revised down a bit, even though the electricity bill support scheme for households is dampening the effect of changes in electricity prices on the CPI. The Government has proposed expanding the scheme somewhat. It is assumed that the scheme will be maintained throughout the projection period.
According to Norges Bank’s Regional Network, enterprises will continue raising their selling prices ahead, given the high costs of electricity. However, as electricity costs have fallen since the turn of the year, the effect of higher electricity costs on selling prices is not likely to persist as long as anticipated earlier (see box in Monetary Policy Report 3/22).
Freight rates have fallen towards more normal levels and energy and non-energy commodity prices have declined. Weaker external inflationary pressures will likely push down the rise in prices for imported goods and services ahead (Chart 3.19).
IPK with freight rates in NOK and foreign currency terms. Annual change. Percentage points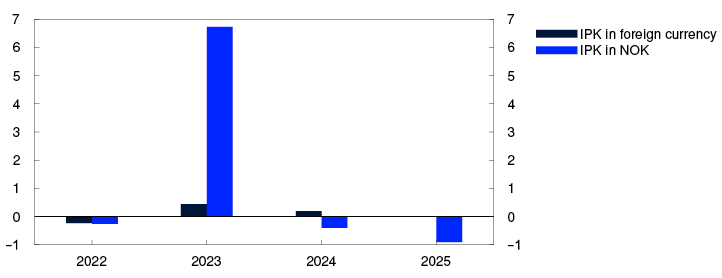
At the same time, the krone has depreciated considerably. A weaker krone increases the cost of imported goods. Overall, imported inflation is projected to recede but will be higher this year than projected in December.
Domestic price pressures push up inflation
Higher growth in labour costs suggests that the rise in prices for domestically produced goods and services will likely remain high in the years ahead. In the projections, lower energy prices dampen inflation, while the rise in prices for domestically produced goods and services also moderates on the back of lower capacity utilisation (Chart 3.20). The projections of inflation are slightly higher than in the December Report, given that capacity utilisation and wage growth are now expected to be higher.
Domestically produced goods and services and imported goods in the CPI-ATE. Four-quarter change. Percent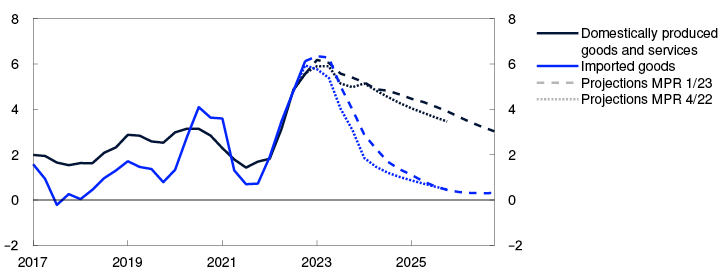
Since the December Report, the inflation projections from the model system SMART have been revised up partly due to new information (Chart 3.21). SMART indicates that 12-month CPI-ATE inflation moves down from 2023 Q2 (see "SMART – System for Model Analysis in Real Time"). The Bank’s projections are slightly higher than the model forecasts because firms are expected to continue raising their selling prices given the high energy prices in 2022.
CPI-ATE. Four-quarter change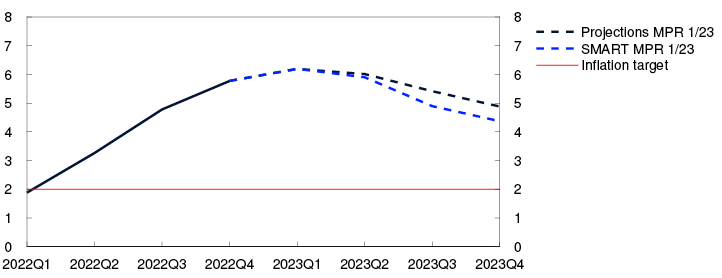
In the projections, four-quarter CPI-ATE inflation reaches 6.2% in 2023 Q1, moderating thereafter. The projections for CPI-ATE inflation are higher than in the December Report. CPI inflation edges down ahead. Energy prices have declined faster than expected earlier and will likely lead to slower inflation in 2023 than projected in the December Report. Inflation, as measured by both the CPI and the CPI-ATE, is projected at close to 2% at the end of 2026.
In our projections, real wages rise by 0.2% in 2023, following a decline of 1.5% in 2022 (Chart 3.22). The projection for real wage growth in 2023 is somewhat higher than in the December Report. Real wage growth is then projected to rise gradually to just above 1%.
Annual change. Percent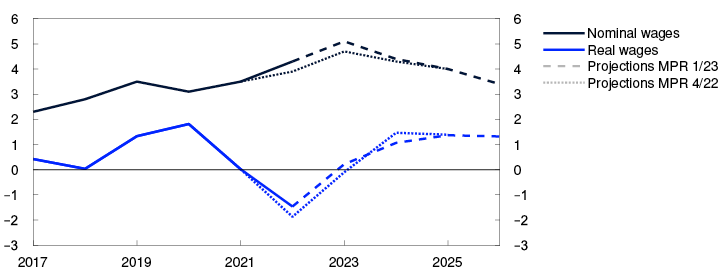
Uncertainty is greater when inflation is high
There is considerable uncertainty related to price and wage inflation ahead. According to Norges Bank’s Expectations Survey for 2023 Q1, inflation expectations further out have continued to increase and are above the 2% inflation target, both two and five years ahead (Chart 3.23). If inflation expectations remain high, it could take longer for inflationary pressures to recede than currently envisaged.
Inflation expectations further out. Percent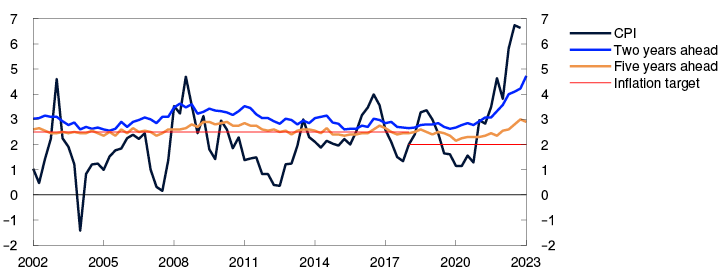
In addition, the experience of the 1980s shows that a rise in prices for some goods spreads more easily to other goods and services when inflation is high over some time (see box in Monetary Policy Report 4/22), which may sustain inflation longer than projected in this Report.
Price pressures have been unusually strong recently. The absence of historical comparisons makes it difficult to estimate the effect on consumer prices, even as some of these pressures are now receding. Freight rates, for example, have declined substantially, and energy prices have fallen more than expected. Such price pressures may also recede faster ahead than envisaged, which may push down imported inflation and contribute to a faster-than-projected decline in inflation.
The krone has depreciated significantly, and there is considerable uncertainty about the future path of the krone. If the krone remains weak, this could push up domestic inflation. A faster-than-projected appreciation will help bring inflation down faster than projected.
Solid profitability in some business sectors has pulled up wage growth. If profitability were to decline ahead, this could reduce firms’ ablity to pay wages and lead to lower wage growth. Bonus payments have risen rapidly over the past two years. Lower bonus payments ahead could result in weaker wage growth than currently projected.
1 Period: 2017 – 2023. Annual wages: Actual annual wages from Statistics Norway. Norges Bank’s projections for 2023. Expectations Survey: Social partners’ wage growth expectations for the current year as measured by Norges Bank’s Expectations Survey in Q4 each year. Regional Network: Expected annual wage growth for own business in current year as reported in Q4 each year. For 2023, expected wages from Q1 are used.
2 Period: 2007 Q1 – 2023 Q1. Regional Network: Change in operating margins current quarter compared with same period a year earlier. Percent. Expectations Survey: Profitability next 12 months. Share of enterprises that report prospects for improved profitability minus the share that report prospects for lower profitability.
3 Period: January 2014 – February 2023. In the statistics, some differences occur between the sum of the components and overall inflation.
4 Period: January 2017 – February 2023. CPI-ATE: CPI adjusted for tax changes and excluding energy products. Average: Average value of 12-month change for other underlying inflation indicators (CPIM, CPIXE, 20 percent trimmed mean, weighted median, CPI-XV and CPI-common) and CPI-ATE. Indicators: Highest and lowest 12-month change for other underlying inflation indicators.
5 Period: January 2021 – February 2023. “Equal weighting” corresponds to the ordinary 12-month change in the CPI-ATE, where all the previous 12 months are given equal weight. With weights increasing linearly and convexly, months further back in time will be given less weight than more recent months. This means that the indicators capture changes in the rate of increase in the CPI-ATE earlier than the conventional 12-month change. At the same time, they will be more volatile. Calculations follow Eeckhout (2023) “Instantaneous Inflation”.
6 Period: 2022 – 2025. Prices for imported consumer goods.
7 Period: 2017 Q1 – 2026 Q4. CPI-ATE: CPI adjusted for tax changes and excluding energy products. Projections from 2022 Q4 for MPR 4/22 and 2023 Q1 for MPR 1/23.
8 Period: 2022 Q1 – 2023 Q4. CPI-ATE: CPI adjusted for tax changes and excluding energy products. Projections from 2023 Q1. Our modelling system for short-term projections is based on historical relationships. It averages empirical models based on previous forecasting properties.
9 Period: 2017 – 2026. Projections from 2023 for MPR 1/23 and 2022 for MPR 4/22. Real wages: Nominal annual wage growth adjusted for CPI inflation.
10 Period: 2002 Q1 – 2023 Q1. Inflation expectations two years ahead are the average of expectations among households, business leaders, economists and social partners. Inflation expectations five years ahead are the average of expectations among economists and social partners.
Why is inflation high?
The analysis presented in this box shows that both supply and demand conditions have contributed to driving inflation up to a high level recently. The adverse supply shocks appear primarily to have come from abroad.
Over the past year, Norway and many of its trading partners have experienced a substantial increase in inflation. In order to project inflation developments ahead, it is essential to understand why inflation has increased. It will often be reasonable to assume that if the rise in inflation is driven only by supply shocks, inflation may moderate faster. For example, global supply chain disruptions have eased, and freight rates are back to close to their pre-pandemic levels. Electricity prices have recently fallen sharply and are expected to be lower ahead. In addition, a supply-driven increase in inflation may in itself restrain demand, which in turn may contribute to curbing inflation. The less persistent an increase in inflation is expected to be, the less the need will be to respond with monetary tightening. An increase in inflation that is also due to strong demand indicates that capacity utilisation is above a level consistent with low and stable inflation and that a more contractionary monetary policy will likely be needed to bring inflation back to the inflation target.
This box presents an analysis that seeks to isolate the inflationary effect of strong demand from the inflationary effect of supply shocks. We distinguish between external supply shocks, eg to global supply chains, and domestic supply factors such as electricity prices and firms’ price markups. The model uses historical correlations between GDP and inflation to interpret the increase in inflation over the past year. See box for a further description of the model.
About the model analysis
In order to decompose inflation, sign restrictions have been used in a structural VAR model (see Ramirez, Waggoner and Zha (2010)1 for a description of the method and Ascari et al (2023) for a similar application). Data for inflation (CPI-ATE), mainland GDP and imported inflation are used to identify three inflation drivers: demand, domestic supply and imported supply factors. Demand shocks are identified by their resulting in a rise both output and inflation, while supply shocks result in higher inflation and lower output. To distinguish domestic from global supply shocks, it is assumed that imported supply shocks have a more pronounced effect on import prices than on overall inflation. The model is estimated over the period 1993–2019 but is used to decompose inflation developments to 2022 Q4.
11 Rubio-Ramirez J.F , D.F. Waggonar, T.Zha (2010): “Structural Vector Autoregressions: Theory of Identification and Algorithms for Inference”, Review of Economic Studies, 77, pp 665–696.
According to the model, both Norwegian and global supply factors pushed up inflation following the coronavirus outbreak in 2020 (Chart 3.E), which likely reflects the economic lockdowns in Norway and other countries and which can be described as a negative supply shock. As economies gradually reopened, inflation moderated and the contribution from supply shocks declined. In 2021, domestic supply factors pushed down inflation, which likely reflected low electricity prices. Demand fell more than supply in response to the pandemic and contributed to keeping inflation low up to the beginning of 2022.
CPI-ATE. Four-quarter change. Decomposed change from 2019 Q3. Percentage points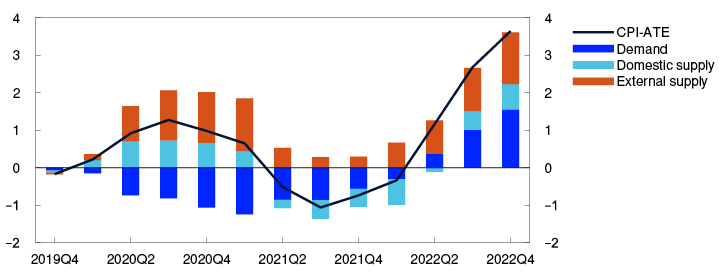
According to this analysis, the increase in inflation through 2022 was driven by a combination of supply and demand factors. This likely reflects the substantial rise in output and employment, despite large negative supply shocks. Similar analyses have been done for the euro area and the US, for example, and in these countries, too, findings show that strong demand was an important driver of the rise in inflation.2
The model presented in this box provides a simple, rough decomposition of inflation. A more complete description of the economy and inflation drivers requires a more complex model framework. In addition, the model exercise is based on historical relationships and assumes that the functioning of the economy is unchanged over time, also when interpreting recent developments. As always with model analyses, the results must be interpreted with caution and used as a supplement to other analyses of inflation developments.
1 Period: 2019 Q4 – 2022 Q4.
2 See Shapiro (2022): “How Much Do Supply and Demand Drive Inflation?”, FRBSF Economic Letter 2022-15, Gonçalves, E. og G. Koester (2022): “The role of demand and supply in underlying inflation – decomposing HICPX inflation into components”, ECB Economic Bulletin 7/2022 and Ascari et al (2023): “The Euro Area Great Inflation Surge”, DNB Analysis, 2 March 2023.
4. Monetary policy analysis
The policy rate path is higher than in the December 2022 Monetary Policy Report. According to Norges Bank’s model analyses, the path is pushed up by a smaller decline in domestic demand, a weaker krone exchange rate, higher wage growth and somewhat higher international interest rates than envisaged in December. Lower energy futures prices and lower oil and gas prices in isolation pull down the policy rate path.
4.1 Objectives and recent developments
The primary objective of monetary policy is low and stable inflation. The operational target is annual consumer price inflation of close to 2% over time. From the introduction of the inflation target in 2001 to March 2018, the inflation target was 2.5%. Inflation targeting shall be forward-looking and flexible so that it can contribute to high and stable output and employment and to countering the build-up of financial imbalances. The Committee’s monetary policy strategy is discussed further in "Norges Bank’s monetary policy strategy".
A moving average of the annual rise in consumer prices has been close to 2% over the past 30 years (Chart 4.1). Inflation has surged recently and the four-quarter change is now at its highest since the end of the 1980s.
CPI. Four-quarter change. Percent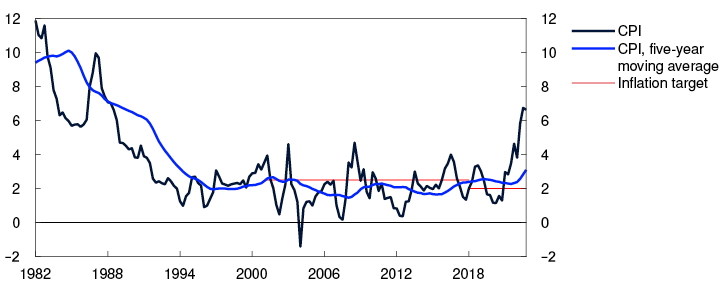
To help bring inflation back towards the target further out, monetary policy has gradually become more contractionary. The policy rate was raised rapidly in 2022 and has stood at 2.75% since December.
1 Period: 1982 Q1 – 2022 Q4.
4.2 New information and new assessments
Model-based interpretation of new information
To shed light on how the effects of new information influence the economic outlook, new information and assessments of the economic situation are incorporated into the modelling system, while conditioning on the policy rate path from the December 2022 Monetary Policy Report. This exercise shows the forecasts that the modelling system would have produced if the policy rate path were unchanged. Here the main focus is on the outlook for the output gap and inflation, two important considerations to which the Committee gives weight in the conduct of monetary policy.
Underlying inflation has been broadly in line with that projected in December. In the projection, inflation falls back from its current level, but in the exercise with an unchanged interest rate path, inflation runs higher than in the December Report. Throughout the projection period inflation is pulled up by a weaker krone, higher wage growth and more favourable developments in the real economy than envisaged in December, while lower electricity prices pull it down (left panel in Chart 4.2).
Conditioned on new information concerning economic developments and the policy rate forecast in MPR 4/22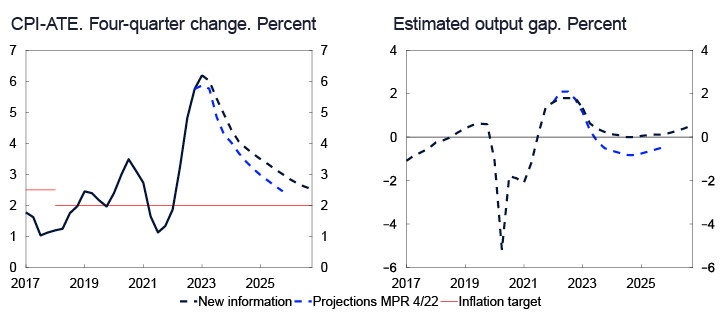
Mainland GDP growth has been higher than projected in the December Report. Expectations for higher capacity utilisation will contribute to sustaining inflation. In the model exercise, the output gap falls less than projected from year-end and remains at a higher level to the end of the forecast horizon (right panel in Chart 4.2). Employment is higher and wage growth stronger in this exercise than projected earlier, which dampens the fall in household real disposable income and consumption. A weaker krone and stronger growth prospects for Norway’s trading partners are sustaining exports.
In the exercise with an unchanged policy rate path, both inflation and capacity utilisation will be higher than in the December projections. Overall, the model-based interpretation of new information therefore suggests a need for a higher policy rate path.
A simple rule indicates a higher policy rate
A simple monetary policy rule shows the policy rate reaction to changes in the output gap and inflation (see Monetary Policy Report 2/22). The rule is based on data for the period 2009–2021.
Given the upward adjustment of the inflation and output gap projections, the simple rule now indicates a higher money market rate in the coming quarters than implied by the rule in the December Report (Chart 4.3).
Money market rate. Percent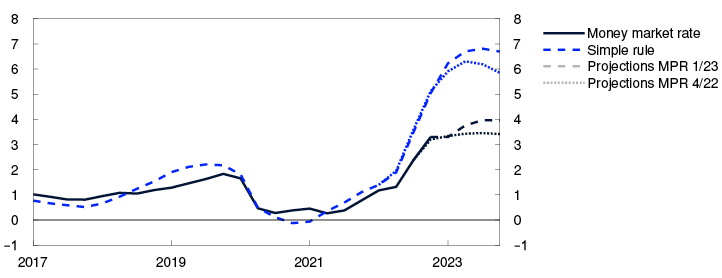
Market policy rate expectations have shown considerable volatility
Market policy rate expectations further out can be estimated on the basis of market rates. These policy rate expectations can provide an indication of how market participants have interpreted new information and how they believe Norges Bank will react.
Market expectations have recently shown considerable volatility (see shaded area in Chart 4.4). Policy rate expectations peaked at around 3.7% on 9 March but have since fallen, which reflects problems at certain banks in the US and Switzerland. Policy rate expectations for 2023 are now in line with the policy rate path in the December Report for 2023, but the market expects a somewhat faster decline in the policy rate than projected in December.
Policy rate. Percent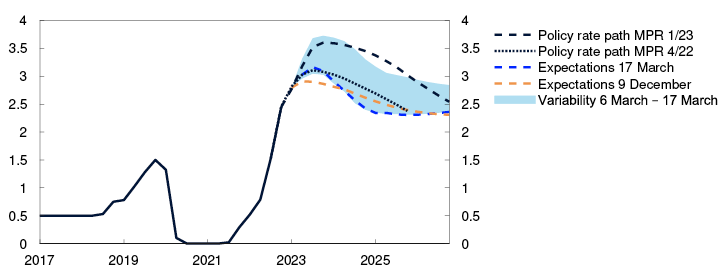
2 Period: 2017 Q1 – 2026 Q4. Projections from 2022 Q4 for MPR 4/22 and 2023 Q1 for MPR 1/23. CPI-ATE: CPI adjusted for tax changes and excluding energy products.
3 Period: 2017 Q1 – 2023 Q4. Projections from 2022 Q4 for MPR 4/22 and 2023 Q1 for MPR 1/23.
4 Period: 2017 Q1 – 2026 Q4. Projections from 17 March 2023 for MPR 1/23 and 9 December 2022 for MPR 4/22.
Expectations 17 March 2023 for MPR 1/23 and 9 December 2022 for MPR 4/22.
The shaded area shows the lowest and highest market expectations for the period 6 March to 17 March 2023.
4.3 Monetary policy stance and drivers behind the changes in the policy rate path
The policy rate forecast is higher than in the December Report. The policy rate was raised by 0.25 percentage point to 3% at the meeting on 22 March, and the forecast indicates that it will rise to around 3.5% in summer. Towards the end of the projection period, the policy rate is projected to be around 2.5%.
Compared with the December Report, the policy rate forecast has been raised more than the inflation forecast. This implies that the projection for the expected real interest rate has been raised somewhat for 2023 and 2024 (Chart 4.5).
Estimate of the expected real money market rate. Percent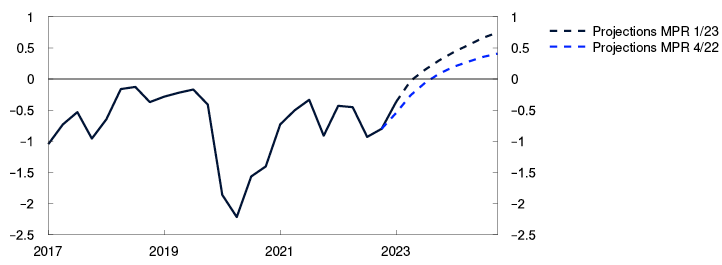
Long-term market interest rate expectations have risen considerably over the past year, for both Norway and other countries. Even though interest rate expectations have recently fallen somewhat, this may indicate that the market is now pricing in a higher equilibrium interest rate than previously. The neutral real interest rate is estimated to be in the range between -0.5% and 0.5% (see Monetary Policy Report 2/22). The estimates in this Report are based on a long-term equilibrium real interest rate that lies in the upper part of this range.
Monetary policy influences the economy through both nominal and real interest rates. The rapid increase in the nominal interest rate reduces household disposable income. Many households will have to cover higher interest payments by consuming less than they would otherwise. This applies in particular to those unable to draw on savings or increase borrowing. Moreover, the higher real interest rate makes it more attractive for households to defer consumption and for firms to defer investment.
A higher policy rate will therefore contribute to dampening aggregate demand and thereby inflation. Higher interest rates in Norway also contribute to increasing the interest rate differential against other countries and strengthening the krone, which reduces imported inflation. Overall, the monetary policy stance is expected to have a tightening effect on the economy throughout the projection period.
If the economic outlook, the balance of risks or the assessment of the functioning of the economy changes, the policy rate may prove to be different from the one now indicated by the policy rate path. It is particularly challenging to project inflation and capacity utilisation in the present environment, and the Bank’s forecasts have been revised substantially over the past year.
Decomposition of changes in the policy rate path
The Committee’s reasoning for the policy rate decision and forward guidance on the policy rate are presented in the monetary policy assessment. The decomposition in Chart 4.6 illustrates some of the main drivers behind the change in the policy rate path from our main model NEMO since the December Report. The bars show contributions to changes in the model-based path, and the broken line shows the sum of the bars. The solid line shows the actual change in the rate path.
Cumulative contributions. Percentage points
Higher expected growth among trading partners than projected earlier sustains foreign demand for Norwegian goods. Policy rates abroad are expected to be somewhat higher than previously assumed throughout the projection period. This contributes to weakening the krone, which pushes up both imported goods inflation and net exports. Moreover, the long-term real interest rate level is assumed to be somewhat higher than earlier. External factors therefore suggest a higher rate path (red bars).
Since the December Report, both oil and gas futures prices have fallen. This suggests lower projections for oil production and investment ahead, while also contributing to weakening the krone. Overall, factors relating to petroleum prices and investment nevertheless pull down the model-based path (orange bars).
The krone has been weaker than implied by changes in the interest rate differential against other countries and oil and gas prices. The model indicates that the krone risk premium is abnormally high. Factors relating to the exchange rate pull up the model-based path (light blue bars).
Wage growth has been higher than projected in December, and there are prospects that it will remain higher than projected earlier in 2023 too. This increases business costs and drives up inflation. At the same time, energy futures prices have fallen sharply. Nevertheless, on balance, factors relating to prices and wages suggest a somewhat higher model-based path in the first part of the projection period (blue-green bars).
Capacity utilisation is expected to be higher in the period ahead than envisaged in December. A less pronounced fall in real household income than previously projected helps sustain consumption. This effect is not sufficiently strong in our main model NEMO. The bars for domestic demand are therefore longer than if this mechanism had been better captured by the model, and the bars for prices and wages are shorter than they would have been otherwise. Growth in public demand is also projected to be higher than earlier. Overall, domestic demand pulls up the model-based path (dark blue bars).
The model analysis implies a higher policy rate than projected in the December Report throughout the projection period. The policy rate path has been revised up slightly less than the model-based path at the beginning of the projection period, but broadly as much as the model-based path towards the end of the period.
Norges Bank’s monetary policy strategy
The Bank’s monetary policy strategy describes the Committee’s interpretation of the monetary policy mandate and provides a framework for the Committee’s assessment of how monetary policy will respond to different shocks. The strategy is summarised below, and the full text is published on Norges Bank’s website.
The operational target of monetary policy is annual consumer price inflation of close to 2% over time. Inflation targeting shall be forward-looking and flexible so that it can contribute to high and stable output and employment and to countering the build-up of financial imbalances
Low and stable inflation
When setting the policy rate, Norges Bank aims to stabilise inflation, as measured by the annual rise in the consumer price index (CPI), around the 2% target. Provided there is confidence in low and stable inflation, variations in inflation around the target are not likely to engender any significant economic costs. How quickly the Bank seeks to return inflation to target will depend on the shocks that have occurred and whether there are conflicts between achieving the target and other monetary policy considerations. In interest rate setting, the Bank gives weight to avoiding large and persistent deviations from the inflation target, whether above or below the target.
High and stable output and employment
Monetary policy can contribute to stabilising output and employment around the highest level that is consistent with price stability over time.
The economic costs of cyclical fluctuations are asymmetrical. High unemployment involves direct costs for both society and those unable to find employment. Very low unemployment, on the other hand, does not involve any direct costs, but only indirect costs potentially in the form of excessively high wage and price inflation. The Bank will therefore not aim to quickly close a positive output gap as long as there are prospects that inflation will remain within a range close to 2% and there are no signs of financial imbalances accumulating.
By preventing downturns from becoming deep and protracted, monetary policy can contribute to keeping unemployment from becoming entrenched at a high level so that the average level of employment over time is as high as possible.
Mitigating the build-up of financial imbalances
If there are signs that financial imbalances are building up, the consideration of maintaining high and stable output and employment may, in some situations, suggest keeping the policy rate somewhat higher than otherwise. This can to some extent mitigate the risk of a severe downturn further out. Nevertheless, the regulation and supervision of financial institutions are the most important tools for cushioning shocks to the financial system.
Response pattern
The policy rate influences inflation and the real economy with a lag, and the effects are uncertain. To reduce the risk of monetary policy contributing to economic instability, Norges Bank will normally respond less forcefully to shocks than if there had not been uncertainty about the transmission of monetary policy. Furthermore, the policy rate is normally changed gradually to make monetary policy more predictable and to reduce the risk of undesirable financial market volatility and unexpected reactions of households and firms. In situations where the risk of particularly adverse outcomes is pronounced, or if there is no longer confidence that inflation will remain low and stable, it may be appropriate to react more forcefully than normal in interest rate setting.
5 Period: 2017 Q1 – 2024 Q4. The expected real interest rate is the projected money market rate over the next four quarters less expected CPI-ATE inflation over the same period. For Q1 and in the projection period, the expected real interest rate is estimated based on the projections in this Report. For all previous periods, the expected real interest rate is based on the most up-to-date Monetary Policy Report at the time in question.
6 Period: 2023 Q2 – 2025 Q4. Projections. The contributions are based on model estimates from the NEMO model, but there is no mechanistic link between news and changes in the bars. The effects of news feed through with a lag and the interaction between economic variables may result in a reversal of the effects over time. In addition, projections for the near term may entail news with different signs at different times. The effect on the rate path is therefore shown most clearly by the cumulative contributions.
4.3 Monetary policy stance and drivers behind the changes in the policy rate path
The policy rate forecast is higher than in the December Report. The policy rate was raised by 0.25 percentage point to 3% at the meeting on 22 March, and the forecast indicates that it will rise to around 3.5% in summer. Towards the end of the projection period, the policy rate is projected to be around 2.5%.
Compared with the December Report, the policy rate forecast has been raised more than the inflation forecast. This implies that the projection for the expected real interest rate has been raised somewhat for 2023 and 2024 (Chart 4.5).
Estimate of the expected real money market rate. Percent
Long-term market interest rate expectations have risen considerably over the past year, for both Norway and other countries. Even though interest rate expectations have recently fallen somewhat, this may indicate that the market is now pricing in a higher equilibrium interest rate than previously. The neutral real interest rate is estimated to be in the range between -0.5% and 0.5% (see Monetary Policy Report 2/22). The estimates in this Report are based on a long-term equilibrium real interest rate that lies in the upper part of this range.
Monetary policy influences the economy through both nominal and real interest rates. The rapid increase in the nominal interest rate reduces household disposable income. Many households will have to cover higher interest payments by consuming less than they would otherwise. This applies in particular to those unable to draw on savings or increase borrowing. Moreover, the higher real interest rate makes it more attractive for households to defer consumption and for firms to defer investment.
A higher policy rate will therefore contribute to dampening aggregate demand and thereby inflation. Higher interest rates in Norway also contribute to increasing the interest rate differential against other countries and strengthening the krone, which reduces imported inflation. Overall, the monetary policy stance is expected to have a tightening effect on the economy throughout the projection period.
If the economic outlook, the balance of risks or the assessment of the functioning of the economy changes, the policy rate may prove to be different from the one now indicated by the policy rate path. It is particularly challenging to project inflation and capacity utilisation in the present environment, and the Bank’s forecasts have been revised substantially over the past year.
Decomposition of changes in the policy rate path
The Committee’s reasoning for the policy rate decision and forward guidance on the policy rate are presented in the monetary policy assessment. The decomposition in Chart 4.6 illustrates some of the main drivers behind the change in the policy rate path from our main model NEMO since the December Report. The bars show contributions to changes in the model-based path, and the broken line shows the sum of the bars. The solid line shows the actual change in the rate path.
Cumulative contributions. Percentage points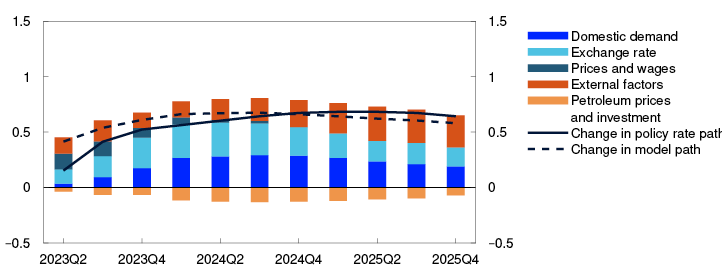
Higher expected growth among trading partners than projected earlier sustains foreign demand for Norwegian goods. Policy rates abroad are expected to be somewhat higher than previously assumed throughout the projection period. This contributes to weakening the krone, which pushes up both imported goods inflation and net exports. Moreover, the long-term real interest rate level is assumed to be somewhat higher than earlier. External factors therefore suggest a higher rate path (red bars).
Since the December Report, both oil and gas futures prices have fallen. This suggests lower projections for oil production and investment ahead, while also contributing to weakening the krone. Overall, factors relating to petroleum prices and investment nevertheless pull down the model-based path (orange bars).
The krone has been weaker than implied by changes in the interest rate differential against other countries and oil and gas prices. The model indicates that the krone risk premium is abnormally high. Factors relating to the exchange rate pull up the model-based path (light blue bars).
Wage growth has been higher than projected in December, and there are prospects that it will remain higher than projected earlier in 2023 too. This increases business costs and drives up inflation. At the same time, energy futures prices have fallen sharply. Nevertheless, on balance, factors relating to prices and wages suggest a somewhat higher model-based path in the first part of the projection period (blue-green bars).
Capacity utilisation is expected to be higher in the period ahead than envisaged in December. A less pronounced fall in real household income than previously projected helps sustain consumption. This effect is not sufficiently strong in our main model NEMO. The bars for domestic demand are therefore longer than if this mechanism had been better captured by the model, and the bars for prices and wages are shorter than they would have been otherwise. Growth in public demand is also projected to be higher than earlier. Overall, domestic demand pulls up the model-based path (dark blue bars).
The model analysis implies a higher policy rate than projected in the December Report throughout the projection period. The policy rate path has been revised up slightly less than the model-based path at the beginning of the projection period, but broadly as much as the model-based path towards the end of the period.
Norges Bank’s monetary policy strategy
The Bank’s monetary policy strategy describes the Committee’s interpretation of the monetary policy mandate and provides a framework for the Committee’s assessment of how monetary policy will respond to different shocks. The strategy is summarised below, and the full text is published on Norges Bank’s website.
The operational target of monetary policy is annual consumer price inflation of close to 2% over time. Inflation targeting shall be forward-looking and flexible so that it can contribute to high and stable output and employment and to countering the build-up of financial imbalances
Low and stable inflation
When setting the policy rate, Norges Bank aims to stabilise inflation, as measured by the annual rise in the consumer price index (CPI), around the 2% target. Provided there is confidence in low and stable inflation, variations in inflation around the target are not likely to engender any significant economic costs. How quickly the Bank seeks to return inflation to target will depend on the shocks that have occurred and whether there are conflicts between achieving the target and other monetary policy considerations. In interest rate setting, the Bank gives weight to avoiding large and persistent deviations from the inflation target, whether above or below the target.
High and stable output and employment
Monetary policy can contribute to stabilising output and employment around the highest level that is consistent with price stability over time.
The economic costs of cyclical fluctuations are asymmetrical. High unemployment involves direct costs for both society and those unable to find employment. Very low unemployment, on the other hand, does not involve any direct costs, but only indirect costs potentially in the form of excessively high wage and price inflation. The Bank will therefore not aim to quickly close a positive output gap as long as there are prospects that inflation will remain within a range close to 2% and there are no signs of financial imbalances accumulating.
By preventing downturns from becoming deep and protracted, monetary policy can contribute to keeping unemployment from becoming entrenched at a high level so that the average level of employment over time is as high as possible.
Mitigating the build-up of financial imbalances
If there are signs that financial imbalances are building up, the consideration of maintaining high and stable output and employment may, in some situations, suggest keeping the policy rate somewhat higher than otherwise. This can to some extent mitigate the risk of a severe downturn further out. Nevertheless, the regulation and supervision of financial institutions are the most important tools for cushioning shocks to the financial system.
Response pattern
The policy rate influences inflation and the real economy with a lag, and the effects are uncertain. To reduce the risk of monetary policy contributing to economic instability, Norges Bank will normally respond less forcefully to shocks than if there had not been uncertainty about the transmission of monetary policy. Furthermore, the policy rate is normally changed gradually to make monetary policy more predictable and to reduce the risk of undesirable financial market volatility and unexpected reactions of households and firms. In situations where the risk of particularly adverse outcomes is pronounced, or if there is no longer confidence that inflation will remain low and stable, it may be appropriate to react more forcefully than normal in interest rate setting.
5 Period: 2017 Q1 – 2024 Q4. The expected real interest rate is the projected money market rate over the next four quarters less expected CPI-ATE inflation over the same period. For Q1 and in the projection period, the expected real interest rate is estimated based on the projections in this Report. For all previous periods, the expected real interest rate is based on the most up-to-date Monetary Policy Report at the time in question.
6 Period: 2023 Q2 – 2025 Q4. Projections. The contributions are based on model estimates from the NEMO model, but there is no mechanistic link between news and changes in the bars. The effects of news feed through with a lag and the interaction between economic variables may result in a reversal of the effects over time. In addition, projections for the near term may entail news with different signs at different times. The effect on the rate path is therefore shown most clearly by the cumulative contributions.
Annex
Detailed tables of projections
TABLe 1 International projections
|
Change from projections in Monetary Policy Report 4/22 in brackets |
Weights1 Percent |
Percentage change from previous year |
||||
|
2022 |
2023 |
2024 |
2025 |
2026 |
||
|
GDP |
||||||
|
US |
9 |
2.1 (0.1) |
1.5 (0.3) |
1.2 (-0.3) |
1.7 (0) |
1.7 |
|
Euro area |
35 |
3.5 (0.2) |
0.7 (0.8) |
1.4 (0.2) |
1.7 (-0.3) |
1.6 |
|
UK |
11 |
4 (-0.4) |
0 (1) |
0.9 (0.2) |
1.8 (-0.2) |
1.8 |
|
Sweden |
13 |
2.8 (-0.1) |
-0.8 (-0.3) |
1.3 (0.3) |
2.1 (0) |
2 |
|
China |
6 |
3 (0) |
5.2 (0.9) |
4.8 (0.3) |
3.9 (-0.1) |
3.8 |
|
13 trading partners1 |
100 |
3.4 (0) |
0.9 (0.4) |
1.8 (0.1) |
2.2 (-0.1) |
2.1 |
|
5 trading partners2 |
3.2 (0) |
1 (0.6) |
1.7 (0.2) |
2.1 (-0.1) |
1.9 |
|
|
Prices |
||||||
|
Underlying inflation3 |
4.8 (0) |
5 (0.8) |
2.6 (0.1) |
2.2 (0.1) |
2.1 |
|
|
Wage growth3 |
4.5 |
4.6 |
3.7 |
3.3 |
3.1 |
|
|
Prices for consumer goods imported to Norway4 |
7.3 (-0.2) |
0.1 (0.5) |
1.3 (0.2) |
0.8 (0) |
0.8 |
|
1 The aggregate includes: Euro area, China, UK, Sweden, US, Brazil, Denmark, India, Poland, South Korea, Singapore, Thailand and Turkey. Export weights.
2 The aggregate includes: Euro area, China, Sweden, UK and US. Export weights.
3 The aggregate includes: Euro area, Sweden, UK and US. Import weights.
4 In foreign currency terms. Including composition effects and freight rates.
Sources: Refinitiv Datastream and Norges Bank
TABle 2a Consumer prices. Twelve-month change. Percent
|
2022 |
2023 |
||||||
|
Dec |
Jan |
feb |
Mar |
Apr |
May |
Jun |
|
|
Consumer price index (CPI) |
|||||||
|
Actual |
5.9 |
7.0 |
6.3 |
||||
|
Projections MPR 4/22 |
6.0 |
6.9 |
6.8 |
6.2 |
|||
|
Projections MPR 1/23 |
6.0 |
5.6 |
5.4 |
4.4 |
|||
|
CPI-ATE |
|||||||
|
Actual |
5.8 |
6.4 |
5.9 |
||||
|
Projections MPR 4/22 |
5.7 |
5.9 |
5.9 |
5.8 |
|||
|
Projections MPR 1/23 |
6.2 |
6.1 |
6.0 |
5.9 |
|||
|
Imported consumer goods in the CPI-ATE |
|||||||
|
Actual |
6.4 |
7.0 |
5.8 |
||||
|
Projections MPR 4/22 |
5.8 |
5.8 |
5.6 |
6.0 |
|||
|
Projections MPR 1/23 |
6.5 |
6.8 |
6.3 |
6.1 |
|||
|
Domestically produced goods and services in the CPI-ATE |
|||||||
|
Actual |
5.5 |
6.1 |
5.9 |
||||
|
Projections MPR 4/22 |
5.6 |
6.0 |
6.0 |
5.7 |
|||
|
Projections MPR 1/23 |
6.2 |
6.0 |
6.0 |
5.9 |
|||
Sources: Statistics Norway and Norges Bank
TABLE 2b House prices. Monthly change. Seasonally adjusted. Percent
|
2022 |
2023 |
||||||
|
Dec |
Jan |
feb |
Mar |
Apr |
May |
Jun |
|
|
Actual |
0.3 |
0.1 |
0.3 |
||||
|
Projections MPR 4/22 |
-0.8 |
-0.5 |
-0.5 |
-0.5 |
|||
|
Projections MPR 1/23 |
0.0 |
-0.4 |
-0.4 |
-0.4 |
|||
Sources: Eiendomsverdi, Finn.no, Real Estate Norway and Norges Bank
TABLE 2c Registered unemployment (rate). Percent of labour force. Seasonally adjusted
|
2022 |
2023 |
||||||
|
Dec |
Jan |
feb |
Mar |
Apr |
May |
Jun |
|
|
Actual |
1.7 |
1.7 |
1.7 |
||||
|
Projections MPR 4/22 |
1.7 |
1.7 |
1.8 |
1.8 |
|||
|
Projections MPR 1/23 |
1.7 |
1.8 |
1.8 |
1.8 |
|||
Sources: Norwegian Labour and Welfare Administration (NAV) and Norges Bank
TABLE 2d GDP for mainland Norway. Monthly change. Seasonally adjusted. Percent
|
2022 |
2023 |
||||||
|
Dec |
Jan |
feb |
Mar |
Apr |
May |
Jun |
|
|
Actual |
0.3 |
-0.2 |
|||||
|
Projections MPR 4/22 |
-0.4 |
0.0 |
0.0 |
0.0 |
|||
|
Projections MPR 1/23 |
-0.2 |
0.1 |
0.1 |
0.1 |
0.1 |
||
Sources: Statistics Norway and Norges Bank
TABLE 2e GDP for mainland Norway. Quarterly change.1 Seasonally adjusted. Percent
|
2022 |
2023 |
|||
|
Q3 |
Q4 |
Q1 |
Q2 |
|
|
Actual |
0.6 |
0.7 |
||
|
Projections MPR 4/22 |
0.0 |
-0.3 |
-0.5 |
|
|
Projections MPR 1/23 |
-0.1 |
0.1 |
||
1 Quarterly figures based on monthly national accounts.
Sources: Statistics Norway and Norges Bank
TABle 3 Projections for main economic aggregates
|
Change from projections in Monetary Policy Report 4/22 in brackets |
Percentage change from previous year (unless otherwise stated) |
|||||
|
In billions of NOK 2022 |
2022 |
Projections |
||||
|
2023 |
2024 |
2025 |
2026 |
|||
|
Prices and wages |
||||||
|
CPI |
5.8 (0.0) |
4.9 (0.1) |
3.3 (0.3) |
2.6 (0.2) |
2.1 |
|
|
CPI-ATE |
3.9 (0.0) |
5.6 (0.4) |
3.8 (0.2) |
2.9 (0.2) |
2.2 |
|
|
Annual wages |
4.3 (0.4) |
5.1 (0.4) |
4.4 (0.1) |
4.0 (0.0) |
3.4 |
|
|
Real economy1 |
||||||
|
Gross domestic product (GDP) |
5 540 |
3.2 (0.0) |
1.4 (0.8) |
0.6 (0.0) |
0.9 (0.6) |
0.9 |
|
GDP, mainland Norway2 |
3 557 |
3.7 (0.1) |
1.1 (1.3) |
0.5 (0.3) |
1.1 (-0.3) |
1.3 |
|
Output gap, mainland Norway (level) |
1.8 (-0.1) |
0.6 (0.4) |
-0.3 (0.5) |
-0.4 (0.2) |
-0.3 |
|
|
Employment, persons, QNA |
3.9 (0.0) |
0.9 (1.3) |
-0.1 (0.3) |
0.3 (-0.4) |
0.5 |
|
|
Registered unemployment (rate, level) |
1.8 (0.0) |
1.9 (-0.1) |
2.2 (-0.2) |
2.3 (-0.1) |
2.3 |
|
|
Demand1 |
||||||
|
Mainland demand2 |
3 759 |
4.8 (0.1) |
-0.2 (0.8) |
1.2 (0.2) |
1.9 (-0.4) |
1.8 |
|
– Household consumption |
1 805 |
6.9 (0.4) |
-1.1 (0.4) |
1.7 (1.2) |
2.1 (-0.7) |
2.1 |
|
– Business investment |
449 |
14.5 (-2.0) |
1.8 (2.7) |
0.1 (0.3) |
2.9 (-0.1) |
1.4 |
|
– Housing investment |
232 |
-1.3 (1.9) |
-4.0 (0.8) |
0.5 (-1.1) |
3.6 (0.0) |
4.7 |
|
– Public demand |
1 273 |
0.2 (0.2) |
1.1 (0.7) |
1.0 (-1.0) |
1.1 (0.0) |
1.0 |
|
Petroleum investment2 |
178 |
-5.5 (1.5) |
6.0 (2.0) |
4.0 (-8.0) |
2.0 (0.0) |
-2.0 |
|
Mainland exports2 |
934 |
8.5 (3.3) |
4.2 (-0.3) |
1.7 (-0.4) |
3.2 (0.2) |
3.4 |
|
Imports |
1 519 |
9.1 (-3.2) |
1.9 (0.7) |
2.2 (-0.8) |
3.9 (2.9) |
2.0 |
|
House prices and debt |
||||||
|
House prices |
5.0 (0.1) |
-2.9 (1.4) |
0.0 (-2.1) |
4.1 (0.4) |
5.4 |
|
|
Household credit (C2) |
4.4 (0.0) |
3.7 (0.1) |
3.2 (0.0) |
3.0 (0.0) |
2.8 |
|
|
Interest rate, exchange rate and oil price |
||||||
|
Policy rate (level) |
1.3 (0.0) |
3.3 (0.3) |
3.5 (0.6) |
3.2 (0.7) |
2.7 |
|
|
Import-weighted exchange rate (I-44) (level) |
110.0 (0.0) |
117.4 (6.9) |
114.3 (6.0) |
112.3 (4.9) |
112 |
|
|
Policy rate, trading partners (level) |
0.7 (0.0) |
3.4 (0.0) |
3.0 (0.1) |
2.7 (0.2) |
2.6 |
|
|
Oil price, Brent Blend. USD per barrel |
101.0 (-0.6) |
75.8 (-0.7) |
71.4 (-3.2) |
69.4 (-3.3) |
68 |
|
|
Household income and saving1 |
||||||
|
Real disposable income excl. dividend income |
2.5 (1.3) |
-1.9 (0.4) |
2.1 (0.1) |
2.6 (-0.5) |
2.9 |
|
|
Saving ratio excl. dividend income (rate, level) |
-0.4 (-0.7) |
-0.8 (-0.1) |
0.1 (-0.5) |
0.6 (-0.2) |
1.4 |
|
|
Fiscal policy |
||||||
|
Structural non-oil deficit as a percentage of GPFG3 |
2.7 (0.0) |
2.8 (0.2) |
2.5 (0.0) |
2.4 (-0.1) |
2.4 |
|
|
Structural non-oil deficit as a percentage of trend GDP |
9.4 (-0.3) |
9.6 (0.7) |
9.7 (0.5) |
9.4 (0.1) |
9.6 |
|
1 All figures are working-day adjusted.
2 Annual figures based on monthly national accounts.
2 Government Pension Fund Global measured at the beginning of the year.
Sources: Eiendomsverdi, Finn.no, Ministry of Finance, Norwegian Labour and Welfare Administration (NAV), Real Estate Norway, Refinitiv Datastream, Statistics Norway and Norges Bank