Executive Board’s assessment
In the Financial Stability Report, Norges Bank assesses vulnerabilities and risks in the Norwegian financial system and points to measures that can contribute to financial stability. The Executive Board discussed the content of the Report on 18 September and 23 October.
Financial system vulnerabilities in Norway have not changed substantially since the previous Report, which was published in October 2018. Household debt is high, and commercial and residential property prices are at high levels after rising sharply over a long period. However, over the past two years, debt growth and house price inflation have been more moderate than previously, and house prices have risen more slowly than disposable income. Over the past year, the rise in commercial property prices has also slowed, and household debt is now rising at close to the same rate as disposable income. Norwegian banks have maintained profitability and solvency and continue to have ample access to funding.
Global economic uncertainty poses a risk to financial stability in Norway. Events in the international economy and financial markets can spread to Norway, and the impact in Norway may be amplified by domestic financial system vulnerabilities. Two such contagion channels are Norwegian exports and banks’ foreign funding. The trade tensions between the US and China remain a source of uncertainty and the UK’s relationship with the EU remains unclarified. Over the past year, uncertainties surrounding growth prospects abroad have led to a broad decline in interest rates. Persistently low interest rates may give rise to high risk-taking and financial imbalances. So far, global uncertainties have not had serious consequences for the Norwegian economy, and Norwegian banks have felt little impact, but this situation can change quickly.
On balance, the financial stability outlook is broadly unchanged since the 2018 Report.
The Norwegian authorities have implemented a number of measures to mitigate financial system vulnerabilities. Requirements for banks’ credit standards limit excessive borrowing by the most vulnerable households. The regulation on new residential mortgage loans, first introduced in 2015, was tightened in 2017 and has functioned as intended. Norges Bank is of the opinion that debt growth and housing market developments do not warrant material changes to the requirements and in a consultation response on 14 October supported continuation of the regulation. There are also signs that measures targeting the consumer credit market have dampened consumer debt growth. In addition, the registers of unsecured debts, which were introduced on 1 July, have given banks more complete data on which to base credit assessments. Such registers should also include information on collateralised loans to enable banks and loan applicants to easily obtain the full picture of a loan applicant’s debt situation.
Banks’ loss absorbency capacity in an economic downturn is important for financial stability. Banks’ capital and liquidity requirements have become considerably stricter following the financial crisis. The stress test in this Report shows that the capital buffers of the largest Norwegian banks as a whole are sufficient to absorb the losses associated with a hypothetical downturn in the Norwegian economy. Nevertheless, in such a situation, banks may still tighten lending, which may amplify the downturn. To counter a sudden fall in lending, the authorities can reduce the countercyclical capital buffer and allow banks to draw on the remaining buffers. In that case, banks should be given sufficient time to rebuild the capital buffers.
In connection with the implementation of the remainder of the EU capital framework, many banks’ reported capital ratios will rise without this reflecting an improvement in solvency. Norges Bank is of the view that in the current situation, Norwegian banks’ capital levels should not be reduced. Structural systemic risk is high, particularly owing to high household leverage. Since the systemic risk buffer was introduced in 2013, banks have increased their property market exposures, and their cross-holding of covered bonds has also risen. In its consultation response on 30 September, Norges Bank supported as a countermeasure the proposal to increase the systemic risk buffer, an action that will help banks to maintain loss absorbency.
Financial stability considerations in each country should determine the scope of regulation, whether the lenders are domestic or foreign banks. Foreign banks’ share of the Norwegian market is high. It is therefore important that other countries recognise Norwegian regulations and vice versa.
Digital vulnerabilities may result in a higher risk of operational problems. Cyber attacks are becoming increasingly widespread and sophisticated. Moreover, the financial system depends on a few critical ICT service providers. This increases the risk that a cyber attack may pose a threat to financial stability. Finanstilsynet and Norges Bank have invited the industry and other relevant authorities to a dialogue to assess whether the European framework for Threat Intelligence-based Ethical Red Teaming (TIBER-EU) would be suited to Norway. In its consultation response on the ICT security bill, Norges Bank pointed out a need for further study of the best way to supervise critical ICT service providers and data centres.
Climate change and society’s adaptation to climate change will affect all segments of the economy and entail risks to financial stability. Changes in climate regulation, new technology and changing investor and consumer preferences may entail a transition risk for the Norwegian economy in the coming years, a risk amplified by the importance of the oil and gas industry for Norway. Climate change is a global challenge, which must primarily be addressed by the political authorities and instruments other than those available to central banks. Climate risk must be managed in the same way as other risks facing the financial sector. The instruments for strengthening banks’ resilience, such as capital requirements and prudential supervision, are thus basically the same as those used for managing other risks. Central banks and supervisory authorities can, within their mandates, promote financial stability by helping to pave the way for the financial sector to include climate risks in overall risk assessments and communicate relevant information and by ensuring adequate capital to support all risks.
The key vulnerabilities in the financial system in Norway are high household debt, high house prices and high commercial property prices. Vulnerabilities have not changed substantially since Financial Stability Report 2018. Norwegian banks have maintained profitability and solvency and continue to have ample access to funding. Global economic uncertainty poses a risk to financial stability in Norway. Over the past year, uncertainties surrounding growth prospects abroad have led to a broad decline in interest rates. Persistently low interest rates may give rise to high risk-taking and financial imbalances. On balance, the financial stability outlook is little changed since the 2018 Report.
Since the financial crisis, the Norwegian authorities have introduced a number of measures to mitigate the risks in the financial system. The most important are stricter bank capital and liquidity requirements. Requirements for banks’ credit standards limit excessive borrowing by the most vulnerable households.
1.1 Risk of external shocks
Global turbulence can spread
The financial system largely operates across borders. Global turbulence and uncertainty may therefore spread to the financial system in Norway both from the global financial system and via the real economy. Small open economies like Norway are especially at risk. The IMF works to uncover financial sector vulnerabilities and provides advice on measures to address them (see "IMF assessment of the Norwegian financial system").
Large Norwegian banks obtain large amounts of funding abroad. At the same time, foreign banks account for around a quarter of all lending in Norway. Global financial turbulence may raise Norwegian banks’ funding costs and lower the supply of credit from foreign banks in Norway, both of which can reduce households’ and firms’ access to credit. Large firms that rely on the global bond market for financing may also be directly affected. Global turbulence has had little impact on Norwegian banks since the 2018 Report.
The European market is particularly important for the Norwegian economy. The situation at European banks is important for the European economy and may affect Norwegian banks’ funding markets. On the whole, European banks’ capital adequacy and liquidity coverage have improved considerably in recent years (Chart 1.1), but there are large differences across countries. The build-up of loss absorbency capacity appears to have come to a halt, and the average leverage ratio is lower for European banks than for Norwegian banks.1
Chart 1.1 Capital and liquidity coverage ratios in the EU banking system Weighted average. Percent. 2015 Q1 – 2019 Q2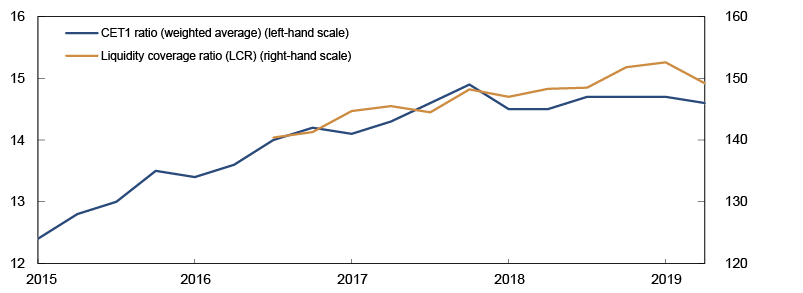
Source: European Banking Authority (EBA)
A large share of Norwegian financial institutions’ settlement takes place in foreign interbank systems, and large volumes of derivatives are cleared via UK central counterparties (CCPs). The UK’s withdrawal from the EU may entail challenges for these transactions. Temporary measures allow Norwegian firms to participate in UK CCPs even in the event of a no-deal Brexit.
IMF assessment of the Norwegian financial system
The global financial system is interconnected. Through the Financial Sector Assessment Program (FSAP), the International Monetary Fund (IMF) works to uncover vulnerabilities among its members. On the basis of FSAP findings, the IMF issues advice on measures to strengthen the financial system in each jurisdiction and reduce the risk of cross border contagion of financial distress. The IMF performs thorough analyses of the most important jurisdictions, including Norway, every five years. The results of an ongoing FSAP assessment of Norway will probably be published in the course of 2020 Q2.
Weaker growth expectations and lower foreign interest rates
Uncertainties surrounding trade tensions and the UK’s withdrawal from the EU have weighed on growth prospects for Norway’s trading partners (see Monetary Policy Report 3/19). So far, there are few signs that global uncertainties have damped growth in Norwegian exports. In August, enterprises in Norges Bank´s Regional Network reported continued solid export growth, despite increased uncertainties and Brexit-related turbulence.
Global markets have long priced in monetary policy normalisation and higher global interest rates, but the uncertain global outlook has contributed to a sharp fall in risk-free long-term interest rates, which are now at very low levels in some countries (Chart 1.2). Central bank measures have also contributed to lower interest rates. Around 30% of advanced economy sovereign bonds outstanding are now trading at negative yields.2 In a number of countries, new long-term corporate and household loans are now available at negative interest rates.
Chart 1.2 Yields on ten-year government bonds in selected countries Percent. 1 January 2012 – 30 October 2019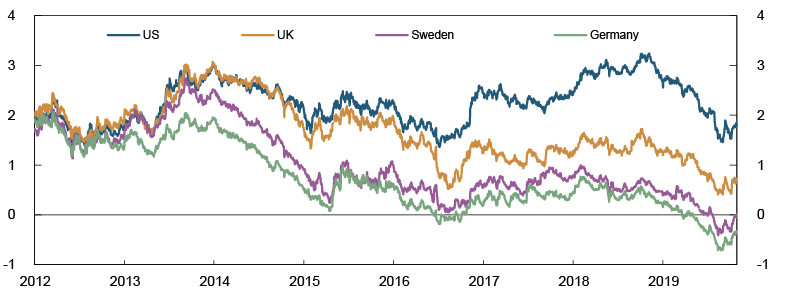
Source: Bloomberg
Following the global financial crisis in 2008, lower interest rates have contributed to higher non-financial sector debt. Corporates have increased debt by nearly 20% of global GDP since 2008. This debt will be more vulnerable if firms’ debt servicing capacity is weakened in pace with weaker growth prospects. Global public debt has also risen substantially, while household debt is little changed. Since 2016, the global total debt-to-GDP ratio has levelled off, for both the public sector and non-financial enterprises.
Low returns on low-risk investments have for some time contributed to higher prices for securities and real estate. Global equity prices are broadly at the same level as one year ago (Chart 1.3). Lower growth prospects have pulled down equity prices, while lower interest rates have pushed them up. Global house price inflation has been high since the financial crisis (Chart 1.4).
Chart 1.3 Stock market indexes in selected countries Index. 1 January 2008 = 100. 1 January 2008 – 30 October 2019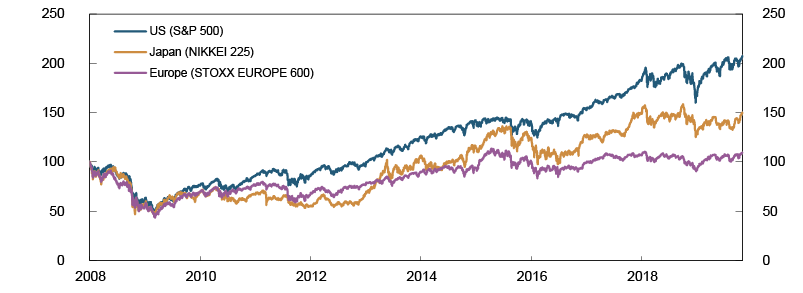
Source: Bloomberg
Chart 1.4 House prices in selected countries Index. 2008 Q1 = 100. 2008 Q2 – 2019 Q2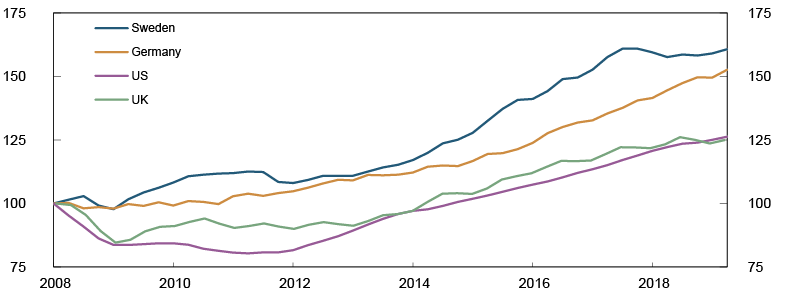
Source: Bank for International Settlements (BIS)
Low interest rates over a longer period may weaken the financial stability outlook because they fuel increased debt accumulation and asset price inflation.
1 In recent years, the average leverage ratio for EU banks has varied between 5.3% and 5.6% (see the EBA Risk Dashboard).
2 See International Monetary Fund (2019) “Global Financial Stability Report, October 2019”.
1.2 Vulnerabilities in the financial system in Norway
The key vulnerabilities in the financial system in Norway are high household debt, high house prices and high commercial property prices (see "Key financial system vulnerabilities in Norway"). Vulnerabilities have not changed substantially since the 2018 Report.
Over the past three years, growth in the Norwegian economy has been solid. The global upturn, low interest rates, improved cost-competitiveness, largely owing to a weaker krone, and higher oil prices have given a boost to activity.
Stable net interest income and low credit losses have enabled the large Norwegian banks to maintain profitability over the past year. All Norwegian banks satisfy the capital requirements. Further ahead, the risk of higher losses among oil-related companies and stronger competition from foreign banks and other operators could pose a threat to profitability.
Key financial system vulnerabilities in Norway
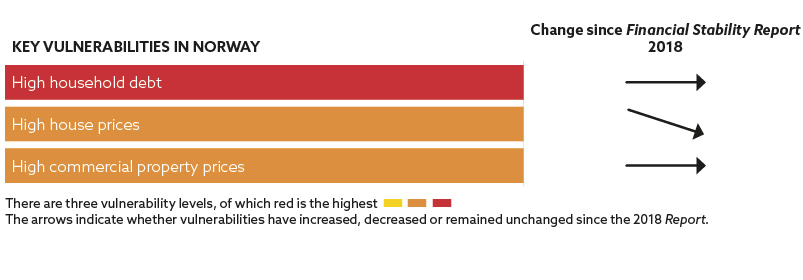
The table above shows Norges Bank’s assessment of the key vulnerabilities in the Norwegian financial system. Vulnerabilities can be time-varying or the result of permanent structural conditions in the financial system. Vulnerabilities can cause or amplify financial turbulence and an economic downturn when the economy is exposed to large shocks. The interaction between shocks and vulnerabilities can result in financial crises that restrain economic growth. Shocks that trigger financial crises can be difficult for the authorities to predict and influence. Shocks to a small open economy like Norway will often originate in other countries.
The vulnerability assessment is based on historical experience of what causes downturns and financial turbulence and assessments of new features of the financial system. The vulnerabilities identified as key vulnerabilities may change over time.
If vulnerabilities are categorised as orange or red, Norges Bank will consider issuing advice on measures to address them. These may be measures aimed at reducing the vulnerabilities directly or increasing financial system resilience. The authorities have already implemented a number of measures (Table 1.1).
Owing to high household indebtedness and house price overvaluation, the European Systemic Risk Board (ESRB) has issued a warning to Norway,1 in which it points out that the vulnerabilities are a source of systemic risk to the financial system.
High household debt
Vulnerabilities related to household debt are high and broadly unchanged since the 2018 Report. High household debt will amplify the negative outcome of a sudden and sharp movement in interest rates, house prices or household income. Most households have room to defer principal repayments, draw on financial buffers or tighten consumption if they are exposed to economic shocks. The danger that a large number of households will tighten consumption at the same time constitutes a systemic risk. This may reduce firms’ earnings and debt-servicing capacity, leading in turn to higher losses on banks’ corporate exposures.
Household debt has long risen faster than household income, resulting in increasing household leverage (Chart 1.5). Household debt-to-income ratios are now showing signs of levelling off. Over the past few years, debt growth has edged down, while growth in household disposable income has risen. The higher interest rate level and continued moderate house price inflation are expected to restrain debt growth further (see Monetary Policy Report 3/19).
Chart 1.5 Household debt-to-income ratio1 and four-quarter change in debt and disposable income2 Percent. 1989 Q1 – 2019 Q23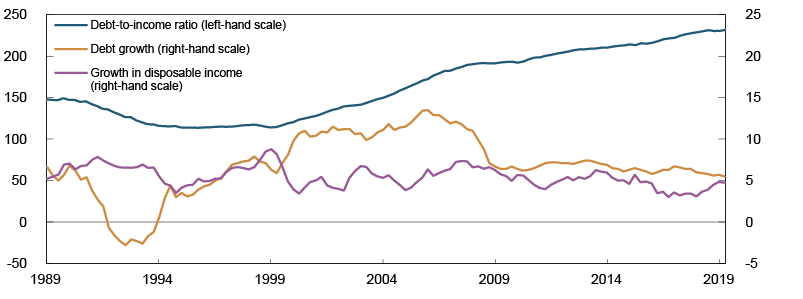
1) Loan debt as a percentage of disposable income.
2) Income after taxes and interest payments. Adjusted for a break in the series. Four-quarter change in moving sum for the previous four quarters.
3) Projection for change in disposable income for 2019 Q2.
Sources: Statistics Norway and Norges Bank
The latest available data at individual level show an increase in the share of highly leveraged households (debt above five times gross income) and low debt-servicing capacity (annual margin below one month’s income) between 2016 and 2017 (Chart 1.6). Especially among first-time buyers, there was a large share that assumed debt corresponding to a debt-to-income (DTI) ratio of above five in 2017 (see "Higher share of highly leveraged households"). DTIs also rose for households that were not active in the housing market, many of whom experienced a fall in income. The share of households “underwater” (net debt higher than their dwelling’s market value) was broadly unchanged. The data suggest that the number of vulnerable households increased between 2016 and 2017. Since then more moderate credit growth and house price inflation has been observed, which may indicate a slowdown in the build-up of vulnerabilities.
Chart 1.6 Debt held by vulnerable households1. Share of total household debt. Percent. 1987 – 2017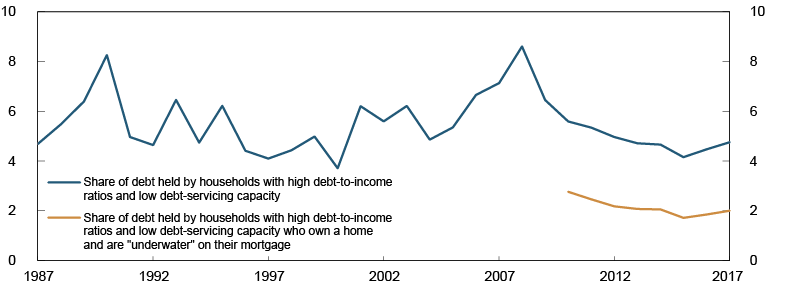
1) Households in breach of critical values for debt-to-income ratio (debt over five times gross income) and debt-servicing capacity (annual income after tax, less interest and standard consumption expenditure of less than one month’s income) and from 2010 also critical value for debt-to-value (net debt higher than dwelling’s market value).
Sources: SIFO, Statistics Norway and Norges Bank
Interest burdens, ie the share of income used to service interest on debt, are historically low owing to low lending rates (Chart 1.7). After the interest rate hikes over the past year, interest burdens have risen slightly. Owing to high debt levels, interest rate increases have a greater impact on household interest burdens than before. Debt service ratios, ie the share of income used to service interest and normal principal repayments, are already high and at the same level as prior to the financial crisis in 2008 and the banking crisis in the 1990s. Debt service ratios signal high risk in the heatmap (see "Developments in the heatmap").
Chart 1.7 Household debt service ratio1 and interest burden2
Percent. 1983 Q1 – 2019 Q2
1) Debt service ratio is interest expenses and estimated principal payments as a percentage of after-tax income.
2) Interest burden is interest expenses as a percentage of after-tax income.
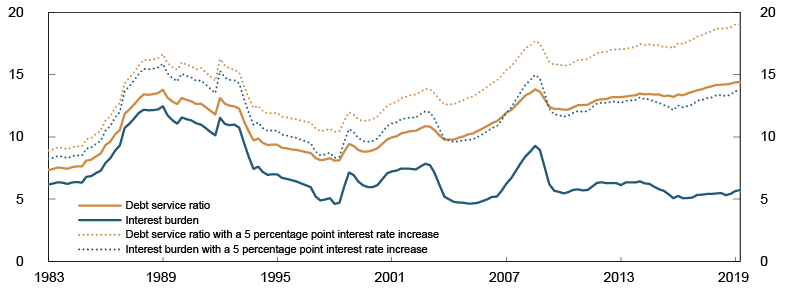
Sources: Statistics Norway and Norges Bank
Consumer debt accounts for only 3%-4% of total household debt. Households with large consumer debt are therefore faced with high interest burdens owing to the high interest rates and consumer credit. Default rates on consumer debt are high and rising (Chart 1.8). More restrictive credit standards and reduced house price inflation may result in increased defaults among persons needing to refinance maturing consumer debt. Information from the new credit registers shows that there are many with little consumer debt, while relatively few owe large amounts (see "Credit register data show uneven distribution of consumer debt"). Growth in consumer credit to Norwegian households has long been high and rising, but has slowed since peaking in 2016.3 Lower growth reflects in part the introduction by the authorities in recent years of a number of measures to regulate consumer credit.4 The consumer credit regulation and credit registers may curb consumer credit growth further.
Chart 1.8 Annual change in consumer credit and default rates1 on consumer debt2 Percent. At year-end. 2008 – 20193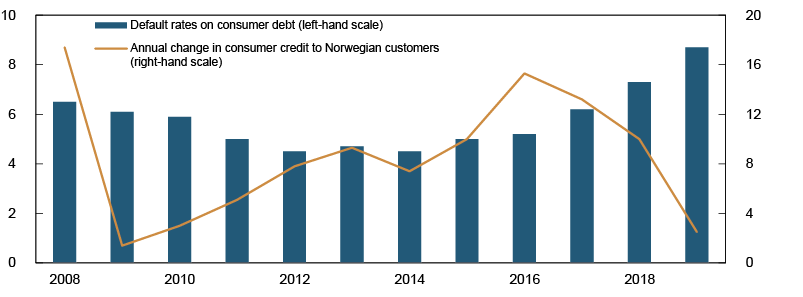
1) Gross non-performing consumer debt (90 days) as a share of gross consumer debt. Also includes finance companies' exposures abroad.
2) Based on the FSAs sample of banks and finance companies that cover most of the consumer credit market. Non-performing loans sold omitted from the sample.
3) At 30 June 2019.
Source: Finanstilsynet (Financial Supervisory Authority of Norway)
The credit registers provide details on an individual’s unsecured debt. Norges Bank recommends enlarging the registers to include information on secured debt. This will provide a more comprehensive picture of a loan applicant’s debt situation.
Developments in the heatmap
Norges Bank’s heatmap1 is one of a number of tools for assessing systemic risk in the Norwegian financial system. The heatmap monitors a broad set of indicators in three main areas: risk appetite and asset valuations, non-financial (household and corporate) sector vulnerabilities and financial sector vulnerabilities. Its primary objective is to measure cyclical or time-varying movements in vulnerabilities, and to a lesser extent vulnerabilities associated with structural aspects of the financial system or the wider economy.
Developments in the indicators are mapped onto a common colour coding scheme, where a green (red) colour reflects low (high) levels of vulnerability. The heatmap signals vulnerabilities in three segments of the financial system:
- Commercial property prices have risen sharply over many years. The gap between actual price developments and trend has therefore been and remains positive and relatively wide.2
- Household debt service ratios (interest and estimated principal payments on loan debt to after-tax income) are high.
- Assets and lending associated with institutions other than banks and mortgage companies3 have shown strong growth. Mutual funds’ assets have risen in recent years, partly owing to increased subscriptions by insurance companies and pension funds. Insurance companies in particular have seen strong lending growth, though levels remain low. Vulnerabilities are therefore not considered to be elevated.
Composite indicators in the heatmap. 1980 Q1 – 2019 Q2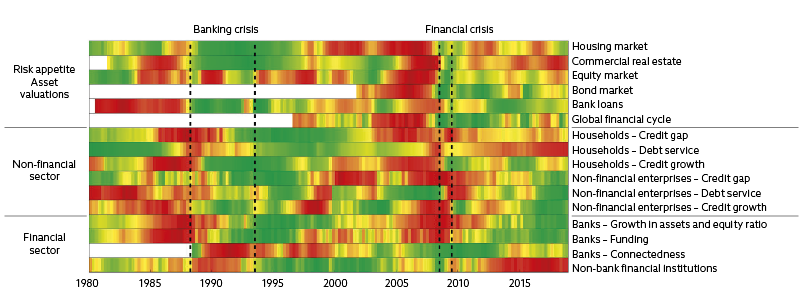
1 See Arbatli, E.C. and R.M. Johansen (2017) “A Heatmap for Monitoring Systemic Risk in Norway“, Staff Memo 10/2017, Norges Bank, for a detailed description of the heatmap and the individual indicators.
2 See Norges Bank´s website: “Indicators of financial imbalances” for an illustration of the gaps.
3 Financial institutions other than banks and mortgage companies comprise money market mutual funds, other mutual funds, finance companies, government lending institutions, insurance companies and pension funds.
Moderate house price inflation reduces housing market vulnerabilities
High house prices are a key financial system vulnerability in Norway. Sharp and sudden declines in house prices may trigger tightening of household consumption and result in increased losses on banks’ loan portfolios. The covered bond market may also be weakened. This may create bank funding shocks (see Section 2 Bank profitability, solvency and funding).
House prices have risen sharply over a long period and in nominal terms are at historically high levels. Over the past two years, the rise has been moderate, and house prices relative to household disposable income have moved lower (Chart 1.9). The cooling-off of the housing market has reduced the risk of a sudden and more pronounced price fall further out, and vulnerabilities have declined somewhat since the 2018 Report.
Chart 1.9 House prices relative to disposable income1 Index. 1998 Q4 = 100. 1983 Q1 – 2019 Q2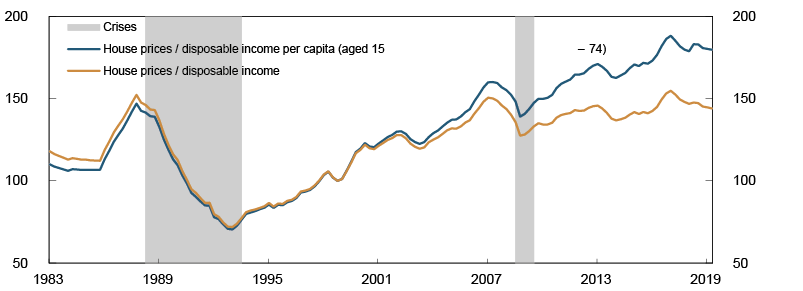
1) Disposable income is income after taxes and interest payments. Adjusted for a break in the series.
Sources: Eiendomsverdi, Finn.no, Norwegian Association of Real Estate Agents (NEF), Real Estate Norway, Statistics Norway and Norges Bank
The recent moderate house price inflation may partly reflect increased residential construction.5 There was a record number of completions in 2018, and a new peak in the number of completions is expected in 2019 (Chart 1.10). Higher interest rates and the tightening of the regulation on new residential mortgage loans have also likely pulled down house price inflation.
Chart 1.10 Housing starts and completions, annual change in number of households In thousands. 2005 – 20201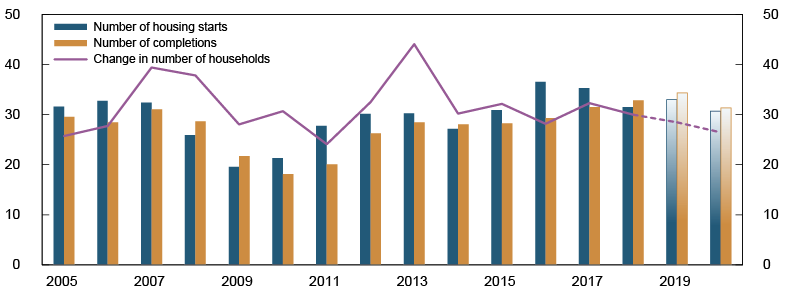
1) Projections for 2019 and 2020.
Sources: Statistics Norway and Norges Bank
Moderate house price inflation is expected to continue ahead (see Monetary Policy Report 3/19). Higher interest rates and the large number of completions pull down the rise in house prices. Prospects for continued high demand for housing in urbanised areas and higher wage growth pull in the opposite direction. A more moderate rise in house prices may help restrain the build-up of household debt ahead.
High commercial property prices
Vulnerabilities associated with high commercial property prices are broadly unchanged since the 2018 Report. In recent years, the rise in prices for commercial property in Oslo has been high, and real estate companies’ debt has risen. This has contributed to higher vulnerabilities for banks. Norwegian banks’ have sizeable exposures to commercial real estate (CRE) (see Section 3 Stress test). Even though in normal times, losses have been historically been low, CRE is the sector that has inflicted the most losses during crises.
Estimated real selling prices for prime office space in Oslo have been rising sharply over several years (Chart 1.11). Over the past year, the rise has been more moderate. Selling prices are estimated using rental prices and an estimated yield.
Chart 1.11 Real commercial property prices1 Index. 1998 = 100. 1983 Q1 – 2019 Q2 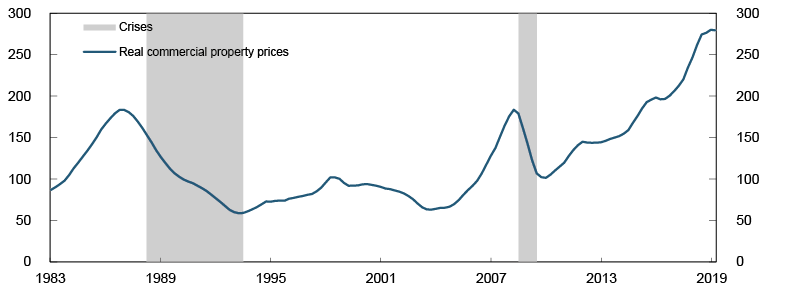
1) Estimated real selling prices per square metre for prime office space in Oslo. Deflated by the GDP deflator for mainland Norway. Average selling price for the previous four quarters.
Sources: CBRE, Dagens Næringsliv, OPAK, Statistics Norway and Norges Bank
In isolation, rising rental prices strengthen the debt-servicing capacity of CRE companies. Rents for prime office space in central Oslo have risen sharply over the past few years (Chart 1.12). In other parts of Oslo, average rental prices have risen, but the rise has been lower than for prime office space. Norges Bank has developed a rental price index that takes into account that rent depends on the attractiveness of the office space (see "New rental price index for commercial real estate in Oslo"). This quality-adjusted index confirms that rents for the most attractive office space have risen more sharply in recent years than what could be considered representative for Oslo. According to Entra’s consensus report, market participants expect rents to continue to rise in Oslo, though at a slower pace than in 2019.
Chart 1.12 Office rents in Oslo. NOK per square metre per year Four-quarter moving average. 2008 Q4 – 2019 Q3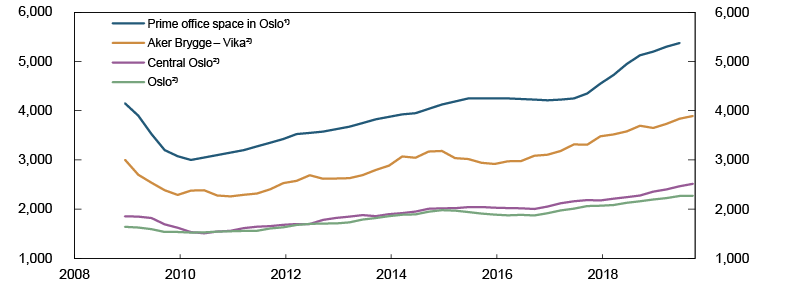
1) Market rents according to CBRE to 2019 Q2.
2) Calculated as the average rental price for signed leases, at lease signing date.
Sources: Arealstatistikk and CBRE
In line with falling interest rates, investors’ yields on CRE in Oslo fell over many years (Chart 1.13). In recent years, yields have been relatively stable. At the beginning of the year, market participants expected yields to gradually pick up in pace with the rise in long-term interest rates. When instead, long rates fell both abroad and in Norway, yield expectations also weakened somewhat. Market participants expect yields to remain broadly unchanged ahead.
Chart 1.13 Yield for prime office space in Oslo and long-term interest rates Percent. 2006 Q1 – 2019 Q31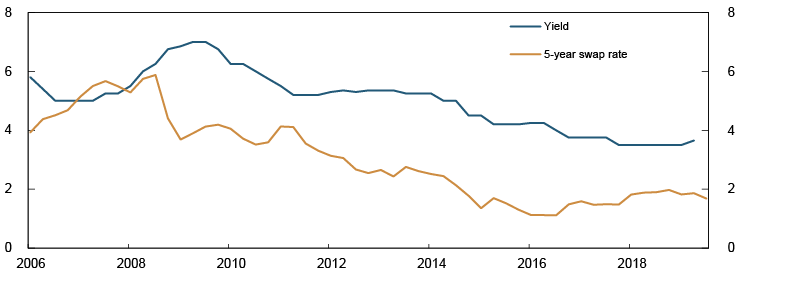
1) Yield to 2019 Q2.
Sources: CBRE and Refinitiv
Overall, market participants’ expectations regarding rental price increases and yields suggest a further slight rise in selling prices in 2019 and 2020, but at a more moderate pace (see Monetary Policy Report 3/19).
Other important vulnerabilities
Digitalisation adds to vulnerabilities
Norway is at the forefront in the use of digital financial services. This makes the financial system vulnerable to unintended operational incidents and cyber attacks. The latter are becoming increasingly widespread and sophisticated. If the financial system lacks the capacity to absorb shocks, rectify faults and ensure continuity of important economic functions, this may result in economic costs that may weaken confidence in the financial system.
Examples from the non-financial sector serve to illustrate how digital vulnerabilities may give rise to substantial losses. So far, there have been no extensive disruptions in the financial system in Norway, and the data for estimating the cost of malicious attacks and operational incidents are therefore limited. This also makes it a challenge to assess both the level of and changes in digital vulnerabilities.
Extensive outsourcing has resulted in the concentration of ICT operation and development in the hands of a small number of service providers. This entails a concentration risk that is difficult to manage for the individual financial market infrastructure owner. A disruption among critical ICT service providers may affect important components of the payment system and other critical functions.
Climate risk also impacts the financial system
Climate change and society’s response to it may affect all parts of the economy and entail risks to financial stability. Climate risk is associated with both the physical consequences of climate change and the consequences of transitioning to a low-carbon economy. In Norway, the oil and gas industry will be the most relevant source of transition-related credit risk Norge. In recent years, Norwegian banks have reduced their oil sector exposures, but the oil industry is still important (see Section 4 Climate risk).
Large losses for the banking sector overall are not likely before a structural decline in oil-related activities results in significant spillovers to the wider economy. In addition, other industries currently subject to low or no carbon pricing may be at risk if carbon pricing or emissions standards are introduced or increased. Banks are particularly vulnerable if such spillover effects affect loans secured on real estate, which constitute the largest share of banks’ exposures.
3 The decline in lending growth in Finanstilsynet’s sample of consumer credit institutions would have been smaller if it had been corrected for the sale of portfolios of non-performing consumer debt.
4 See Financial Stability Report 2018, page 16, for a summary of measures aimed at the consumer credit market.
5 For a long time, residential construction activity was lower than warranted by the increase in the number of households in isolation. So that even though residential construction activity appears to be high now, it does not appear to be excessive (see Mæhlum, S., P.M. Pettersen and H. Xu (2018) “Residential construction and household formation”. Staff Memo 12/2018. Norges Bank.
1.3 Measures to mitigate vulnerabilities
Following the financial crisis, there has been broad international cooperation to increase financial system resilience. A range of measures have been introduced in Norway (see Table 1.1), with many others being formulated or amended.
Table 1.1 Important measures to mitigate financial system vulnerabilities in Norway
|
Category |
Instrument |
First introduced |
Current level |
|
Credit standards requirements for mortgages |
Tolerate higher interest rate (stress test)1 Loan-to-value (LTV) ratio Principal repayment requirement Debt-to-income (DTI)1 ratio Flexibility quota / “speed limit”2 |
20153 20153 20153 2017 2015 |
5 percentage points 85% (60% for loans secured on secondary homes in Oslo) 2.5% annually with LTV above 60% 5 times gross income 10% (8% or up to NOK 10m for loans secured on dwellings in Oslo) |
|
Credit standards requirements for consumer credit4 |
Tolerate higher interest rate (stress test)1 Principal repayment requirement Debt-to-income (DTI)1 ratio Flexibility quota / “speed limit”2 |
20193 20193 20193 2019 |
5 percentage points Monthly principal repayment, maximum term 5 years 5 times gross income 5% |
|
Weighted capital requirements5 (share of risk-weighted assets6) |
Pillar 1 Minimum CET1 requirement Pillar 1 Minimum Tier 1 requirement Pillar 1 Minimum regulatory capital Pillar 1 Combined buffer requirements: Capital conservation buffer Systemic risk buffer Buffer for systemically important financial institutions (SIFIs) Countercyclical capital buffer Pillar 2 requirements |
2013 2013 2013 2013 2013 2015 2015 2016 |
4.5% 6% 8% 2.5% 3% 2% 2% Varies across banks |
|
Unweighted capital requirements5 (share of exposure measure) |
Leverage ratio |
2017 |
3% minimum requirement + 2% buffer requirement + 1% buffer requirement for systemically important banks |
|
Liquidity requirements |
Liquidity Coverage Ratio (LCR) LCR in individual currencies LCR in NOK |
2015 2017 2017 |
100% 100% 50% (for banks with EUR/USD as significant currencies) |
|
Minimum requirement for own funds and eligible liabilities (MREL)7 |
Loss absorption amount Amount necessary for recapitalisation8 |
2019 2019 |
Minimum requirement for regulatory capital + Pillar 2 requirements + combined buffer requirements Minimum requirement for regulatory capital + Pillar 2 requirements + combined buffer requirements excluding countercyclical capital buffer requirement |
1 The requirement pertains to the customer’s total debt.
2 Up to a certain percentage of the total value of new mortgage loans/consumer credit granted each quarter may be loans in breach of one or more of the requirements.
3 Prior to being laid down in a regulation, the requirements were issued as guidelines, for residential mortgage loans in 2010 and for consumer credit in 2017.
4 Exemption for credit cards with credit limits below NOK 25 000 and exemption for loan refinancing as long as the value of the refinanced loan (and associated costs) does not exceed the value of the existing loan (and associated costs).
5 See explanation of capital requirements in Norway’s Financial System 2019, pages 86–88.
6 A number of regulations have been introduced for banks’ calculation of risk weights, especially for residential mortgage loans.
7 Liabilities eligible for MREL must be lower in priority than senior debt. Equity capital used to meet the combined buffer requirement under Pillar 1 may not be used at the same time to meet MREL. This ensures that the buffers can function as intended.
8 Pertains only to banks subject to resolution and not liquidation under public administration.
Sources: Finanstilsynet and Ministry of Finance
Banks
Proposal to increase the systemic risk buffer
Some parts of the EU capital rules (CRR/CRD IV) have not been introduced in Norway, but are now set for inclusion in the EEA Agreement and Norwegian law. These rules will likely enter into force during 2019, and Norwegian and European rules will become more harmonised. The changes will allow banks to report higher capital ratios without raising solvency levels. In June, the Ministry of Finance circulated for comment proposed adjustments to the requirements, including increasing the systemic risk buffer from 3% to 4.5%. In its consultation response6, Norges Bank supported the increase (see Section 2 Bank profitability, solvency and funding).
Recovery and resolutions plans being finalised
On 1 January 2019, new bank recovery and resolution rules for Norwegian banks in line with the EU framework entered into force. These rules are intended to provide a solid framework for managing troubled banks. Finanstilsynet intends to finalise recovery and resolution plans for the nine most important Norwegian banks by year-end. The resolution and recovery plan for each bank will set minimum requirements for own funds and eligible liabilities (MREL) (See Section 2 Bank profitability, solvency and funding).
Households
Proposal to tighten the regulation on residential mortgage loans
The regulation on requirements for new residential mortgage loans7 is intended to mitigate the risk of a substantial increase in debt among particularly vulnerable households. In September, the Ministry of Finance circulated for comment a proposal by Finanstilsynet to retain the regulation. Finanstilsynet recommends tightening the maximum debt-to-income (DTI) ratio (from 5 to 4.5) and the flexibility quota provision (from 10% to 5%), and repeal the Oslo-specific requirements. In its consultation response8, Norges Bank supported retaining the regulation, application for an indefinite period of time and nationally consistent requirements. In Norges Bank’s opinion, the maximum DTI requirement should not be changed.
Regulation on consumer credit introduced
The authorities have issued a new regulation on prudent standards for new consumer credit (Regulation on requirements for financial institutions’ consumer credit standards9), which entered into force in February 2019 and will remain in force until the end of 2020. The requirements in the consumer credit regulation largely echo the requirements in the regulation on requirements for new residential mortgage loans. A potential tightening of the maximum DTI in the latter regulation may therefore also have consequences for the former.
Credit registers have been established
The Debt Information Act is intended to improve the credit assessments of financial institutions that lend to retail customers and prevent debt problems from arising. From 1 July 2019, financial institutions are required on a daily basis to report debt information to credit registers on retail customers with unsecured debt.
Financial infrastructure
Strengthening cybersecurity10
To enhance cyber resilience and promote financial stability, the European Central Bank (ECB) the European framework for Threat Intelligence-based Ethical Red Teaming (TIBER-EU) for testing financial institutions’ detection, protection and response capabilities against sophisticated cyber attacks. Several neighbouring countries, including Denmark and Sweden, have introduced or are preparing to introduce TIBER-EU. Finanstilsynet and Norges Bank have invited the industry and relevant authorities to a dialogue to assess the suitability of introducing TIBER-EU in Norway.11
Over the past year, a number of international organisations have published further cyber security guidelines and frameworks. On 24 September 2019, the IMF published the report Cybersecurity Risk Supervision12. EU has introduced the EU Cybersecurity Act. Work is also ongoing at the European Systemic Risk Board (ESRB) to understand systemic cyber risk in the EU and assess whether cyber incidents may pose a financial stability threat. Norges Bank is participating in this work.
Follow-up of concentration risk, supervision and contingency arrangements
The ICT Security Commission, which presented its report in December 2018, has proposed measures to enhance the organisation and regulation of national ICT security.13 In its consultation response to the Ministry of Justice and Public Security, recommends further study of concentration risk, supervisory frameworks and contingency arrangements with a view to making specific proposals to address them (see Financial Infrastructure Report 2019).
Strengthening back-up arrangements for cash
Electronic contingency arrangements are the first line of defence in the event of a disruption in the payment system. Cash is a part of overall contingency preparedness. In 2018, the Ministry of Finance laid down a regulation14 to clarify banks’ obligation to supply cash in a contingency situation. For cash to function in a contingency, it must also be available and easy to use in a normal situation as well. Norges Bank is of the opinion that the current provision of cash services is not fully satisfactory and that a regulation governing the provision of cash services in a normal situation is needed.15
6 See Norges Banks høringssvar om tilpasninger i kapitalkravene for banker [Norges Banks consultation response on adjustments to banks’ capital requirements]. 30 September 2019 (in Norwegian only).
7 See Forskrift om krav til nye utlån med pant i bolig (boliglånsforskriften) [Regulation on requirements for new residential mortgage loans] (in Norwegian only)
8 See Norges Bank’s consultation response – Assessment of the regulation on requirements for new residential mortgage loans. 14 October 2019.
9 See Forskrift om krav til finansforetakenes utlånspraksis for forbrukslån [Regulation on requirements for financial institutions’ consumer credit standards] (In Norwegian only).
10 See Financial Infrastructure Report 2019, page 21.
11 See Norges Bank and Finanstilsynet (2019) “Norges Bank og Finanstilsynet ber om innspill til ev. innføring av rammeverk for testing av cybersikkerhet i Norge” [Norges Bank and Finanstilsynet request input on the possible introduction of cyber security testing framework in Norway]. Letter to the industry. 10 October 2019 (in Norwegian only).
12 See Gaidosch, T., F. Adelmann, A. Morozova and C. Wilson (2019) “Cybersecurity Risk Supervision”. Departmental Paper 19/15. IMF.
13 See Official Norwegian Reports (NOU) 2018:14. IKT-sikkerhet i alle ledd — Organisering og regulering av nasjonal IKT-sikkerhet [ICT security at every stage – Organisation and regulation of national ICT security] (ICT Security Commission) (in Norwegian only).
14 See Forskrift om endring i forskrift 9. desember 2016 nr. 1502 om finansforetak og finanskonsern.[Regulation to amend Regulation of 9 December 2016 No 1502 on financial institutions and financial groups] (in Norwegian only).
15 See Norges Bank (2019) “Bankenes tilbud av kontanttjenester – behov for regulering i forskrift” [Banks’ provision of cash services – need for a regulation]. Letter from Norges Bank to Finanstilsynet, 13 February 2019.
Higher share of highly leveraged households
The share of households with debt exceeding five times gross income rose between 2016 and 2017. The debt-to-income (DTI) ratio for many first-time buyers was above five. Also in groups not active in the housing market there were households whose DTI rose to high levels, many of whom at the same time experienced a fall in income. Most debt is held by households in higher income deciles.
Debt accumulation is a function of homebuying
Household debt is closely linked to adjustments to the housing market. By combining household income and wealth data with data for home sales, we can study debt developments in various household groups. First-time buyers are generally more highly leveraged (higher debt relative to gross income) than other households (Chart 1.A). Other recent homebuyers are also highly leveraged. Among households who have not recently purchased a home, DTI ratios fall with age. The median pensioner and non-owner household holds little debt.
Chart 1.A Debt-to-income ratio1 By household group. 2016 and 2017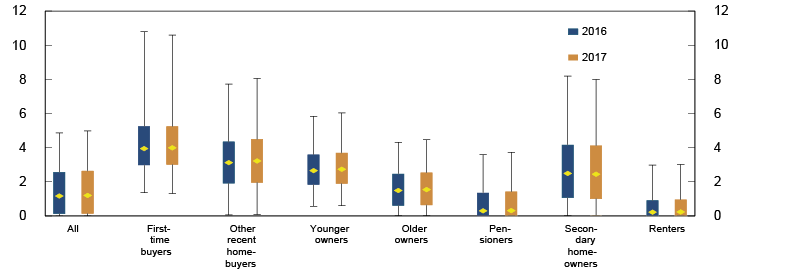
1) Debt as a share of gross income. Diamonds indicate the medians, bars the 25th to 75th percentiles and lines the 5th to 95th percentiles.
Sources: Ambita, Statistics Norway and Norges Bank
High-income households can be more highly leveraged than lower-income households and yet better able to make payments. In most household groups, most of the debt is held by households in higher income deciles (Chart 1.B). This is particularly evident among buy-to-let investors in secondary homes. The exceptions are first-time buyers, pensioners and renters. First-time buyers are young households that can generally expect higher income growth than older households.
Chart 1.B Debt by income decile. Share of total debt held by each household group Percent. 2017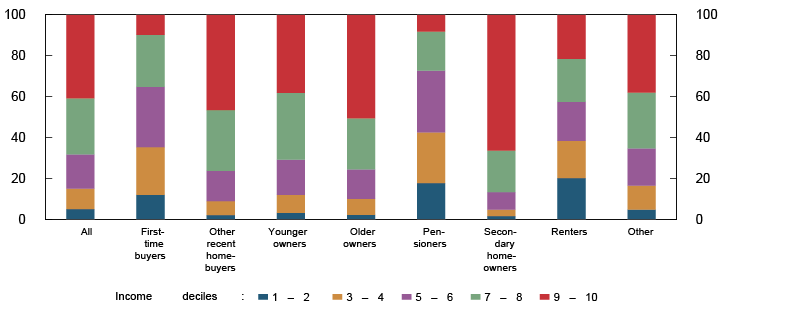
Sources: Ambita, Statistics Norway and Norges Bank
Households that purchased a home in 2016 or 2017 account for close to 5% of all households and hold approximately 10% of total debt (Table 1.A). Homeowners who have not recently purchased a home in the past two years hold close to 80% of total debt. Renters and others, who account for nearly a third of households, hold the remaining 10%.
Table 1.A. Household groups.1 2017
|
Category |
Age |
Relationship with housing market |
Percent of all |
Percent of total debt |
|
First-time buyers |
20–34 |
Purchased in 2017. Not registered as owning in the two previous years. |
1.1 |
2.0 |
|
Recent homebuyers (excluding first-time buyers) |
20–90 |
Purchased in 2016 or 2017 and registered as owning in these years. |
3.1 |
7.5 |
|
Younger owners |
20–90 |
Registered as owning in 2016–2017, but did not purchase in these years. |
19.7 |
36.4 |
|
Older owners |
20–44 |
Registered as owning in 2016–2017, but did not purchase in these years. |
25.0 |
31.0 |
|
Pensioners |
45–64 |
Registered as owning in 2016–2017, but did not purchase in these years. Pension primary income source. |
16.2 |
5.7 |
|
Secondary homeowners |
65–90 |
Registered as a secondary homeowner and with rental income. |
2.5 |
6.2 |
|
Renters |
20–90 |
Not registered as owning in 2016–2017. |
27.5 |
7.2 |
|
Others |
20–90 |
4.9 |
4.1 |
1 Groups are mutually exclusive. Self-employed persons and some outliers have been omitted. The sample comprises 2.2m households in 2017.
Sources: Ambita, Statistics Norway and Norges Bank
DTIs rose between 2016 and 2017
Between 2016 and 2017, DTIs rose in all household groups except for renters. In this period, there was a rise in the share of households with a DTI above five and in the share of debt held by these households (Chart 1.C).
Chart 1.C Share of households with a DTI1 ratio higher than five and share of debt held by these households. Percent. 1987 – 2017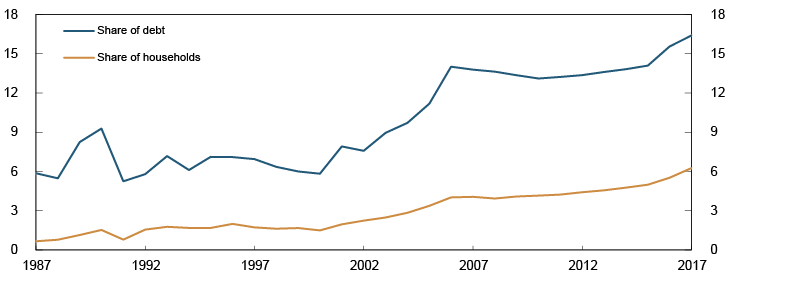
1) Debt as a share of gross income.
Sources: Statistics Norway and Norges Bank
The DTIs of around 2% of the households rose from below five in 2016 to above five in 2017 (Chart 1.D). Close to 40% of them are homeowners who are not recent homebuyers. For a large proportion of these homeowners, a fall in income pushed up their DTI. Among first-time buyers and other recent homebuyer households, a far smaller share experienced a fall in income at the same time as their DTI increased to above five.
Chart 1.D Households whose DTI1 rose to above five in 2017. Share of households in each household group. Percent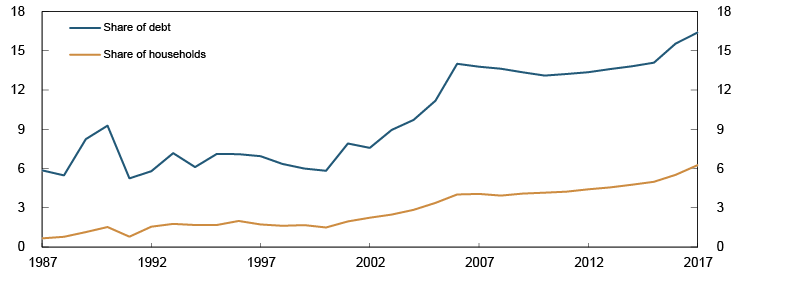
1) Debt as a share of gross income.
Sources: Ambita, Statistics Norway and Norges Bank
In 2017, a requirement for a maximum DTI of five was added to the regulation on new residential mortgage loans. Banks’ reporting to Finanstilsynet1 indicates that a substantial portion of the flexibility quota in the regulation is used for loans that breach the maximum DTI and that priority is given to young homebuyers. A number of banks have also stated they give priority to existing customers experiencing a change in circumstances, such as a divorce etc. This contributes to a larger proportion with a DTI above five among these household groups. According to calculations using the combined data from Statistics Norway and Ambita, a good 25% of first-time buyers took on debt corresponding to a DTI above five in 2017.
1 See Finanstilsynet’s consultation response on the regulation on new residential mortgage loans, 10 September 2019 (in Norwegian only).
Credit register data show uneven distribution of consumer debt
Credit register data show that around a quarter of the population had consumer debt in one form or another at the end of September 2019. Consumer debt is unevenly distributed. Most consumer loans are small, but for a small minority, consumer debt was very large.
From 1 July 2019, financial institutions must report unsecured personal loans to the credit registers. The credit registers provide details on an individual’s unsecured debt. The registers record all debts not secured by a registered security interest. Credit registers enable financial institutions to make a more accurate assessment of a borrower’s creditworthiness, and give borrows easier access to details regarding their own debts. The authorities also obtain a more granular overview of the overall vulnerabilities and risks associated with unsecured debt in Norway.
To distinguish consumer debt from other unsecured debt1 “consumer debt” is restricted here to debt carrying an interest rate above 8%. Consumer debt consists of instalment loans with a contractual repayment period and credit card debt. Credit card holders can draw on a line of credit up to an agreed limit without needing creditor approval. Amounts drawn are often interest-free until after a grace period. At the end of September, the average credit card holder had drawn on around 30% of the total credit line available. Approximately 30% of the amount drawn was interest-free. Interest-free balances are assumed to be payment transactions and are not a part of consumer debt.
Many have consumer debt – just a few owe very large amounts
In principle, access to consumer credit is a good that gives households financial flexibility. According to the credit register, consumer debt outstanding accounted for around 3.5% of total domestic household debt at the end of September. A good quarter of the population over age 18 had interest-bearing consumer debt. Among the youngest and oldest age cohorts, there are far fewer with consumer debt (Chart 1.E).
Chart 1.E Persons with consumer debt outstanding as a share of the population Percent. Consumer debt per person. In thousands of NOK. By age. At 30 September 2019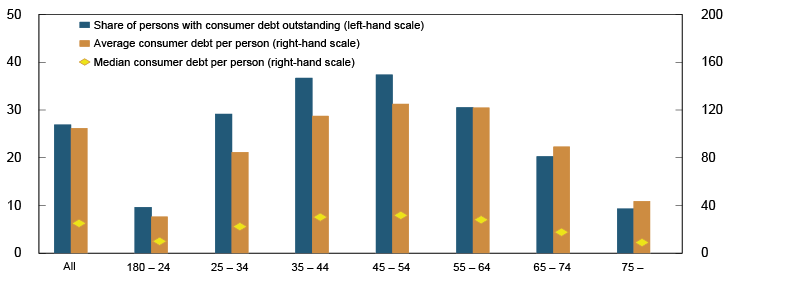
Sources: Gjeldsregisteret AS and Norges Bank
Consumer debt is unevenly distributed. Half of borrowers had consumer debt balances of NOK 25 000 or less, but all together they held below 5% of total consumer debt (Chart 1.F). Nearly all balances below NOK 25 000 comprise credit card debt (Chart 1.G). A quarter of borrowers had balances of between NOK 25 000 and NOK 100 000. This debt is also predominantly credit card balances. The last quarter had balances of above NOK 100 000, primarily in the form of instalment loans. Instalment loans account for around 60% of total consumer debt.
Chart 1.F Distribution of persons with consumer debt outstanding and consumer debt balances held by these persons By amount of consumer debt in NOK. Percent. At 30 September 2019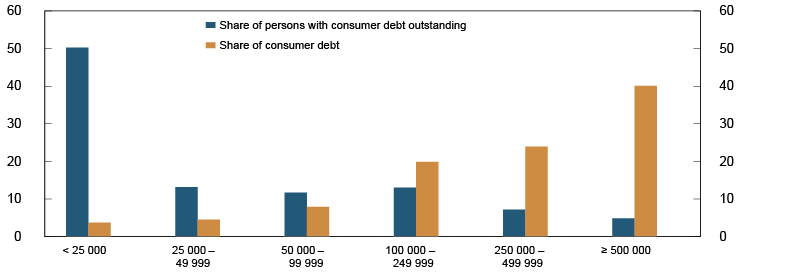
Sources: Gjeldsregisteret AS and Norges Bank
Chart 1.G Consumer credit By credit type and unpaid balances in NOK. In billions of NOK. At 30 September 2019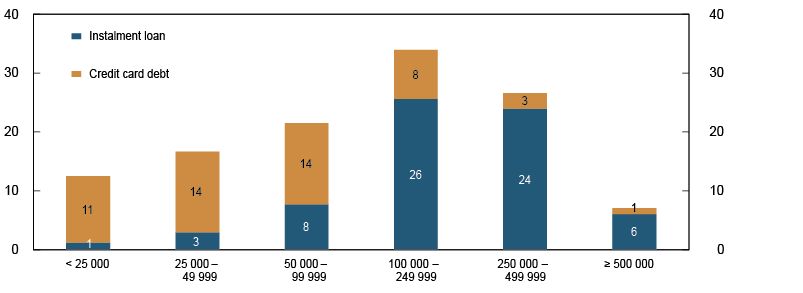
Sources: Gjeldsregisteret AS and Norges Bank
Low-value debt carries high interest rates and is repaid quickly
Consumer loans that are repaid after a short period have a limited total cost. Nevertheless, if the loan balance is large relative to income, covering interest expenses may be difficult. Once a borrower runs into repayment difficulties, interest compounding can quickly magnify the problem. Interest rates above 8% are high compared with a typical residential mortgage rate of around 3%. A considerable share of loan balances outstanding carried an interest rate far higher than 8% (Chart 1.H).
Chart 1.H Consumer credit By credit type and interest rate. In billions of NOK. At 30 September 2019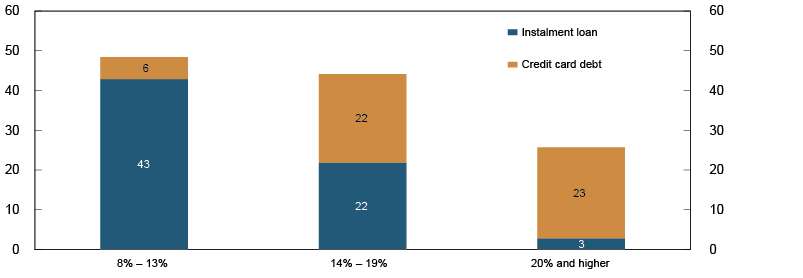
Sources: Gjeldsregisteret AS and Norges Bank
Nearly 20% of those with loan or credit card balances under NOK 50 000 at the beginning of September had repaid them by the beginning of October (Chart 1.I). For those with loan balances above NOK 100 000, under 1% had repaid the entire balance in the following month.
Chart 1.I Persons who had repaid their entire consumer debt balances by the beginning of October 2019 By amount of debt in NOK. Percentage of those with consumer debt balances at the beginning of September 2019 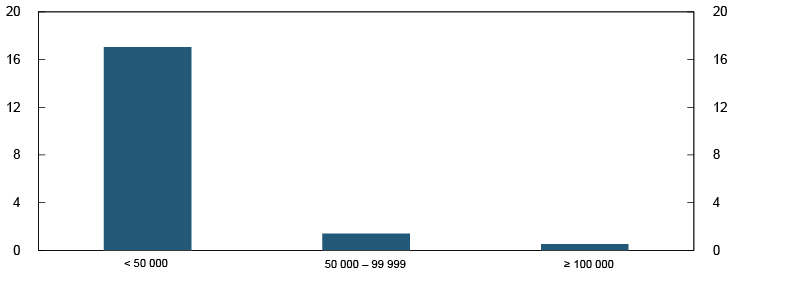
Sources: Gjeldsregisteret AS and Norges Bank
Consumer credit banks extend the most credit
Financial institutions that specialise in consumer financing – “consumer credit banks” – accounted for over half of total consumer credit at the end of September (Chart 1.J). Financial institutions where consumer financing is only one of several products – “traditional banks” – accounted for around one-third of consumer credit. Consumer credit banks and traditional banks both sell portions of their non-performing credit card and loan portfolios to finance companies that specialise in purchasing non-performing debt. Such finance companies held 10% of total consumer debt.
Chart 1.J Consumer credit By credit and lender type. In billions of NOK. At 30 September 2019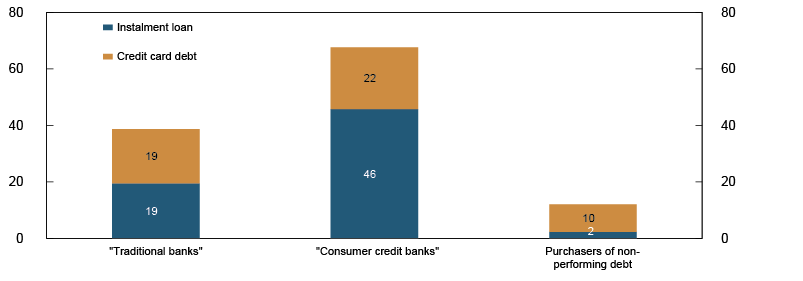
Sources: Gjeldsregisteret AS and Norges Bank
1 The data have been obtained from Gjeldsregisteret AS. Not all unsecured debt is consumer debt. For example, banks provide bridge financing in connection with home purchases as an unsecured loan at a relatively low interest rate under the assumption that collateral will be pledged within a short time. Many of the largest loans in the credit register carry an interest rate of below 5%.
New rental price index for commercial real estate in Oslo
Norges Bank has long used selling prices for prime office space in Oslo as an important indicator of developments in financial imbalances. However, limited availability of data has made it difficult to assess whether price developments in this segment are representative of the overall commercial real estate market. On the basis of an enlarged dataset, the Bank has developed a quality-adjusted rental price index that indicates a higher rise in rental prices for prime office space in the recent period than for the office space market in Oslo as a whole.
The commercial real estate (CRE) market is important for financial stability. However, available data are limited and of varying quality. Norges Bank therefore uses several sources to obtain the best possible overview of developments in the sector. Important market indicators are yield, rental and selling prices. Selling prices for prime office space in Oslo is regarded to be a particularly important indicator of CRE market vulnerabilities, because these prices have historically risen sharply ahead of financial crises. Selling prices are estimated as rental prices divided by yield. The yield for prime office space in Oslo is often used as a benchmark for pricing other office space. Even though prime office space in Oslo is an important segment, it will not necessarily provide a representative picture of sector developments.
A new quality-adjusted index shows differences in rental price developments
In its work to improve the basis for its CRE sector analyses, the Bank has developed quality-adjusted rental indexes for office space in Oslo. The indexes are calculated with the aid of rental price data based on actual leases that cover a large part of the office market in Oslo.1 Quality-adjusted indexes result in more comparable rental prices than indexes based on average rents.2 Average rents are affected by whether a relative large number of leases have been signed for attractively located or high-quality office space, for example. Differences in such attributes should not influence a rental price index, and the quality-adjusted index takes this into account. For Oslo as a whole, the quality-adjusted index shows a somewhat more pronounced rise prior to the financial crisis and weaker price developments in the period 2013 to 2015 than developments in the average (Chart 1.K).
Chart 1.K Office rents in Oslo.1 Four-quarter moving average. Index. 2011 Q1 = 100. 2005 Q1 – 2018 Q4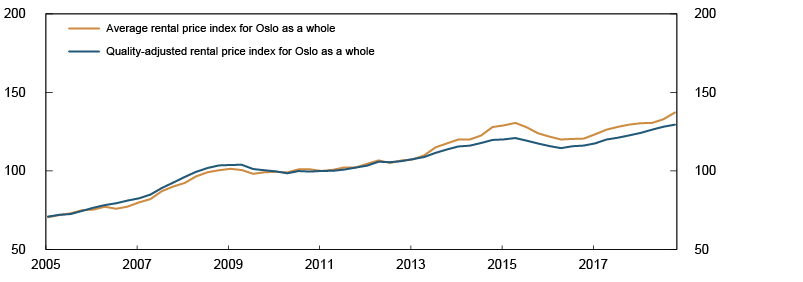
1) Based on signed leases, at lease inception date.
Sources: Arealstatistikk and Norges Bank
To assess whether developments in the established rental price index for prime office space in Oslo are representative, they were compared with the quality-adjusted rental indexes for Oslo and for Aker Brygge-Vika (Chart 1.L). The Aker Brygge-Vika index covers broadly the same geographical area as the established index but also includes less attractive office space. All indexes have moved in the same direction since 2005. However, the established index fluctuated more around the time of the financial crisis and has recently shown a sharper rise than both quality-adjusted indexes.
Chart 1.L Office rents in Oslo.1 Four-quarter moving average. Index. 2011 Q1 = 100. 2005 Q1 – 2018 Q4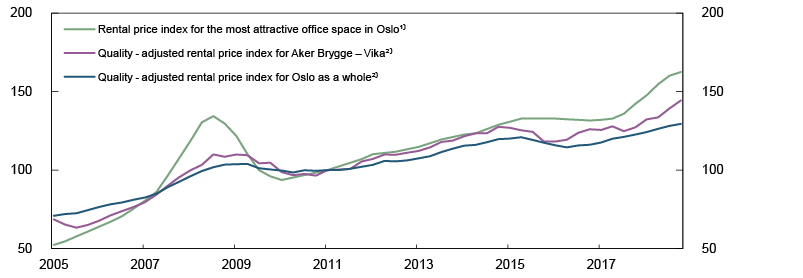
1) Market rents according to CBRE. 2) Based on signed leases, at lease inception date.
Sources: Arealstatistikk, CBRE and Norges Bank
1 The data are collected by the company Arealstatistikk.
2 See Anundsen, A. and M. Hagen (2019): “Hedonic indices for rental prices in the Oslo office market” Forthcoming Working Paper. Norges Bank. The index is hedonic, which means that rental prices depend on a number of attributes that must be controlled in order to make these prices comparable. The rental price index is calculated as the relationship between two equally attractive offices at time t compared with the base year.
Should a CBDC be introduced in response to changes in the payment system?
New regulations, new operators and new technologies will transform the payment system ahead. At the same time, cash usage is falling. Norges Bank is considering whether introducing a central bank digital currency may be desirable.
Access by the public to central bank money is a key feature of the payment system. This access is currently provided for by cash. But at some point, cash usage may become so low that despite its status as legal tender, cash may no longer be considered a generally available means of payment. To ensure a secure and efficient payment system and confidence in the monetary system also in the future, Norges Bank is analysing the feasibility of introducing a central bank digital currency (CBDC). In summer 2019, a Norges Bank working group published its second report on CBDCs1.
Deposit money is a secure means of payment, but a CBDC may be a good back-up solution and promote competition
In its second report, the working group concluded that introduction of a CBDC does not seem necessary to ensure the public access to a secure means of payment. The regulatory framework for the financial system already provides for this, and the deposit money created by banks is a secure means of payment. Within the deposit guarantee, there is no credit risk.
The working group believes that the contingency preparedness aspect may be an argument for introducing a CBDC. A CBDC can secure technical autonomy from ordinary payment systems and sufficient national control. A CBDC can also offer competition with private payment solutions in a situation where competition proves weak. Finally, a CBDC can be useful for ensuring access to legal tender in the Norwegian financial system. The payment system and means of payment may evolve in a different direction or at a different pace than can be currently foreseen. A precautionary approach may warrant practical preparations in order to keep open the possibility of introducing a CBDC.
A possible design of a CBDC is now being studied
On the condition that deposit money will continue to be a substantial part of bank financing, also if a CBDC is introduced in Norway, the working group is considering two different models for a CBDC.
- One model is a “register-based” solution. Unlike deposit money, control over register-based “tokens” is not based on an account linked to a personal identity. Funds may be used by the party in possession of an access code. This solution will also need to facilitate compliance with anti-money laundering rules.
- An alternative is a “closed account” solution. In it, both payer and payee must have a CBDC account. The CBDC may then be regarded as e-money issued by a public entity (and not by an e-money institution like PayPal).
The working group is considering both models with respect to fitness for purpose and to possible undesired consequences for financial stability.
The ongoing study of the design of a CBDC is part of a long-term effort, and Norges Bank will monitor international thinking in this area. More information is needed before a conclusion can be drawn that introducing a CBDC is a desirable measure for promoting a secure and efficient payment system and continued confidence in the monetary system. Norges Bank will continue to issue cash as long as it is appropriate.
1 See Norges Bank (2019) “Central bank digital currencies” Norges Bank Papers 2/2019.
2 Bank profitability, solvency and funding
For Norwegian banks, credit losses are low and profitability is solid. Sustained profitability is expected in the coming years. Downside risks are higher losses and reduced margins owing to increased competition between banks and from new entrants.
Banks are solid and fulfil the capital requirements. The remaining parts of the EU capital framework will likely be implemented soon in Norway. Norwegian and European rules will then become more harmonised.
Norwegian banks have ample access to funding. They satisfy liquidity requirements and their vulnerability to a dry-up of short-term foreign currency funding is reduced. Finanstilsynet (Financial Supervisory Authority of Norway) aims to set resolution plans and requirements for own funds and eligible liabilities for the nine most important Norwegian banks by year-end 2019. In Norway, future regulations may permit securitisation, which is a new funding source for lending.
Banks play a key role in the economy and perform important tasks such as channelling funds, executing payments and distributing risk efficiently. Banks’ ability to absorb credit losses depends on underlying profitability and solvency. Robust liquidity is also important in order for banks to carry out their tasks well, even during periods of funding market stress.
2.1 Profitability
Continued solid profitability among Norwegian banks
The large Norwegian banks have maintained their profitability over the past year and are, together with Swedish banks, at a high level compared with other European banks (Chart 2.1).
Chart 2.1 Return on equity after tax. Large Norwegian banking groups1 and European2 banks Four-quarter moving weighted average. Percent. 2016 Q1 – 2019 Q2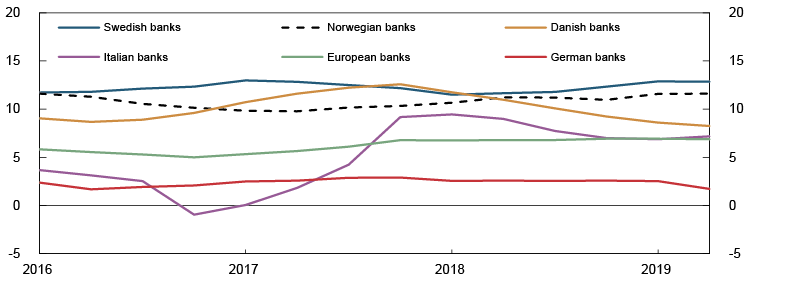
1) Weighted average of DNB Bank, Nordea Bank Norge (to 2016 Q4), SpareBank 1 SR-Bank, Sparebanken Vest, SpareBank 1 SMN, Sparebanken Sør (from 2016 Q1), SpareBank 1 Østlandet (from 2016 Q3) and SpareBank 1 Nord-Norge. Consolidated figures.
2) Based on a sample of 150 European banks. The sample varies over time.
Sources: European Banking Authority (EBA), Norwegian banking groups' quarterly and annual reports and Norges Bank
Stable net interest income and low credit losses have enabled Norwegian banks to maintain profitability (Chart 2.2). Banks’ primary revenue source is net interest income from traditional banking. The increase in net interest income improved the profitability of the largest Norwegian banks in 2017, 2018 and in the first half of 2019 (Chart 2.3). Lending rates have risen more than deposit rates, resulting in higher interest margins in recent quarters.
Chart 2.2 Decomposed change in profits. Large Norwegian banking groups1 As a percentage of average total assets. 2009 Q1 – 2019 Q2
1) Weighted average of DNB Bank, Nordea Bank Norge (to 2016 Q4),
SpareBank 1 SR-Bank, Sparebanken Vest, SpareBank 1 SMN, Sparebanken Sør (from 2014 Q1), SpareBank 1 Østlandet (from 2016 Q3) and SpareBank 1 Nord-Norge.
2) Commission income from part–owned mortgage companies in the SpareBank 1–alliance has been reclassified from other operating income to net interest income.
Sources: Bank's quarterly reports and Norges Bank
Chart 2.3 Estimated contributions to changes in large Norwegian banking groups'1 return on equity after tax Four-quarter moving weighted average of annualised return. Percentage points. 2016 Q1 – 2019 Q2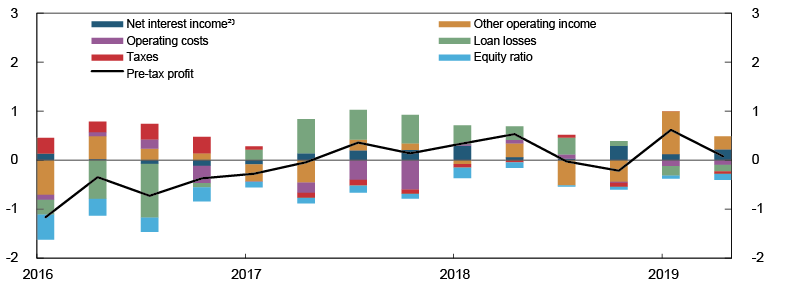
1) Weighted average of DNB Bank, Nordea Bank Norge (to 2016 Q4), Sparebank 1 SR-Bank, Sparebanken Vest, Sparbanken Vest, SpareBank 1 SMN, Sparebanken Sør (from 2014 Q1), SpareBank 1 Østlandet (from 2016 Q3) and SpareBank 1 Nord-Norge.
2) Commission income from part–owned mortgage companies in the SpareBank 1–alliance has been reclassified from other operating income to net interest income.
Sources: Banks' quarterly reports and Norges Bank
Profitability expected to be maintained
Mainland GDP is expected to slow somewhat in the coming years (see Monetary Policy Report 3/19). Bank analysts’ average projection of the largest banking groups’ profitability for the coming years is at broadly the same level as in recent years (Chart 2.4). Norges Bank’s bankruptcy probability model1 indicates that banks’ credit risk on loans to non-financial enterprises will be fairly stable in 2019 and increase slightly in 2020. With prospects for continued low credit losses and the absence of major economic shocks, banks as a whole are therefore expected to maintain solid profitability in the coming years.
Chart 2.4 Analysts' estimates of return on equity in large Norwegian banking groups1 Percent. At 31 October 2019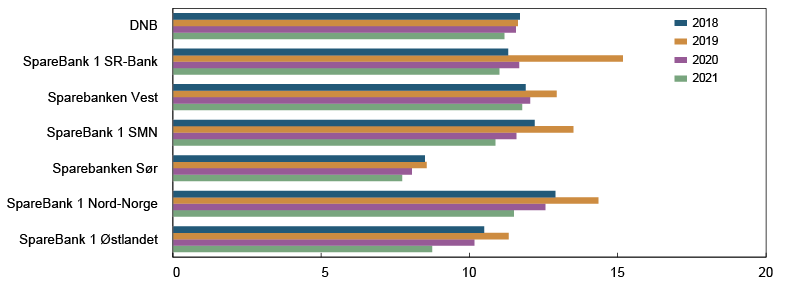
1) As reported in banks' annual reports in 2018. The high profitability in 2019 reflects extraordinary revenues.
Sources: Banks' annual reports and Bloomberg
European banks’ profitability under pressure from negative interest rates
The profitability of large Danish banks has weakened in recent quarters (Chart 2.1), owing in part to the low interest rate level. Swedish, Danish and euro area money market rates have been negative since 2015. Banks are reluctant to offer negative deposit rates as depositors have the option of withdrawing their deposits in cash rather than pay a negative deposit rate. In spite of negative money market rates, average Swedish and Danish deposit rates are not negative.
Since banks’ wholesale funding includes a risk premium on top of the money market rate, the interest rate on wholesale funding can be positive even when the money market rate is negative. With deposit rates close to zero, wholesale funding costs will account for most of banks’ total interest expenses. This was the case for Handelsbanken, Swedbank, Danske Bank and Nordea in the period 2016–2018 (Chart 2.5). Deposit rates in Norway are positive, and for DNB deposit costs account for a large share of interest expenses. With a deposit rate close to zero, a further reduction in the interest rate level will likely merely reduce the cost of wholesale funding.
Chart 2.5 Large Nordic banking groups' interest expenses, interest income and net interest income As a percentage of total assets. 2016–2018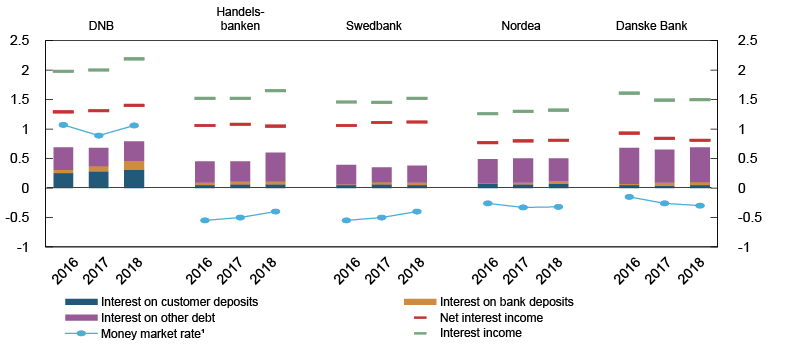
1) 3-month Nibor, Stibor, Cibor and Euribor.
Sources: SNL / S&P MI, Refinitiv and Danske Bank's annual report
Reduced operating costs or increased revenue may compensate for the cost disadvantage of a limited pass-through to deposit rates when the money market rate is negative. Revenue can primarily be increased through higher lending growth, higher fees and higher lending margins. Banks in Sweden have kept their lending rates elevated, which has contributed to sustaining the level of net interest income (Chart 2.6). In Denmark, the low level of interest rates and falling interest margins have resulted in lower net interest income.2 Fee income has been relatively stable in Norway, Sweden and Denmark.
Chart 2.6 Operating income for selected banking groups in Norway, Sweden and Denmark1 As a percentage of total assets. 2010 Q2 – 2019 Q2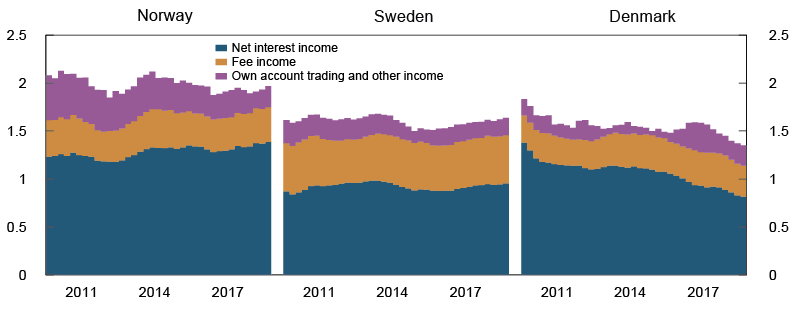
1) Norwegian banks: DNB, SpareBank 1 SR-Bank, SpareBank 1 SMN, SpareBank 1 Nord-Norge and Sparebanken Vest. Swedish banks: Handelsbanken, SEB and Swedbank. Danish banks: Danske Bank, Jyske Bank, Spar Nord Bank and Sydbank.
Source: SNL / S&P MI and Norges Bank
If interest rates remain very low or negative over a long period, structural changes may result in the financial system, which could also impact banks.3 Over time, depositors may opt for higher-risk investments, such as mutual funds, rather than keep their money in a bank at zero interest. Low interest rates over an extended period may also fuel a credit-driven rise in prices for assets such as equities and real estate. Low interest rates also make it difficult for pension and insurance companies to meet the rate-of-return guarantees for their pension products.
Risk of increased losses
Some uncertainty still remains about the need for further restructuring in oil-related enterprises. Such restructuring has inflicted losses on banks in recent years. The losses proved to be somewhat lower than initially expected following the fall in oil prices in 2014, and spillovers to other sectors have been more modest than assumed. Persistent overcapacity in segments of the oil service industry may lead to further restructuring accompanied by losses, since the debt-servicing capacity of many oil service companies has weakened in recent years (Chart 2.7). Banks’ direct oil-related exposures are nevertheless limited and account for less than 5% of total exposures (see "Banks and the experience gained from the downturn in the oil industry").
Chart 2.7 Debt-servicing capacity1 in the oil service industry Percent. 2014 Q1 – 2019 Q2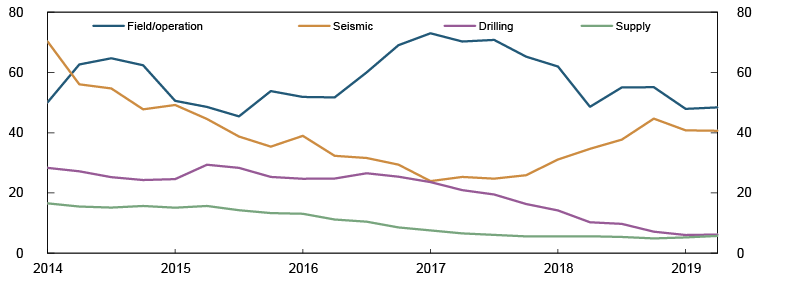
1) Earnings before interest, taxes, depreciation and amortisation (EBITDA) for the last four quarters as a percentage of net interest-bearing debt. The EBITDA measure has been standardised by Bloomberg. Manual adjustments for EBITDA have been made where erroneous registrations appear in Bloomberg's measure.
Sources: Bloomberg, company quarterly and annual reports and Norges Bank
A substantial share of banks’ exposures is to commercial real estate (CRE) (Chart 3.8). Commercial property prices are at a high level (Chart 1.11). The rise in prices has often been strong prior to a substantial fall. Even though losses have historically been low in normal times, CRE is the sector where banks have historically incurred the larges losses during crises. The stress test in Section 3 shows banks’ vulnerability to CRE losses in the event of a pronounced downturn in the Norwegian economy.
Prospects for increased competition
Technological and regulatory developments are allowing the competitive landscape to change with the entry of new service providers in areas that are important for banks’ profitability.
Crowdfunding, or extending credit through digital platforms, is an example of how new participants can impact competition in the credit market. The extent of crowdfunding so far has been very limited and had no impact on banks’ profitability in Norway. In spring 2019, Norges Bank conducted a survey of all active participants engaged in debt- and equity-based crowdfunding in Norway.4 Debt-based crowdfunding accounts for the largest share of financial crowdfunding.5 Total lending in the period between 2018 Q1 and 2019 Q1 amounted to approximately NOK 110m (Chart 2.8). Lending to real estate projects and enterprises account for the largest share of lending. The share of consumer credit was approximately 5% and is growing.
Chart 2.8 Cumulative lending by crowdfunding companies by sector. In millions of NOK 2018 Q1 – 2019 Q1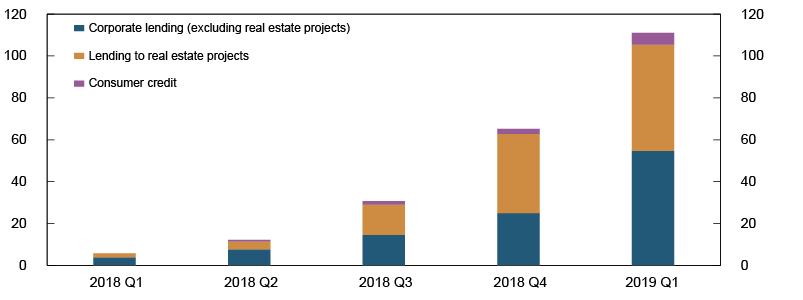
Source: Norges Bank
The revised Payment Services Directive (PSD2) entered into force in Norway on 1 April 2019.6 PSD2 may provide customers with improved and less expensive banking services. The Directive permits third-party providers (TPPs) to offer account information services (AIS) and execute payments on behalf of banks’ customers. The TPPs are either new entrants or banks that already operate in the market. This may promote new services that facilitate comparison shopping for banking services. For example, a number of banks have upgraded their online banking platforms to enable customers to view multi-bank account details under a single portal.
By improving market transparency, PSD2 may promote competition in banking services and put pressure on banks’ interest margins and fee income. The effects of PSD2 on banks’ income will depend on how they adapt. Banks may strengthen customer loyalty by changing their services so that they are less vulnerable to increased competition. An example of this is customer dividends, which savings banks, for example, distribute to customers on the basis of amounts borrowed or on deposit over the preceding year. Banks may also offer customers benefits for purchasing services with lock-in periods or for purchasing bundled products.
If profitability in the Norwegian banking market continues to be higher than what foreign banks are able to attain in their domestic markets, foreign banks may want to increase their activity in the Norwegian market. Increased competition from foreign banks may put pressure on interest margins and reduce profitability in the Norwegian banking market. Foreign-owned banks and foreign branches already have a substantial share of both the retail and corporate lending markets (Chart 2.9).
Chart 2.9 Market shares measured by gross lending Large banking groups in Norway. Percent. At 31 December 2018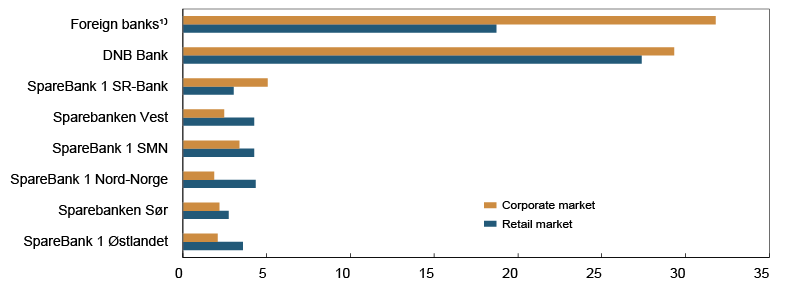
1) Nordea, Danske Bank and Handelsbanken.
Source: Norges Bank
Material differences in risk weights for commercial real estate exposures
The risk weights that banks use for their commercial real estate (CRE) exposures range from 100% for standardised approach banks to a 23% average risk weight for large Swedish banks1. Norwegian IRB banks fall in between. Risk weights affect the amount of capital banks must hold. The share of CRE loans that a bank must finance using Common Equity Tier 1 (CET1) capital is estimated by multiplying the bank’s CET1 capital requirement with its average risk weight for CRE exposures and then put on an add-on for operational risk. The calculated share varies between 4% for large Swedish banks and 17% for the Norwegian standardised approach banks (Chart 2.13).2
The considerable variation in risk weights for CRE exposures may have a number of explanations. One might be different portfolio compositions across banks. The market for lending to CRE companies is heterogeneous, and credit risk on these exposures can vary considerably. Some banks’ borrowers have lower credit risk, and therefore their CRE exposures have lower risk weights than those of other banks. Another possible explanation for the variation is that banks employ different methods and risk models. This may result in different risk weights for comparable exposures.
The authorities in a number of European countries have introduced minimum risk weight requirements. According to a preliminary assessment by the Swedish supervisory authority, the average risk weight for CRE exposures should be increased to a minimum of 30%. The Ministry of Finance’s proposed 35% minimum risk weight requirement for Norwegian CRE exposures is at or below the average risk weight of Norwegian IRB banks.
1 See Finansinspektionen (2019), “Stability in the Financial System (2019:1)”.
2 For a further description of the calculations, see Andersen, H. (2019) “How much capital must banks set aside for CRE exposures?” (forthcoming in English). Staff Memo [10/2019]. Norges Bank. In this Memo, capital requirements are assessed against CRE losses during the banking crisis.
1 The model is described in Hjelseth, I.N. and A. Raknerud (2016), “A model of credit risk in the corporate sector based on bankruptcy prediction”, Staff Memo 20/2016, Norges Bank. The model primarily covers industries in mainland Norway.
2 See Danmarks Nationalbank (2019) Financial Stability – 1st half 2019, page 7.
3 The consequences of very low and negative interest rates are also discussed in Section 6 of Financial Stability Report 2016 and in European Systemic Risk Board (2016) “Macroprudential policy issues arising from low interest rates and structural changes in the EU financial system”.
4 See Bankplassen blog, Fahre, B. and Y. Søvik “Folkefinansiering vokser i Norge – hvordan kan norske myndigheter være forberedt?” [Crowdfunding is growing in Norway – How can the Norwegian authorities be prepared?] (in Norwegian only).
5 In the equity-based crowdfunding segment, the data are too limited to show any clear trends in recent years.
6 See the 2019 Financial Infrastructure Report for a further description of PSD2.
2.2 Solvency
Banks have increased their Common Equity Tier 1 (CET1) ratios since the financial crisis in 2008 (Chart 2.10), primarily by retaining earnings. In 2018, banks’ capital ratios were broadly unchanged, even though their profitability was solid. The dividend payout ratios for most of the large banks were, with few exceptions, unchanged in 2018 compared with 2017. Increased lending, including corporate lending, resulted in an increase in risk-weighted assets and kept capital ratios unchanged. Nevertheless, all Norwegian banks fulfil the capital requirements. The large banks’ CET1 capital ratios are near their long-term capital targets (Chart 2.11). The stress test shows that Norwegian banks have sufficient capital to absorb losses in the event of a hypothetical pronounced downturn in the Norwegian economy (See Section 3 Stress test).
Chart 2.10 Norwegian banks' Common Equity Tier 1 (CET1) capital ratios1 Share of risk-weighted assets and total assets. Percent. 1996–2018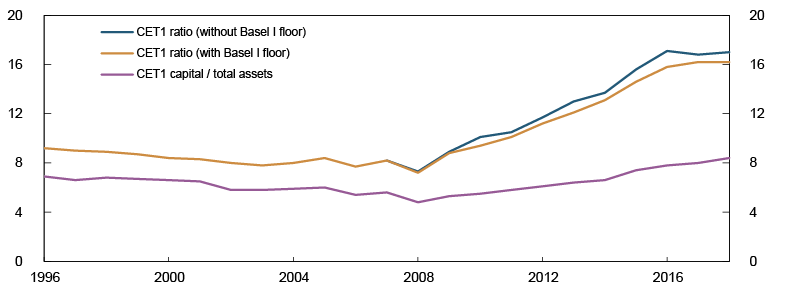
1) Consolidated figures where available. Parent banks otherwise.
Source: Finanstilsynet (Financial Supervisory Authority of Norway)
Chart 2.11 Largest Norwegian banking groups' Common Equity Tier 1 capital ratios, leverage ratios and long-term capital targets Percent. At 30 June 2019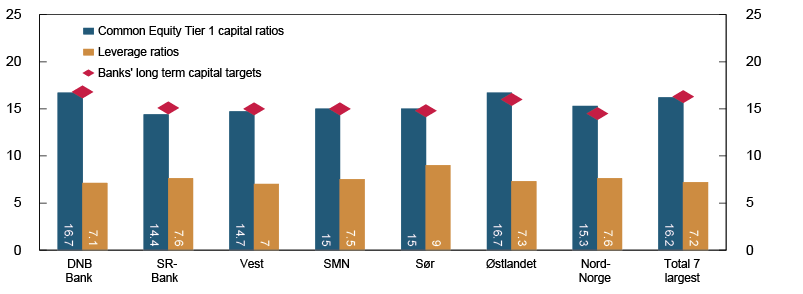
Sources: Banks’ quarterly reports and Norges Bank
Norges Bank supports the Ministry of Finance’s proposed changes to capital requirements
The remaining portions of the EU capital framework (CRR/CRD IV) will likely be implemented in Norway soon. Norwegian and EU rules will then become more harmonised. As a part of this, the capital requirement for exposures to small and medium-sized enterprises will be reduced (SME discount). The SMB discount will provide the greatest capital relief to banks using the standardised approach, with high shares of SME exposures. In addition, rules will be relaxed for banks using internal ratings-based models (IRB banks), which will not be required to use the Basel I floor for risk-weighted assets when calculating their capital ratios. Both of these changes will allow banks to report higher capital ratios without changing solvency levels. For the largest IRB banks, the removal of the Basel I floor will have the most pronounced impact (Chart 2.12).
Chart 2.12 Effects of introducing CRR/CRD IV on CET1 ratios. Largest Norwegian banking groups Percentage points. At 30 June 2019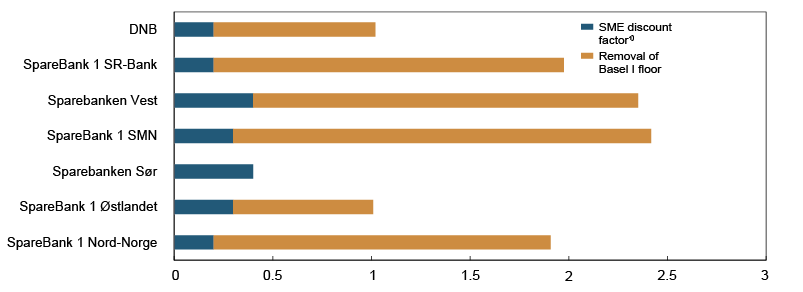
1) Banks' estimates.
Source: Banks' quarterly reports and presentations
In June, the Ministry of Finance circulated for comment proposed adjustments to the capital requirements for banks, with a consultation closing date of 30 September. The proposed adjustments are intended to keep the capital requirements at a level that corresponds to risks in the Norwegian economy. The proposal also entails an increase in the systemic risk buffer from 3.0% to 4.5%. The Ministry has also proposed a temporary 35% floor for average risk weights for Norwegian commercial real estate (CRE) exposures, reflecting the wide variation in the risk weights for CRE exposures and thus the amount of capital underlying them (Chart 2.13 and "Material differences in risk weights for commercial real estate exposures").
Chart 2.13 Banks' average risk weights for commercial real estate (CRE) exposures Required share of CRE exposures financed by CET1.1 Percent. At 31 December 2018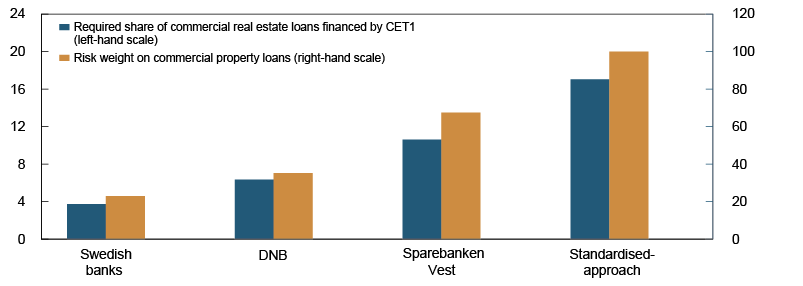
1) The total CET1 requirement is the sum of Pillar 1 requirements, hard Pillar 2 requirements and soft Pillar 2 requirements. A soft Pillar 2 requirement of 1% is assumed for Norwegian banks. The hard Pillar 2 requirement for standardised-approach banks is equal to the equally weighted average of the requirement for 79 Norwegian standarised-approach banks.
Sources: Banks' Pillar 3 reports, Finansinspektionen and Norges Bank
The Ministry of Finance intends to ask the European Systemic Risk Board (ESRB) to issue a recommendation to EU member state authorities to recognise the Norwegian requirements so that they will also apply to foreign banks with operations in Norway. This is desirable for financial stability reasons and for securing a level playing field for Norwegian and foreign banks. Norges Bank holds the view that it will be natural to apply the current systemic risk buffer rate in the host country.
Norges Bank supports the proposed increase of the systemic risk buffer.7 The Bank also supports the principle that the systemic risk buffer should be reviewed every other year and in this regard, will perform necessary assessments of systemic risk. Banks have substantial exposures to the real estate sector, through both residential mortgages and CRE loans. These exposures have increased since the systemic risk buffer requirement was introduced in 2013. Moreover, banks are closely interconnected, for example, through cross-holding of covered bonds.
7 See Norges Banks høringssvar om tilpasninger i kapitalkravene for banker 30. september 2019. [Norges Bank’s consultation response of 30 September 2019 on adjustments to capital requirements for banks] (in Norwegian only).
2.3 Funding
Favourable funding conditions in capital markets
Along with customer deposits, bonds and short-term paper account for the most important funding sources for Norwegian banks. Norwegian banks and mortgage companies have ample access to wholesale funding in both NOK and foreign currency. Higher funding costs for Nordic banks under investigation for violating anti-money laundering rules have not spread to Norwegian banks. Greater focus on climate risk can have an impact on Norwegian banks’ funding costs owing to the oil industry’s importance for the Norwegian economy (see Section 4 Climate Risk).
Low yields on safe government securities have made investments with higher risk and higher expected returns more attractive to investors. This has reduced risk premiums on banks’ wholesale funding and created favourable funding conditions, also for Norwegian banks (Chart 2.14). Since Financial Stability Report 2018, uncertainty regarding future interest rate levels has increased, and long-term interest rates have fallen further globally (Chart 1.2). This may pull down banks’ funding costs further. At the same time, uncertainty related to trade tensions and Brexit may increase risk premiums in the short term and worsen banks’ access to wholesale funding.
Chart 2.14 Risk premiums in Norway.1 Spread over 3-month Nibor Five-year maturity. Basis points. 7 January 2011 – 24 October 2019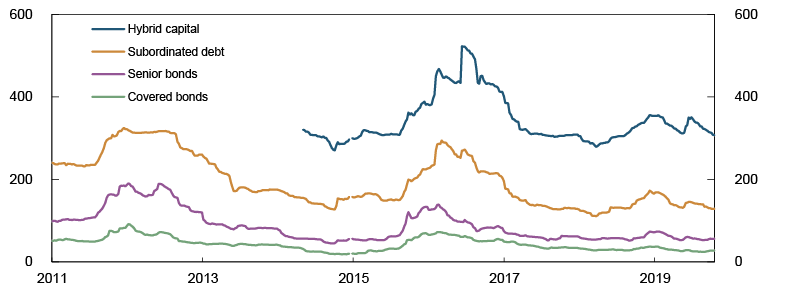
1) On bonds issued by large Norwegian banks and mortgage companies in the Norwegian market.
Source: Nordic Bond Pricing
New requirements for reference rates
Reference rates play a pivotal role in the financial system. They simplify financial contracts by eliminating the need for agreement on the rate that will serve as the basis for each individual contract entered into.8 The value of loans and various financial products linked to reference rates is very high. The reference rate NIBOR must be adapted to new EU requirements (the Benchmarks Regulation) that will apply in Norway through the EEA Agreement. The rules are intended to ensure confidence in the reference rates among market participants and other parties (see "Towards more robust norwegian reference rates").
Norwegian banks dependent on covered bonds
Two-thirds of banks’ funding in the bond market comprises covered bonds (Chart 2.15). Norwegian banks and mortgage companies are the largest investors in the covered bond market, holding over 50% of the total. Most of the bonds are held as liquidity reserves. At the end of June 2019, covered bonds accounted for over half of banks’ liquidity reserves in NOK (Chart 2.16).9
Chart 2.15 Outstanding wholesale funding. Norwegian banks and covered bond mortgage companies By bond and currency. Percent. January 2007 – September 2019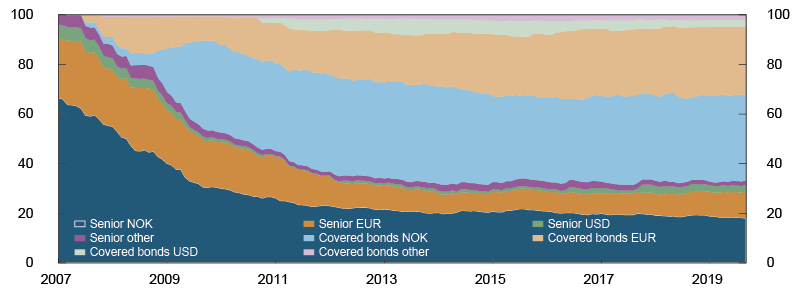
Sources: Bloomberg and Stamdata
Chart 2.16 Stock of liquid assets in NOK by asset type Norwegian banks.1 After haircut and before caps. Percent. At 30 June 2019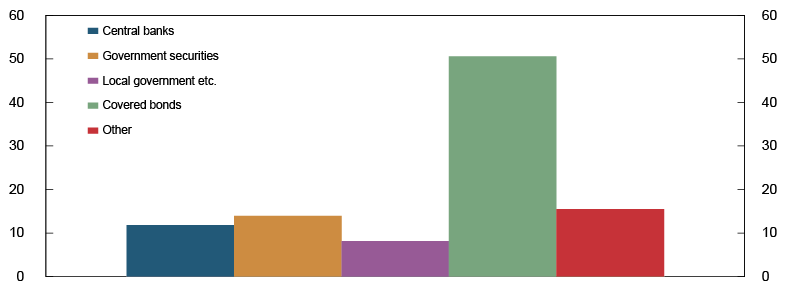
1) Consolidated figures where available. Parent banks otherwise.
Source: Finanstilsynet (Financial Supervisory Authority of Norway)
Norwegian banks’ substantial covered bond holdings amplify the interconnectedness of Norwegian financial institutions and may constitute a systemic risk. This may intensify liquidity problems for Norwegian banks in situations where funding dries up and many banks are forced to liquidate large covered bond holdings at the same time. The value of the banks’ liquidity portfolio could then rapidly decline. A concurrent fall in house prices may worsen liquidity problems and force further sales of liquidity reserves.10 It is therefore important that banks’ liquid assets under the Liquidity Coverage Ratio (LCR) requirement can be traded without causing appreciable price changes.
Predicting the behaviour of market participants in a crisis is difficult due to limited experience as to how easily covered bonds can be traded and issued or to what extent their value will hold up against a fall in house prices. In periods of market turbulence, the liquidity of covered bonds has deteriorated less than that of unsecured bank bonds. An analysis of contagion effects in the banking sector illustrates how connectedness will affect banks’ capital ratios (see "Assessment of contagion effects in the banking sector").
Lower vulnerability to short-term foreign currency funding dry-up
Many international banks, including DNB, fund lending with short-term deposits and short-term paper in foreign money markets. Such short-term wholesale foreign currency funding accounts for about 12% of bank funding.
Short-term funding must be rolled over frequently, and it has been shown that such funding may dry up in turbulent times. Historically, professional investors such as money market funds, large companies and other banks have been quick to withdraw deposits from banks in which they have lost confidence. Mandate changes among institutional investors may also result in unexpected shifts in banks’ access to short-term funding.
Short-term foreign currency funding is largely invested in liquid and secure assets such as central bank deposits and other highly liquid securities. The share of short-term foreign currency funding that is not placed in central banks has declined in recent years and is now approximately 3% of total assets (Chart 2.17). The maturity of banks’ short-term foreign currency funding has also lengthened somewhat, possibly indicating that Norwegian banks have become less vulnerable to a dry-up of short-term foreign currency funding.
Chart 2.17 Short-term funding and central bank deposits in foreign currency1 Norwegian banks. Share of total assets. Percent. 2009–20192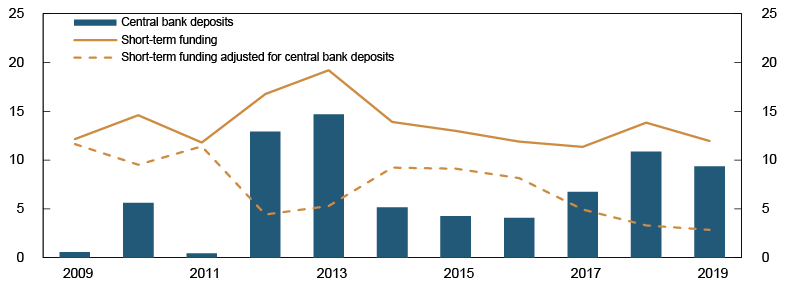
1) Comprises deposits from foreign customers and central banks, and debt securities with less than 12 months' residual maturity.
2) Annual data at 30 June.
Source: Norges Bank
Norwegian banks satisfy the LCR requirements.11 The total LCR and the LCR in NOK have been high and stable over the past few years (Chart 2.18). However, banks may be vulnerable if they lose access to funding over the LCR’s 30-day horizon. A Net Stable Funding Ratio (NSFR) requirement may reduce these vulnerabilities. The NSFR is now finalised and adopted by the EU, but has not yet been transposed into Norwegian law. Nevertheless, Norwegian banks have reported their NSFRs for several years and satisfy the minimum requirement (Chart 2.19).
Chart 2.18 Liquidity Coverage Ratio (LCR) Norwegian banks.1 Percent. July 2014 – June 2019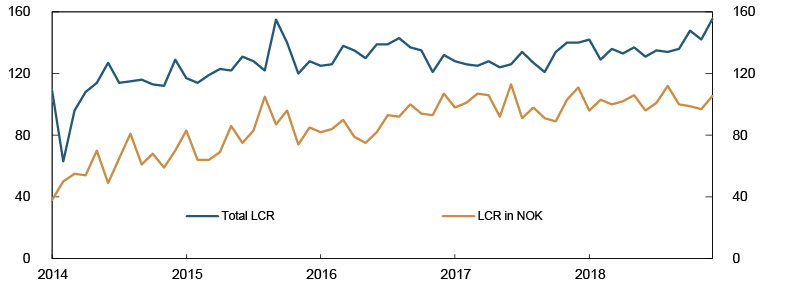
1) Consolidated figures where available. Parent banks otherwise.
Source: Finanstilsynet (Financial Supervisory Authority of Norway)
Chart 2.19 Net stable funding ratio (NSFR) Norwegian banks.1 Percent. 2016 Q2 – 2019 Q2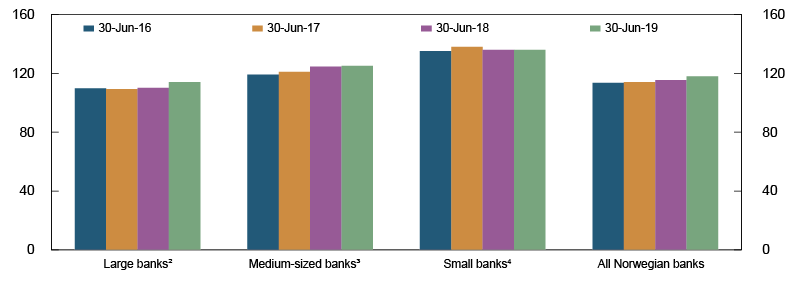
1) Consolidated data where available. Parent banks otherwise.
2) DNB, SpareBank 1 SR-Bank, Sparebanken Vest, SpareBank 1 SMN, Sparebanken Sør, SpareBank 1 Østlandet and SpareBank 1 Nord-Norge.
3) Banks with total assets above NOK 10bn.
4) Banks with total assets below NOK 10bn.
Source: Finanstilsynet (Financial Supervisory Authority of Norway)
New requirement for banks’ own funds and eligible liabilities
On 1 January 2019, a new regulatory framework for bank recovery and resolution in Norway entered into force.12 The underlying principle is that if a bank is in trouble, the bank’s shareholders and then creditors must bear the losses and contribute towards the bank’s recapitalisation and taxpayer funds should not be used. For the efficient resolution of a bank that loses all or part of its equity, it must have own funds and eligible liabilities that can quickly be written down and/or converted to new equity (bail-in). Finanstilsynet aims to set resolution plans for the nine most important Norwegian banks by end-2019.13 In the resolution plans for these banks, minimum requirements for own funds and eligible liabilities (MREL) will be set.14 The requirements will be published.
For Finanstilsynet, an important principle is that MREL is met with either regulatory capital or with liabilities that rank below ordinary unsecured senior bonds, called subordinated liabilities. When MREL liabilities are subordinated, national resolution authorities can more easily treat creditors with the same priority equally when bail-in tools are applied at a failed bank.
Securitisation: a new funding source for lending
The EU has established a common securitisation framework, which entered into force 1 January 2019. One of its aims is to remedy the weaknesses that were revealed during the global financial crisis. Large losses were incurred on US securitised bonds, largely owing to the bonds issued for immediate resale, under the originate-to-distribute model. This model was little used in Europe, and losses associated with European securitisation were relatively moderate.
Securitisation is in practice currently not feasible in Norway. The Ministry of Finance has recently circulated for comment a proposal to implement the EU’s Securitisation Regulation in Norwegian law.15 The regulation includes general rules on securitisation and sets the criteria for a new class of simple, transparent and standardised (STS) securitisations.
Securitisation takes place when banks sell their loans to special purpose vehicles (SPVs), which fund the purchase of these loans by issuing securities in the market. Securitisation creates new opportunities for funding and risk management for banks, borrowers and investors.
The extent of securitisation remains fairly modest in the European countries where this form of financing has been used for some time. If securitisation were to reach the same extent in Norway as the average of these countries, it would amount to just over NOK 300bn or approximately 7% of banks’ and mortgage companies’ total lending.
8 See Lund, K. (2018) “Hva er referanserenter og hvorfor er de så viktige?” [What are reference rates and why are they so important?] (in Norwegian only). Published on Bankplassen blog 25 September 2018.
9 The rules allow covered bonds to constitute up to 70% of banks’ liquidity portfolio.
10 See page 36 of Financial Stability Report 2015.
11 For more details on LCR see box on page 32 in Financial Stability Report 2018.
12 See page 19 in Financial Stability Report 2017.
13 The nine banks are listed on Finanstilsynet’s webpage on Minimum Requirements for the sum of own funds and Eligible Liabilities (MREL).
14 See Chapter 20 Part II of Regulation of 9 December 2016 No 1502 on financial institutions and financial groups (Financial Institutions Regulation) (in Norwegian only).
15 See Norges Banks høringssvar om gjennomføring av EUs verdipapiriseringsforordning 23. september 2019 [Norges Bank’s consultation response of 23 September 2019 on the implementation of the EU’s Securitisation Regulation] (in Norwegian only).
Towards more robust norwegian reference rates
Reference rates play a pivotal role in the financial system. The value of financial products and loan contracts linked to these rates is very high. Rules for the reference rate Nibor must be adapted to the EU’s Benchmarks Regulation (BMR) when it is transposed into Norwegian law. Amendments to the Nibor rules were circulated for comment. The BMR also requires financial contracts to reference an alternative benchmark. A working group has recommended Nowa as an alternative reference rate for the Norwegian krone Norges Bank supports the group’s proposal.
Nibor will be adjusted to new requirements
Activity in unsecured interbank markets at longer maturities has fallen both globally and in Norway in the years since the financial crisis. Ibor rates1, traditionally the most important reference rates, have been based on transactions in this market. Owing to fewer transactions, ibor rates in recent years have increasingly been judgement-based. There was also evidence that the Libor rate, for example, had been deliberately manipulated. Both developments have undermined confidence in these rates.
In 2014, the Financial Stability Board recommended reforming current reference rates and identifying alternatives. The EU has established a separate regulation on financial benchmarks, the Benchmarks Regulation (BMR)2, which will also apply to Nibor when the regulation is transposed into Norwegian law. In the light of new regulatory requirements, the calculation methodology for a number of ibor rates has been changed. Nibor’s administrator, Norske Finansielle Referanser AS (NoRe), launched a public consultation on a proposed new methodology for Nibor in August.3 The proposed methodology is largely the same as in the current Nibor rules, but contains new and more specific provisions on the input data panel banks should use when determining their Nibor submissions. A “waterfall” structure specifies an order of priority for banks’ input data. Norges Bank is generally in favour of the proposed methodology, but holds the view that the proposal does not meet all the BMR requirements related to documentation and responsibility.4 To ensure accountability and transparency, Norges Bank proposes that panel banks should provide more documentation of the methodology used in the determination of their submissions. This would be in line with changes to other ibor rates and would strengthen confidence in Nibor as a reference rate.
Nowa recommended as alternative reference rate for the Norwegian krone
The BMR also requires users of reference rates to nominate one or several alternative benchmarks that could be referenced in a contract. The rate shall be used as a benchmark if the contract’s original benchmark is substantially changed or no longer available. In parallel with efforts abroad, Norges Bank took the initiative in 2018 to establish a working group with a mandate to identify an alternative reference rate for the Norwegian krone. The working group comprises participants from Norwegian banks and branches of foreign banks. After considering a number of alternatives, in September 2019, the working group published its recommendation that Nowa (Norwegian Overnight Weighted Average) should be the alternative Norwegian krone reference rate. Norges Bank supports the recommendation of Nowa as an alternative reference rate.
Nowa is currently the only overnight rate in the Norwegian money market. The rate was established in 2011 at the request of Norges Bank. Norges Bank will take over as the administrator for Nowa on 1 January 2020 and has published proposed rules for the calculation and publication of the rate.5 The rate will be published based on the new calculation as from 1 January 2020. Work remains to be done before Nowa can be introduced as an alternative reference rate.
In spite of the past year’s work on reference rates, there is uncertainty as to the continued existence of ibor rates. It is primarily up to users and market participants to adjust to new requirements and rules and choose which reference rates to use in financial contracts. More robust and transparent reference rates, and the existence of a generally accepted alternative, have the potential to reduce risk for market participants and promote financial stability.
1 Ibor = Interbank offered rate.
3 See Norske Finansielle Referanser (NoRe) (2019) “Nibor: New methodology – Public consultation”.
4 See Norges Bank’s Consultation response – changes to Nibor based on new EU/EEA requirements of 1 October 2019.
5 See Norges Bank (2019) “Consultation: Principles for calculating and publishing Nowa”. 15 October 2019.
3 Stress test – banks’ response to a pronounced downturn
The stress test analyses the impact on banks’ credit losses, capital ratios and behaviour in the event of a pronounced economic downturn. Banks have built up a substantial capital buffer since 2013, and the countercyclical buffer rate at the start of the stress scenario has increased since Financial Stability Report 2018, strengthening their resilience to a pronounced economic downturn.
The stress test shows that, on the whole, banks’ capital buffers are sufficient to absorb losses that may arise in a downturn, but banks may nevertheless tighten lending considerably. This may amplify an economic downturn. Owing to differences in exposure to various sectors, the impact of a downturn may be more pronounced for some banks than for others. An analysis of interconnectedness between banks shows that fire sales of securities may lead to further falls in banks’ capital. The stress test shows that banks can maintain credit supply by drawing on buffers.
3.1 Stress scenario
The purpose of the stress test is to analyse the macroeconomic effects of banks’ behaviour in the event of a pronounced downturn in the Norwegian economy. To enable banks to meet credit demand and conduct other business, banks must have sufficient capital when a crisis erupts. The analyses are framed to assess how banks are affected by, and how they themselves affect economic developments.1
Financial imbalances amplify the downturn
As a number of empirical calculations show that crises are more serious when preceded by a build-up of financial imbalances, Norges Bank seeks to cross-check the depth of the crisis against the Bank’s assessment of financial imbalances. A broad range of indicators and methodologies is applied to shed light on how severe the downturn can be (see "The Stress scenario reflects financial imbalances").
The stress scenario is based on a pronounced, but conceivable, downturn in the Norwegian economy (see Table 3.1). The methods used indicate a 5% probability that mainland GDP will fall as much or more than assumed in the stress scenario. In line with the balance of risks for the Norwegian economy, the downturn is about as severe as in Financial Stability Report 2018.
Table 3.1 Macroeconomic aggregates in the stress scenario. Percentage change from previous year1
|
20192,3 |
2020 |
2021 |
2022 |
2023 |
|
|
Mainland GDP |
2.7 |
-1.9 |
-1.0 |
1.8 |
1.3 |
|
Private consumption |
1.8 |
-1.2 |
-0.2 |
1.8 |
2.1 |
|
Registered unemployment (rate, level) |
2.3 |
4.7 |
6.1 |
5.5 |
5.4 |
|
3-month Nibor (level) |
1.6 |
1.7 |
1.7 |
1.2 |
1.0 |
|
Weighted risk premium for covered bonds and senior bank bonds4 (level) |
0.6 |
0.7 |
0.8 |
0.9 |
1.0 |
|
House prices |
2.5 |
-13.7 |
-12.9 |
-3.7 |
4.5 |
|
Commercial property prices |
5.7 |
-22.8 |
-21.5 |
-6.1 |
7.5 |
|
Credit (C2), households5 |
5.4 |
-0.6 |
-0.7 |
-0.8 |
1.8 |
|
Credit (C2), non-financial enterprises in mainland Norway5 |
7.3 |
-5.0 |
-0.5 |
-0.9 |
2.3 |
|
Credit losses6 (rate, level) |
0.1 |
1.9 |
2.3 |
1.4 |
1.4 |
|
Countercyclical capital buffer requirement (level) |
2.5 |
0.0 |
0.0 |
0.0 |
0.0 |
1 Unless otherwise stated. Levels are measured as annual averages.
2 Projections for 2019 Q3 to 2019 Q4 for mainland GDP, private consumption, unemployment, 3-month Nibor, house prices and credit to households are from Monetary Policy Report 3/2019.
3 Projections for 2019 Q3 to 2019 Q4 for commercial property prices are based market participants’ price forecasts.
4 The higher premiums only have an effect on new bonds.
5 Change in stock measured at year-end.
6 Impairment losses based on IFRS 9.
Sources: CBRE, Eiendomsverdi AS, Entra, Finn.no, NAV, Real Estate Norway, Statistics Norway and Norges Bank
The stress scenario is not a forecast of how the economy will develop in the event of a pronounced downturn, but what may happen when financial imbalances have built up. In a crisis, the authorities would typically implement a number of extraordinary measures to achieve economic policy objectives. During and following the 2008 financial crisis, for example, many countries loosened fiscal policy, and several central banks undertook large-scale asset purchases. The financial crisis showed that banks’ pre-crisis capital levels were inadequate. The stress test focuses on the dampening impact of time-varying capital requirements on a downturn. Therefore no extraordinary fiscal or monetary policy measures are applied in the stress test. As a technical assumption, the policy rate is set at zero. In principle, a higher countercyclical capital buffer from the end of 2019 and a policy rate higher than in Financial Stability Report 2018 provide somewhat more flexibility in the use of tools.
In line with the global risk outlook described in Section 1 Financial stability outlook, a marked reduction in global GDP and increased risk premiums are assumed in financial markets. This may be because of rapidly growing protectionism and trade tensions, which reduce global trade and fuel uncertainty. The limited monetary and fiscal space still evident in many countries may amplify the global downturn. In the stress scenario, oil prices fall by about 40% owing to lower global trade.
Norway is a small open economy and the international developments in the stress scenario contribute to a pronounced downturn in the Norwegian economy. Despite setting the policy rate in Norway at zero, the money market rate remains elevated owing to increased risk premiums. Even though there is increased turbulence in financial markets, banks are assumed to have access to wholesale funding during the stress period, which may underestimate the effects on the Norwegian economy as historical episodes show that investors can choose to stop funding Norwegian banks in the event of uncertainty about bank solvency. Climate risk may also lead to bank losses, and uncertainty about climate exposure may result in funding problems (see Section 4 Climate risk). Any liquidity problems may amplify the financial crisis.
Financial market developments result in losses on banks’ securities portfolios. The value of banks’ stock of equities is written down by 40% and fixed-income instruments by 5% in 2020. The value of these instruments is kept unchanged thereafter.
Vulnerabilities associated with high household debt-to-income ratios and elevated property prices amplify the downturn. In line with international experience during crises, an abrupt fall in property prices is assumed at the start of the stress scenario. Historical experience also suggests that commercial property prices are more volatile than house prices. It is therefore assumed that the price level will be reduced by almost half in the course of the stress period (Chart 3.1). In the light of reduced income expectations and falling property prices, private consumption is sluggish and housing investment falls sharply. There is a marked reduction in investment willingness in the business sector.
Chart 3.1 House1 prices and commercial property prices2 Index. 2019 Q4 = 100. 1982 Q1 – 2023 Q43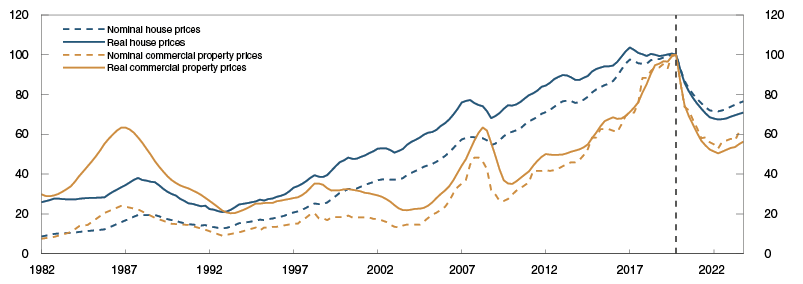
1) Seasonally adjusted and deflated by CPI-ATE.
2) Estimated selling prices per square metre for prime office space in Oslo. Average selling price for the previous four quarters. Deflated by the GDP deflator for mainland Norway.
3) Projections for 2019 Q3 – 2023 Q4. Projections for property prices in 2019 are based on market participants' price forecasts.
Sources: CBRE, Dagens Næringsliv, Eiendomsverdi, Entra, Finn.no, OPAK, Real Estate Norway, Statistics Norway and Norges Bank
Weaker economic growth leads to high credit losses
The combination of weak economic growth and elevated interest expenses push up banks’ credit losses (Chart 3.2). On the back of lower demand from households, oil-related industries and Norway’s trading partners, combined with reduced collateral values, banks’ losses on loans to non-financial enterprises rise markedly.
Chart 3.2 Loan losses as a share of gross loans to the sector Historically (for all banks and mortgage companies) and in the stress scenario (for the macro bank). Percent. 1987–20231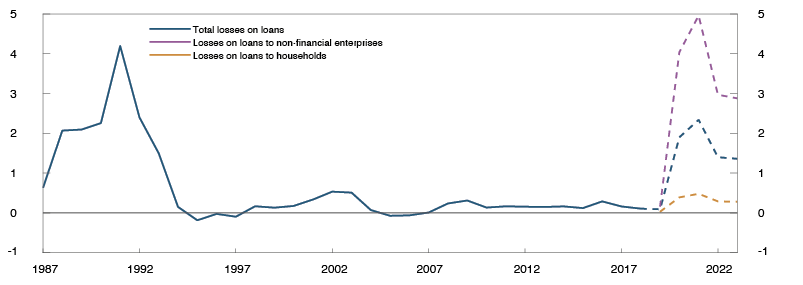
1) Projetions for 2019 Q3 – 2023 Q4. Historical loss distribution is used to allocate loan losses to enterprises and households.
Sources: SNL / S&P MI, Statistics Norway and Norges Bank
The increase in credit losses is in line with the level observed during the Norwegian banking crisis. The sharp rise in credit losses in the event of a severe downturn is also in line with international experience (Chart 3.3). The relationship between activity levels and credit losses in the sample countries indicates that weaker economic developments are associated with higher credit losses. The correlation depends on the type of historical loss event covered. In the most common situations (around the median), credit losses rise substantially less than losses from tail events (the 95-percentile).
Chart 3.3 Loan losses as a share of total loans (vertical scale) and GDP measured relative to trend1 (horizontal scale) Percent. 1979–20142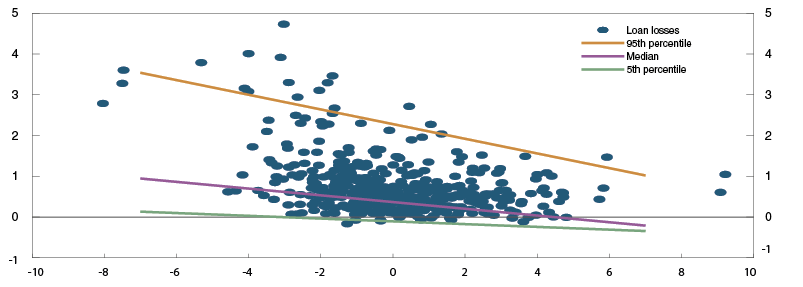
1) International data cover 19 OECD countries. Measures of recognised impairment losses and the sample of financial institutions vary across countries and time. GDP trend estimations use a two-sided HP filter with lambda = 100. The lines show the estimated distribution of loan losses based on quantile regressions with GDP as a deviation from trend and country-specific fixed effects. The lines include fixed level effects for Norway. 2) The number of observations varies across countries. The data set covers a total of 23 crises and is based on the dating of crises in Anundsen, A.K, K. Gerdrup, F. Hansen and K. Kragh-Sørensen (2016) "Bubbles and Crises: The Role of House Prices and Credit". Journal of Applied Econometrics, 31(7) November/December, pages 1291-1311.
Sources: National central banks, OECD, SNL / S&P MI, Statistics Norway and Norges Bank
In the stress scenario, the possible impact of new accounting rules for impairment recognition (IFRS 9) introduced in 2018 has also been taken into account. Under IFRS 9, recognition of credit impairment is based on more forward-looking assessments than under the previous accounting standard (IAS 39). The analyses in "How does IFRS 9 affect impairment recognition in bad times?" indicate that just before and during a pronounced downturn credit losses are higher under IFRS 9 than under IAS 39. There is reason to believe that the impact of IFRS 9 may be stronger the worse the economic outlook is at the start of a downturn. As the downturn in the stress test is substantially more severe than the downturns analysed in the box, the effects will be more pronounced. One possible effect of IFRS 9 is therefore illustrated by substantially bringing forward banks’ credit losses (Chart 3.4).
Chart 3.4 Loan losses as a share of gross loans in the stress scenario
Including and excluding assumed effects of IFRS 9. Percent. 2019–20231
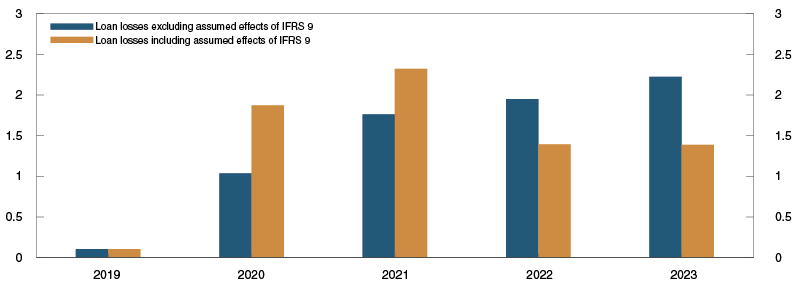
1) Projections.
Sources: Statistics Norway and Norges Bank
1 A detailed description of the stress test framework is presented in Andersen, H., K. Gerdrup, R. M. Johansen and T. Krogh (2019) “A macroprudential stress testing framework”. Staff Memo 1/2019. Norges Bank.
3.2 Banks’ adjustment to capital requirements
The macro bank in the stress scenario is a weighted average of nine large Norwegian banks.2 In principle, the stress test focuses on developments in the macro bank and does not incorporate the effect of differences in the banks’ behaviour.
The average Pillar 1 Common Equity Tier 1 (CET1) capital requirement for the banks in the stress test is 13.8%.3 The macro bank must also satisfy the Pillar 2 requirement set by Finanstilsynet (Financial Supervisory Authority of Norway). The average Pillar 2 requirement is 1.8%, bringing the total capital requirement for the macro bank to 15.6%. The macro bank also holds an additional buffer above the total capital requirement, and at the start of the stress period, the macro bank has a CET1 ratio of 16.0%.4
High losses impair banks’ profitability
Large losses on loans and securities lead to weak results for the macro bank throughout the stress period. As a result, the macro bank’s CET1 capital falls markedly (Chart 3.5). By the end of the stress period, CET1 capital is almost 14.7% lower than at the beginning. At the same time, risk weights increase somewhat as a result of higher credit risk exposure. Both factors reduce the CET1 ratio (Chart 3.6).5
Chart 3.5 The macro bank's change in Common Equity Tier 1 (CET1) capital in the stress scenario and contribution from different components Percent. 20191–20232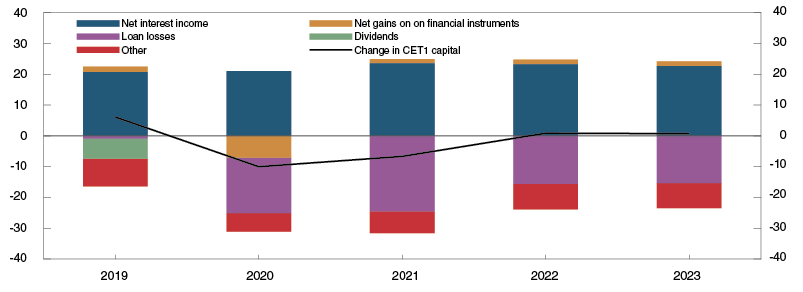
1) Figures for 2019 are based on simple projections for the second half of the year.
2) Projections for 2019 Q3 – 2023 Q4
Sources: SNL / S&P MI and Norges Bank
Chart 3.6 The macro bank's Common Equity Tier 1 (CET1) ratio and the CET1 ratio requirement under Pillar 1 and Pillar 21) under different assumptions about developments in banks' capital requirements Percent. 2018–20232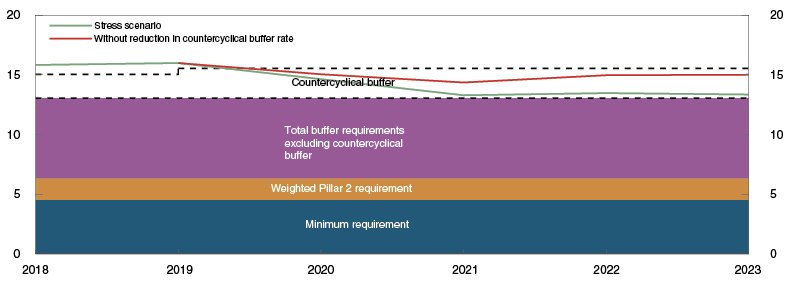
1) Pillar 2 requirements for the banks in the stress test are weighted by their risk-weighted assets.
2) Projections for 2019–2023
Sources: Finanstilsynet (Financial Supervisory Authority of Norway), SNL / S&P MI and Norges Bank
The fall in the capital ratio is reduced by the macro bank’s adjustment to meet the capital requirement. Cost-cutting measures through the stress period keep operating expenses broadly unchanged as a share of operating income. In addition, the macro bank does not pay dividends in the stress period. Banks’ capacity to maintain interest margins in the event of a downturn is uncertain, but during the banking crisis, margins were relatively stable. Margins against borrowing costs are assumed to be held constant during the stress period. On the one hand, banks will want to increase lending margins to compensate for higher risk and increase their earnings, but lower credit demand pulls in the direction of lower lending margins. These effects counteract each other in the stress scenario and provide the basis for unchanged margins.
The results of the stress test are sensitive to assumptions regarding lending margins. If margins against borrowing costs are assumed to be 0.5 percentage point lower in the stress period, banks’ earnings will weaken considerably, in isolation. This deterioration corresponds to a fall in the macro bank’s CET1 ratio of around 3 percentage points during the stress period.6
The macro bank also reduces the fall in the capital ratio by tightening the supply of new loans. It does this by requiring better collateral and by trying to increase lending margins. Lower credit demand, owing to the weakness in the housing market and lower business investment, also contribute to reduced lending growth.7
More buffer capital restrains the tightening of bank lending
In the stress scenario, the countercyclical capital buffer rate is set at zero to mitigate the procyclical effects of tighter bank lending, reducing the macro bank’s total capital requirement to 13.1%.
Under the capital adequacy rules, the remaining buffer under Pillar 1 may also be drawn on in bad times. At the same time, drawing on the buffer entails restrictions on dividend, bonus and some other banking activities. Banks must give notification and then draw up a plan to restore compliance with the total capital requirement. If the consequences of breaching the total capital requirement are perceived as costly or uncertain, banks may be reluctant to draw on the buffers, even in the event of substantial losses. The same applies if banks’ lenders and investors require a high level of capital adequacy in order to continue to provide funding to banks.
Setting the countercyclical capital buffer requirement at zero dampens the downturn. If the buffer were kept at 2.5%, banks would further tighten lending to meet the buffer requirement (Chart 3.6). The result would be weaker GDP growth and a more pronounced fall in credit supply (Chart 3.7).8 A higher countercyclical capital buffer rate compared with the level in Financial Stability Report 2018 provides somewhat greater flexibility in the use of instruments and makes it somewhat easier for banks to maintain lending. The analysis shows the importance of banks having sufficient time-varying capital buffers before financial crises arise, which also reduces the risk of Norwegian banks’ debt-servicing capacity being called into doubt, resulting in funding problems.
Chart 3.7 Total change through the stress period in mainland GDP and credit under different assumptions about developements in banks' capital requirements.1 Percent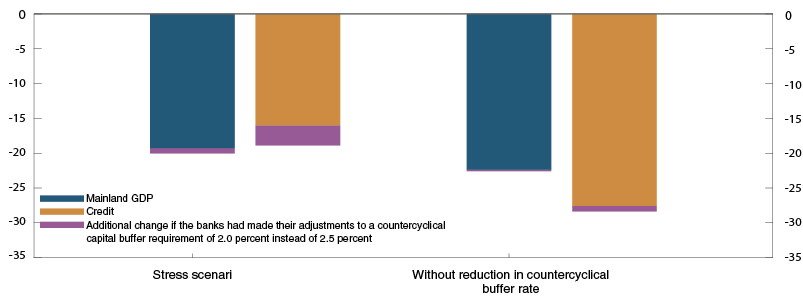
1) Defined as the cumulative deviation from an estimated trend for GDP and the deviation from an estimated trend at the end of the stress scenario for total credit. Trend GDP growth in constant prices is set at 1.2 percent and trend credit growth is set at 3.7 percent.
Source: Norges Bank
Substantial differences between banks can amplify an economic downturn
The result from the macro stress test is nuanced if it is taken into account that the impact varies across banks. Detailed information from Finanstilsynet about banks’ credit exposure by industry is used to allocate the macro bank’s losses in the corporate sector to specific industries. The macro stress test is based on banks’ reported probability of default (PD) and estimates for the share of credit exposure that is expected to be lost in the event of default, loss given default (LGD) (see "Finanstilsynet’s exposure database and loss distribution assumptions"). This allocation of credit losses represents just one of many possible scenarios. The purpose of the analysis is not to identify risk in individual banks, but to illustrate the importance of having sufficient capital buffers that can be drawn on when a crisis occurs.
Using this method, PD and LGD levels at the end of 2018 indicate that relative losses are largest in international shipping and for oil service enterprises, but the level of banks’ overall lending to these industries is not high. Commercial real estate (CRE) loans account for the largest share of banks’ corporate lending9, but banks report lower PD and LGD figures for this type of exposure than for lending to many other sectors. Based on historical observations of losses in crises, CRE losses are generally low through normal business cycles, but high in severe financial crises.10 The stress test scenario assumes a pronounced downturn. PD and LGD values for CRE are adjusted upwards to illustrate the potential for substantial CRE losses in such a situation.11
Chart 3.8 shows the importance of the different assumptions. The inner circle shows loans by industry. If loans to various industries are assumed to have the same risk characteristics, the distribution of credit losses will be the same as in the stress scenario. The middle circle shows loan loss distribution based on banks’ reported PD and LGD figures. The loss rate on CRE loans then declines. The loss rate on loans to the international shipping industry and to oil service enterprises rises. The outer circle shows loss rates on CRE loans based on an upward adjustment of PD and LGD. The loss rate on CRE loans then rises considerably.
Chart 3.8 The macro bank's lending by industry (inner circle), loss by industry based on engagement data (middle circle), and losses by industry with upwardly revised PD and LGD for commercial real estate lending (outer circle) Percent of total corporate lending at 31 December 2018
Sources: Finanstilsynet (Financial Supervisory Authority of Norway) and Norges Bank
The exposures of the stress test banks vary considerably (Chart 3.9). The same applies to the PD and LGD values for the different exposures applied in the analysis. The impact on some banks will therefore be more pronounced than on others. All of the banks have substantial CRE exposures, but the share of CRE loans varies between 30% and 60% of their corporate lending. For most of the banks, international shipping accounts for a small share of corporate lending, but at least one bank extends more than 10% of its corporate loans to international shipping. Lending to oil service enterprises also varies among the banks.
Chart 3.9 Stress test banks' lending by industry Percent of corporate lending. At 31 December 2018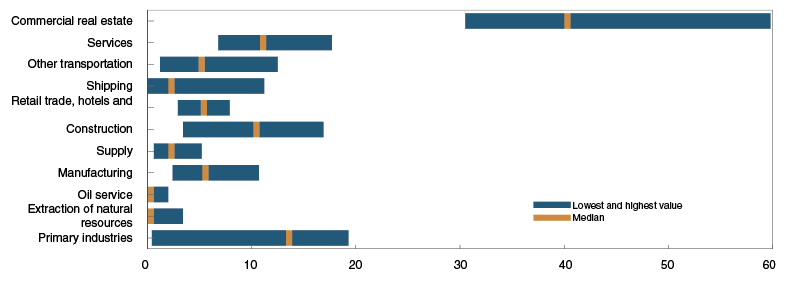
Sources: Finanstilsynet (Financial Supervisory Authority of Norway) and Norges Bank
There is considerable uncertainty attached to individual banks’ adjustments to higher losses and the possible consequences of such adjustments. Banks with substantial losses may tighten lending considerably, and if they are large banks or several small banks, the economic downturn may be more pronounced than when only the macro bank is analysed. The macroeconomic consequences will be more limited if the largest losses are isolated to banks that are less important for the Norwegian economy.
Banks can also make other adjustments that reduce the need to tighten lending. One possibility is to issue new equity capital, which may be both costly and difficult at a time of financial turbulence, combined with a weak economic outlook. Another possibility may be to sell assets, but at distressed prices, this can entail considerable losses and inflict further losses on other banks through contagion effects.
Interconnectedness across banks may lead to further losses
Banks are interconnected as they are exposed to one another and as they hold the same or similar securities. An analysis by Norges Bank shows that contagion effects may lead to further losses in the Norwegian banking sector (see "Assessment of contagion effects in the banking sector"). This is primarily due to indirect contagion from fire sales of securities with subsequent price falls. In the Bank’s model, such contagion effects entail up to a 2 percentage point fall in the CET1 ratio, depending on the assumptions made.
One of the uncertainty factors in the analysis is what is needed to trigger a fire sale. In the model, banks have funding problems when CET1 ratios fall below a defined level, which may be, for example, because lenders doubt banks’ debt-servicing capacity. To improve liquidity, banks will attempt to sell off liquid assets. In some cases, price falls may be substantial, but even small falls are important when large holdings of securities are affected. If funding problems start even when there is a modest fall in capital ratios, more banks will have to conduct fire sales, resulting in higher losses.
The systemic risk buffer is a component of the total buffer requirement and is intended to cover structural vulnerabilities and the consequences of a closely interconnected financial system.12 The analysis shows that the interconnectedness of banks may amplify total losses and illustrates the importance of maintaining an adequate systemic risk buffer rate requirement.
2 DNB Bank, SpareBank 1 SR-Bank, Sparebanken Vest, SpareBank 1 SMN, Sparebanken Sør, SpareBank 1 Østlandet, SpareBank 1 Nord-Norge, Sbanken and Sparebanken Møre.
3 The stress test is based on the existing capital framework. The average Pillar 1 requirement takes into account that only one of the banks in the stress test faces a buffer requirement for systemically important banks. The technical assumption applied is the same countercyclical capital buffer rate for domestic and foreign exposures where the host country has set a rate that deviates from the Norwegian rate.
4 This figure is based on estimated retained earnings for 2019.
5 The macro bank does not breach the leverage ratio requirement or the announced MREL (Minimum Requirement for own funds and Eligible Liabilities) requirements, assuming that the macro bank satisfies the MREL requirements.
6 See Section 3 of Financial Stability Report 2018 for more on the effect of changes in interest margins,
7 The economic impact of tighter lending by the largest banks depends on whether the other banks, especially the branches of foreign banks, follow suit. This is not analysed in the stress test. Over the past 10 years, branches of foreign banks have experienced higher volatility in lending growth than Norwegian banks, see Turtveit, L.-T. (2017) “Branches of foreign banks and credit supply”. Economic Commentaries 3/2017. Norges Bank.
8 The economic impact of lower capital requirements is uncertain, but a number of international studies find significant positive effects of countercyclical capital buffers on lending and the real economy, see Jiménez, G., S. Ongena, J.-L. Peydró and J. Saurina (2017) “Macroprudential Policy, Countercyclical Bank Capital Buffers, and Credit Supply: Evidence from the Spanish Dynamic Provisioning Experiments”. Journal of Political Economy 125 (6), December pp 2126–2177 and Imbierowicz B., J. Kragh and J. Rangvid (2018) “Time-Varying Capital Requirements and Disclosure Rules: Effects on Capitalization and Lending Decisions”. Journal of Money, Credit and Banking 50 (4), May pp 573–602. Arbatli, E.C. and R. Juelsrud (2019) “Effects of reducing capital requirements: Evidence from Norway’s transition to Basel II” forthcoming Norges Bank Working Paper studies the impact of lower capital requirements owing to the phasing-in of Basel II in Norway and finds that banks with larger reductions in capital requirements increased their lending more.
9 Note that the share of CRE lending is lower than in a sector breakdown of loans in C2 as loans to foreign borrowers are also allocated to specific sectors. The Norwegian banking sector has a somewhat higher overall share of CRE lending than the stress test banks.
10 See Section 4 of Financial Stability Report 2018.
11 Both PD and LGD for CRE are adjusted upwards by 50%. This results in loss rates for CRE exposures that are broadly in line with what was observed during the Norwegian banking crisis (except for the losses in 1991, when CRE write-offs were particularly large).
12 See Chapter 3 of Report to the Storting No. 1 (2017–2018). National Budget 2018.
The Stress scenario reflects financial imbalances
The depth of the crisis in the stress scenario reflects Norges Bank’s assessment of financial imbalances. The Bank employs a broad range of indicators and a number of methodologies to link the level of financial imbalances to crisis severity.
Empirical analyses show that the impact of financial crises is more severe when preceded by a rapid build-up of financial imbalances.1 The economic downturn in the stress test is therefore assumed to be more severe the greater the magnitude of the financial imbalances at the outset.
Crisis depth estimates are based on a broad range of indicators
Mainland GDP is used as an indicator of the severity of the stress scenario. Crisis depth is measured along two dimensions:
1.Lowest annual GDP growth over the four-year stress period
2.Total GDP shortfall during the first three years of the stress period measured as the deviation from pre-crisis GDP
Two methods are used to link financial imbalances to the measures of crisis severity. Local projections2 use international data and estimate a relationship between GDP developments in financial crises and the pre-crisis levels of financial imbalances3 An alternative method is “Growth-at-Risk” (GaR), which uses quantile regressions to link downside GDP risk to measures of financial imbalances based on Norwegian data.4 Downside GDP risk is defined as the fifth percentile of the GDP distribution. The estimate of the crisis measures based on GaR thus indicates a 5% probability that this estimate or weaker GDP developments will be observed.
In the local projections, only the credit gap is used, ie the difference between credit relative to GDP and an estimated trend. In the GaR, a wider range of indicators is used, which includes credit, property prices and household debt service ratio. As there is considerable uncertainty attached to the measures and estimation of financial imbalances, several transformations of the indicators are also used, such as three-year change and change relative to various trends. All of Norges Bank’s indicators of financial imbalances are found to have a substantial impact on downward GDP risk, in particular commercial real estate prices and the household debt service ratio. When financial imbalances increase, estimated crisis depth is more severe.
Historical observations show that estimated GDP growth usually declines and estimated total GDP shortfall usually widens as the level of financial imbalances increases (Charts 3.A and 3.B). Each indicator is normalised based on its historical distribution in the period, resulting in the same scale for all of the indicators. The estimate from the local projections often indicates a more severe crisis than the estimate from GaR. This reflects the relative infrequency of severe financial crises.
Chart 3.A Estimates of steepest fall in GDP based on different measures of financial imbalances.1 Normalised levels of financial imbalance indicators (horizontal scale) Steepest fall in GDP in annual percentage growth (vertical scale). 1982 Q1 – 2019 Q1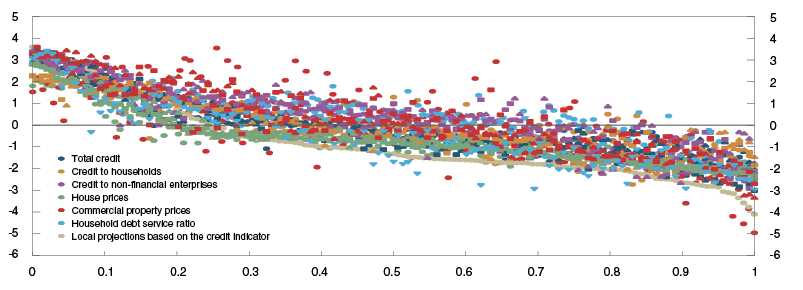
1) Quantile regressions are applied to quantify the correlation between downside risk for mainland GDP (fifth percentile) and various measures of financial imbalances (backdated two years). Measures of financial imbalances are normalised based on their cumulative distribution. All estimates based on the same indicator have the same colour. Different transformations are indicated by different shapes. Estimates based on local projections show the pre-crisis correlation between credit indicators and GDP developments in crises based on 20 OECD countries.
Sources: CBRE, Dagens Næringsliv, Eiendomsverdi, Finn.no, OPAK, Real Estate Norway, Statistics Norway and Norges Bank
Chart 3.B Estimates for total GDP shortfall over a three-year period based on various measures of financial imbalances.1 Normalised levels of financial imbalance indicators (horizontal scale). Total GDP shortfall measured as annualised percentage deviation from GDP (vertical scale).2 1982 Q1 – 2019 Q1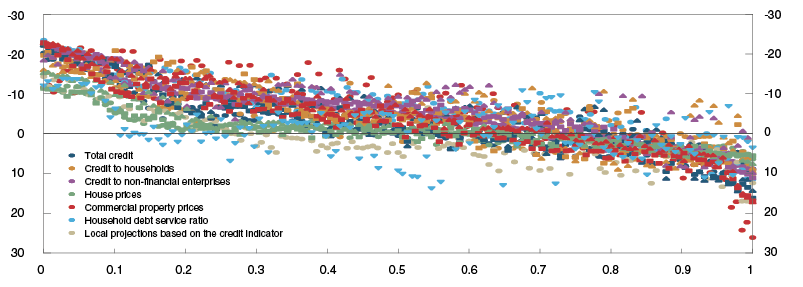
1) Quantile regressions are applied to quantify the correlation between downside risk for mainland GDP (fifth percentile) and various measures of financial imbalances (backdated three years). Measures of financial imbalances are normalised based on their cumulative distribution. All estimates based on the same indicator have the same colour. Different transformations are indicated by different shapes. Estimates based on local projections show the pre-crisis correlation between credit indicators and GDP developments in crises based on 20 OECD countries.
2) The vertical scale is inverted.
Sources: CBRE, Dagens Næringsliv, Eiendomsverdi, Finn.no, OPAK, Real Estate Norway, Statistics Norway and Norges Bank
Financial imbalances have built up over a long period
Chart 3.C shows the GDP path assumed in the 2019 stress test. The correlation between developments in financial imbalances and crisis depth is based on local projections and GaR. The level of the GDP paths has also been approximately adjusted so that the most severe events (in red) largely cover the developments observed in international crises for comparable countries. The level of the least severe GDP paths (in yellow) is approximately limited to zero growth in the first year and a total GDP shortfall of minus 5% in the first three years as a share of pre-crisis GDP. If the countercyclical capital buffer is kept at 2.5%, developments in the 2019 stress scenario are in the more severe portion of the fan, reflecting the build-up of financial imbalances over a long period. The macroeconomic scenario has been constructed by adding a series of macroeconomic shocks in Norges Bank’s main model NEMO. The size of the shocks is quantified to ensure that crisis depth and GDP paths are as shown in the chart.
Chart 3.C Potential GDP paths in the stress scenario and variation in financial imbalances Years after crisis start (horizontal scale). GDP is indexed. Year 0 = 010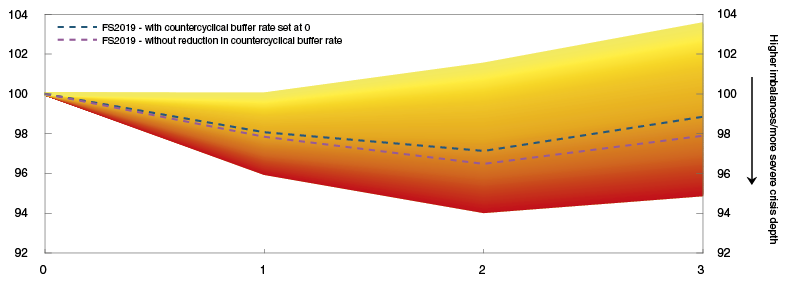
Source: Norges Bank
1 See eg Jordà, Ò., M. Schularick and A.M. Taylor (2013) “When Credit Bites Back”. Journal of Money Credit and Banking, 45 (2), December, pp 3–28.
2 See Jordà, Ò. (2005) “Estimation and Inference of Impulse Responses by Local Projections”. American Economic Review, 95 (11), March, pp 161–182.
3 Based on data for 20 OECD countries back to 1975. The dataset and the dating of the financial crises are based on Anundsen, A.K, K. Gerdrup, F. Hansen and K. Kragh-Sørensen (2016) “Bubbles and Crises: The Role of House Prices and Credit”. Journal of Applied Econometrics, 31 (7), November/December, pp 1291–1311.
4 See International Monetary Fund (2017) “Is Growth at Risk?”. Global Financial Stability Report. IMF, October 2017.
How does IFRS 9 affect impairment recognition in bad times?
A new accounting standard (IFRS 9) has changed the way banks recognise credit losses. Under IFRS 9, credit impairment shall be based on more forward-looking assessments than under the previous standard. The Bank has analysed how IFRS 9 may affect the path of Norwegian banks’ credit losses in a downturn. The results suggest that IFRS may increase impairment losses both immediately prior to and during bad times with higher credit risk.
IFRS 9 is intended to make impairment recognition more forward-looking
After the financial crisis erupted in 2008, the accounting rules for banks’ impairment recognition were criticised by the G20 leaders, authorities and investors. International Accounting Standard (IAS) 39 permitted banks to recognise credit impairment only if there was objective evidence of a loss event. According to critics, banks’ impairment recognition was thus “too little, too late”.
European authorities have responded to the criticism by introducing new accounting rules, International Financial Reporting Standard (IFRS) 9, from January 2018. Under IFRS 9, credit impairment shall be based on more forward-looking assessments by including recognition of expected credit losses. IFRS 9 is also intended to facilitate banks’ management of credit risk.
Under IFRS 9, loans are to be assigned to one of three stages for impairment purposes. For fresh loans, a provision for expected credit losses over the next 12 months must be recognised at the outset (stage 1). If the credit risk of a loan increases significantly, banks must recognise a provision for lifetime credit losses (stages 2 and 3). The largest Norwegian banks use changes in the loan’s probability of default (PD) to assess whether credit risk has increased significantly. Banks define their own criteria for the level of and change in a loan’s PD that is indicative of a significant credit risk. A loan is reclassified as stage 2 if the credit risk has increased significantly, but there is no objective evidence that the loan is impaired. Reclassification from stage 2 to stage 3 requires objective evidence of impairment, eg that a loan has been non-performing for at least 90 days. Since stage 3 requires objective evidence of impairment, this stage largely corresponds to credit losses under IAS 39.
IFRS 9 results in higher impairment losses when credit risk increases
Several studies show that IFRS 9 may result in higher impairment losses than IAS 39 when credit risk increases, because unlike under IAS 39, banks must, to a larger degree, recognise a provision for expected credit losses over the entire lifetime of a loan.1 In this situation, banks’ capital adequacy may fall faster and more sharply than under IAS 39.
We have performed a counterfactual analysis of credit losses on banks’ corporate exposures by applying IFRS 9 in Norway in the period 2001–2017, with a particular focus on credit losses in bad times.2 Losses on corporate exposures have accounted for around three-fourths of Nordic banks’ credit losses since 2000. Estimated paths for credit losses under IAS 39 and IFRS 9, which are calculated using the same data set and consistent assumptions, form the basis for our assessments of how the transition to IFRS 9 may affect banks’ impairment losses.
We calculate banks’ credit losses under IAS 39 by multiplying the bank debt of enterprises that have gone bankrupt or experienced financial problems by an estimate of the loss given default (LGD). Our calculations provide a reasonable estimate of developments in actual credit losses.
We estimate credit losses under IFRS 9 with assumptions tailored to reported practices at the largest Norwegian banks. We use PD estimates from Norges Bank’s bankruptcy probability model to classify enterprise’ bank debt into stages 1 and 2.3 Enterprises are classified as stage 3 when they go bankrupt or experience financial problems. Chart 3.D shows the share of bank loans classified as stages 1, 2 and 3 with our calculations. The share of loans classified as stages 2 and 3 increase during the downturn in 2002–2003 and the financial crisis in 2008–2009.
Chart 3.D Estimated classification under IFRS 9 of bank loans to enterprises established in 2000 or later By stage (1, 2 and 3). Percent. 2001–2018
Source: Norges Bank
We calculate credit losses for the three stages under IFRS using the same LGD estimates we used to calculate the IAS 39 losses, to ensure that the loss paths are comparable. In addition, we calculate credit losses for stage 1 using a PD estimate from the bankruptcy probability model. We adjust the PD estimates when calculating credit losses for stage 2 so that they reflect the probability of default of the lifetime of the loan.
Chart 3.E shows that the estimated losses under IFRS 9 are higher than the estimated IAS 39 losses both immediately prior to and during the downturn in 2002–2003 and the financial crisis in 2008–2009. Overall, the estimated IFRS 9 losses are around a fifth higher than the estimated IAS 39 losses both immediately prior to and during the two downturns. The estimates also indicate that IFRS 9 may result in lower credit losses than IAS 39 in periods after economic downturns with increased credit risk.
Chart 3.E Estimated losses under IAS 39 and IFRS 9 on bank loans to enterprises established in 2000 or later as share of bank loans Percent. 2001–2018
Source: Norges Bank
Our estimated loss paths under IAS 39 and IFRS 9 are fairly similar. This may be because our losses have been calculated for a period that does not contain a sharp downturn with large bank losses. Credit risk will increase significantly on a large share of banks’ exposures during such a crisis, in which case the difference between losses under IFRS 9 and IAS 39 may turn out to be substantially greater.
1 Abad, J. and J. Suarez (2017), “Assessing the cyclical implications of IFRS 9, a recursive model”. Occasional Paper Series 12/2017. ESRB. July 2017. Krüger, S., D. Rösch, and H. Scheule (2018), “The impact of loan loss provisioning on bank capital requirements”, Journal of Financial Stability, 36. Pp 114–129. Plata, C., M. Rocamora, A. Rubio aand J. Villar (2017), “IFRS 9: Pro-cyclicality of provisions. Spanish banks as an illustration”, BBVA Research.
2 See Andersen, H. og I.N. Hjelseth (2019), “How does IFRS 9 affect banks’ impairment recognition in bad times?” Staff Memo 9/2019, Norges Bank (forthcoming in English), for a detailed description of the analysis.
3 See Hjelseth, I.N. and A. Raknerud (2016), “A model of credit risk in the corporate sector based on bankruptcy prediction”, Staff Memo 20/2016, Norges Bank, for a detailed description of the bankruptcy probability model.
Assessment of contagion effects in the banking sector
Banks are interconnected inter alia through their substantial cross-holding of covered bonds. A new model framework analyses possible contagion effects in the Norwegian banking sector. The analysis shows funding problems may trigger several rounds of fire sales. The subsequent decline in securities prices, will result in losses in addition to those in the stress test.
Norges Bank has developed a model framework to quantify possible interbank contagion effects.1 At the current stage of the model, the analysis allows us to illustrate the importance of various mechanisms and highlight the risk of contagion. The model is based on existing academic literature2 that typically assumes that sales of securities by one bank leads to a drop in its price, which in turn affects everybody holding the security (indirect contagion) or because a counterparty in the banking system defaults (direct contagion). Banks subjected to indirect contagion may be affected by the situation of other banks even when not directly exposed to banks that default. Indirect and direct contagion can happen separately, but may also be mutually reinforcing. The results from the analysis provide insight into the potential influence of structural conditions in the banking system on systemic risk.
The starting point of Norges Bank’s analysis is that banks incur losses equivalent to those in the stress test (Section 3.2) with a more pronounced impact on some banks than on others. In the model, banks with high credit losses and weakened CET1 ratios are assumed to have funding problems owing to waning creditor and investor confidence. As there is considerable uncertainty regarding the magnitude of losses that will trigger funding problems, the model performs a large number of simulations at different thresholds of the CET1 ratio below which banks are assumed to face funding problems.
When banks in the model are subject to funding problems, they will seek to sell securities3 to boost liquidity quickly. Fire sales add to the supply of securities, which will lead to a drop in prices, giving rise to indirect contagion. The decline in the prices of securities sold will depend on market liquidity in a stressed situation.4 After each round of fire sales, more securities may have declined in value. Banks holding these securities will incur further valuation losses, which may lead to more rounds of fire sales if banks experience further funding problems.
In our model, direct contagion arises if losses from fire sales lead to a bank entering resolution. Resolution is assumed to take place once banks’ CET1 ratios have fallen below a certain level. Banks with exposures to other banks, which are covered by the bail-in rules, must then bear losses or have portions of their debt converted into CET1 capital.5 However, the magnitude of such exposures is small.
Contagion effects are simulated in the model until banks do not need any more adjustments. Finally, the reduction in the banking sector’s CET1 ratio is estimated owing to contagion effects related to fire sales and recapitalisation procedures.
Indirect contagion from fire sales of securities can potentially result in substantial losses
Securities account for 8% of sample banks’ total assets, 62% of which are covered bonds.6 Securities exposures amount to 118% of banks’ CET1 capital. This means that impairments owing to fire sales may potentially have a substantial impact on banks’ CET1 ratios. Banks are important covered bond investors, and the sample banks hold just under 40% of the outstanding value of the covered bonds they have invested in.
In the analysis, it is assumed that direct exposures that may be used in a bail-in amount to 12% of banks’ CET1 capital.7 This assumption overstates the potential for bail-in losses, as the data do not provide information on whether exposures are covered by the bail-in rules. Even though the portion of exposures that can be used for a bail-in is overstated for the time being, the analysis shows that losses from direct contagion are small.
Chart 3.F shows a possible breakdown of losses owing to contagion effects. The breakdown reflects the varied importance of different mechanisms in the model owing to the large number of simulations performed.
Chart 3.F Estimated probability density function of losses due to contagion in the banking sector1 Percentage point fall in CET1 capital ratio
1) The shaded area sums to one. The density is non-parametric and is based on 30 000 simulations. In each simulation, one value is drawn for each of the 20 stochastic parameters in the model.
Sources: Finanstilsynet (Financial Supervisory Authority of Norway), VPS and Norges Bank
In most of the simulations, the losses are equivalent to a reduction in banks’ CET1 ratio of about 0.5 percentage point, but in some cases, losses may be equivalent to a reduction in banks’ CET1 ratio of about 2 percentage points. The losses mainly result from indirect contagion. Losses are generally driven by a decline in the prices of covered bonds and central and local government bonds. Since banks have substantial exposures to these securities, relatively high losses may arise even in the event of a modest price decline. The more severe losses arise when an economic downturn forces large banks into fire sales. Losses are also higher when banks conduct sales without taking into account the market liquidity of the securities to be sold. The level of banks’ CET1 ratio that triggers funding problems was also found to be crucial to the magnitude of the losses.
Over time, structural conditions in the banking system may change, resulting in some mechanisms becoming more important than others. This could also affect systemic risk and the financial stability outlook.
1 A detailed description of the framework will be presented in Bjørland, C. and T. Kockerols “A macro-contagion stress test framework for Norway”. Staff Memo (forthcoming), Norges Bank.
2 Cont, R. and E. Schaaning (2017) “Fire sales, indirect contagion and systemic stress testing”. Working Paper 2/2017. Norges Bank. Hüser, A.-C., G. Hałaj, C. Kok, C. Perales and A. van der Kraaij (2017) “The systemic implications of bail-in: a multi-layered network approach”. ECB Working Paper No. 2010.
3 In the model, banks can also sell illiquid assets. Illiquid assets are sold at a discounted price that increases losses, but these sales do not result in contagion to other banks in the model. We consider the uncertainty regarding the share of illiquid assets sold and the discount in our model simulations.
4 We take the uncertainty surrounding market liquidity into account and simulate from a distribution of different configurations regarding market liquidity.
5 Foreign creditors and Norwegian investors that are not included in the model are assumed to bear a portion of the losses. We consider the uncertainty regarding this mechanism in the model simulations. The losses incurred by these creditors are not taken into account when the losses are aggregated.
6 Based on data from VPS at the end of 2019 Q2.
7 Based on the reporting of large exposures (CRD IV) at the end of 2019 Q2. The exposures are after deductions (cf Section 6 of the regulation on credit institutions’ and investment firms’ large exposures).
4 Climate risk and the financial system
Climate risk is of significance for financial stability. Climate risk is related to both the physical impacts of climate change and the implications of the transition to lower greenhouse gas emissions. Climate change is a global challenge that must primarily be addressed by the political authorities, using instruments other than those available to central banks. The financial system must at the same time adapt to climate risk. Climate risk may expose the financial system to credit losses, and uncertainty about climate risk exposure may result in funding problems. Central banks and supervisory authorities can, within their mandates, promote financial stability by helping to pave the way for the financial sector to include climate risks in overall risk assessments and communicate relevant information and by ensuring that financial institutions have adequate capital to support all risks. For Norwegian banks and financial markets, transition risks, particularly related to the oil and gas industry, may be important in the years ahead.
4.1 Climate risk and financial stability
Climate change and society’s adaptation to climate change will affect all segments of the economy and entail risks to financial stability. It has been established with a high degree of certainty that climate change has occurred and will occur, and the probability of outcomes that are far more severe than the most likely outcomes is not negligible.1 At the same time, there is considerable uncertainty as to the magnitude and timing of the changes, what the correct response is today and what the response will actually be. Climate risk is thus a source of market failure that may contribute to mispricing and inefficient resource allocation for society (see "Climate risk and financial market failure").
Analyses of the economic implications of climate risk often make a distinction between physical risk and transition risk. Physical risk is linked to the direct impacts of climate change, such as temperature increases and more extreme weather. Transition risk is related to various forms of adaptation to lower emissions, such as changes in climate regulation, new technology and changing investor and consumer preferences.
For Norwegian banks, climate risk can entail loan losses, reputational risk and consequences for financing. For banks as a whole, an increase in losses on loans to the retail and corporate sectors will likely be the most important. The biggest lending risk comes from unexpected shifts that entail consequences for ongoing projects. Climate-related direct costs and losses can arise when climate risk is not assessed in the project planning. Unexpected changes in market expectations, consumer preferences and regulation may also occur, for example in the wake of climate-related natural disasters. Moreover, developments in climate-friendly technology can reduce the cost of, and hence increase the probability of, abrupt tightening of regulation of old technology. For example, new energy sources could make it easier to phase out of fossil energy.
Physical risk – biggest risk from global conditions
According to Norway’s Climate Risk Commission, Norway’s exposure to direct physical climate change is limited, and its capacity to adapt is relatively good.2 Physical risk may nevertheless affect Norwegian firms and households. Physical risk is often systematic, undiversifiable and its impact is always negative. Managing this risk is challenging for financial institutions and other economic agents.
Global climate change can lead to an increase in goods and services prices, and give rise to a substantial risk of escalating global conflict and new migration patterns.
In Norway, property, agriculture, transport, fish farming, tourism and other weather- and climate-dependent sectors could be exposed to physical climate risk as a result of floods, landslides, avalanches and temperature increases. The Norwegian National Scheme for Natural Damage Assistance, which is based on payments from insurance undertakings, covers to a large extent physical damage to property.3 Large insurance settlements can result in higher insurance premiums and have implications for future regulation of the Scheme. An increase in insurance premiums may therefore be a consequence of physical climate risk in exposed areas, which may in turn have an impact on property values and lending for those areas.
Transition risk – most relevant climate risk for banks now
Transition risk exists in most sectors that could be exposed to climate regulation, emissions pricing, or competition from new climate-friendly technology. In addition, changes in customer preferences and investor demands can lead to unexpected shifts that have implications for existing projects. This could entail an increase in credit risk for bank lending. Since different agents are impacted in different ways, transition risk is unsystematic.4 Transition risk may therefore be diversifiable. At the same time, banks’ exposures will be a reflection of the Norwegian economy and industry structure. This can limit Norwegian banks’ genuine opportunities for diversification.
Transition risk can lead to financing risk. Higher transition-related credit risk can lead to higher risk of loan losses and hence higher financing costs or shorter maturities for banks’ financing. Mandate changes and other investor demands can result in an unexpected shift in the willingness to finance. If funding markets consider that some banks are highly exposed to transition risk, their access to financing may suffer. This may in turn lead to reduced access to financing for firms and households, also for those with low transition risk. Transition risk may, like many other forms of risk, contribute to systemic risk.
In Norway, the oil and gas industry is the main source of transition-related credit risk. For the Norwegian economy as a whole, this risk has declined as national wealth has been re-allocated from petroleum resources to diversified foreign investments. For banks, risk is determined by credit exposure. The risk in the oil industry is related to both a possible decline in global oil demand and structural changes to adapt production. A substantial decline in oil demand as a result of changes in climate policy, customer preferences or technological developments likely lies many years ahead. Expectations of a change may nevertheless cause a shift already today, partly because Norwegian oil and gas fields have a long life with substantial initial investments. Return requirements for financing projects and companies operating in the oil-related industry have increased in recent years, and may increase further. Countries with large oil reserves may increase the supply of oil today in response to uncertainty about future oil prices. This could push down oil prices and weaken the debt-servicing capacity of oil-related companies in Norway.
Norwegian banks have reduce their exposure to the oil industry in recent years (Chart 4.1), but it remains important for Norwegian banks. The experience of the oil price decline showed that oil service companies were just as vulnerable to oil price movements as operators on the Norwegian shelf (see "Banks and the experience gained from the downturn in the oil industry").5
Chart 4.1 Developments in DNB’s oil-related exposures Percent of EAD1. At year-end. 2014 – 20192
1) Exposure at default.
2) Data for 2019 are at 30 June 2019.
Source: DNB
Large losses for the banks as a whole will likely occur if a structural decline in oil-related activities have large spillovers on other sectors of the economy. Banks are especially vulnerable should the spillovers lead to a sharp fall in prices for commercial and residential property, which account for the largest share of banks’ lending.
Property can also be affected by transition risk through stricter building and energy consumption requirements. Commercial property renters may increasingly prefer energy-efficient buildings in the interest of their own climate reporting, reputation and costs. This could lead to a price fall and increased need for investment in older commercial properties, while new buildings may increase in value.
Industries that have low or no emissions pricing today may be exposed to transition risk further ahead. Agriculture and fisheries are two examples (Chart 4.2). Other examples are imported goods and international freight transport, to which Norwegian banks are heavily exposed. The banks will be affected by whether, how and how fast emissions pricing or requirements are phased in.
Chart 4.2 Emissions pricing in Norway NOK per tonne CO2-equivalent (vertical scale) and millions of tonnes CO2-equivalent (horizontal scale). 2016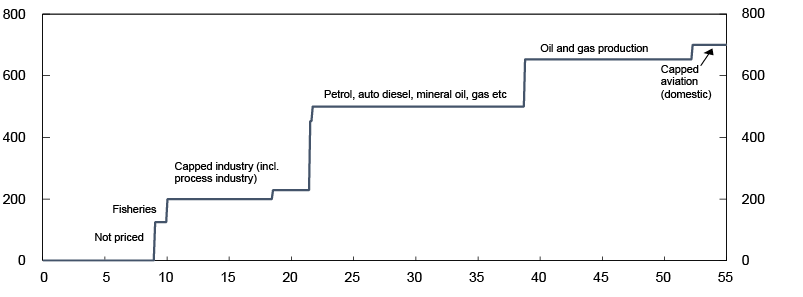
Sources: Ministryof Finace, Norwegian Environment Acency and Statistics Norway
Since 2008, Norway has participated in the EU Emissions Trading System (ETS). The system covers a number of industries, and sets a cap on total allowed emissions for the ETS sector, instead of regulating emissions for individual operators (Chart 4.2). Emission pricing is determined by emissions trading in a market, and the ETS allowances of each company determines who reduces emissions and to what extent. The authorities impose emissions reductions by reducing the total allowance over time. The price of emissions allowances increased sharply in the EU in 2018, owing to extraordinary allowance reductions6 (Chart 4.3). The EU is planning to reduce allowances annually in the period to 2030. The risk of a sharp price rise for climate emissions constitutes a transition risk, particularly for companies that cannot compensate through selling prices. Flexible adaptation options, such as the choice between buying allowances and investing to reduce emissions, can contribute to mitigating transition risk.
Chart 4.3 Price of CO2 European emissions allowance In EUR. 1 January 2015 – 25 October 2019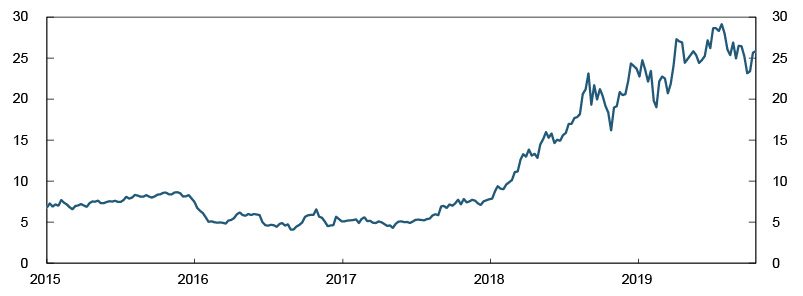
Source: Bloomberg
Stricter climate requirements can hasten the introduction of new technology. For some companies, this will entail closures or restructuring, while other may gain competitive advantages. Norway has access to climate-friendly electricity production. The transition to lower emissions can therefore give rise to opportunities for Norwegian companies and lower credit risk for some corporate exposures.
Banks and the experience gained from the downturn in the oil industry
The evolution of US shale oil production over the past decade is a structural shift that has had an impact on Norwegian oil-related industries, requiring them to adapt. In assessing the transition risks arising from this shift, the experience gained from the oil price decline in 2014 may therefore be relevant.
Risk associated with banks’ oil-related lending increased following the oil price fall in 2014, particularly in the offshore segment. Risk weights rose for DNB’s oil, gas and offshore loans (Chart 4.A).1 Applying higher risk weights can be an effective tool for banks in their management of climate-related risk. The level of capital a bank must hold against these loans rises, inducing banks to raise the threshold for providing new loans. Higher risk weights can also lead to increased lending rates or tighter credit standards.
Chart 4.A Risk weights for DNB’s aggregate corporate loans and oil-related loans Healthy IRB portfolios. Percent. At year-end. 2014 – 2018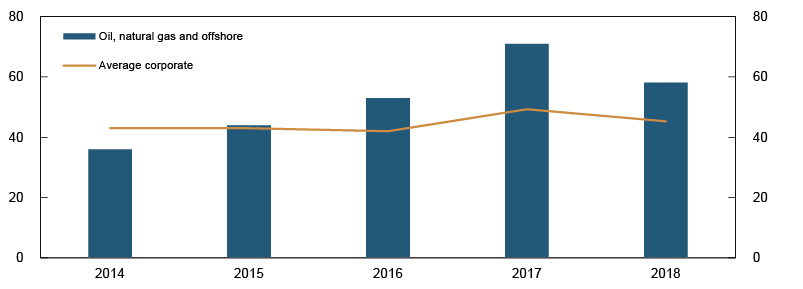
Source: DNB
There is reason to believe that risk may be higher in a larger number of segments in a structural, climate-related downturn compared with a cyclical downturn. In a structural downturn, investors are less likely to inject fresh capital into an enterprise. The result may be lower collateral values, higher probability of default rates and thereby higher bank losses. Since banks’ exposure to oil-related industries make up less than 5%2 of banks’ total exposure at default (EAD), Norwegian banks are nonetheless well positioned to absorb such losses if these losses are spread over several years.3
1 Risk weights could fall if loan losses are low for a longer period.
2 At the end of 2015, oil-related exposure accounted for 5% of total EAD for the 16 largest banks, according to Finanstilsynet (Financial Supervisory Authority of Norway). The bank with the largest nominal oil exposure, DNB, has reduced its oil-related exposures by 40% between the end of 2015 and the first half of 2019.
3 The loss-absorbing capacity of the banks with the highest oil-related exposure was about 21% of oil-related loans at the end of 2015 (see Hjelseth I.N., L.T. Turtveit and H. Winje (2016) “Bank’s credit risk associated with the oil service industry”. Economic Commentaries 5/2016. Norges Bank.
1 See NOU 2018:17. Climate risk and the Norwegian economy (Climate Risk Commission), page 59.
2 See NOU 2018:17. Climate risk and the Norwegian economy (Climate Risk Commission), page 67.
3 See Finanstilsynet (2019) “Risk Outlook – June 2019”. Theme III discusses climate risk and the implications for insurance undertakings. The Scheme for Natural Damage Assistance is based on payments from insurance undertakings, but is not risk-sensitive.
4 See NOU 2018:17. Climate Risk and the Norwegian economy (Climate Risk Commission), page 59.
5 Note that climate risk is not the only transition risk to which this industry will be exposed in the coming years. Examples of other risks related to the Norwegian oil industry are oil discoveries on the Norwegian shelf and continued strong growth in US shale oil production.
6 In 2017, EU member states agreed to reform the ETS so that a larger number of surplus allowances are removed from the market.
4.2 Banks’ adaptation
The attention devoted to climate risk by banks, other financial institutions and investors has increased. In 2018, Finance Norway published a “Roadmap for Green Competitiveness in the Norwegian Financial Sector”. The Norwegian Climate Foundation took stock of the work on climate risk at the 10 largest banks in the Norwegian market.7 All the large banks reported that they had discussed climate risk at senior management level in the past year. Over half of the banks had assessed how climate risk could influence the banks’ business and 40% had analysed the impact of climate change on their loan portfolios. The banks are still in the initial phase of analysing climate risk and building expertise.
A better information basis for analysing climate risk
Banks have various adaptation options for reducing their own climate risk. Improved and more relevant reporting of climate risk by companies can enhance the information basis and support more appropriate pricing of climate risk. For banks, this can also help increase focus on such risk internally, and build investor confidence.8 Investors are likely to request such information. Many of the most oil-exposed banks have regularly described and updated risk assessments of their oil exposures since the oil price decline in 2014. Similar actions can be used for climate risk.
Diversification and green securities can influence risk in loan portfolios
Banks can reduce climate risk in their loan portfolios in several ways. As transition risk can be diversifiable, banks have the option of mitigating risk by reducing their exposure to loans with high transition risk.
An increase in credit risk on loans to industries as a result of a risk of higher emissions prices can be matched by exposures to low-emission industries. Such industries, such as climate-friendly electricity production, can benefit from higher emissions prices. At the same time, there may be other risks associated with such “green” investments, which must be taken into account.
In recent years, a market for securities with a certified climate profile has emerged, referred to as green securities. In addition to the diversification motive, demand for green securities may be attributable to different factors, such as investor preferences and mandates for green securities for reasons of sustainability and reputation. Moreover, investors may assume that investments with lower climate risk will generate higher returns. A green security does not, however, necessarily feature lower risk. Some green securities are linked to new technology, which historically have entailed high risk.
For the green securities market to function well over time, formal and standardised requirements that can be evaluated should be introduced. The absence of such requirements can create uncertainty about whether green financing is actually used for climate-friendly projects. There are various certification schemes that classify securities as green to varying degrees. The classification of green investments is based on third-party evaluations that are conducted by research organisations or certification companies. Oslo Børs has its own list of green bonds. The EU is working on establishing standardised definitions, but they have yet to be adopted.9
7 See Bjartnes, A., A. Jortveit, L.-H.P. Michelsen, O.A. Øvrebø and H. Skaugen (2018) “Klimarisiko – finans og børs”. Rapport 07/2018, Norsk klimastiftelse (in Norwegian only).
8 An example of climate reporting is Bloomberg, M.R. et al. (2017) ”Recommendations of the Task Force on Climate-related Financial Disclosures“. According to the TCFD recommendations, financial disclosures should describe governance, strategy, risk management, metrics and targets in connection with the company’s climate-related risks and opportunities. The TCFD also recommends conducting stress tests that illustrate how different climate scenarios are handled.
9 See European Commission (2019) ”EU Green Bond Standard“ and ”EU taxonomy for sustainable activities“.
4.3 Relevant financial sector measures
Climate risk encompasses a broad range of conditions, which to a large extent lie outside of central banks’ area of operation and area of direct influence. Climate change is a global challenge, which must primarily be addressed by the political authorities and instruments other than those available to central banks. The financial system must, however, adapt to climate risk. Central banks and financial supervisory authorities cannot, within their mandates, promote financial stability by contributing to the inclusion of climate risk in the financial sector’s risk assessments. Climate risk must be managed in the same way as other risks facing the financial sector. Other types of risk may also be systematic and characterised by the fact that historical data have uncertain relevance for future risk. The instruments for strengthening banks’ resilience, such as capital requirements and macroprudential supervision, are thus basically the same as those used for managing other risks.
The authorities can contribute to improved assessment of climate risk
Managing the uncertainty associated with the magnitude and effect of climate change may entail substantial costs. Simplified approaches may ignore or overestimate climate risk. The authorities can promote knowledge-based public debate and help reduce uncertainty by setting disclosure standards. A common framework for information and analysis of climate risk can facilitate comparison and assessment of climate risk in individual institutions. It can support more appropriate risk pricing. Such standardisation processes are underway in the EU and other fora. International cooperation can be useful in this work (see box to the left).
Climate risk should be an integral part of financial risk assessments
Both banks and authorities should assess the extent to which climate risk affects financial risks, such as credit risk, financing risk and systemic risk. This should be taken into account in risk assessments and hence into assessments of whether banks have adequate capital and long-term financing. Climate risk can entail a need to strengthen banks’ resilience, but a range of mechanisms have already been introduced to ensure that banks have adequate capital to cover unexpected losses.
Norwegian banks estimate risk weights using a long loss history, which includes loss experiences in the aftermath of the oil price decline in 2014. There is reason to believe that models based on historical data will not capture the risk associated with long-lasting structural changes such as climate risk. It is therefore possible that banks’ risk weights underestimate climate risk.
If financial institutions and analysts apply a planning horizon that is too short, banks may not fully take into account climate risk that could lie further ahead in time. The Swedish Financial Supervisory Authority (Finansinspektionen) and the Bundesbank have expressed concern about this aspect.10
In today’s system, additional capital requirements are to be assessed if a bank’s credit exposure constitutes a systemic risk. Climate risk should be included in such as assessment.
Norges Bank will continue to work on how climate risk should be integrated into the work on financial stability, inter alia by participating in the Network for Greening the Financial System (NGFS).
Network for Greening the Financial System
National and international cooperation can raise our knowledge level. The Network for Greening the Financial System (NGFS) is a network of central banks and financial supervisors from around the world. Its goal is to build knowledge and share best practices on climate risk management within the financial system and to promote the financing of investment to support sustainable developments. The NGFS is an arena for systematic knowledge-building in this field. The NGFS was established in 2017. Norges Bank and Finanstilsynet (Financial Supervisory Authority of Norway) joined the network in 2018 and 2019 respectively.
The first NGFS comprehensive report, “A call for action – climate change as a source of financial risk”, was published in April 2019. The report contains six non-binding recommendations for central banks and financial supervisors, calling for action within their mandates to
(i) integrate climate-related risks into financial stability monitoring and micro-supervision,
(ii) integrate sustainability factors into own-portfolio management,
(iii bridge the data gaps about climate-related risks, and
(iv) build awareness and share knowledge about climate-related risks.
Further recommendations urge other policymakers to
(v) achieve a robust and internationally consistent climate and environmental disclosure framework, and
(vi) support the development of a taxonomy of economic activities that may be exposed to climate risk.
10 See Finansinspektionen (2016) ”Climate change and financial stability“ and Bundesbank (2017) ”Behind the curve? The role of climate risks in banks’ risk management“.
Climate risk and financial market failure
There are aspects of climate risk that may contribute to market failure. Substantial downside risks with a considerable probability of extreme outcomes may contribute to mispricing, which may be amplified by information asymmetry. The authorities can reduce the risk of market failure by introducing regulatory and other requirements.
Climate risk will affect financial market assessments of projects. At the same time, it is uncertain whether financial markets are assessing and thereby pricing climate risk correctly. There are aspects of climate risk that may contribute to financial market failure. Market failure refers to situations where the market solution does not provide society with an efficient utilisation of available resources.
Substantial downside risks
Substantial downside risks are a typical feature of climate scenarios. These entail mispricing risks. A higher probability of extreme outcomes can result in a wider pricing gap between market participants and make pricing sensitive to new, negative information. In the short term, prices may be kept elevated because financial market participants take short-term positions in long-term projects.1
Substantial market participant exposures to industries where risk is underestimated and prices thereby overvalued may have systemic effects. The Bank of England (2015)2 points out that financial markets may have overvalued prices in industries with a substantial climate change footprint.
Asymmetric information can lead to oversimplified assessments
Relevant information about climate risk exposure can be important in order to assess a project’s level of risk. Such information is difficult to find without technical expertise and detailed knowledge of the company. The company will therefore often have information that is not necessarily available to the investor.
When information asymmetry is substantial, market participants can rely on oversimplified assessment and simple indicators rather than conducting a comprehensive analysis. For example, an industry or a nationality might be considered a proxy for climate risk exposure, even though climate risk exposure actually varies widely within these designations. Alternatively, when faced with complex issues, it can be easier to reduce the exposure than to conduct a thorough risk assessment. Market participants such as investment funds or banks may also divest from investments to reflect customers’ preferences regarding investments perceived as unsustainable, irrespective of the actual climate risk exposure. Uncertainty about climate risk can thereby restrict access to credit for households and enterprises that are not to any great extent directly exposed to or a source of such risk.
1 In the financial literature, this is referred to by the term “short-termism”.
2 See Carney, M. (2015), “Breaking the tragedy of the horizon – climate change and financial stability”, speech given on 29 September 2015. Bank of England.
Annex
The Norwegian banking sector
See also Norway´s financial system 2019 for a description of the Norwegian financial system.
Chart 1 Lending market shares1,2 Percent. At 30 June 2019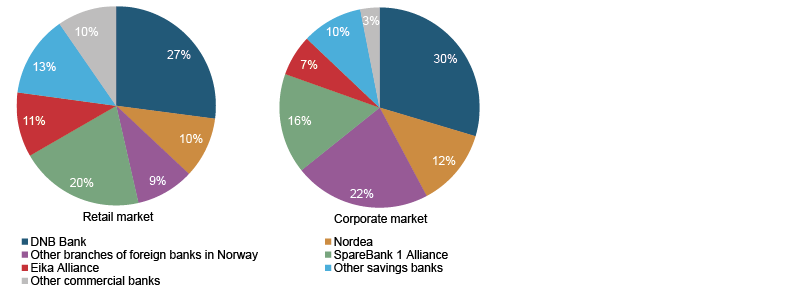
1) All banks and mortgage companies in Norway.
2) See Table 2.
Source: Norges Bank
Chart 2 Gross domestic lending to the non-financial sector by credit source In billions of NOK. At 30 June 2019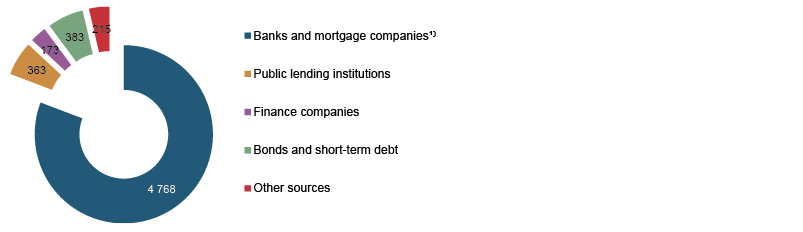
1) All banks and mortgage companies including Eksportfinans.
Source: Statistics Norway
Chart 3 Lending1 by all banks and mortgage companies Percent. At 30 June 2019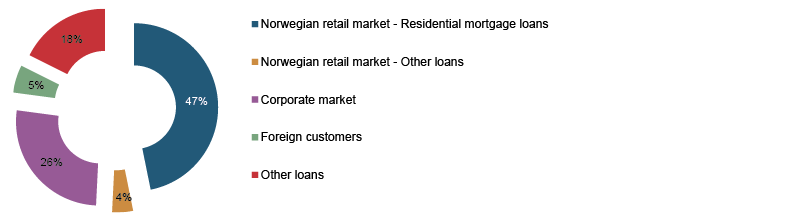
1) Total lending of NOK 5 720bn.
Source: Norges Bank
Chart 4 Lending to the corporate market1 by all banks and mortgage companies Percent. At 30 June 2019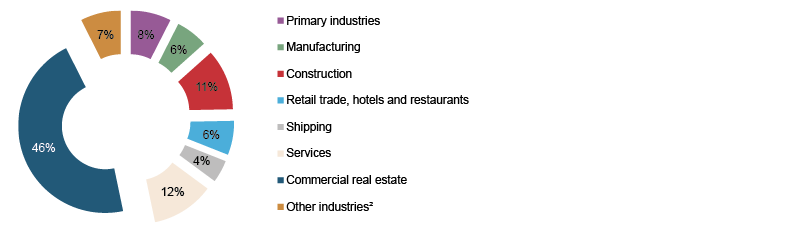
1) Total corporate loans NOK 1 506bn
2) Other industries comprise “Oil service”, “Other transportation”, “Electricity and water supply” and “Extraction of natural resources”. Here, “Oil service” is narrowly defined.
Source: Norges Bank
Chart 5 Balance sheet1 of Norwegian-owned banks and covered bond mortgage companies2 Percent. At 30 June 2019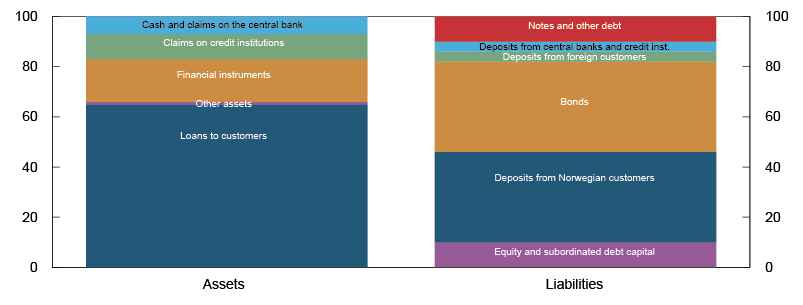
1) Intercompany items between banks and mortgage companies are not eliminated.
2) All banks and mortgage companies excluding subsidiaries and branches of foreign banks in Norway.
Source: Norges Bank
Table 1 Structure of the Norwegian financial industry at 30 June 2019
|
Number |
Lending1 (NOK bn) |
Total assets (NOK bn) |
|
|
Banks (excluding branches of foreign banks) |
121 |
2 027 |
4 048 |
|
Branches of foreign banks |
14 |
789 |
1 476 |
|
Mortgage companies (including branches of foreign companies) |
33 |
1 937 |
2 325 |
|
Finance companies (including branches of foreign companies) |
41 |
173 |
197 |
|
State lending institutions |
3 |
363 |
375 |
|
Life insurance companies (excluding branches of foreign companies) |
11 |
126 |
1 629 |
|
Non-life insurance companies (excluding branches of foreign companies) |
55 |
3 |
189 |
|
NOK bn |
|||
|
Market value of equities and equity certificates, Oslo Børs |
2 662 |
||
|
Outstanding domestic bond and short-term paper debt |
2 242 |
||
|
Issued by public sector and state-owned companies |
742 |
||
|
Issued by banks |
345 |
||
|
Issued by other financial institutions |
611 |
||
|
Issued by other private enterprises |
225 |
||
|
Issued by non-residents |
319 |
||
|
GDP Norway (2018) |
3 533 |
||
|
GDP mainland Norway (2018) |
2 900 |
1 Lending to the public only, ie lending to credit institutions and foreign customers is excluded.
Sources: Finanstilsynet (Financial Supervisory Authority of Norway), Oslo Børs, Statistics Norway, VPS and Norges Bank
Table 2 Market shares1 of banks and mortgage companies in Norway at 30 June 2019. Percent
|
Gross lending to |
Deposits from |
|||
|
Retail market9 |
Croporate market10 |
Retail market9 |
Croporate market10 |
|
|
DNB Bank2 |
27 |
30 |
29 |
35 |
|
Nordea3 |
10 |
13 |
7 |
12 |
|
Branches of foreign banks in Norway4 (excluding Nordea) |
9 |
22 |
6 |
19 |
|
SpareBank 1 Alliance5 |
20 |
16 |
19 |
15 |
|
Eika Alliance6 |
10 |
7 |
13 |
8 |
|
Other savings banks7 |
13 |
10 |
13 |
9 |
|
Other commercial banks8 |
10 |
3 |
14 |
2 |
|
Total |
100 |
100 |
100 |
100 |
|
Total (NOK bn) |
2 905 |
1 506 |
1 286 |
730 |
1 The market shares are calculated by summing the balance sheet items for the institutions in the different groups.
2 DNB Bank, DNB Boligkreditt and DNB Næringskreditt.
3 Nordea Bank AB (Publ), branch in Norway and Nordea Eiendomskreditt.
4 Danske Bank, Handelsbanken, Handelsbanken Eiendomskreditt, eight other branches and one mortgage lender.
5 SpareBank 1 SR-Bank, SpareBank 1 SMN, SpareBank 1 Østlandet, SpareBank 1 Nord-Norge, the other eleven savings banks in the Sparebank 1 Alliance, SpareBank 1 Boligkreditt og BN Bank, one commercial motgage lender, one mortgage lender and one other residential mortgage lender.
6 Eika Boligkreditt, Eika Kredittbank, 67 savings banks and three commercial banks which are owner of Eika Gruppen AS and three other residential mortgage lenders.
7 Sparebanken Vest, Sparebanken Vest Boligkreditt, Sparebanken Sør, Sparebanken Møre og Sparebanken Sogn og Fjordane, 13 other savings banks, seven residential mortgage lenders, one mortgage lender and one hybrid covered bond mortgage company.
8 Sbanken ASA, Santander Consumer Bank AS, Eksportfinans, Gjensidige Bank ASA, Storebrand Bank, Landkreditt Bank, 19 other commercial banks and five other residential mortgage lenders, Kommunalbanken and one municipal mortgage lender.
9 The retail market comprises wage earners, pensioners, benefit recipients and students.
10 The corporate market primarily comprises non-financial private enterprises and the self-employed.
Source: Norges Bank
Table 3 Rating by Moody’s1, total assets, leverage ratio2, capital adequacy2 and return on equity for Nordic and Norwegian banks at 30 June 2010. Consolidated figures
|
Credit rating |
Total assets (NOK bn) |
Leverage ratio (%) |
Common Equity Tier 1 (CET1) capital ratio (%) |
Return on equity |
||||
|
Short- term |
Long- term |
|||||||
|
2017 |
2018 |
2019 Q1–Q2 |
||||||
|
Nordea Bank |
P-1 |
Aa3 |
5 765 |
5.0 |
14.8 |
9.5 |
9.7 |
7.2 |
|
Danske Bank |
P-1 |
A2 |
5 004 |
4.4 |
16.6 |
13.6 |
9.8 |
9.0 |
|
Handelsbanken |
P-1 |
Aa2 |
2 863 |
4.5 |
17.1 |
12.3 |
12.8 |
12.8 |
|
SEB |
P-1 |
Aa2 |
2 684 |
4.6 |
16.6 |
11.7 |
16.3 |
13.2 |
|
DNB |
P-1 |
Aa2 |
2 879 |
7.1 |
16.5 |
10.8 |
11.7 |
12.7 |
|
Swedbank |
P-1 |
Aa2 |
2 286 |
4.8 |
16.1 |
15.1 |
16.1 |
15.9 |
|
SpareBank 1 SR-Bank |
P-1 |
A1 |
247 |
7.6 |
14.4 |
11 |
11.3 |
18.8 |
|
Sparebanken Vest |
P-1 |
A1 |
198 |
7.0 |
14.7 |
11 |
11.9 |
14.7 |
|
SpareBank 1 SMN |
P-1 |
A1 |
167 |
7.5 |
15.0 |
11.5 |
12.2 |
19.0 |
|
Sparebanken Sør |
P-1 |
A1 |
126 |
9.0 |
15.0 |
9.7 |
8.5 |
8.6 |
|
SpareBank 1 Østlandet |
P-1 |
A1 |
131 |
7.3 |
16.7 |
10.2 |
10.5 |
16.9 |
|
SpareBank 1 Nord-Norge |
P-1 |
A1 |
111 |
7.6 |
15.3 |
12.9 |
12.9 |
22.7 |
1 Rating at 30 October 2019. Moody’s scale of rating: Short-term: P-1, P-2,… Long-term: Aaa, Aa1, Aa2, Aa3, A1, A2,…
2 The share of the interim result included in the calculation of the CET1 capital ratio varies across institutions. The higher the proportion of (positive) interim result included, the higher the CET1 ratio. Owing to different national rules, such as consolidation rules for life insurance companies and the Basel I transitional floor, CET1 capital figures are not directly comparable across jurisdictions.
Sources: Banks' quarterly reports, Moody’s and Norges Bank
Table 4 Banks’¹ losses on loans² to various industries and sectors as a percentage of lending to the respective industries and sectors
|
Lending in NOK bn |
|||||||||||
|
Industries |
2009 |
2010 |
2011 |
2012 |
2013 |
2014 |
2015 |
2016 |
2017 |
2018 |
2018 |
|
Agriculture, forestry and fishing |
0.2 |
0.1 |
0.2 |
0.1 |
0.1 |
0.2 |
0.0 |
0.2 |
0.0 |
0.1 |
93.6 |
|
of which: Fish farming, hatcheries |
0.8 |
0.2 |
0.1 |
0.0 |
0.1 |
0.1 |
0.2 |
0.1 |
0.0 |
0.2 |
14.3 |
|
Extraction of crude oil and natural gas |
0.1 |
0.0 |
0.1 |
0.4 |
-0.1 |
0.2 |
0.2 |
6.8 |
4.4 |
0.2 |
5.4 |
|
Manufacturing, mining and quarrying |
0.9 |
0.7 |
0.7 |
0.7 |
0.2 |
1.0 |
1.3 |
1.7 |
1.1 |
0.3 |
55.0 |
|
of which: Manufacturing |
0.9 |
0.9 |
0.4 |
0.5 |
0.2 |
1.2 |
0.6 |
1.0 |
0.3 |
0.1 |
40.2 |
|
of which: Ship and boat building |
0.8 |
-0.1 |
2.7 |
2.0 |
0.0 |
0.0 |
-0.2 |
0.4 |
8.8 |
0.3 |
6.7 |
|
of which: Other services related to extraction of crude oil and natural gas |
17.4 |
-1.4 |
0.2 |
5.7 |
|||||||
|
Electricity and water supply, construction |
0.6 |
0.6 |
0.6 |
0.6 |
0.6 |
0.6 |
0.6 |
0.4 |
0.7 |
0.1 |
140.4 |
|
of which: Construction |
0.9 |
1.5 |
1.5 |
1.2 |
1.5 |
2.0 |
1.6 |
1.0 |
0.2 |
0.3 |
35.7 |
|
Retail trade and auto repair, hotels and restaurants |
1.4 |
0.4 |
0.8 |
0.3 |
0.6 |
0.8 |
0.4 |
0.3 |
1.6 |
1.3 |
57.9 |
|
of which: Retail trade and auto repair |
1.6 |
0.3 |
0.8 |
0.3 |
0.6 |
0.9 |
0.5 |
0.3 |
1.9 |
1.5 |
47.5 |
|
of which: Hotels and restaurants |
0.4 |
0.5 |
0.7 |
0.5 |
0.3 |
0.5 |
0.3 |
0.3 |
0.2 |
0.2 |
10.3 |
|
Shipping and pipeline transport |
1.4 |
1.4 |
1.7 |
2.1 |
2.1 |
1.4 |
1.8 |
2.5 |
0.3 |
-0.1 |
38.5 |
|
Other transport and communications |
1.4 |
1.4 |
1.2 |
0.6 |
2.1 |
0.1 |
0.5 |
2.3 |
1.0 |
1.0 |
52.3 |
|
of which: Supply and other sea transport services for offshore |
5.6 |
2.4 |
2.6 |
12.2 |
|||||||
|
Business services and real estate activities |
0.4 |
0.2 |
0.3 |
0.3 |
0.2 |
0.3 |
0.2 |
0.2 |
0.2 |
0.1 |
410.6 |
|
of which: Real estate activities |
0.3 |
0.2 |
0.3 |
0.3 |
0.2 |
0.3 |
0.1 |
0.1 |
0.1 |
0.0 |
349.0 |
|
of which: Professional, financial business services |
0.6 |
0.2 |
0.3 |
0.4 |
0.3 |
0.6 |
0.7 |
1.0 |
0.9 |
0.6 |
61.6 |
|
Other service industries |
0.4 |
0.6 |
0.1 |
0.4 |
0.2 |
0.8 |
0.1 |
0.0 |
0.2 |
0.2 |
27.4 |
|
Total for all industries |
0.6 |
0.4 |
0.5 |
0.5 |
0.5 |
0.5 |
0.4 |
0.7 |
0.5 |
0.2 |
881.2 |
|
Retail market |
0.1 |
0.1 |
0.1 |
0.1 |
0.1 |
0.1 |
0.0 |
0.1 |
0.2 |
0.3 |
1 062.2 |
|
Other4 |
0.0 |
0.0 |
0.0 |
0.0 |
0.0 |
0.0 |
0.5 |
0.1 |
0.1 |
0.0 |
626.3 |
|
Total |
0.3 |
0.2 |
0.3 |
0.2 |
0.2 |
0.2 |
0.3 |
0.3 |
0.3 |
0.2 |
2 569.8 |
1 All banks in Norway including foreign branches. Nordea is a branch of a foreign bank from 2017. The figures do not include mortgage companies.
2 Recognised losses, excluding changes in unspecified loss provisions/collective impairment losses.
3 The changes in losses on loans to some industries between 2016 and 2017 were relatively large, primarily reflecting sizeable losses on individual exposures or reversals of losses for some banks.
4 Financial institutions, central government and social security administration, municipal sector and foreign sector
Source: Norges Bank
Table 5 Loan defaults.1 All banks and covered bond mortgage companies.2 At year–end
|
Year |
Loan defaults. Percentage of lending to sector |
Loan defaults. Percentage of lending to private sector |
||||||
|
Households |
Enterprises |
Others |
Households |
Enterprises |
Others |
Total |
||
|
1990 |
4.9 |
7.6 |
3.1 |
3.1 |
2.6 |
0.1 |
5.7 |
|
|
1991 |
6.3 |
10.2 |
3.1 |
4.1 |
3.4 |
0.1 |
7.5 |
|
|
1992 |
8.2 |
11.5 |
1.9 |
5.2 |
3.9 |
0.1 |
9.2 |
|
|
1993 |
6.5 |
10.6 |
0.4 |
4.3 |
3.5 |
0.0 |
7.7 |
|
|
1994 |
4.8 |
6.9 |
0.7 |
3.2 |
2.2 |
0.0 |
5.4 |
|
|
1995 |
3.7 |
4.6 |
0.3 |
2.4 |
1.5 |
0.0 |
3.9 |
|
|
1996 |
2.8 |
3.3 |
0.4 |
1.9 |
1.0 |
0.0 |
2.9 |
|
|
1997 |
2.1 |
2.1 |
0.2 |
1.4 |
0.7 |
0.0 |
2.1 |
|
|
1998 |
1.5 |
1.3 |
0.1 |
0.9 |
0.4 |
0.0 |
1.4 |
|
|
1999 |
1.3 |
1.5 |
0.1 |
0.9 |
0.5 |
0.0 |
1.4 |
|
|
2000 |
1.3 |
1.4 |
0.1 |
0.8 |
0.5 |
0.0 |
1.3 |
|
|
2001 |
1.3 |
1.7 |
0.0 |
0.8 |
0.6 |
0.0 |
1.4 |
|
|
2002 |
1.3 |
3.5 |
0.1 |
0.8 |
1.1 |
0.0 |
2.0 |
|
|
2003 |
1.1 |
3.2 |
0.1 |
0.7 |
1.0 |
0.0 |
1.7 |
|
|
2004 |
0.8 |
1.8 |
0.1 |
0.6 |
0.5 |
0.0 |
1.1 |
|
|
2005 |
0.7 |
1.0 |
0.0 |
0.5 |
0.3 |
0.0 |
0.8 |
|
|
2006 |
0.6 |
0.7 |
0.1 |
0.4 |
0.2 |
0.0 |
0.6 |
|
|
2007 |
0.5 |
0.5 |
0.0 |
0.4 |
0.2 |
0.0 |
0.5 |
|
|
2008 |
0.8 |
0.9 |
0.0 |
0.5 |
0.3 |
0.0 |
0.8 |
|
|
2009 |
1.1 |
1.6 |
0.1 |
0.7 |
0.5 |
0.0 |
1.3 |
|
|
2010 |
1.2 |
1.8 |
0.1 |
0.8 |
0.6 |
0.0 |
1.4 |
|
|
2011 |
1.0 |
1.9 |
0.2 |
0.7 |
0.6 |
0.0 |
1.3 |
|
|
2012 |
1.0 |
1.8 |
0.7 |
0.7 |
0.6 |
0.0 |
1.2 |
|
|
2013 |
0.9 |
1.8 |
0.3 |
0.6 |
0.5 |
0.0 |
1.2 |
|
|
2014 |
0.8 |
1.5 |
0.1 |
0.6 |
0.4 |
0.0 |
1.0 |
|
|
2015 |
0.7 |
1.3 |
0.2 |
0.5 |
0.4 |
0.0 |
0.9 |
|
|
2016 |
0.7 |
1.5 |
0.1 |
0.5 |
0.4 |
0.0 |
0.9 |
|
|
2017 |
0.7 |
1.4 |
0.1 |
0.5 |
0.4 |
0.0 |
0.9 |
|
|
2018 |
0.5 |
0.8 |
0.0 |
0.3 |
0.2 |
0.0 |
0.5 |
|
1 Non-performing loans to 2008, 90 days or more past due, 2009–2017, 30 days or more past due and from 2018, 90 days or more past due.
2 Covered bond mortgage companies included from 2005.
Source: Norges Bank