Financial stability outlook
The financial system in Norway has performed well during the Covid-19 pandemic. Government support measures have dampened the economic impact. There is considerable uncertainty regarding the future path of the pandemic and the consequences for the economy and financial markets. The financial stability outlook has therefore weakened somewhat. High household debt and high property prices remain the key financial system vulnerabilities in Norway. Substantial improvements in banking and financial regulation since the financial crisis in 2008 have increased resilience. Banks are robust and well capitalised, despite increased losses.
Extensive government support measures contribute to financial stability
The Covid-19 pandemic has led to a deep downturn in the Norwegian economy. A partial lockdown of society and reduced domestic and foreign demand resulted in a significant fall in economic activity and high unemployment in spring 2020. The downturn was amplified by a fall in oil prices. Extensive government support measures have helped to dampen the impact of the pandemic on firms and households. Norges Bank reduced the policy rate to zero through spring, and the Ministry of Finance reduced the countercyclical capital buffer rate to 1% following advice from Norges Bank.
In addition to a sharp decline in the real economy, the Covid-19 outbreak led to considerable financial market turbulence, both globally and in Norway. Risk premiums on bank and corporate funding rose markedly, and the krone depreciated significantly. To support well-functioning markets, Norges Bank implemented extraordinary liquidity measures and intervened in the foreign exchange market. This contributed to dampening the turbulence in Norwegian financial markets. The financial infrastructure and payment system have functioned well, and their operations were stable during the crisis.
Uncertainty is high
Since May, there have been signs of improvement in the Norwegian economy. Activity has picked up, but the level is still lower than prior to the pandemic. Unemployment has declined, but it remains high. There is considerable uncertainty regarding both the near-term and long-term outlook. Infection rates have risen again, both abroad and in Norway, and more containment measures have been introduced. This will likely put a brake on the upswing in the coming period. It can take time before a vaccine becomes widely available, and new downturns are possible. Political processes globally may also result in shocks to the Norwegian economy. At the same time, fiscal and monetary policy space has become more limited in many countries. Meanwhile, owing to a resilient banking sector, the Norwegian financial system is well equipped to withstand shocks. On balance, the financial stability outlook has weakened somewhat.
The Covid-19 pandemic and measures to contain it are weakening earnings for a number of Norwegian firms. The fall in oil prices led banks to recognise substantial impairment losses on oil-related exposures during the first half of 2020. Looking ahead, loss provisions may also increase in other industries. Analyses of Norwegian firms show that the industries hardest hit so far by the Covid-19 pandemic are not the ones with the most bank loans.
High household debt and high property prices are a source of financial system vulnerabilities
The key financial system vulnerabilities in Norway have long been high household debt, high house prices and high commercial property prices. These vulnerabilities are assessed as not substantially changed since Financial Stability Report 2019.
High debt increases household vulnerability to loss of income, higher lending rates and a fall in house prices. The risk that many households will tighten consumption at the same time represents a financial stability risk. Household leverage is at a high level. Debt growth has fallen somewhat since 2017, but has recently levelled off.
House prices are at a high level after having risen faster than household income over a long period. Since 2017, the rise in prices has been more moderate and lower than income growth. House prices fell in March and April in connection with the Covid-19 outbreak, but have risen markedly thereafter. If house prices continue to rise rapidly, vulnerabilities may increase.
Historically, selling prices for commercial real estate have risen substantially in advance of financial crises. Commercial property prices have risen for a long time and are at high levels. Selling prices for office space in Oslo fell in the first half of 2020, primarily owing to lower rents. Recently, however, the fall in selling prices has reversed, primarily driven by lower yields. Structural changes, such as increased use of remote working and online shopping, may affect developments in commercial property prices in the longer term. The Covid-19 pandemic may reinforce this trend. A substantial price fall may inflict large losses on banks. In recent years, banks have tightened lending conditions for commercial real estate, which limits the risk of losses.
Interest rate cuts make it easier for both households and firms to service debt. This reduces the risk of substantial tightening of consumption and may have a positive effect on firms’ earnings, which dampens banks’ risk of losses. At the same time, low interest rates over a longer period may fuel increased debt accumulation and a sharp rise in prices for both real estate and securities. This may amplify vulnerabilities and weaken the financial stability outlook.
Improved regulation since the last crisis has increased financial system resilience
Financial stability implies that banks and the rest of the financial system are able to perform their tasks adequately, even in the event of serious downturns and economic crises. Since the financial crisis in 2008, the Norwegian authorities have introduced a number of regulations to mitigate vulnerabilities in, and increase the resilience of, the financial system, in line with developments in international regulations. Stricter liquidity and capital requirements for banks have particularly helped to make banks more resilient to negative shocks. The authorities have introduced regulations covering residential mortgages, consumer credit and credit registers. This has contributed to limit lending to vulnerable households and the build-up of household sector vulnerabilities. In the opinion of Norges Bank, the requirements for prudent lending standards should be continued. In addition, the established credit registers should also contain information on collateralised loans to enable lenders and loan applicants to obtain the full picture of a loan applicant’s debt situation.
The resilience of the Norwegian financial system remains strong. Norwegian banks are profitable and well capitalised. They satisfy the capital requirements by an ample margin and have been capable of lending to households and businesses during the Covid-19 pandemic. Customers have also been given principal payment deferrals and short-term liquidity loans, which has supported economic activity. Analyses show that Norwegian banks are resilient and are able to absorb losses that are likely to materialise. At the same time, the outlook for losses is highly uncertain. The Ministry of Finance has urged Norwegian banks to wait before distributing a dividend or buying back shares until the uncertainty has abated further. A reduction in dividend payouts helps to strengthen loss absorbency and lending capacity, and in the period ahead, banks should continue to take into account the extraordinary situation the country is now facing.
The stress test in this Report shows that banks can absorb higher losses. If economic developments prove weaker and losses prove higher than expected ahead, banks will be able to draw on buffer capital to avoid tightening lending. In such a situation, the authorities can reduce the countercyclical capital buffer to enable banks to maintain credit supply.
The countercyclical capital buffer shall normally be between 0% and 2.5%. A high countercyclical capital buffer rate helps ensure that the Norwegian banking sector is well equipped for future shocks. In setting the countercyclical capital buffer rate, improved loss absorbency capacity must be weighed against the consequences of possible credit tightening by banks to satisfy higher capital requirements. An illustrative exercise in this Report shows that the consequences of raising the buffer rate will depend on the situation in the economy and at banks. In a downturn, raising the buffer rate may delay a recovery. The tightening effect of a higher buffer rate may be less pronounced if, at the outset, banks satisfy the capital requirements by an ample margin or banks’ earnings are solid.
The regulatory changes following the financial crisis have strengthened the financial system, but the market turbulence in March uncovered some new challenges that the changes have led to. Margin requirements in derivatives trades have helped reduce the risk that insolvency will spread through the network of derivatives contracts. At the same time, requirements for daily margin payments to counterparties entail a liquidity risk, and it is important for parties to derivatives contracts to take account of this risk. The accelerating market turbulence in March resulted in substantial movements in financial markets that led to a high volume of margin calls, both in Norway and globally. In Norway, the sharp krone depreciation presented challenges to Norwegian asset managers. Liquidity challenges also affected other participants negatively, since they contributed to higher risk premiums in the bond market. Norges Bank will continue to assess the systemic risk associated with derivatives and, if necessary, propose changes to the rules for asset managers’ risk management.
The work on alternative reference rates will be important ahead
Reference rates play a key role in the financial system. In recent years, regulators in the UK and the US have worked to phase out Libor, the most important global reference rate. The transition from Libor to new reference rates globally may have consequences for Nibor, the most important reference rate in the Norwegian market. The increasing use by other countries of new risk-free overnight interest rates as a benchmark may lead to a need to phase out Nibor in the future as well. If users are not sufficiently prepared, this may constitute a risk to both individual institutions and to financial stability. The work to facilitate use of the alternative reference rate Nowa is well under way. Norges Bank urges Nibor users to make the necessary preparations to be able to adopt Nowa.
Important societal trends are important for financial stability
Climate change and the transition to a low-carbon economy will likely affect many firms in the years ahead. The Climate Change Act obliges Norway to substantial emission cuts in the coming years, and investors worldwide attach more weight to sustainable development than before. The biggest risk facing Norway is associated with developments in the value of the oil and gas industry. Norwegian banks also hold loans to international shipping, which may face stricter climate regulations in the coming years. It is important for banks to take climate risks into account in their risk assessments of both new and existing loans. The authorities can contribute to greater transparency regarding financial institutions’ climate risks through guidance, supervision and regulation. Through the EEA, Norway participates in the work to ensure better information about businesses’ climate footprint.
Cyber attacks are becoming increasingly widespread and sophisticated. Attacks have picked up during the Covid-19 pandemic, at the same time as all activity has become more dependent on digital solutions. The vulnerability of the financial system to cyber attacks has thereby increased. Financial Infrastructure Report 2020 points out that the Norwegian financial system is dependent on a few key ICT service providers. This in turn increases the risk that a cyber attack can represent a threat to financial stability. Norges Bank and Finanstilsynet (Financial Supervisory Authority of Norway) have decided to establish a national framework (TIBER-NO) for testing cybersecurity in the banking and payment system in Norway.
Øystein Olsen Ida Wolden Bache Jon Nicolaisen Ingvild Almås Jeanette Fjære-Lindkjenn
27 October 2020
1 Balance of risks
The Covid-19 pandemic has led to a sharp downturn in both the Norwegian and global economy and severe stress in global financial markets. Actions taken by the authorities have dampened the downturn and market stress. There is considerable uncertainty surrounding developments ahead. Improvements in banking and financial regulation since the financial crisis in 2008 have strengthened the resilience of the financial system. The key financial system vulnerabilities in Norway are still high household debt and high property prices. Banks’ credit losses have increased, but banks are well capitalised.
Activity in the Norwegian economy has fallen abruptly as a result of the Covid-19 pandemic, and the economy is now in the midst of a deep downturn. From 12 March, far-reaching measures were introduced to contain the spread of the virus. The containment measures have led to production halts and reduced activity across a range of businesses. The measures limited household demand. Many employees were furloughed or made redundant. Since then, activity in the Norwegian economy has picked up, and unemployment has fallen. At the end of August, the activity level in the mainland economy was still close to 4% lower than before the pandemic broke out in March. A significant increase in infection rates through autumn and stricter containment measures will likely put a break on the upswing in the coming period.
1.1 Risk of shocks
The Covid-19 pandemic has resulted in heightened global uncertainty
Uncertainty surrounding the economic consequences of the Covid-19 outbreak prompted a flight to presumed safety among investors, who sold off their higher-risk assets. Equity indexes fell sharply (Chart 1.1), risk premiums on debt instruments rose, and capital flowed out of emerging economies. Large withdrawals from securities and investment funds forced them to sell assets, which amplified the turmoil in financial markets.
Chart 1.1 Equity indexes fell sharply in March, but have recovered1 Index. 1 January 2008 = 100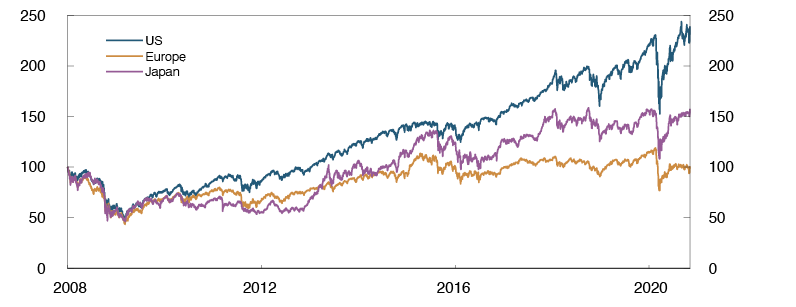
Source: Bloomberg
Extensive containment measures led to an abrupt fall in economic activity and a spike in market volatility. At the same time, the authorities in many countries implemented a number of measures to stabilise financial markets. Substantial provision of central bank liquidity via banking systems and central bank asset purchases were undertaken to deal with liquidity shortages. Central bank balance sheets grew (Chart 1.2). Many central banks cut policy rates to ease households’ and firms’ debt service burdens and stimulate the real economy. In many countries, extensive fiscal policy measures were swiftly implemented to dampen the downturn.
Chart 1.2 Central banks’ balance sheets grew2 In trillions of USD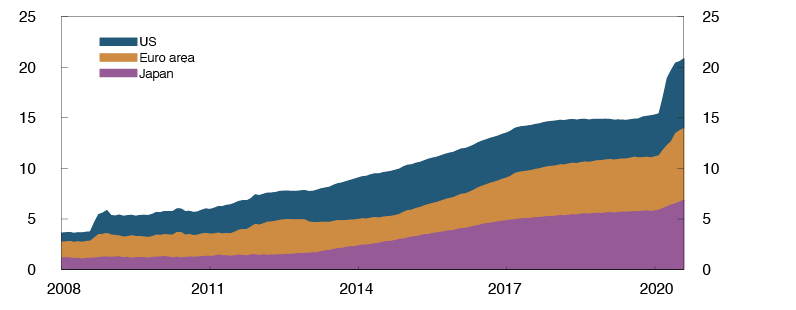
Sources: Bank of Japan and IMF
The authorities in many countries also used macroprudential measures aimed at banks’ credit standards to mitigate the crisis. The purpose was to prevent the economic downturn from being amplified by reduced access to credit by residential mortgage and corporate customers. The International Monetary Fund (IMF) quickly extended new loans to emerging economies. The Paris Club3 agreed to grant suspensions of debt service payments on emerging economies’ loans. These measures contributed to maintaining financial stability.
Financial markets recovered quickly, and demand for higher-risk assets has increased. According to the IMF, the spread between market prices of equities and their value based on fundamentals is at very high levels in a number of advanced economies.4 IMF calculations also show that credit risk premiums in the bond market are lower than implied by fundamentals. Reduced risk-taking, higher inflation or other unanticipated events may result in substantial corrections in asset prices, with a corresponding fall in household and corporate financial wealth. This may have serious consequences for the rest of the economy. Recently, there has been renewed turbulence in global financial markets at the same time as a significant increase in infection rates and new containment measures.
Increasing global indebtedness
Globally, banks’ credit losses have risen, despite lower interest rates and other measures to support households’ and firms’ debt servicing capacity. Losses are expected to increase further when the measures are scaled back, especially in sectors directly affected by containment measures. The recent increase in Covid-19 infection rates and additional containment measures will likely put a brake on the upswing.
In several countries, the corporate sector was already highly indebted prior to the Covid-19 pandemic. New borrowing to address liquidity challenges have amplified these vulnerabilities. This debt will be more vulnerable if lower growth prospects weaken or government support measures are scaled back prematurely. Uncertainty regarding the pandemic ahead amplifies the global uncertainty concerning economic developments and financial conditions, and policy rates may remain low ahead. Low interest rates make it easier to service debt in difficult periods but may fuel debt growth and increase private sector vulnerabilities further out.
Among advanced economies, the real economy has recovered rapidly after the lockdowns in the first half of 2020, but the IMF expects that advanced economy GDP will not pass pre-pandemic levels until 2022 at the earliest. Against the background of very expansionary fiscal policies, public debt-to-GDP ratios are rising sharply across countries (Chart 1.3). Higher public debt can reduce fiscal space in a number of countries, narrowing the scope for action if new shocks materialise.
Chart 1.3 Fiscal policy measures are increasing public debt5 Public debt as a share of GDP. Percent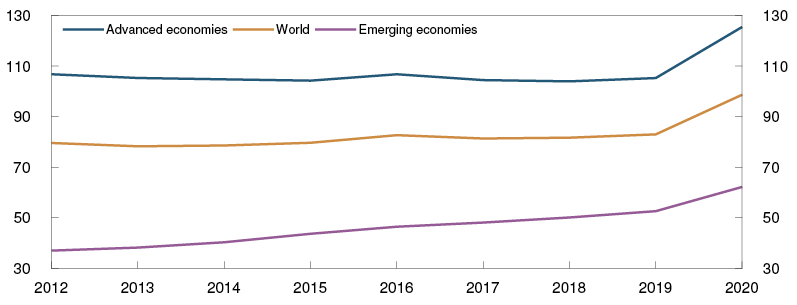
Source: IMF
The UK left the EU on 31 January 2020. A transitional agreement that primarily extends the terms of membership expires at the end of this year. For the time being, no Brexit deal is in place. The financial industry and the authorities have concluded extension agreements in some essential areas. The risk of financial market turbulence if no deal is reached is now lower than in 2019. Generally, renewed turbulence internationally may result in new shocks to the Norwegian economy.
Considerable stress in Norwegian financial markets
In the wake of the Covid-19 outbreak and oil price fall, there was also considerable stress in Norwegian financial markets in March. Equity indexes fell, and bond and money market risk premiums rose (Chart 1.4).
Chart 1.4 Norwegian money market premiums rose sharply in March6 Difference between the three-month money market rate and expected policy rate. Percentage points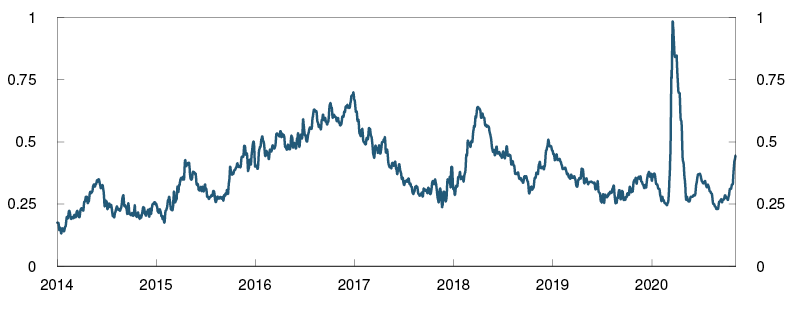
Sources: Refinitiv Datastream and Norges Bank
The financial market turmoil affected both banks and other market participants. Risk premiums on banks’ wholesale funding rose markedly and access to funding was reduced. Large corporates that obtain financing directly in the bond market were also affected. The krone exchange rate, measured by the import-weighted exchange rate index I-44, reached record weak levels in March. Substantial volatility in market prices led to increased margin calls on derivatives contracts in a number of countries. The sharp krone depreciation magnified the impact on Norway, and a number of market participants experienced problems obtaining liquidity. For that reason, many had to sell securities (see "Asset managers faced liquidity stress during the foreign exchange market turbulence in March").
Like other central banks, Norges Bank implemented a number of measures to improve market liquidity and ensure pass-through of the policy rate (see "Annex"). Banks were offered extraordinary loans, and to promote a well-functioning market for NOK, Norges Bank undertook extraordinary NOK purchases in the foreign exchange market. In the IMF’s assessment, the Norwegian liquidity management system functions well both in normal times and in crises (see "IMF: The Norwegian authorities have taken welcome steps to strengthen the financial system" and "Who may hold an account with Norges Bank?").
In summer and early autumn, the uncertainty in global financial markets abated and oil prices rose. At the same time, the krone appreciated, equity indexes advanced and money and bond market premiums fell. Recently, there has been renewed turbulence in global and domestic financial markets at the same time as a significant increase in infection rates and new containment measures, which impede economic activity.
1 Period: 1 January 2008 – 5 November 2020.
2 Period: January 2008 – August 2020.
3 An informal group of official creditors, with the permanent participation of 22 countries with large exposure to other sovereigns worldwide.
4 See International Monetary Fund (2020) “Bridge to Recovery”. Global Financial Stability Report. IMF, October 2020.
5 Period: 2012–2020. Projections for 2020. Gross debt.
6 Period: 1 January 2014 – 5 November 2020. Five-day moving average.
1.2 Developments in financial system vulnerabilities in Norway
Financial system vulnerabilities are important in the event of negative shocks. The key financial system vulnerabilities in Norway are high household debt and high property prices (see box on this page).
Key financial system vulnerabilities in Norway
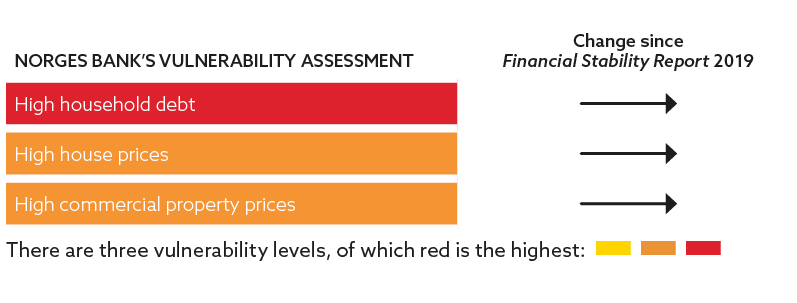
The arrows indicate whether vulnerabilities have increased, decreased or remained unchanged since the 2019 Report.
The table above shows Norges Bank’s assessment of the key vulnerabilities in the Norwegian financial system. Vulnerabilities can be time-varying or the result of permanent structural conditions in the financial system. Vulnerabilities can cause or amplify financial turbulence and an economic downturn when the economy is exposed to large shocks. The interaction between shocks and vulnerabilities can result in financial crises that restrain economic growth. Shocks that trigger financial crises can be difficult for the authorities to predict and influence. A small open economy like Norway is at risk from external shocks.
The vulnerability assessment is based on historical experience of what causes downturns and financial turbulence and assessments of new features of the financial system. The vulnerabilities identified as key vulnerabilities may change over time.
Norges Bank will, as needed, issue advice on measures to address vulnerabilities. These may be measures aimed at reducing the vulnerabilities directly or increasing financial system resilience. The authorities have already implemented a number of measures (Table 1 in "Annex".
The Covid-19 pandemic and the introduction of measures to contain it led immediately to lower turnover for many businesses, a substantial rise in unemployed and a fall in property prices. The consequence is reduced incomes, which weaken borrowers’ debt servicing capacity. Lower property prices reduce the value of banks’ collateral. Subsequently, activity in the Norwegian economy has picked up. House prices have also risen markedly through summer and autumn and are higher than prior to the pandemic. Recently, commercial property prices have risen as well.
Banks’ credit losses have risen during the Covid-19 pandemic, but lower operating expenses and retained earnings have contributed to solid solvency levels. Norwegian banks have maintained the supply of credit to firms and households. The stress test in this Report indicates that Norwegian banks are solvent and will weather increased credit losses in the event of a new downturn in the Norwegian and global economy. (See further discussion of banks in Section 3 and the stress tests in Section 5.)
Borrowers who are unable to cope with climate change and the transition to a low-emission society constitute a risk for banks (see Section 4). Norwegian banks must be prepared for the possibility that their exposures will be affected by climate change and measures to address it.
Digitalisation is helping to make Norwegian banks cost-efficient. At the same time, the financial system is vulnerable to both unintended operational incidents and cyber attacks. Attacks on financial institutions have increased substantially in 2020. Malicious attacks or operational incidents have so far not resulted in extensive disruptions in the Norwegian financial system.
IMF has recently assessed the financial system in Norway. Their conclusion is that measures implemented in recent years have strengthened the resilience of the system, but at the same time, they point out further areas for improvement (see "IMF: The Norwegian authorities have taken welcome steps to strengthen the financial system").
Measures have limited the increase in vulnerabilities associated with high indebtedness
After a long period when household debt grew faster than household income, debt growth has slowed in recent years and has been more in line with income growth. Reduced debt growth reflects the interest rate increases in 2018 and 2019 and measures by the authorities to limit borrowing (see"Regulation of financial institutions’ credit standards"). After the Covid-19 outbreak, household debt growth has continued to be moderate. Household leverage (debt-to income ratios) remains high, both historically and compared with other countries, but is at about the same level as in 2019 (Chart 1.5). Household leverage will continue to increase somewhat ahead as low interest rates stimulate borrowing, while the Covid-19 pandemic contributes to weaker income growth.
Chart 1.5 Debt-to-income ratios are high but have shown little change in recent years7 Debt-to-income ratio, debt service ratio and interest burden. Households. Percent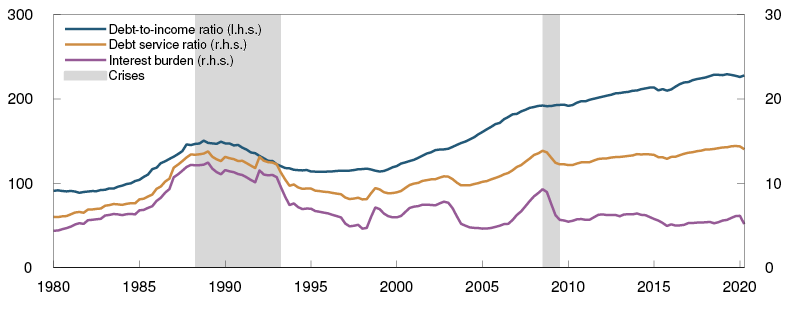
Sources: Statistics Norway and Norges Bank
The Covid-19 pandemic and containment measures led to a sharp increase in the number of unemployed. At the same time, lower borrowing rates helped to bolster the finances of indebted households, and many obtained deferred principal repayments of their bank loans. Subsequently, the number of unemployed has declined. Despite a fall in household income in 2020 Q1 and Q2, the saving ratio increased. Households have so far not increased credit card use to get through the crisis. According to debt data from Gjeldsregisteret, both interest-bearing and non-interest-bearing credit card debt has fallen since the Covid-19 outbreak.
Owing to low interest rates, households’ interest burdens, ie the share of income going to interest payments on loans, are low from a historical perspective, despite high household leverage. Even though low interest rates make it easier to service debt, high household leverage means that changes in interest rates have a greater impact on interest burdens than before. Overall debt service ratios, which include both interest and principal, are relatively high and signal high risk in the heatmap (see "Developments in the heatmap").
High debt levels make households vulnerable to loss of income, an increase in lending rates or a fall in house prices. At the same time, the risk that many households will tighten consumption also constitutes a financial stability risk. Such a tightening may contribute to amplifying a downturn in the Norwegian economy. This may reduce firms’ earnings and debt servicing capacity and then result in higher losses on banks’ corporate exposures.
Tax return data from 2018 show that average household debt continued to rise in all age groups, but growth was restrained somewhat compared with the previous year. There was still a rise in leverage (Chart 1.6). Preliminary tax return data for 2019 indicate a more moderate rise in leverage in most age groups and a weak decline among younger age groups.8
Chart 1.6 Debt as a share of after-tax income has risen in all age groups9 Percent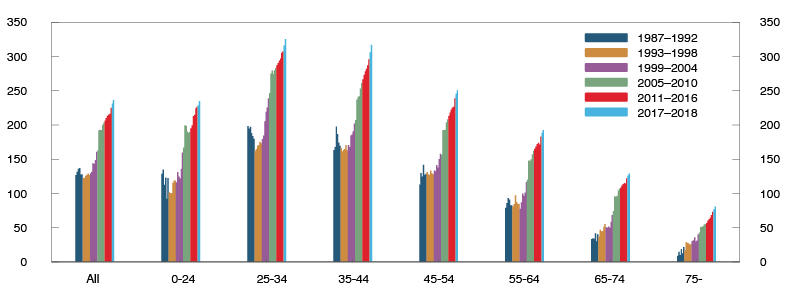
Sources: Statistics Norway and Norges Bank
Tax return data show that the share of highly leveraged houseolds (debt over five times gross income) and households with low debt servicing capacity (annual margin below one month’s income) has stabilised in recent years. The share of households “underwater” (net bank debt higher than their dwelling’s market value) is also stable. Households with both high debt and low debt servicing capacity that at the same time are also underwater (if they are homeowners) have less flexibility in the event of negative shocks. The debt held by these households is assumed to be particularly vulnerable. This debt represents a small share of household debt. This share fell back somewhat in 2018 after rising the two previous years (Chart 1.7). The residential mortgage regulation has contributed to limiting new lending to vulnerable households,10 thereby reducing the build-up of housing sector vulnerabilities.
Chart 1.7 Vulnerable households hold a small share of debt11 Share of total household debt. Percent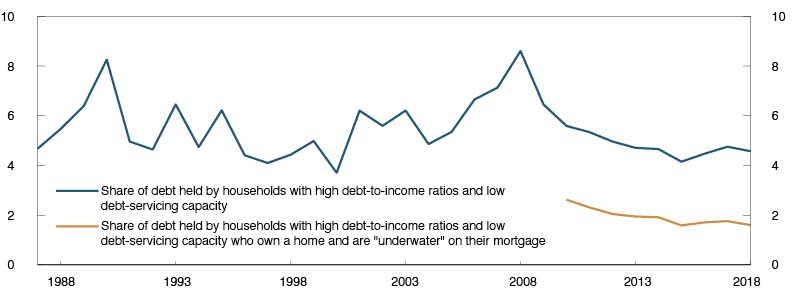
Sources: SIFO, Statistics Norway and Norges Bank
Consumer credit, which is unsecured debt, grew sharply over several years. However, such debt accounts for a limited share, around 3%, of household debt. After the introduction of the consumer credit regulation in 2019 and the establishment of credit registers, the volume of consumer credit fell. However, defaults have risen12, and there are still many households with consumer debt that can be difficult to manage. Owing to high interest rates, interest burdens are high for those with substantial consumer debt. Even though persons with total consumer debt of over NOK 1m or more or with more than 10 consumer loans only account for 2.5% of all persons with consumer debt, they hold all of 26% of such debt. The regulation of credit standards and the transparency provided by credit registers are intended to ensure that the maximum debt-to-income and debt servicing capacity requirements are followed when borrowers take on new consumer debt.
Overall, the vulnerabilities associated with household debt are assessed as broadly unchanged since 2019.
Regulation of financial institutions’ credit standards
To mitigate the build-up of high debt levels among vulnerable households, the Norwegian authorities have set requirements for banks’ and other financial institutions’ credit standards. Residential mortgage loans have been subject to a regulation since 2015, and a consumer credit regulation was issued in 2019. Both regulations expire on 31 December 2020. A proposal for the regulations to remain in force has been circulated for public comment.
In Norges Bank’s assessment, the regulation credit standards have worked well.1 The requirements provide a clear limit for prudent credit standards and have contributed to restricting lending to vulnerable households.2 The quotas enable banks to grant loans in breach of the requirements based on a customer-specific assessment. The flexibility quotas underpin financial institutions’ own responsibility for prudent credit standards. Credit regulation entails a trade-off between ensuring efficient credit markets and limiting the build-up of risk in the financial system.
Norges Bank is of the opinion that regulation of lending should continue. To increase regulation transparency, and to emphasise that it is total household debt that is important for vulnerability, it is appropriate to consolidate lending regulations in one regulation. Including other types of loans in the regulation and the credit registers will also help to prevent borrowers from circumventing the rules. Credit registers provide an overview of individual borrowers’ unsecured debt. The credit registers should be expanded to include residential mortgage loans. Other types of loans that will be covered by the lending regulation should also be included in the credit registers following an assessment of the scope of lending and the costs associated with such reporting. This expansion will give individuals a clearer overview of their debt situation and strengthen the basis for banks’ and other financial institutions’ credit assessments of individual borrowers. The interest of consumer protection suggests that the flexibility quota associated with consumer credit should be low or zero.
The requirements in the lending regulation should be assessed at regular, but not frequent, intervals. In special cases, the flexibility quotas can be adjusted outside of the fixed dates for assessing the requirements in the regulation. During the sharp downturn in the Norwegian economy in spring, the flexibility quotas were temporarily expanded to 20% in 2020 Q2 and Q3. In the event of a marked increase in household sector vulnerabilities resulting from rapidly rising debt and house prices, it should be possible to tighten the flexibility quotas.
Table 1.A Requirements in the current residential mortgage loan regulation and consumer credit regulation
|
Requirement |
Residential mortgage loan regulation |
Consumer credit regulation |
|
Maximum loan-to-value (LTV) ratio1 |
||
|
Debt-servicing capacity |
||
|
– Tolerate interest rate increase |
5 percentage points |
5 percentage points |
|
– Maximum total debt (debt-to-income ratio) |
5 times gross income |
5 times gross income |
|
– Required principal payments |
2.5% annually with LTV > 60% |
Monthly principal repayments over 5 years |
|
Regional requirements |
Maximum LTV 60% for secondary home purchases in Oslo |
|
|
Flexibility quota2 |
10% excluding Oslo 8% in Oslo |
5% |
1 Residential mortgage debt/house value incl. additional collateral.
2 Share of new residential mortgage loans per quarter for which banks may deviate from the requirements.
1 See Norges Bank’s consultation response in a letter to the Ministry of Finance of 10 November 2020.
2 See box “The regulation on residential mortgage loans has limited loans to vulnerable households” in Monetary Policy Report 3/20, Norges Bank.
House price inflation has increased again
High house prices represent an important financial system vulnerability in Norway. Household debt is dominated by residential mortgage loans, and debt developments are closely associated with house price developments. At the same time, housing wealth accounts for a substantial share of household wealth. Sharp and sudden falls in house prices may trigger tightening of household consumption and result in increased losses on banks’ loan portfolios.
The Covid-19 pandemic and containment measures led to a substantial decline in housing market activity, and house prices fell (Chart 1.8). Through summer, turnover picked up to a historically high level and has largely remained elevated through autumn. House price inflation moved up quickly and has been high through summer and autumn. The 12-month rise has increased from 1% in April to 7% in October, well above the average for the past 10 years. Both very low residential mortgage rates and probably also the temporary relaxation of the residential mortgage regulation13 have contributed to developments. At the same time, higher unemployment has largely affected low-income occupations, who are less likely to purchase a home.
Chart 1.8 Marked increase in house price inflation14 Percent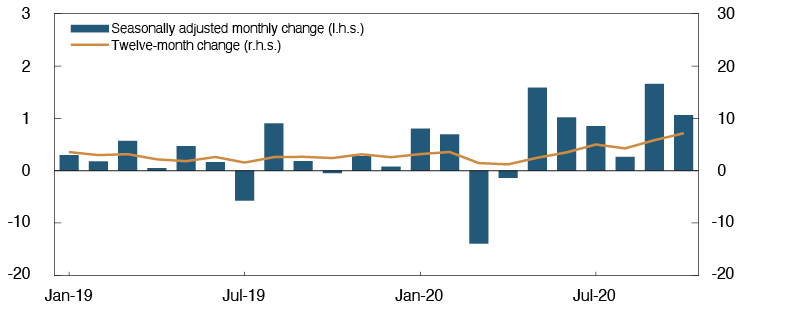
Sources: Eiendomsverdi, Finn.no and Real Estate Norway
Developments in house prices relative to household income are important for assessing vulnerabilities associated with house prices. For many years, house prices rose more than household income (Chart 1.9). After the residential mortgage regulation was tightened in 2017, the opposite was the case for a long time. Owing to a marked upswing in house price inflation after the decline in March and April, combined with moderate income growth, house price inflation exceeds income growth again (see Monetary Policy Report 3/20).
Chart 1.9 House prices have risen less than household income in recent years15 Index. 1998 Q4 = 100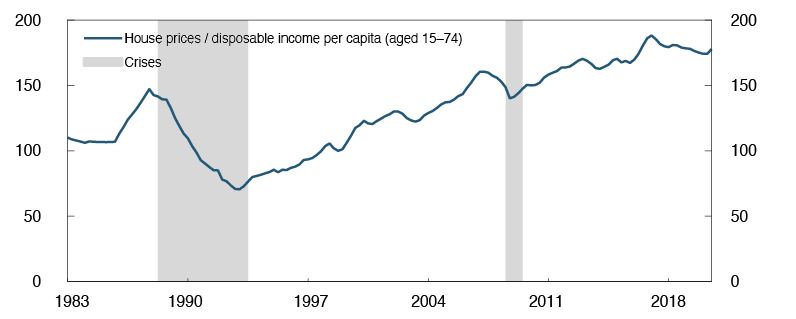
Sources: Eiendomsverdi, Finn.no, Norwegian Association of Real Estate Agents (NEF), Real Estate Norway, Statistics Norway and Norges Bank
Overall, vulnerabilities associated with high house prices are assessed as broadly unchanged from 2019. There is considerable uncertainty regarding developments ahead, and if house prices continue to rise rapidly, vulnerabilities may increase.
Commercial property prices are back to pre-downturn levels
Commercial real estate (CRE) loans, which are mortgages secured on commercial property, account for around 40% of banks’ total corporate exposures. The CRE sector is distinguished by particularly high debt-to-turnover ratios, and experience shows that exposures to this sector can inflict heavy losses on banks in the event of pronounced downturns. This poses a risk to financial stability.
The economic downturn that Norway is in the midst of has reduced demand in the rental market. On the other hand, the stimulus packages have enabled more firms to maintain their leases, despite periods of low sales. Looking ahead, it is uncertain how experience from the crisis will affect demand in the rental market. If the pandemic leads to structural changes, eg increased use of remote working and video conferencing, this will reduce the need for office space and affect developments in rents. In the retail sector, the trend towards increased online shopping may have a negative impact. See Section 4 for a further discussion of the CRE sector.
A relatively large share of the stock of office buildings is in Oslo, and selling prices for prime office space in Oslo are therefore an important indicator of CRE sector vulnerabilities. Selling prices are estimated as the ratio between rents and yield16. In the first half of 2020, selling prices fell, primarily owing to lower rents (Chart 1.10). In Q3, the yield fell substantially and contributed to a reversal of the decline in selling prices in the first half of 2020. The yield is now at a very low level. However, the yield has fallen less than interest rates since the turn of the year, which implies a higher risk premium and downward-adjusted expectations of a rise in rents (Chart 1.11). This indicates a somewhat lower risk of a more pronounced fall in selling prices ahead. At the same time, the gap between the yield in Oslo and long-term interest rates is still at a somewhat lower level than in many other European cities.
Chart 1.10 Commercial property prices back to pre-downturn levels17 Prime office space in Oslo. In thousands of NOK per square metre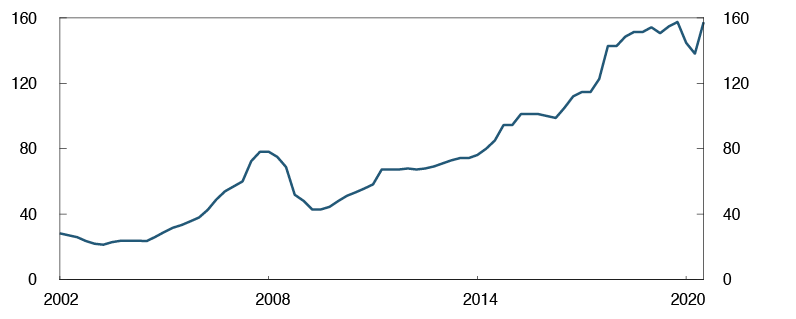
Source: CBRE
Chart 1.11 Risk premium on CRE in Oslo somewhat lower than in other European cities18 Percentage points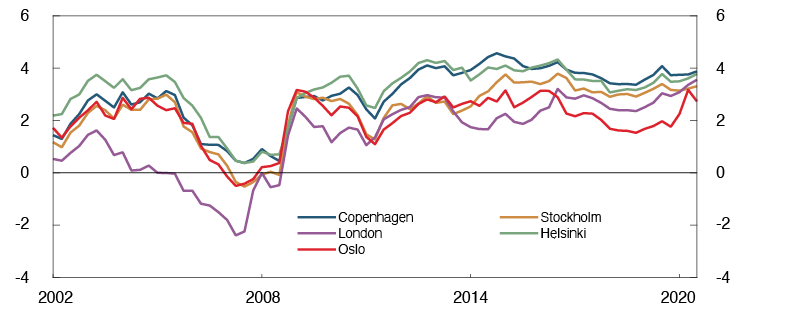
Sources: CBRE and Datastream
Vulnerabilities associated with the CRE market are assessed as broadly unchanged since 2019.
IMF: The Norwegian authorities have taken welcome steps to strengthen the financial system
The International Monetary Fund (IMF) has conducted a comprehensive assessment of the Norwegian financial system.1 The IMF assesses member countries under its Financial Sector Assessment Program (FSAP). The goal is to assess strengths and weaknesses, and to recommend measures to strengthen the resilience of the financial system at both a national and international level. IMF assessments are a part of the Norwegian authorities’ continuous efforts to strengthen the Norwegian financial system.
The IMF concludes that a number of measures taken by the Norwegian authorities have contributed to strengthening the Norwegian financial system since the previous assessment in 2015. The capital position of banks and insurance companies has been bolstered, the terms for mortgage loans have been tightened and new legislation on crisis resolution has been implemented. Nonetheless, vulnerabilities in the Norwegian financial system remain. The IMF identified the most prominent risk factors as being banks’ exposure to a residential real estate market marked by high prices and high household debt, and banks’ reliance on international wholesale funding markets. The IMF also assesses banks’ climate-related risk, and its findings suggest that sharp increases in carbon prices would have a significant, but manageable impact on banks’ loan losses.
The IMF’s key findings and recommendations
- The IMF’s recommendations do not imply any substantial change in the use of macroprudential tools. The IMF nevertheless recommends that the authorities should consider broadening the toolkit for addressing CRE risks, and that residential mortgage regulation should be a permanent feature of the macroprudential toolkit. The Norwegian authorities should also develop a macroprudential policy strategy.
- Norway’s institutional set up for macroprudential policy, where the Ministry of Finance is the macroprudential authority, is unusual, but has functioned. The IMF recommends that Norges Bank should be given recommendation powers over tools, such as the systemic risk buffer and the liquidity coverage ratio in significant currencies, that can be relaxed in a crisis situation. The IMF finds that Norges Bank has an effective system for managing liquidity in normal times and in times of crisis. Further analyses and monitoring of available collateral across Norges Bank’s counterparties would allow the Bank to better gauge the impact of changes in liquidity regulation.
- The IMF recommends that Finanstilsynet be given increased independence as the resolution authority and that involvement of the Ministry of Finance should be limited to resolutions that require public funds. Moreover, the Norwegian Banks’ Guarantee Fund should be further integrated into the authorities’ resolution framework. It would also be useful to establish a coordinating body for the authorities involved, with activities related to crisis prevention and management.
- For the first time, the work on cybersecurity risk was included in the FSAP. Norges Bank’s work in this area is characterised as advanced, and the IMF notes that the system for information sharing between the authorities is well established. Reporting of cybersecurity incidents should nevertheless be improved by establishing clearer thresholds for incident reporting and further defining what should be reported.
1 See International Monetary Fund (2020): “Norway: Financial Sector Assessment Program”. Country Report No. 2020/259. In addition to that main report, there are also more technical documents on: Financial Safety Nets, Systemic Liquidity, Systemic Risk Oversight and Macroprudential Policy Framework, Cybersecurity Risk Supervision and Oversight, Banking Regulation and Supervision and Insurance Sector Oversight.
7 Period: 1980 Q1 – 2020 Q2. Debt-to-income ratio is loan debt as a percentage of disposable income. Disposable income is income after taxes and interest payments. Debt service ratio is interest expenses and estimated principal payments as a percentage of after-tax income. Interest burden is interest expenses as a percentage of after-tax income.
8 See the analysis attachment to Norges Bank’s letter to Finanstilsynet of 16 September 2020 for a discussion of both household data and person-level data (Norwegian only).
9 Period: 1987–2018.
10 See Monetary Policy Report 3/20, page 54.
11 Period: 1987–2018. Vulnerable households are households in breach of critical values for debt-to-income ratio (debt over five times gross income) and debt-servicing capacity (annual income after tax, less interest and standard consumption expenditure of less than one month’s income) and from 2010 also critical value for debt-to-value (net debt higher than dwelling’s market value).
12 See Finanstilsynet (2020) Utviklingen i forbruksgjeld 2020 [Developments in consumer debt 2020] (Norwegian only).
13 The flexibility quotas, which allow banks to grant mortgages in breach of the requirements of the residential mortgage regulation, were enlarged in 2020 Q2 and Q3.
14 Period: January 2019 – October 2020.
15 Period: 1983 Q1 – 2020 Q3. Disposable income is income after taxes and interest payments. Adjusted for a break in the series. Data for 2020 Q3 contain projections for disposable income from Monetary Policy Report 3/20.
16 The yield depends on the risk-free interest rate, risk premium and the expected rise in rents.
17 Period: 2002 Q1 – 2020 Q3.
18 Period: 2002 Q1 – 2020 Q3. Yield prime office space less five-year swap rate.
Asset managers faced liquidity stress during the foreign exchange market turbulence in March
Norwegian asset managers experienced liquidity stress during the market turbulence in March, resulting in fire sales of securities. This led to a sharp rise in bond market risk premiums. One reason for asset managers’ liquidity needs was the sudden, sharp depreciation of the Norwegian krone. The krone depreciation resulted in increased margin calls on foreign exchange swaps. The event uncovered a vulnerability to large market movements associated with the use of derivatives contracts. Similar liquidity stress prompted by margin calls also arose in other countries.
Asset managers hedge their foreign currency positions using foreign exchange swaps
Asset managers – fund managers, life insurance companies and pension funds – play an important role in the financial system. They manage savings by offering investments in equities, bonds and real estate in Norway and globally. Their activities also help facilitate the equity and debt financing of Norwegian and foreign firms.
Whereas asset managers invest abroad, banks fund themselves abroad in part (Chart 1.A). While this makes sense in a small open economy, it also results in a need for banks to hedge their foreign currency borrowing against the risk of a krone depreciation. Similarly, asset managers may, on behalf of their investors (unit holders), prefer to neutralise all or part of the foreign exchange rate risk associated with investments in foreign assets. For investors, who care about returns in NOK, a krone appreciation is costly. A stronger krone results in a lower NOK return on foreign currency-denominated investments. How much foreign exchange rate risk asset managers choose to neutralise (“hedge”) depends on both the regulatory framework and investors’ risk appetite. Hedging is often accomplished using foreign exchange swaps.
Chart 1.A Asset managers invest abroad – banks borrow abroad1 Net financial claims on other countries. In billions of NOK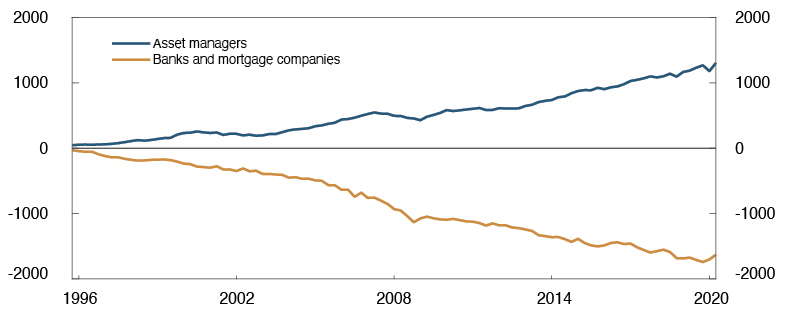
Sources: Statistics Norway and Norges Bank
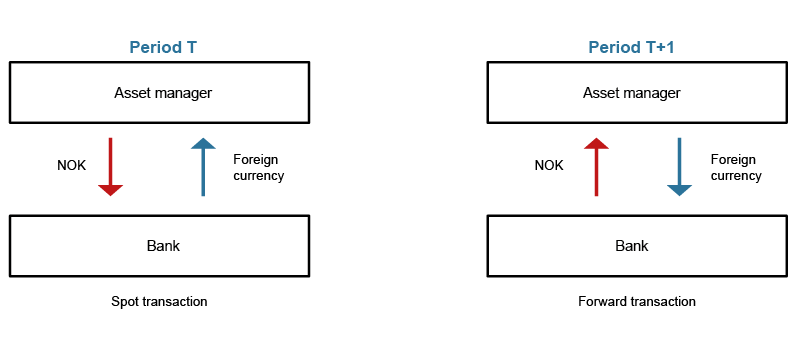
Foreign exchange swaps are derivatives that combine a spot and a forward transaction. As such, they enable asset managers to repatriate investments in NOK without foreign exchange rate risk. At the same time, for their part, banks enter into foreign exchange swaps to hedge their foreign currency borrowing: the bank can swap the foreign currency liabilities into NOK, which it can lend to customers. In addition, the bank receives foreign currency at a future date at a predetermined exchange rate. This enables the bank to repay its foreign currency loan without foreign exchange rate risk. Differing needs for foreign currency hedging and different preferences for contract maturity meet in the swap market. The use of foreign exchange swaps results in a reduction of the total foreign exchange rate risk in the financial system.
Counterparty risk in foreign exchange swaps requires posting of margin
Foreign exchange swaps generally require margin to be posted for the duration of the contract in order to reduce counterparty risk. With a fixed agreed future exchange rate, unexpected exchange rate movements will result in a gain on the contract for one party and a loss for the other. The party with the gain on the contract will typically want security to ensure that the counterparty fulfils the contract. When the krone weakened markedly in mid-March, asset managers’ unrealised losses on foreign exchange swaps rose (Chart 1.B). Given the sharp depreciation as observed in March, the increase in margin calls was correspondingly sudden.
Chart 1.B Increased margin calls in March2 Margin payments under foreign exchange swaps. In billions of NOK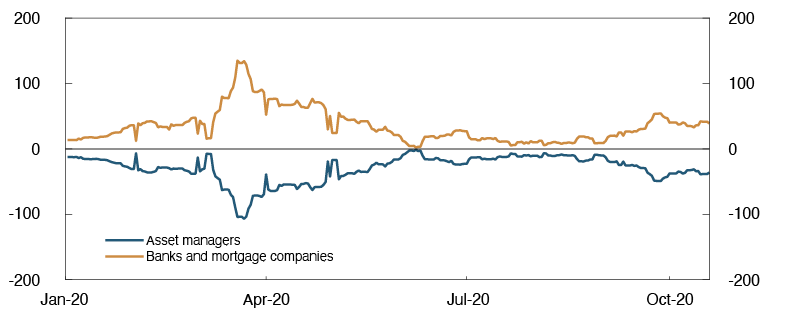
Sources: DTCC and Norges Bank
The increase in margin calls meant that asset managers needed to sell assets in order to obtain cash collateral (bank deposits). This led to selling pressure in the bond market (Chart 1.C) and a sharp rise in bond market risk premiums (Chart 2.1).
Chart 1.C Norwegian capital managers were heavy sellers of bonds in March3 Norwegian capital managers’ net purchase/sale in the Norwegian bond market. In billions of NOK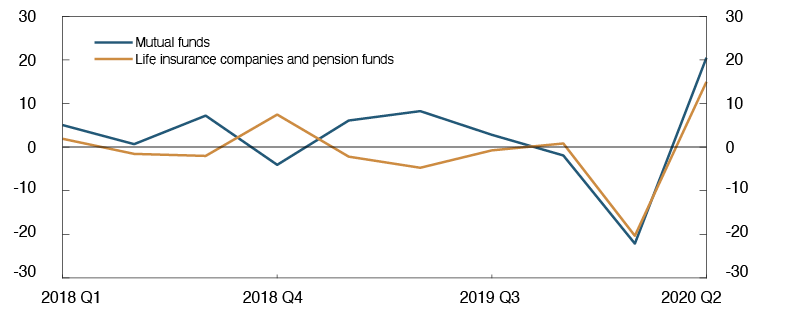
Source: Statistics Norway
Rebalancing of foreign currency hedging in the event of movements in the equity market can influence the krone exchange rate
Asset managers’ investment mandates often include requirements for currency hedging of a certain proportion of their foreign investments, and they adjust this hedging to the market value of investments. But if, for example, the value of foreign equities falls, the asset manager is overhedged relative to the targeted hedging ratio and will seek to rebalance the original currency hedge. This is done by repurchasing foreign currency in an amount equivalent to the fall in the equities’ value.
Under normal market conditions, rebalancing takes place if the hedging ratio deviates considerably from the target, or otherwise around month-end. When equity prices moved substantially and quickly in March, some managers opted to rebalance daily to prevent their hedges from falling too far out of sync with the value of foreign assets. Rebalancing associated with the fall in foreign equity prices contributed to the krone depreciation in mid-March (Chart 1.D), because asset managers sold NOK and bought foreign currency. This further increased margin calls on existing foreign exchange swaps. The fall in foreign equity prices thus also indirectly contributed to the sale of bonds in the Norwegian market and a rise in domestic risk premiums.
Chart 1.D Rebalancing owing to the fall in equity prices fuelled the krone depreciation4 Global equity indexes (S&P) and import-weighted exchange rate index (I-44, inverted)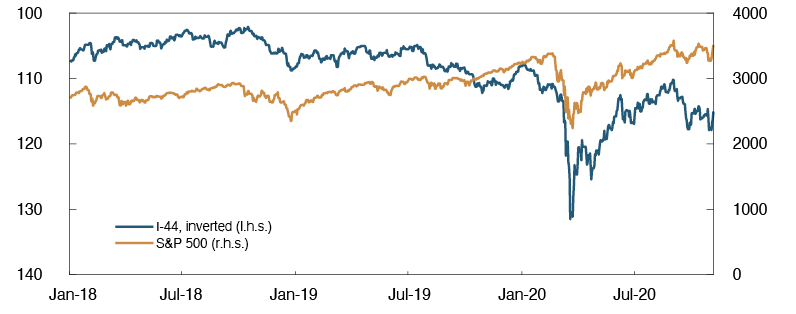
Source: Bloomberg
Demand for bonds eventually picked up when banks were supplied with extraordinary F-loans from Norges Bank, and the Bank’s collateral requirements for loans to banks were eased. Asset managers’ need to obtain more liquid assets was also dampened when the market for NOK stabilised. With fewer sellers and more buyers in the market, bond market risk premiums declined.
Market participants must be prepared for increased margin calls when markets move
Liquidity risk associated with margin calls can be mitigated in various ways. Counterparty agreements can be made more flexible, eg by permitting different forms of collateral. In addition, an expanded network of repurchase agreements may provide greater security for access to liquidity under stress. Market participants themselves have an interest in exploring possibilities for mitigating the liquidity risk they face. Reduced liquidity risk among individual market participants will reduce the systemic risk associated with fire sales of securities in the event of large movements in the krone exchange rate.
The large-scale margin calls on foreign exchange swaps in March are an example of risk associated with derivative contracts more generally. Problems similar to those observed in March can also arise among other market participants and in relation to other kinds of derivatives contracts. Norges Bank is working to improve its surveillance of the use of derivatives contracts in Norway. The system for mitigating counterparty risk via daily exchanges of margin is essential to financial stability and reduces the probability of negative tail events in financial markets. When the parties to a derivatives trade exchange margin, this mitigates the risk that solvency problems will spread in a crisis. One lesson from the global financial crisis in 2008 was the importance of mitigating counterparty risk.
1 Period: 1995 Q4 – 2020 Q2. Asset managers are money market mutual funds, other mutual funds, life- and non-life insurers, and pension funds.
2 Period: 1 January 2020 – 19 October 2020.
3 Period: 2018 Q1 – 2020 Q2. Net purchase and sale of bonds from mutual funds, life insurance companies and pension funds.
4 Period: 1 January 2018 – 5 November 2020.
Who may hold an account with Norges Bank?
Norges Bank sets terms and conditions for counterparties’ loans from and deposits with the central bank. Monetary policy counterparties have access to all central bank facilities. Other counterparties may obtain access to the standing facilities, or parts thereof, if this contributes to promoting the purpose of central banking activities.
The new Central Bank Act entered into force on 1 January 2020. Those who may hold an account with Norges Bank are called counterparties, and the Act specifies that terms and conditions for counterparty accounts must contribute to promoting the purpose of central banking activities: …to maintain monetary stability and promote the stability of the financial system and an efficient and secure payment system…1
The account terms and conditions are further specified in a regulation laid down by Norges Bank.2 The regulation distinguishes between counterparties based on their function in the financial system. Banks that actively participate in payment and credit services are defined as monetary policy counterparties. They are given full access to Norges Bank’s standing facilities (intraday deposits, intraday loans, overnight deposits and overnight loans) and market operations (F-loans and F-deposits). All other counterparties have more limited access.
Banks’ important function in the financial system gives them access to central bank facilities
Banks are the backbone of payment services. Most payments take place when bank deposits are transferred. In the case of payments between customers of the same bank, the transfer is posted internally at the bank in question. Payments between customers of different banks are settled when central bank reserves are transferred between banks’ accounts with the central bank. Central bank reserves are banks’ unrestricted deposits with the central bank. Central bank reserves are the generally accepted means for final interbank settlement. A bank is willing to accept customer deposits from other banks (a liability to the customer) because at the same time, central bank reserves in an equal amount (a claim on the central bank) are transferred to its account. This enables banks’ customers to use their deposits as means of payment to customers of other banks.
Banks also play a key role in credit provision. Banks lend by crediting the borrower’s bank account with the amount of the loan. Thus, banks create their own financing, bank deposits, where the financing cost is equal to the interest the bank must pay on the customer’s deposits. Credit provision entails maturity transformation because loans typically have longer maturity than bank deposits, which are available immediately.
Banks’ key role in payment services and credit provision expose banks to liquidity risk. Banks that lose customer deposits must transfer an equivalent amount of central bank reserves from its account with the central bank to other banks’ central bank accounts. Banks therefore have the right to borrow reserves from and deposit reserves with the central bank throughout the day and overnight. They may also participate in central bank market operations.
Corresponding to banks’ need for central bank reserves is the ability of the central bank to influence interest rates in the economy by setting the terms for banks’ loans from and deposits with the central bank. Central bank reserves are the means by which the liquidity management system implements monetary policy and ensures an efficient payment system. The operational objective of the central bank’s liquidity policy is to keep short-term money market rates close to the policy rate. Norges Bank uses a quota system in its liquidity management. Banks receive interest on their deposits at the policy rate up to a certain quota, while deposits in excess of the quota bear lower interest (reserve rate).3 The quota system gives banks an incentive to demand the quantity of central bank reserves the central bank wishes to offer, at the same time as the desired interest rate is established in the market in the manner intended. Moreover, the quota system makes possible a transaction-based overnight interest rate, a desired characteristic of a reference rate (see "Libor to be replaced by new reference rates").
For financial stability considerations, other counterparties may have access
In the interest of an efficient payment system and financial stability, counterparties other than monetary policy counterparties may have access to a central bank account and Norges Bank’s standing facilities, or parts thereof. For example, central counterparties (CCPs) hold an account with Norges Bank. CCPs interpose themselves between the buyer and seller of financial instruments and guarantee that the contracts are fulfilled. Furthermore, CLS Bank International holds an account with Norges Bank. CLS Bank is an international settlement bank for foreign exchange transactions.
Other counterparties do not contribute to redistributing central bank reserves overnight or to quoting the overnight rate. With regard to the purposes of central banking activities, they make a particular contribution to an efficient payment system and financial stability, and less to the implementation of monetary policy. Other counterparties primarily only have access to intraday facilities.4 Access to the overnight facilities may disrupt Norges Bank’s liquidity management and its implementation of monetary policy.
1 Central Bank Act. Act relating to Norges Bank and the monetary system, etc.
2 Regulation on access to lending and deposit facilities at Norges Bank, which also entered into force on 1 January 2020.
4 See Financial Infrastructure Report 2019 for a further discussion of central counterparties and CLS Bank.
2 Bank funding
Banks’ access to funding deteriorated sharply in March. Norges Bank implemented extensive measures to improve liquidity, and risk premiums have fallen back to pre-pandemic levels. Norwegian banks now have ample access to funding and satisfy liquidity requirements. Looking ahead, the phasing-out of Libor will have consequences for bank funding.
2.1 Bank funding in a turbulent market
In March, there was considerable financial market volatility in connection with the outbreak of Covid-19. Premiums in the Norwegian money market rose sharply up to mid-March, in pace with increasing uncertainty and higher premiums in the US money market. Risk premiums on banks’ long-term wholesale funding also rose markedly (Chart 2.1), and banks’ access to such funding was reduced.
Chart 2.1 Risk premiums on banks’ long-term wholesale funding rose markedly in March1 Risk premiums in the Norwegian bond market. Five-year maturity. Percentage points above three-month Nibor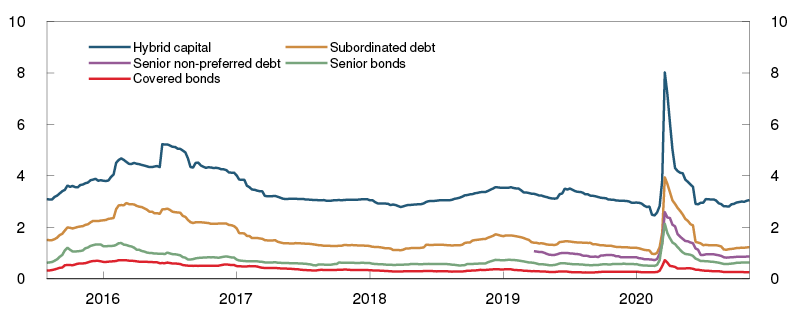
Source: Nordic Bond Pricing
Financial market turbulence also significantly affected market participants outside the banking system. When the krone depreciated markedly in March, asset managers faced a correspondingly abrupt increase in margin calls (see "Asset managers faced liquidity stress during the foreign exchange market turbulence in March"), which they met by selling securities, and selling pressure arose in the bond market. This led to a deterioration in Norwegian bond market liquidity and put further upward pressure on risk premiums on banks’ wholesale funding..
Norges Bank’s measures improved banks’ access to wholesale funding
Norges Bank implemented a number of measures to improve market liquidity and to ensure that the policy rate passed through to money market rates and banks’ lending rates. Since 13 March, Norges Bank has offered extraordinary NOK F-loans with longer-than-normal maturities. The F-loans are fully allotted at the announced floating interest rate. Collateral requirements for these loans will be the same as for ordinary F-loans. Because of high US dollar funding premiums, which is the result of high US dollar demand in global financial markets, temporary liquidity arrangements were also established between the Federal Reserve and a number of central banks, including Norges Bank. Through the arrangement, Norges Bank lent USD against the same type of collateral as lending in NOK.2
To increase banks’ eligibility for these loans, the guidelines for pledging collateral in Norges Bank were also temporarily relaxed. In particular, the ability to pledge up to 100% of the volume outstanding of a security increased the amount banks could borrow from the central bank. In March and April, banks’ holdings of Norwegian securities increased by over NOK 100bn, primarily owing to banks’ purchases of covered bonds issued by their own mortgage companies (Chart 2.2) in order to pledge them as collateral for loans from Norges Bank. An announced partial reversal of the relaxation of the guidelines for pledging collateral will commence in February 2021.
Chart 2.2 Banks’ holdings of securities increased in March and April3 Norwegian banks’ securities holdings. In billions of NOK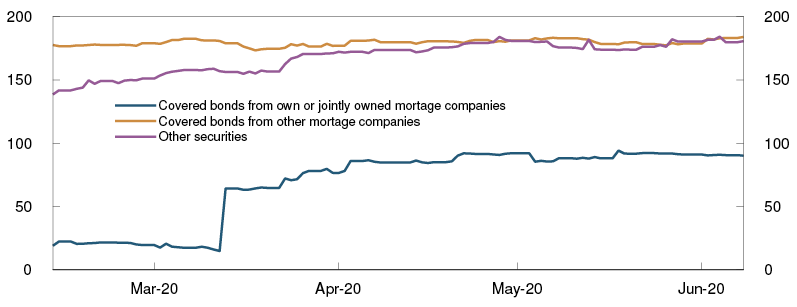
Source: VPS
The extraordinary measures by central banks and other authorities, both abroad and in Norway (see Annex), contributed to the pickup in financial market liquidity and the narrowing of risk premiums. Selling pressure from asset managers eased when the krone stabilised and the substantial decline in the value of foreign investments abated. Through spring and summer, banks’ ability to obtain funding in the bond market has improved significantly, and risk premiums on banks’ wholesale funding have come down to pre-crisis levels (Chart 2.1). Norges Bank’s semi-annual survey of liquidity in the Norwegian bond and short-term paper market confirms this picture.
Banks were better equipped to address the turbulence than during the global financial crisis
Stricter Liquidity Coverage Ratio (LCR) and Net Stable Funding Ratio (NSFR) requirements for banks following the financial crisis helped to better equip Norwegian banks and mortgage companies to address financial market turbulence. The NSFR reduces long-term refinancing risk. The NSFR has remained unchanged in recent quarters and is above the minimum requirement.4 The LCR allows banks to meet their obligations through periods of limited access to new funding. In 2020 Q1, the total LCR fell somewhat for Norwegian large and medium-sized banks, but the LCR still remained well above the minimum requirement. At end-Q2, the LCR increased again. Because of the extraordinary liquidity measures by the central bank when the markets were stressed, banks did not sell securities from liquidity reserves, but instead pledged more securities as collateral for loans from Norges Bank. This helped prevent a further tightening of banks’ funding markets.
1 Period: Week 32 2015 – week 45 2020. Premiums on bonds issued by large banks and mortgage companies in the Norwegian market.
2 With an additional haircut for foreign exchange risk.
3 Period: 13 February 2020 – 8 June 2020. The sample comprises Norwegian banks that report on a consolidated basis under CRD IV.
4 The Net Stable Funding Ratio (NSFR) has been adopted by the EU, but has not yet been transposed into Norwegian law. Nevertheless, Norwegian banks have reported their NSFRs for several years.
2.2 Structure of Bank funding
Bank funding is diversified
Compared with the financial crisis in 2008, Norwegian banks were less affected by the turmoil in the US market in spring 2020. A larger share of banks’ short-term USD funding is now invested in safe, liquid assets, such as central bank deposits. The share of short-term foreign currency funding not placed in central banks has declined in recent years and is now approximately 4% of total assets (Chart 2.3).
Chart 2.3 Share of short-term foreign currency funding not placed in central banks has declined in recent years5 Short-term funding and central bank deposits in foreign currency. Norwegian banks. Share of total assets. Percent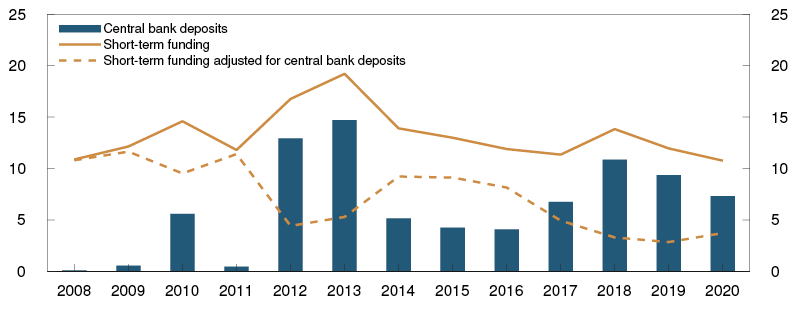
Source: Norges Bank
Bank funding is diversified and together with customer deposits, bonds and short-term paper represent the most important funding sources for Norwegian banks. Customer deposits, which account for around 40% of bank funding, have remained stable since the outbreak of the Covid-19 pandemic. In December 2019, Finanstilsynet (Financial Supervisory Authority of Norway) issued requirements for eight Norwegian banks’ own funds and eligible liabilities (MREL) that can quickly be written down and converted to new equity. These banks are considered so important to the financial system that they will not be wound up if they were to fail. This will result in more efficient resolution without recourse to taxpayer funds (see "New debt category for norwegian banks will make resolution more efficient"). The requirement is to be met in part by a new category of liabilities in the form of subordinated debt, which is lower in priority than senior debt. At the end of October, six out of eight banks had issued approximately NOK 17bn in subordinated debt. However, until 1 January 2024, senior debt may also be used to meet the requirement.
Ample liquidity has made it possible for banks to offer liquidity support to customers and defer principal payments. This is important because many businesses are suffering a sharp fall in revenue, many employees have been furloughed and Norwegian households have large mortgages. However, substantial drawdowns on credit and liquidity facilities could increase banks’ funding needs. Drawdowns on such facilities have not been substantial so far.
New debt category for norwegian banks will make resolution more efficient
Failing banks that are too important to be wound up must have liabilities that can quickly be written down and converted to new equity. Finanstilsynet (Financial Supervisory Authority of Norway) has set the amount of such liabilities that each of these banks must have. From 2024, all such liabilities must be lower in priority than senior debt. In 2020, some Norwegian banks have issued such bonds, which may increase their funding costs somewhat, at least in the short term.
Banks must issue subordinated debt to meet the minimum requirement for eligible liabilities
The efficient resolution of a failing bank should be possible without recourse to taxpayer funds. The bank must therefore have sufficient regulatory capital and liabilities that can be written down and converted to new equity, also referred to as a bail-in. The minimum requirement for such capital and liabilities is called MREL (Minimum Requirement for own funds and Eligible Liabilities).
In December 2019, Finanstilsynet decided that the eight most important Norwegian banks were to be subject to MREL1. The requirement is to be met using own funds and a new debt category in the form of subordinated debt, ie debt that ranks above other subordinated debt but below senior debt. Up until 1 January 2024, the requirement can also be fulfilled with senior debt that is issued before 1 January 2020 and that would otherwise fulfil the requirements for eligible debt. To comply with the priority ranking requirement, banks must replace maturing ordinary senior debt with subordinated debt before 2024. It is expected that these banks as a whole will need to issue approximately NOK 200bn worth of subordinated debt by 2024 to comply with the requirement. At end-2019, these banks’ senior bonds totalled slightly more than NOK 600bn, and the requirement can be met by replacing 1/3 of this debt with subordinated debt.
Issuance of subordinated debt may increase banks’ short-term funding costs somewhat
At the end of October 2020, six of the eight banks2 have issued around NOK 17bn in subordinated debt. Through October, the risk premium above three-month Nibor for the subordinated bonds issued by Norwegian savings banks was 0.88 percentage point.3 This is not more expensive than what other Nordic banks have paid in the NOK market. Subordinated debt is more expensive than senior debt at the same maturity. For the largest Norwegian savings banks, the risk premium for senior debt was 0.65 percentage point above three-month Nibor.
Banks’ funding costs may increase somewhat, at least in the short term, since the risk premium on new subordinated debt is higher than on senior bonds, and the risk premium on senior debt outstanding is fixed until maturity. However, the risk premium on senior debt may fall when banks issue bonds that are to absorb losses prior to senior debt. However, any fall in premiums on senior debt will not contribute to lower funding costs until existing senior debt matures and banks issue new senior debt.
New regulatory framework for subordinated debt
The EU has adopted a new regulatory framework for MREL. It differs somewhat from the current Norwegian rules, particularly the priority ranking requirement. The new rules are to be incorporated into the EEA Agreement and implemented in Norwegian law. A proposal for how this is to take place has been circulated for comment by the Ministry of Finance, with a consultation closing date of 6 January 2021.
1 DNB, Sparebank 1 SR-Bank, Sparebanken Vest, Sparebank 1 SMN, Sparebanken Sør, Sparebank 1 Østlandet, Sparebank 1 Nord-Norge and Bank Norwegian.
2 All excluding DNB, Bank Norwegian and Sparebank 1 SR-Bank.
3 Risk premium values are indicative credit spreads above three-month Nibor for generic five-year debt in NOK. In practice, maturity of issued subordinated debt is five years. Source: Nordic Bond Pricing.
Risk posed by banks’ substantial covered bond exposures
Covered bonds are an important source of long-term funding for banks. At the same time, covered bonds account for almost 50% of banks’ liquidity reserves in NOK. This share has remained stable in recent years but declined slightly so far in 2020 owing to an increase in central bank deposits. If funding dries up and many banks are forced to liquidate large covered bond holdings at the same time, the value of banks’ liquidity portfolios could rapidly decline. Substantial selling pressure in the covered bond market may intensify liquidity problems as bank funding conditions tighten further. Banks’ substantial holdings of other banks’ covered bonds amplify the interconnectedness of financial institutions and may constitute a systemic risk.
High house prices also pose a risk to banks’ covered bond funding because a fall in house prices may result in a fall in covered bonds’ over-collateralisation below the regulatory requirement and possible investor and rating agency requirements. If over-collateralisation falls below such requirements, this may lead to higher risk premiums and poorer access to funding by residential mortgage lenders. In spring 2020, new covered bond issues that were larger than the increase in the cover pool, primarily residential mortgages, led to lower over-collateralisation among residential mortgage lenders. Nevertheless, over-collateralisation remains high.
The Libor phase-out will impact bank funding
By end-2021, the global reference rate Libor will be replaced by new reference rates for eg GBP and USD. The new reference rates are near risk-free overnight rates with properties that differ from Libor (see "Libor to be replaced by new reference rates"). Norwegian banks and mortgage companies raise more than half of their bond funding in foreign currency. Norwegian issuers of foreign currency bonds must be prepared for the transition to the new reference rates. The transition from Libor will also influence segments of the derivatives market, where banks and mortgage companies convert foreign currency funding to NOK.6 In combined interest rate and foreign exchange derivatives, which currently use Nibor as a reference rate, participants should be prepared to use the alternative reference rate Nowa.
5 Period: 2008–2020. Annual data at 30 June. Comprises deposits from foreign customers and central banks, and debt securities with less than 12 months’ residual maturity.
6 At end-2019, approximately 50% of bond funding was issued in foreign currency. Banks and mortgage companies that use cross-currency basis swaps for conversion to NOK may be particularly affected by the transition.
Libor to be replaced by new reference rates
Libor is being phased out, which will affect Norwegian market participants and may have consequences for Norway's most important reference rate, Nibor. If the transition to new reference rates occurs with market participants ill-prepared, it could pose a threat to financial stability. Nibor users must now be prepared to use the recommended alternative Norwegian reference rate, Nowa.
The market is transitioning away from Libor
In recent years, regulatory authorities in the UK and the US have worked towards phasing out the most important global reference rate, Libor. A reason for this, among others, is that confidence in Ibor rates has weakened in recent years.1 The expiration date for Libor is now fast approaching, and by end-2021, Libor will be replaced by new, alternative reference rates.
The new reference rates are overnight rates that are near risk-free. They differ from Libor in several ways. While Libor measures the interest rate on unsecured market funding for banks over a three-month period2, the new reference rates measure interest rates on overnight lending. Libor is therefore influenced by changes in credit and liquidity premiums on bank funding, while the new reference rates closely track the policy rate (Chart 2.A). The tenor differences between the rates also have consequences for the calculation of interest payments in contracts linked to interest rates.
Chart 2.A The new reference rates lie close to the policy rate3 Margin above the policy rate for new reference rates. Percentage points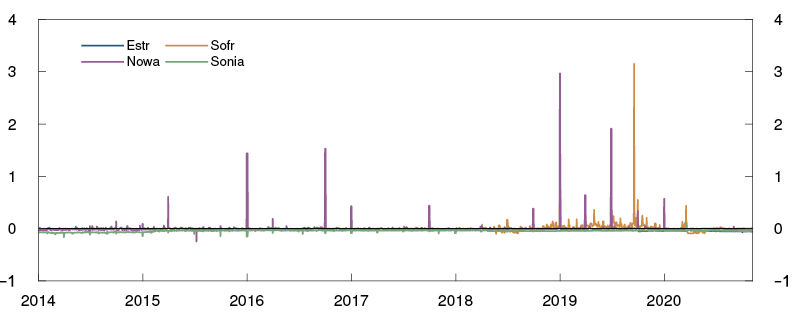
Source: Bloomberg
The work of phasing in the new reference rates is currently intensifying globally. Norwegian market participants with exposures to Libor should be prepared to use the new international reference rates and be able to manage reference rates with characteristics that are different from Libor.
The market should prepare to use Nowa
The global transition from Libor to new reference rates may have consequences for Norway's most important reference rate, Nibor. Like Libor, Nibor is a three-month rate with properties that differ from those of new reference rates being used abroad. As other countries increasingly transition to near risk-free overnight rates as their reference rates, market participants abroad may be less willing to be exposed to Nibor in derivatives, bonds and other financial contracts. Less use of Nibor may weaken interest in being a panel bank and increase the risk that Nibor will also need to be phased out in the future.
If the publication of Nibor were to end, banks and other Nibor users would need to be prepared to use the recommended alternative Norwegian reference rate, Nowa. Over the past year, two working groups consisting of representatives from the financial industry have worked towards facilitating the use of Nowa as a reference rate.4 The working groups have published recommended market standards for the use of Nowa in financial contracts and fallback solutions for replacing Nibor in existing contracts. The groups are also working to establish an interest rate derivatives market linked to Nowa, or overnight index swaps (OIS). This work is important for Nowa to function as a reference rate, and Norges Bank will continue to facilitate it by serving as the secretariat for the ARR working group5 and participating as an observer in other working groups.
In addition to the ongoing efforts of the working groups, necessary preparations for the use of Nowa must also be made by individual users. Since using Nowa also requires modifications to technical systems and contracts, work in this area should be intensified. Norges Bank will work to make Nowa easy to use and will publish a daily index for Nowa in order to simplify the calculation of interest payments in Nowa contracts.
It is up to users to decide which reference rate to use in their contracts. Nevertheless, Norges Bank encourages all Nibor users to make the preparations necessary for using Nowa.
The transition to new reference rates may create challenges
If Nowa were to replace Nibor as the reference rate in Norway, the different properties of the reference rates may have consequences for both users and how the market functions. The differing properties of the reference rates were highlighted as recently as during the market turbulence in March 2020, when a higher risk premium in Nibor caused Nibor to far exceed the expected policy rate. Nowa, on the other hand, followed the policy rate closely (Chart 2.B).
Chart 2.B Nowa and Nibor have different characteristics6 Nowa, three-month Nibor and the policy rate. Percent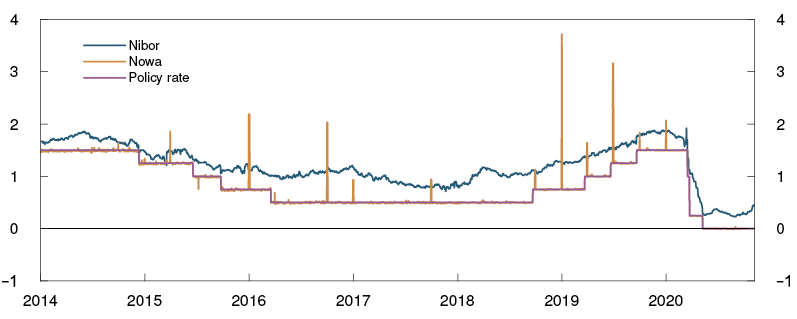
Source: Norges Bank
Banks may need to include wider and more volatile margins in their loan contracts if lending rates are linked to Nowa rather than to Nibor. Changes in the risk premiums that banks pay on their funding is currently captured by Nibor, which makes it easier for banks to price loans with a stable margin above Nibor. If lending rates were instead to be linked to a near risk-free reference rate, like Nowa, banks may need to adjust the margin they require above the reference rate in order to compensate for risk premium changes that are not captured by the reference rate. Wider and more volatile margins may reduce the predictability of borrowers’ interest expenses and decrease market transparency.
Banks’ risk management may become more demanding if assets are linked to Nowa. Banks are dependent upon a stable relationship between interest income and interest expenses. By contractually linking interest rates on assets to Nibor, banks will automatically earn higher interest income in a situation where their interest expenses rise owing to higher risk premiums. If assets are linked to a near risk-free reference rate, like Nowa, banks may experience a decline in interest income in a stress situation in line with a policy rate reduction, while their costs do not fall as much owing to higher risk premiums. This risk can be difficult to manage by requiring a fixed risk premium on loans.
The properties of the reference rate will also influence the type of risk that can be hedged against using derivatives, which are important risk mitigation instruments for banks and other financial system participants. If Nowa replaces Nibor in interest rate derivatives, these derivatives will no longer provide a hedge against changes that are currently reflected by the risk premium in Nibor. Market participants exposed to risk premiums that are captured by Nibor will therefore be unable to hedge against this type of risk. However, it will be easier to hedge against policy rate changes if derivatives are linked to a rate that closely follows the policy rate, such as Nowa, than a rate that is also influenced by risk premiums, such as Nibor.
Transition to Nowa as a reference rate will take time. For the time being, three-month Nibor will be the most important Norwegian krone reference rate. Consequently, it is crucial that the framework for Nibor is transparent and spells out the factors that determine changes in this rate. Norges Bank has previously pointed out the weaknesses of the current Nibor framework and what, in the Bank’s opinion, should be changed to strengthen it.7 It is the Bank’s view that such changes are necessary for ensuring continued confidence in Nibor, particularly in the light of the uncertainty surrounding the future of Ibor rates internationally.
1 The work to reform Libor and other reference rates is discussed on page 33 of Financial Stability Report 2019.
2 Libor is quoted for different tenors ranging from one day to 12 months but three-month Libor is used most in financial contracts.
3 Period: 1 January 2014 – 5 November 2020.
4 The working groups' reports can be found on Norges Bank's website.
5 Working group on alternative Norwegian krone reference rates.
6 Period: 1 January 2014 – 6 November 2020. Nowa is Norwegian overnight weighted average. Nibor is three-month money market rate.
3 Bank profitability and solvency
Banks’ credit losses have increased during the Covid-19 pandemic, but owing to lower operating costs and retained earnings, solvency has increased. Together with the lowering of the countercyclical capital buffer, this has provided banks with the flexibility to maintain lending. In addition to underpinning intended effects, regulatory relaxation during crises must also sustain confidence in banks’ financial statements and key ratios.
Banks are key players in the economy and perform important tasks such as channelling capital, executing payments and distributing risk efficiently. If banks are to also perform these tasks during downturns, they must be sufficiently well capitalised. Banks’ ability to absorb credit losses depends on underlying profitability, which is banks’ first line of defence.
3.1 Profitability
The Covid-19 pandemic has reduced banks’ profitability through several channels. Credit losses in particular have increased (Chart 3.1). Interest income, which is Norwegian banks’ most important income source, has also declined somewhat. Reduced operating costs have dampened the decline in profitability. Banks’ earnings have been high enough to allow them to maintain household and corporate lending growth without drawing down capital ratios.
Chart 3.1 Lower bank profitability1 Large Norwegian banking groups. Percent of average total assets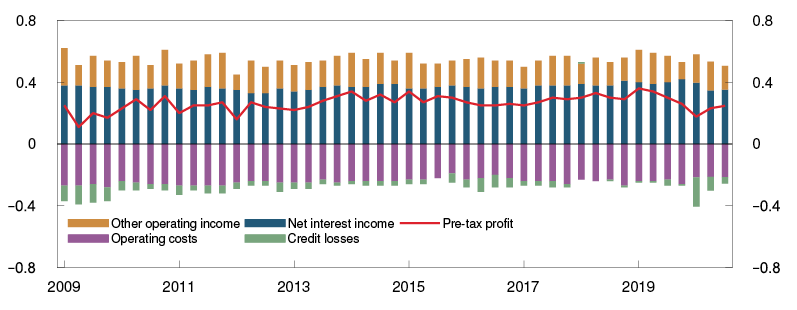
Sources: Banking groups’ quarterly reports, SNL / S&P MI and Norges Bank
Credit losses have increased
Credit losses have increased during the Covid-19 pandemic. In the first three quarters of 2020, total credit losses for all Norwegian banks accounted for approximately 0.7% of total lending (Chart 3.2). This is approximately three times higher than the average for the past 20 years, but significantly lower than during the banking crisis at the beginning of the 1990s. Losses were highest in 2020 Q1 and have since declined.
Chart 3.2 Credit losses increased in 2020 H12 Credit losses as a share of lending. All banks and mortgage companies in Norway. Annualised. Percent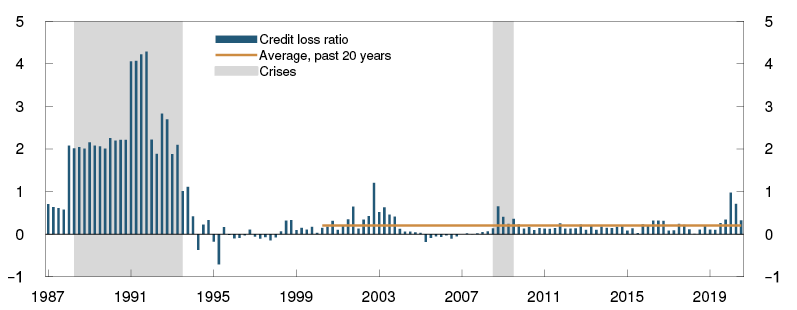
Source: Norges Bank
A significant share of the high losses in Q1 can be explained by the fact that the new accounting standard (IFRS 9) requires banks to recognise credit impairment based on more forward-looking assessments than under the previous standard (IAS 39). Banks therefore recognise impairment earlier in a downturn than before. In Q2 and Q3, recognised impairment for non-performing and restructured loans accounted for a large share of losses, while impairment recognised as a result of banks’ expected losses on performing loans fell considerably (see "Can capital requirements and impairment rules cause banks to amplify the downturn?").
Approximately half of the large banks’ credit losses in the first three quarters of 2020 were oil-related.3 Drilling and supply firms are particularly at risk of losses (see Section 4). If one were to disregard SpareBank 1 SR-Bank and DNB, which have the highest share of oil-related exposures, the credit losses of the large Norwegian banks are approximately equivalent to the average for the large Nordic banking groups (Chart 3.3).
Chart 3.3 Credit losses were higher for banks with greater oil-related exposures Credit losses as a share of lending. Figures for 2020 Q1 – Q3. Annualised. Percent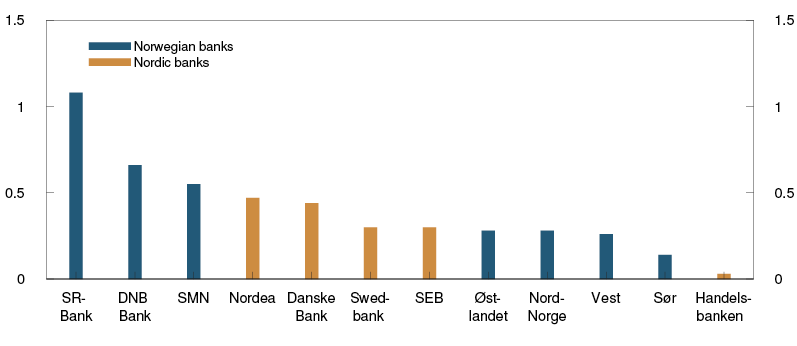
Sources: Banking groups’ quarterly reports and Norges Bank
Lower interest rates affect profitability
As a result of the Covid-19 pandemic, Norges Bank reduced its policy rate to zero through spring. Banks’ profitability is largely influenced by the spread between banks’ deposit and lending rates. While banks quickly reduced mortgage rates after the policy rate reduction, deposit rates were lowered somewhat later in accordance with the two-month notification period. This resulted in a temporary reduction in banks’ net interest income and interest margins (Chart 3.4).
Historically low interest rates have weakened net interest income4, and there are prospects for somewhat lower interest margins. At the same time, lower interest rates may also reduce credit losses and generate higher lending growth5, which in isolation pulls up the overall profitability of banks.
Experience in other countries suggests that banks will likely avoid setting deposit rates below zero, at least for households’ savings deposits. This is because households and smaller firms may prefer to withdraw their deposits if they are charged for keeping them in the bank. Larger firms are better acquainted with money markets and more frequently make alternative investments in the market. Experience in other countries shows that larger firms more frequently face negative deposit rates.
Since low interest rates make it difficult for banks to reduce deposit rates, banks may wish to compensate with higher lending rates. The flexibility to set interest rates is also limited by competition in the lending market, particularly in the mortgage lending market. In addition, increased competition from the bond market may add pressure on corporate lending rates. Higher bank lending margins will make corporate bonds more cost-competitive relative to bank loans, particularly if bond market risk premiums remain low.
Lower interest rates also mean lower lending rates on the portion of the loans financed with equity. All loans are in part financed with equity. Banks’ interest expenses are not linked to equity, and lower lending rates will therefore not be compensated by lower interest expenses in this portion of financing. So far in 2020, the reduced interest margins have made it more difficult to sustain profitability (Chart 3.4).
Greater digitalisation and technological advances may also affect banks’ ability to maintain margins ahead. When changing banks becomes easier, interbank competition will likely intensify. An example is banks that provide mortgage loans without requiring a new property valuation and obtain income information directly from the Norwegian Tax Administration. In addition, technological advances may also contribute to the emergence of other new financing products and services ahead. The revised Payment Services Directive (PSD2) entered into force in Norway in 2019. The Directive permits new entrants or other banks to offer account information services (AIS) and execute payments on behalf of another bank’s customers. This may also facilitate comparison shopping for banking services. So far, PSD2 has not resulted in substantial changes to the competitive landscape, but the low level of interest rates may increase demand for new services and products that can potentially put pressure on banks’ interest income.
There are currently few signs that banks have reduced their internal profitability targets in response to lower interest rates. This reflects what the largest European banks reported to the European Banking Authority (EBA) in spring 2020.6
Norwegian banks’ operating costs are low
In recent decades, Norwegian banks have reduced operating costs, in part by reducing the number of employees and branches. An analysis conducted by Norges Bank suggests that automation and digitalisation have played a crucial role in banks’ cost-efficiency improvements.7
Norwegian banks have posted substantial profits so far in 2020, despite the sharp downturn and higher credit losses resulting from the Covid-19 pandemic (see box on this page). By comparison, in 2020 Q1, EU banks on average barely made a profit at all.8 An important reason is that Norwegian banks are more cost-efficient than European banks. Banks have reduced operating costs further so far in 2020 (Chart 3.1). The Covid-19 pandemic has also led other Norwegian banks to pursue new cost reductions, most of which will not take effect until 2021. This suggests that even though Norwegian banks are cost-efficient, they still have room for further efficiency gains.
Banks relatively profitable in recent downturns
Norwegian banks’ profitability was reduced in first half of 2020. So far, the decline in banks’ profitability is broadly at the same level as the declines earlier in the 2000s (Chart 3.A). However, during the Covid-19 pandemic, profitability has fallen faster. This is likely due to the sudden lockdown of the economy, already weak firms in oil-related industries and the introduction of IFRS 9 in 2018.
Chart 3.A Norwegian banks more profitable in downturns than other firms1 Accounting return on equity. Four-quarter moving average. Percent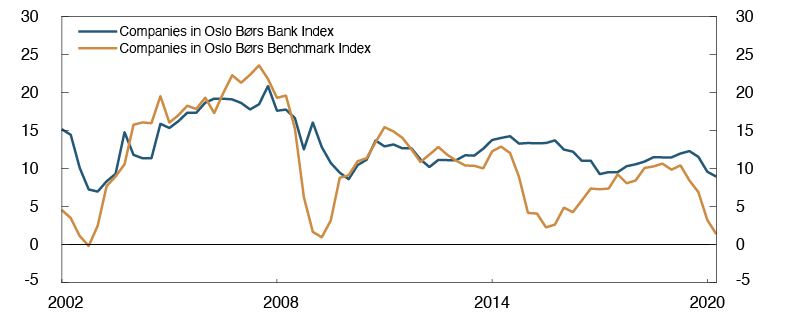
Source: Bloomberg
Over the past 20 years, downturns have affected banks’ profitability less than the profitability of the other companies on Oslo Børs2. A likely important explanatory factor is that none of these downturns have entailed particularly sharp falls in the collateral value of residential and commercial real estate (RRE and CRE), and this has contributed to lower credit losses. Real estate exposures represent a large portions of banks loan portfolios, but a smaller share of Oslo Børs’ Benchmark Index. Large losses on CRE occur rarely, but since banks’ exposures are considerable, losses can be substantial if prices should fall sharply. This was observed during the banking crisis in the 1990s, when banks’ profitability was weaker than the average on Oslo Børs.
Another reason for banks’ relatively solid profitability over the past 20 years is probably that few of the downturns have been prolonged. When banks lend, they often require good collateral and leases that will result in a long-term revenue stream for the borrower. This reduces banks’ vulnerability in relatively short downturns, but does not solve the challenges arising in long downturns. An example of this is the downturn following the oil price fall in 2014, which was nearly uninterrupted for a number of oil-related industries, especially supply and drilling. Here, banks’ credit losses were also high. Uncertainty surrounding the further course of the pandemic is high, and a prolonged economic downturn will likely lead to higher bank losses.
Besides high credit losses in downturns, other factors may have a positive effect on banks’ profitability. In downturns, reduced competition in the lending market may also have contributed to solid profitability for Norwegian banks, when branches of foreign banks have often been more cautious to lend, especially to firms.3 This may have given Norwegian banks higher lending margins. Since firms’ access to financing during downturns is often more difficult, their willingness to pay may be higher. In addition, banks’ fee income may increase if firms breach loan covenants. More restructurings and capital raisings will also increase banks’ fee income.
So far in 2020, bank equities have underperformed those of the other companies on Oslo Børs. This may indicate relatively weaker expectations for banks’ profitability ahead. Banks’ net interest income has been negatively affected by lower interest rates, while other firms will benefit from lower financing costs. This can pull the market capitalisations of banks and the other firms in opposite directions. European banks’ equity prices have underperformed those of Norwegian banks, which probably reflects expectations of continued weak underlying profitability (Chart 3.B).
Chart 3.B Norwegian bank equities have underperformed the broader market since the Covid-19 outbreak4 Total return. Index. 31 December 2019 = 100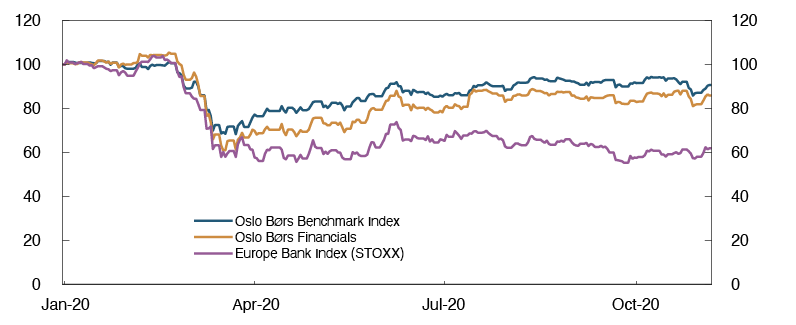
Sources: Bloomberg and Refinitiv Datastream
1 Period: 2002 Q1 – 2020 Q2. Oslo Børs Benchmark Index (OSEBX) and Oslo Børs Bank Index (OSE4010G).
2 The Benchmark Index (OSEBX) also contains banks but is weighted towards non-financials.
3 Source: Turtveit, L.T. (2017) “Branches of foreign banks and credit supply”. Economic Commentaries 3/2017. Norges Bank.
4 Period: 31 December 2019 – 6 November 2020. Oslo Børs Benchmark Index (OSEBX), Oslo Børs Financials (OSE4010G) and Europe Bank Index (STOXX Europe 600 Banks E).
1 Period: 2009 Q1 – 2020 Q3. Weighted average of DNB Bank, Nordea Bank Norge (to 2016 Q4), SpareBank 1 SR-Bank, Sparebanken Vest, SpareBank 1 SMN, Sparebanken Sør (from 2014 Q1), SpareBank 1 Østlandet (from 2016 Q3) and SpareBank 1 Nord-Norge.
2 Period: 1987 Q1 – 2020 Q3.
3 Based on actual figures for SpareBank 1 SMN and DNB, and estimates for other large banks.
4 Net interest income is primarily interest income from lending less interest expenses, such as interest on deposits and wholesale funding.
5 In the event of low lending growth, cost inflation may put pressure on banks’ profitability. If costs increase faster than lending, profitability declines.
6 Source: EBAs “Risk Assessment Questionnaire – Summary of the Results, Spring 2020”.
7 See Andersen H., “The improved cost-efficiency of Norwegian banks can be explained by automation and digitalisation”. Forthcoming Staff Memo 9/2020. Norges Bank.
3.2 Solvency
Banks are solid and satisfy the capital requirements. In the post-crisis years, stricter capital requirements led banks to retain a large share of their after-tax earnings. This generated higher capital ratios, as there was more Common Equity Tier 1 (CET1) capital (Chart 3.5). In 2017 and 2019, banks paid out more of their profits, since the phasing-in of higher capital requirements had largely been completed.
Satisfying capital requirements by an ample margin provides flexibility
So far in 2020, banks have increased their capital ratios despite the Covid-19 pandemic, even though capital adequacy was temporarily weakened in Q1. Both CET1 capital (the numerator) and risk-weighted assets (the denominator) have increased so far in 2020 (Chart 3.5).9 Market turbulence contributed to the substantial increase in risk-weighted assets in Q1. Counterparty risk rose and the currency depreciation led to higher values of foreign currency assets. During Q2 and Q3, two-thirds of the increase in risk-weighted assets had been reversed owing to less market turbulence. Even though the uncertainty related to the risk of credit losses for banks’ grew as a result of the Covid-19 pandemic, banks’ risk weights are little changed.10 This is in part because higher credit impairment losses on non-performing loans have contributed in isolation to a reduction in risk weights, and in part because the calculation of risk weights is based on long time series where individual years are given less weight. In addition, measurement of moderately weakened credit quality is subject to a time lag.
Chart 3.5 CET1 capital has increased more than risk-weighted assets so far in 202011 Decomposed change in CET1 ratio. Five largest Norwegian banking groups at the beginning of the period. Percentage points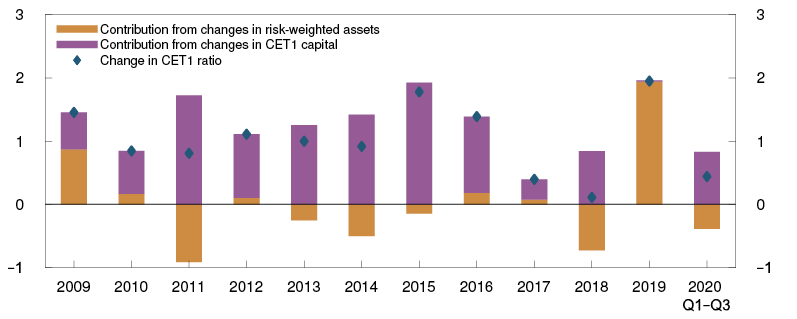
Sources: Banking groups’ quarterly reports and Norges Bank
Since banks’ CET1 capital ratios have increased somewhat so far in 2020, the countercyclical capital buffer reduction from 2.5% to 1% has increased banks’ margins over their capital measures (Chart 3.6). This creates flexibility to cope with increased credit losses, while simultaneously lending to creditworthy firms and households.
Chart 3.6 Banks’ capital ratios exceed capital targets12 Largest Norwegian-owned banking groups. Figures for 2020 Q3. Percent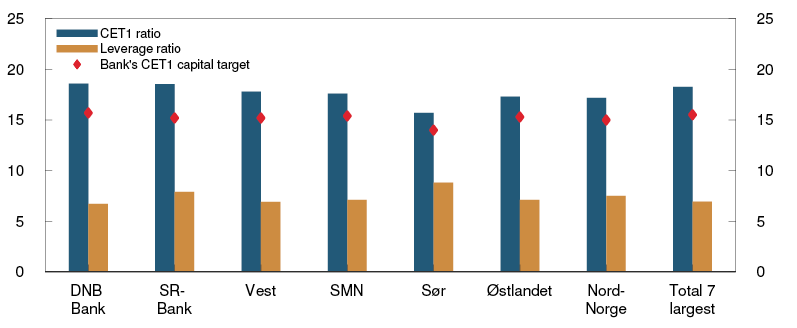
Sources: Banking groups’ quarterly reports and Norges Bank
Capital ratios are on par with Nordic banks
Since the financial crisis, large Norwegian banks have generally reported lower CET1 capital ratios than large Nordic banks, while leverage ratios have been higher. An important reason for this has been the Basel I floor for risk weights. In 2019, the removal of the Basel I floor in Norway occurred at the same time as the introduction of the risk weights for exposures to small and medium-sized enterprises, known as the SME discount. This reduced risk-weighted assets, ie the denominator in the capital adequacy ratio, and contributed to a 2 percentage point increase in the CET1 capital ratio in 2019 (Chart 3.5). The changes have helped large Norwegian banks achieve CET1 capital ratios that are just as high as large Nordic banks (Chart 3.7). From end-2020, the announced minimum requirement for average risk weights for Norwegian CRE exposures increased the capital requirement for large Nordic banks with CRE exposures in Norway (see "Effects of announced capital requirements for CRE lending").
Chart 3.7 CET1 capital ratios on par with the large Nordic banks Largest Norwegian and Nordic banking groups. Figures for 2020 Q3. Percent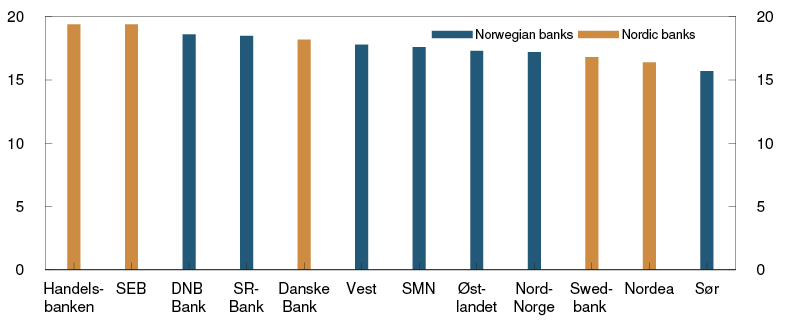
Sources: Banking groups’ quarterly reports and Norges Bank
Reduced dividend payouts improve loss-absorbing capacity
Deciding on dividends early in downturns is an important determinant of bank solvency, particularly if profitability had previously been high. In 2020, banks retained a larger share of their earnings from 2019. The reduced dividend payouts are affected by the deep economic downturn in Norway and the considerable uncertainty regarding the outlook. The Norwegian authorities have also discouraged paying out dividends until 1 January 2021, at the earliest. This is in line with the European Systemic Risk Board’s (ESRB) recommendation on the restriction of dividend distributions during the Covid-19 pandemic.13 If banks had cancelled all originally planned dividend payouts from 2019, the impact on CET1 capital ratios would have been an increase of approximately 2 percentage points. Even though banks have paid out less dividends so far in 2020, reduced and suspended payouts for 2019 add 0.2 percentage point to reported CET1 capital ratios. This reflects the suspension, rather than the cancellation, of a large share of dividend payouts. The way suspended dividends are reported varies across banks, but this has generally not resulted in higher reported capital ratios. Capital ratios do not normally increase until dividends are fully cancelled.
Most large banks are now setting aside a share of 2020 after-tax earnings for dividend payouts in 2021. Regulations require banks to set funds aside for planned dividend payouts. Provisions for payouts in 2021 weaken continuously reported capital ratios in 2020.
Confidence in banks’ key ratios must be sustained by relaxing regulations
Economic downturns can impair banks’ profitability and capital adequacy. If banks respond by tightening lending to meet capital requirements, this could amplify the downturn. To counter this, the authorities can introduce regulatory relaxation, such as reducing the countercyclical capital buffer (CCyB). Such a reduction requires banks to have sufficient capital to draw on.
The effect of reducing the CCyB may be limited by other requirements becoming binding when the buffer is reduced. An example is the leverage ratio requirement, which now includes a buffer element. It is uncertain whether there will be a leverage ratio buffer requirement that can be reduced when the EU’s Capital Requirements Regulation 2 (CRR2) is implemented in Norway.
Another requirement that can be binding in the event of a reduction of the requirement is MREL (Minimum Requirement for own funds and Eligible Liabilities) (see "New debt category for norwegian banks will make resolution more efficient" for a detailed discussion). If the capital held by banks to meet the CCyB requirement can also be used to meet the MREL, the MREL can become binding when the CCyB is reduced. Under current Norwegian regulation, buffer capital can be used to meet the MREL, although this will change with the implementation of the EU Bank Recovery and Resolution Directive II (BRRD II) into Norwegian regulation. MREL will then probably not be binding when the CCyB is reduced.
While a reduction of the CCyB changes the required amount of capital that banks must hold, new rules for asset valuation, risk measurement or impairment recognition may provide leeway by improving reported capital ratios even when real solvency has not improved. Such changes may give rise to uncertainty regarding banks’ actual profitability and solvency, which may weaken investor confidence. This, in turn, may worsen funding conditions for banks. The reporting of key regulatory ratios must be reliable and consistent over time, and changes to regulatory requirements during crises must support this.
9 CET1 capital ratio = CET1 capital/risk-weighted assets.
10 Based on CRD IV reporting at 2020 Q2.
11 Period: 2009–2020. Estimate for 2020 Q1 – Q3.
12 Capital measure here comprises regulatory requirements in 2020 with an additional 1 percentage point margin over capital requirements.
13 See ESRB (2020) “Recommendation of the European Systemic Risk Board if 27 May 2020 on restriction of distributions during the COVID-19 pandemic”. ESRB 2020/7
Can capital requirements and impairment rules cause banks to amplify the downturn?
The Covid-19 pandemic has led to expectations of higher bank losses. The authorities require banks to hold sufficient capital, giving them buffers to draw on when losses materialise. The capital adequacy rules may require banks to hold more capital when the risk of losses increases. At the same time, new impairment rules will probably lead to faster recognition of impairment charges that reduce banks’ capital. In isolation, this may force banks to tighten lending to meet the capital requirements, deepening the economic downturn. For now, there are few signs of such procyclical effects during the pandemic.
Few signs of procyclical effects of capital requirements
Banks must satisfy capital adequacy requirements. Banks’ capital adequacy is calculated as capital as a percentage of risk-weighted assets. Risk-weighted assets are calculated by weighting loans and other exposures with appurtenant risk weights. The largest banks calculate these risk weights using internal models subject to the approval of the authorities (internal ratings-based (IRB) approach). The smaller banks use more general and fixed risk weights (standardised approach) that are set by the authorities. The risk weights are intended to reflect the risk of losses. Banks holding riskier assets, assets with higher expected losses, must therefore be subject to higher capital requirements. The risk sensitivity of the IRB approach is intended to provide a more accurate picture of how risky banks’ assets are, but an undesired side effect of the IRB approach may be that it increases banks’ capital requirements in bad times, so that banks amplify economic downturns to a greater degree.
In bad times, losses usually rise, which can absorb banks’ capital and reduce capital adequacy. But capital adequacy may be weakened even if banks do not recognise losses. In bad times, banks’ assets are assessed as riskier, which can push up risk weights and thus risk-weighted assets. In good times, the converse holds.
It is primarily IRB banks that may see an increase in risk-weighted assets when their loans are assessed as riskier. Under the IRB approach, banks calculate risk weights using a formula specified by the authorities. IRB banks’ own loss estimates are a key component of the formula, including estimates of probability of default (PD) and loss given default (LGD). Risk weights rise with increases in both PD and LGD.
An analysis performed by Norges Bank shows that IRB banks’ risk weights can rise in downturns.1 The analysis begins with a sharp downturn in the Norwegian economy. Borrowers’ debt servicing capacity is impaired, and the value of banks’ collateral falls. The impairment of debt servicing capacity increases PD, while LGD rises when real estate and other collateral fall in value. This increases both risk weights and risk-weighted assets, reducing capital adequacy. The shorter the data series that IRB banks use in their calculations, the higher the weight given to new information and the more risk weights will fluctuate with the economic cycle. But the analysis shows that the impact will be insignificant if banks apply time series of at least 20 years that contain at least one sharp economic downturn.
For now, there are few signs that the downturn from the Covid-19 pandemic has increased risk weights (Chart 3.C). This may be in part because greater impairment losses on non-performing loans have in isolation contributed to reducing risk-weights and in part because the data banks use in the IRB models, eg corporate borrowers’ annual financial statements, have not yet been affected by the downturn. In addition, a number of factors are mitigating the procyclical effects of the IRB approach. The capital adequacy rules require IRB banks to use data series containing years with downturns when calculating risk weights. In Norway, banks must use data from the banking crisis at the beginning of the 1990s. The result is less cyclical variation in risk weights. Moreover, the Norwegian authorities have introduced a minimum requirement for risk parameters for residential real estate (RRE) exposures. This led to a near doubling of RRE risk weights. Since the minimum requirement for RRE risk weights are binding on banks, RRE risk weights will vary considerably less with changes in risk.
Chart 3.C Risk weights have changed little despite the downturn2 IRB-banks’ average risk weights. Percent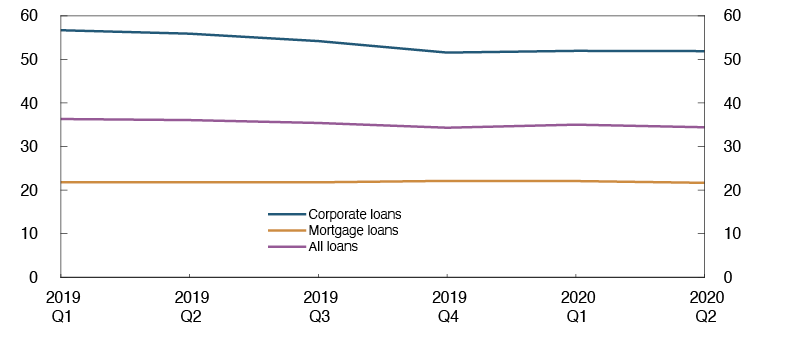
Source: Norges Bank
Impairment rules may require larger capital buffers for banks
A recently adopted accounting standard provides a number of rules for the way banks calculate and recognise credit losses. The standard, IFRS 9, requires banks to recognise credit impairment based on more forward-looking assessments than under the previous standard (IAS 39). IAS 39 permitted recognition of credit impairment only if there was objective evidence of a loss event. Under IFRS 9, banks must, to a greater degree, adjust impairment recognition to changing economic prospects. Banks may then recognise impairment earlier in downturns when expected losses rise.
IFRS 9 may result in greater transparency regarding credit quality, dampening uncertainty about the value of banks’ assets and boosting the market’s confidence in banks. In addition, earlier impairment recognition under IFRS 9 may help banks return to normal operations more quickly. Over the past decade, the profitability of a number of southern European banks has been weakened by large stocks of non-performing loans with low income, increased administrative costs and high capital requirements, partly because at an early stage, banks’ impairment recognition was insufficient. An example of the opposite case are the US banks that quickly cleaned up their balance sheets during the financial crisis, so that their problems proved to be less protracted than those of southern European banks.
Under IFRS 9, impairment recognition for performing loans shall be based on banks’ estimates of expected losses over the next year (stage 1). If a customer experiences problems servicing a loan, or the credit risk of the loan increases significantly (problem loan), banks must recognise a provision for lifetime expected losses, ie over the entire life of the loan (stages 2 and 3). A change from stage 2 to stage 3 requires objective evidence of impairment, eg that a loan has been non-performing for at least 90 days. Since stage 3 requires objective evidence of impairment, this stage largely corresponds to a credit loss under IAS 39.
The largest Norwegian banks use changes in PD to assess whether credit risk has increased significantly, where an increase in PD of 100–150% most often indicates a significant increase in credit risk. The banks estimate expected credit losses (ECL) using their own estimates of PD and LGD. The PD and LGD used by banks to estimate ECL are different from the IRB parameters used to calculate risk weights. Unlike the IRB parameters, PD and LGD are not supposed to vary cyclically under IFRS 9. In addition, PD for problem loans (stages 2 and 3) must reflect the lifetime probability of default.
IFRS 9 may require banks to hold larger capital buffers. If banks recognise a larger share of impairment losses earlier in downturns, banks’ capital adequacy may fall faster and more sharply. In that case, banks may be forced to tighten lending more to meet capital requirements. A counterfactual analysis performed by Norges Bank shows that IFRS 9 can increase Norwegian banks’ losses both immediately before and during downturns with increased credit risk.3 There are two reasons for this. First, expected losses increase on both performing and problem loans (stages 1, 2 and 3). Second, a larger share of the loans end up in stages 2 and 3, in which case, banks must recognise lifetime expected credit losses to a greater extent. There is reason to believe that the effect of IFRS 9 may be stronger the worse the economic outlook is at the beginning of the downturn.
During the first half of 2020, banks recognised substantial credit losses (Chart 3.D). In Q1, impairment of loans in stages 1 and 2 accounted for nearly half of the total losses of the seven largest banks, ie impairment losses could have been much less under the previous standard (IAS 39). In Q2 and Q3, banks overall recognised additional impairment losses on loans in stage 3, but reversed some of the impairment losses on loans in stage 2. The impact of IFRS 9 may have been dampened by new guidance from Finanstilsynet and EU supervisory bodies. Under the guidance, customers receiving temporary payment deferrals owing to the Covid-19 pandemic should not be considered distressed, unless they are affected in the longer term.
Chart 3.D Banks have recognised large credit losses in 2020 H14 The largest banks’ impairment losses by stage. Share of gross lending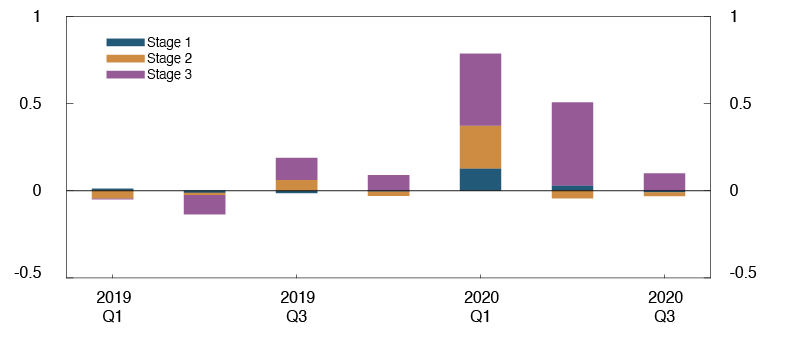
Sources: Banking groups’ quarterly reports and Finanstilsynet (Financial Supervisory Authority of Norway)
Norwegian banks have larger capital buffers compared with banks in other European countries. They are thus well equipped for both higher IRB risk weights and increased losses under IFRS 9.
1 See Andersen, H. (2011) “Procyclical implications of Basel II: Can the cyclicality of capital requirements be contained?”. Journal of Financial Stability, 7(3), August, pp 138–154, for a detailed description of the analysis.
2 Period: 2019 Q1 – 2020 Q2. DNB, SpareBank 1 SR-Bank, SpareBank 1 SMN, Sparebanken Vest, SpareBank 1 Østlandet, SpareBank 1 Nord-Norge, Sparebanken Møre and BN Bank. All exposures approved for the IRB approach.
3 See Andersen, H. and I.N. Hjelseth (2019) “How does IFRS 9 affect banks’ impairment recognition in bad times?”. Staff Memo 9/2019. Norges Bank, for a further description of the analysis.
4 Period: 2019 Q1 – 2020 Q3. Change in cumulative stock. DNB, SpareBank 1 SR-Bank, SpareBank 1 SMN, Sparebanken Vest, SpareBank 1 Østlandet, Sparebanken Sør, SpareBank 1 Nord-Norge. Data does not include unrealised losses and losses on unutilised credit and loan commitments.
Effects of announced capital requirements for CRE lending
The announced minimum requirement for commercial real estate (CRE) lending can result in a more level playing field for banks in Norway. The requirement may weaken the return on equity of CRE exposures, but banks may choose to maintain the level of return by increasing lending rates, which may dampen the rise in commercial property prices and the growth in real estate investment. It may also contribute to changes in the way CRE companies finance their activity.
The amount of capital that banks set aside for CRE exposures varies widely, primarily reflecting the considerable differences in risk weights that are used to calculate capital requirements. The risk weights for CRE exposures range from 100% for standardised approach banks to below 20% for the large Swedish IRB banks’ CRE exposures in Sweden.1 Norwegian IRB banks fall in between. The variation in risk weights may have a number of explanations. One might be that the risk of losses differs across banks’ exposures. The CRE lending market is heterogeneous and credit risk on these exposures can vary considerably. Another possible explanation for the variation is that banks employ different methods and risk models.
The Ministry of Finance has announced a temporary 35% floor for average risk weights for Norwegian CRE exposures from end-2020. The regulation has not yet been adopted. The floor will ensure that IRB banks set aside adequate capital for CRE exposures. The Ministry’s justification for the floor is that the vulnerability associated with high commercial property prices has increased in recent years.2 According to the Ministry, it is therefore more important than previously for risk weighting in the Norwegian market to be at an appropriate level. In its consultation response of 30 September 2019 (Norwegian only), Norges Bank supported the implementation of such a floor. Losses on CRE exposures have been low in normal times but high during crises in both Norway and other countries. Since crises are rare, banks might underestimate the risk. One analysis, partly based on banks’ earnings and losses on CRE exposures, indicates that the capital required under the proposed floor is at a reasonable level.3
The Ministry of Finance will ask the European Systemic Risk Board (ESRB) to issue a recommendation to EU member state authorities to recognise the announced Norwegian floor so that they will also apply to foreign banks’ operations in Norway. This is desirable for financial stability reasons and for securing a level playing field for Norwegian and foreign banks.
The IRB approach is intended to promote sound risk management among banks, for example by assigning higher weights to riskier exposures than to the safest exposures. This provides banks with incentives for the higher pricing of, or the limiting of exposure to, riskier borrowers. The risk sensitivity of the IRB approach may thus limit financial system vulnerability, assuming that risk weights reflect the actual risk of the exposures.
The floor for risk weights may have some undesirable side effects. One could be that they can weaken the incentive for banks to provide very low-risk loans because the safest loans are not assigned lower capital requirements than those that carry more risk. As Norwegian banks’ average risk weights are equal to or higher than the floor, the announced floor for CRE exposures will have little bearing on their incentives.
Information about banks’ credit exposures can shed light on which borrowers and banks will be most affected by the floor.4 The data set includes information on interest rates, loan amounts, probability of default (PD) and loss given default (LGD) for each exposure. The data set does not include information on risk weights, but PD and LGD can be used in the risk weight formula to estimate risk weights.5
Norges Bank’s calculations show that the floor may increase the capital requirement for a significant share of foreign banks’ exposures in Norway. The Bank illustrates the effects of the floor by more closely examining CRE exposures with estimated risk weights below 17.5%, hereinafter referred to as “CRE exposures with very low risk weights”. In practice, banks bound by the floor may need to set aside at least twice as much capital for these exposures. In isolation, this strengthens the loss-absorbing capacity of these banks. In loan volume, CRE exposures with very low risk weights accounted for approximately one fourth of foreign banks’ CRE exposures.6
The Bank’s data suggest that the risk weights have a significant impact on CRE lending rates. Lending rates are generally lower (higher) for CRE exposures with low (high) PD (Chart 3.E). Since risk weights fall when PD declines, there is also a close correlation between risk weights and CRE lending rates. In 2018, the average lending margin for CRE exposures with very low risk weights was 75 basis points lower than the average for all corporate exposures in the data set.
Chart 3.E Lending rates are generally lower for commercial real estate with a low probability of default7 Lending margin and probability of default (PD) on CRE exposures in Norway. Figures for 2018. Percent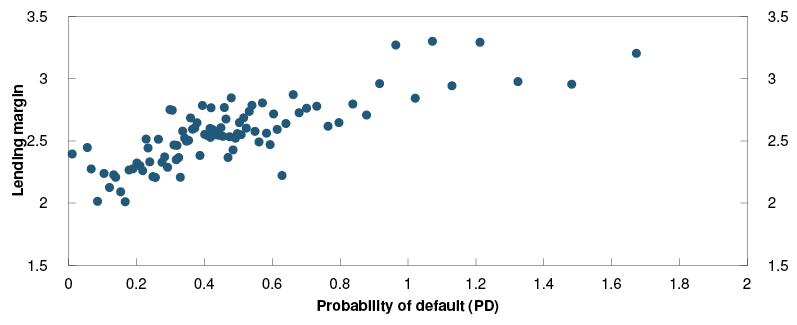
Source: Norges Bank
The floor may weaken the profitability of CRE exposures with low risk weights in Norway. At a minimum, the requirement may halve the return on equity for banks’ CRE exposures with very low risk weights. However, even if interest rates on these exposures remain unchanged, return on equity will continue to be satisfactory because capital requirements and expected losses on the exposures remain low compared with other corporate exposures. This suggests that foreign banks may continue to have incentives to extend very low-risk CRE loans in Norway.
Banks can choose to maintain profitability on their CRE exposures by raising lending rates. Certain calculations indicate that banks that are bound by the floor must raise their lending rates by at least 0.9 percentage point if they are to maintain return on equity for exposures with very low risk weights.8 This can dampen the rise in commercial property prices and CRE investment somewhat and contribute to lower systemic risk. It can also contribute to increased CRE financing with low credit risk in the bond market or by banks that are not bound by the floor.
1 See Finansinspektionen (2020): “Ökade kapitalkrav för banklån till kommersiella fastigheter” [FI recommends higher capital requirements for banks’ corporate lending], Promemoria, Finansionspektionen, January 2020 (in Swedish only).
2 See Ministry of Finance (2019): “Høring – Tilpasninger i kapitalkravene for banker” [Adjustments to capital requirements for banks], June 2019 (in Norwegian only).
3 For a further description of the calculations, see Andersen, H. (2019) “How much CET1 capital must banks set aside for commercial real estate exposures?” Staff Memo, 10/2019. Norges Bank.
4 See box on page 39 of the 2019 Financial Stability Report for more information on the data set.
5 See Special Feature on page 42 for more information on PD, LGD and risk weights.
6 The data set comprises Handelsbanken, SEB, Nordea and Danske Bank.
7 Lending margin is lending rate less three-month Nibor.
8 The loss rate on CRE exposures with very low risk weights is assumed to be equal to the product of average PD and LGD for these exposures. Costs associated with CRE exposures are assumed to be equal to DNB’s average costs associated with its entire corporate lending portfolio back to 2018 Q2.
4 Corporate lending and the risk of losses in the banking sector
The Covid-19 pandemic has led to a substantial fall in revenues for many Norwegian firms. So far, banks have largely reported credit losses in the oil service sector, where the financial situation was already weak at the beginning of the year. Losses may also increase in other industries ahead. Lending to the most vulnerable industries accounts for a limited share of banks’ total lending, but banks may incur substantial losses if commercial property prices fall sharply.
Climate risks will be one of the main challenges facing Norwegian firms in the years ahead. Norwegian banks have limited exposure to high-emission industries. It is important for banks to take climate risks into account in their risk assessments of both new and existing loans.
4.1 Corporate lending and the Covid-19 pandemic
The effect of the pandemic on firms is important to bank profitability
Bank loans are an important source of corporate financing. Slightly under half of total corporate debt, and just over 75% if intragroup debt is disregarded, is held by banks. Norwegian firms’ bank debt is equivalent to about 70% of GDP, approximately on a level with the European average.1
Corporate lending makes up nearly 40% of total bank lending. This share has been falling since the beginning of the 1990s. Corporate lending makes up about 40% of DNB’s lending. The share is lower for most savings banks, while it is somewhat higher for some branches of foreign banks. Corporate credit losses are the most important reason for fluctuations in banks’ earnings. Over the past 10 years, banks’ losses on corporate loans have on average been 0.4% per year (see Table 5 in Annex).
The Covid-19 pandemic has had severe consequences for banks’ customers. Many firms have experienced a substantial fall in revenues. Large-scale measures adopted by the authorities, such as deferrals and reductions of tax payments, changes in the rules governing layoffs and schemes for cash support and guaranteed loans, have allowed many businesses to continue operating despite an extended period of sharply falling revenues (see "How have government measures during the Covid-19 pandemic affected the risk of credit losses in the Norwegian banking sector?"). Repayment deferrals and short-term liquidity loans from banks have also contributed to sustaining liquidity in the corporate sector. So far in 2020, the number of bankruptcies has been moderate. In the period ahead, high losses are still expected on banks’ corporate exposures to particularly vulnerable industries. Many parts of the business sector will nonetheless most likely get through the crisis without a sharp rise in bankruptcies.
Some industries have been particularly hard hit
Containment measures have had a direct impact on a number of industries, resulting in particularly sharp falls in revenues (Chart 4.1). A range of industries not directly affected by containment measures have also experienced a marked fall in revenues. Tourism, personal services and transport are the industries with the largest falls in revenue. Besides retail, tourism and personal services have received the largest subsidies through the cash support and bank loan guarantee schemes (see "How have government measures during the Covid-19 pandemic affected the risk of credit losses in the Norwegian banking sector?"). The share of bank debt to these industries is, however, moderate. Lending to the hardest-hit industries makes up about 5% of banks’ total lending.2
Chart 4.1 Low lending volumes to industries with the largest fall in turnover3 Share of banks’ corporate exposures and estimates of cumulative aggregate fall in turnover compared with 2019 in different industries. Percent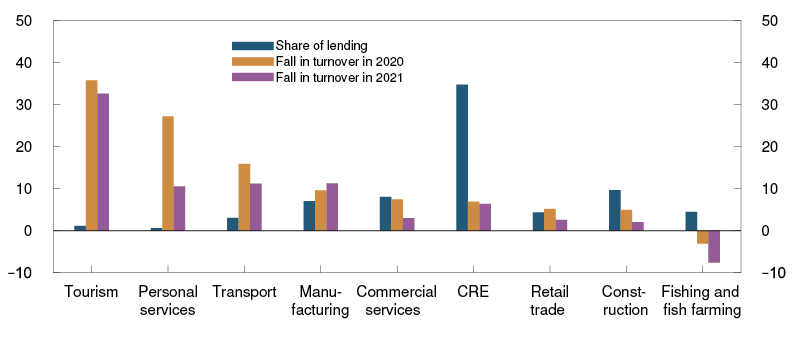
Sources: Finanstilsynet (Financial Supervisory Authority of Norway) and Norges Bank
Other industries are also vulnerable. Manufacturing has been adversely affected in particular by the fall in global demand, and demand for Norwegian goods exports may take time to pick up again. Lending to Norwegian manufacturing firms makes up about 7% of banks’ corporate lending. Many retail firms were also hard hit in the first months of the Covid-19 outbreak when public mobility was particularly low. Goods consumption has since increased considerably in some segments, such as sports and leisure. Restrictions on travel abroad and reduced cross-border trade have also pushed up sales in Norway.
Some industries are still experiencing low demand as a direct result of the containment measures. Others are feeling the effects of lower global demand as a result of the pandemic. Even though growth has picked up, many firms are still reporting lower sales than before the crisis. Over time, this may contribute to reduced debt-servicing capacity and higher risk of default and bankruptcy, potentially leading to higher bank losses.
Losses in particularly vulnerable industries may increase in 2021
Norges Bank assesses loss risk at industry level. The Bank’s bankruptcy probability model KOSMO is used to assess the increase in loss risk.4 The model simulates the financial effect of the contraction in the economy on individual firms, in line with the projections in Monetary Policy Report 3/20. The projections take account of the public measures in place as of September. KOSMO estimates individual bankruptcy probabilities. These are linked to banks’ exposures via Finanstilsynet’s (Financial Supervisory Authority of Norway) exposure database, and the results are used to assess developments at industry level.
The Bank’s analysis shows that banks’ expected credit losses associated with hard-hit industries will increase in 2020 compared with 2019 (Chart 4.2).5 The estimated increase in total credit losses are in line with the impairment already recognised by banks so far in 2020. Losses so far, however, are considerably lower than might have been feared in view of the scale of the economic decline in spring 2020. There are several reasons for this. After several good years, many Norwegian firms had buffers of capital to draw on when the Covid-19 pandemic broke out. In addition, public measures have helped many businesses to pay their bills and continue to operate. This has resulted in lower bank losses than might otherwise have been expected. Payment deferrals offered by banks have also helped businesses to survive liquidity shortfalls.
Chart 4.2 Largest increase in credit losses in severely affected industries6 Estimated losses as a share of banks’ exposures to the industry. Percent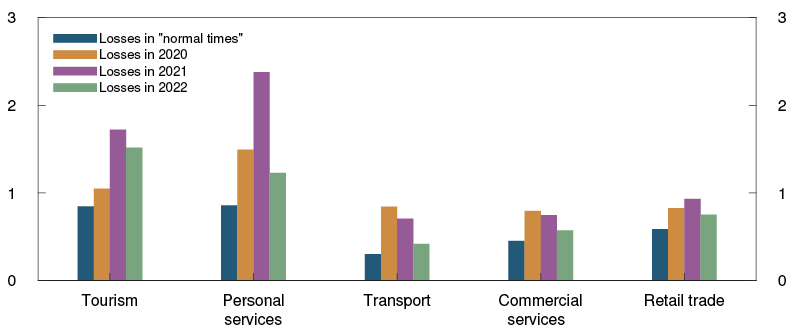
Source: Norges Bank
After an extended period of reduced revenues, many businesses are now drawing on their buffers. Some that have received support may encounter problems when the various measures are gradually phased out. Many public measures are now being unwound. And banks cannot just extend payment deferrals without having to post increased impairment losses on the loan. The probability that businesses that have not succeeded in recovering revenue will encounter problems has therefore increased.
Thus, the number of bankruptcies – which so far in 2020 has remained below its historical average – can be expected to start rising in the most vulnerable industries in the period ahead. The loan loss ratio will likely be lower in 2021 than in 2020 but will still be markedly higher than its historical average. We expect that losses will fall further in 2020, but still remain higher than normal historically. There is, however, considerable uncertainty, not least if containment measures prove to be more extensive than assumed in September.
Commercial real estate lending is important for banks
Commercial real estate (CRE) lending makes up about 35–40% of banks’ total corporate lending. In good times, commercial real estate is a highly secured asset, with high collateral value and a steady rental income flow. However, experience shows that in financial crises with sharply falling property prices, banks’ CRE losses can be high.7
The economic downturn that Norway is in the midst of has reduced demand in the rental market. The hotel industry has been hard hit so far, but this sector accounts for a relatively limited share of banks’ exposures. The lockdown period may also have amplified an already negative trend in the retail trade sector owing to the rise in online shopping. On the other hand, support packages have helped a number of CRE companies to maintain their leases despite periods of low revenues. There is uncertainty as to how experience of the pandemic will affect demand for office space ahead.
Although the CRE sector stands out in that debt is particularly high relative to revenues, Norwegian CRE companies entered 2020 with higher equity ratios and better liquidity than prior to the financial crisis (Chart 4.3). Some of the improvement in equity ratios in recent years can be attributed to the rise in property prices. A number of CRE companies value their properties at fair value in the accounts, and price changes are therefore reflected in the balance sheet more quickly. Nonetheless, a positive factor for solidity in the CRE market is that companies have generally not used rising prices to raise more debt. In recent years, both Finanstilsynet and Norges Bank have focused attention on the risk associated with CRE exposures.8 The Ministry of Finance has given notice that a temporary floor of 35% for average risk weights for CRE exposures in Norway will apply as from year-end 2020. The floor is intended to ensure that banks hold sufficient capital for CRE lending (see "Effects of announced capital requirements for CRE lending"). The floor may induce banks to raise interest rates on the safest CRE loans.
Chart 4.3 CRE firms are now more solid than before9 Share of firms’ debt under each equity threshold. Percent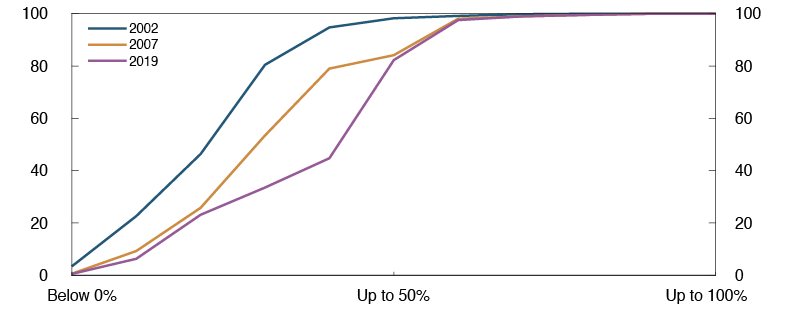
Source: Norges Bank
The risk of CRE losses is particularly high if there is a persistent decline in rents and a subsequent fall in property values. The Bank’s assessment is that the relationship between supply and demand in the CRE market was well-balanced at the end of 2019. The CRE sector has adequate financial buffers to absorb the fall in property prices observed so far in 2020. Building completions are at a somewhat higher level than in recent years but are expected to decline markedly from 2022. Employment is expected to pick up again somewhat in the years ahead (see Monetary Policy Report 3/2020). This will contribute to a renewed rise in rents. Losses on CRE exposures are therefore also expected to be moderate in the years ahead (Chart 4.4). If, on the other hand, employment should fall and remain at a lower level for an extended period, the rent level could fall, increasing the risk of default and resulting in considerably higher credit losses than now assumed.
Chart 4.4 CRE losses are expected to remain low10 Estimated CRE losses as a share of CRE exposures and as a share of estimated total losses on corporate exposures. Percent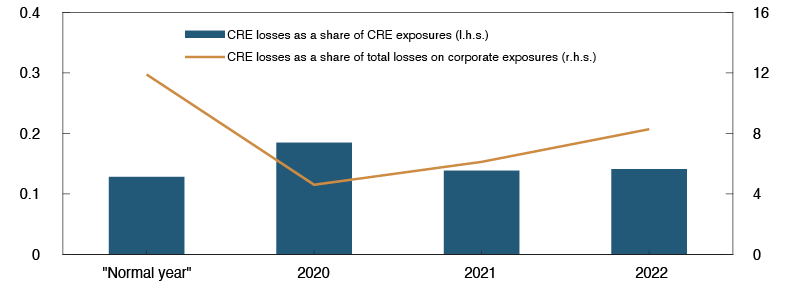
Source: Norges Bank
Banks’ have largely incurred losses on exposures to oil service
In the Norwegian oil sector, oil service companies in particular pose a risk to banks, and banks have incurred substantial losses on lending to this industry over the past five years.11 International shipping is another industry that has inflicted losses on banks in bad times and that may be adversely affected by reduced global trade as a result of the Covid-19 pandemic. Cruise shipping is particularly vulnerable, but parts of the shipping industry are also sensitive to developments in oil demand. Oil service and international shipping together account for about 14% of banks’ corporate lending.
Oil service firms supply goods and services to the oil sector. Many firms in this industry have substantial capital investments and debt, particularly in the supply and drilling segments. The industry experienced a marked fall in demand after the fall in oil prices in autumn 2014. In the years since then, a number of restructuring processes have been under way. Much of the remaining debt in the oil service industry is bank loans, a large share of which are provided by the Norwegian banking sector. Banks have already recognised substantial impairment losses on oil service lending. At the end of 2019, about a third of banks’ overall lending to this industry had been written down. Financial problems in the industry have persisted, however, and at the end of 2020 Q2, equity ratios in the supply and drilling segments were at a record-low level (Chart 4.5).
Chart 4.5 Gradual weakening of oil service firms’ equity ratios12 Percent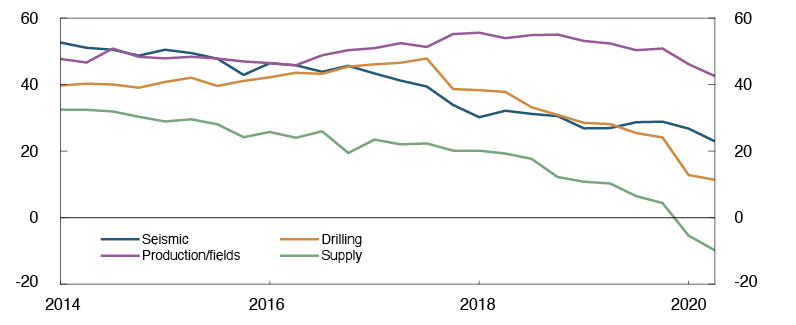
Sources: Bloomberg and Norges Bank
At the beginning of 2020, oil service firms needed a higher level of oil prices and investment to overcome their financial problems without further write-downs. Oil price developments so far in 2020, on the other hand, have led to a further decline in investment. Public support packages for the oil sector are making a positive contribution, but there is still reason to expect the level of investment to remain at a lower level than before the pandemic (see Monetary Policy Report 3/20). This will likely increase debt-servicing problems for many oil service firms and result in further pressure to write down loans. A number of banks have already recorded new losses on lending to the industry so far in 2020.
Norges Bank's estimates of banks’ impairment losses in oil service and international shipping are based on assessments of banks’ loan portfolios.13 Overall, it is estimated that losses on loans to oil service and international shipping combined will be about 1% of total corporate loans in 2020 (Chart 4.6). This is in line with the impairment losses on loans to these industries recorded by banks so far in 2020. In 2021, losses on these loans are expected to make up about 0.3% of total corporate loans. Around half of Norwegian banks’ exposures to oil service are expected to be assessed as particularly doubtful and be substantially written down at the end of 2021.
Chart 4.6 Estimated credit losses in oil service and shipping14 As a share of total corporate exposures. Percent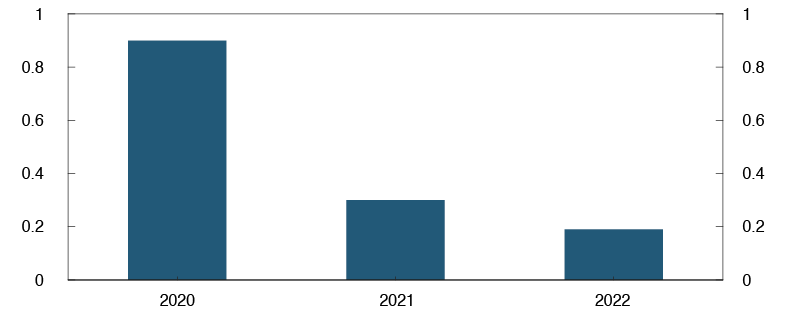
Source: Norges Bank
1 See Hjelseth, I.N. and H. Solheim (2020) “Are Norwegian firms highly indebted compared with other countries?” Published on the Bankplassen blog 6 March 2020. The unweighted average for the EU was 67% and 68% for Norway at end-2019 if the three EU countries with the highest level of corporate debt – Luxembourg, Cyprus and Ireland – are excluded.
2 This section examines bank lending to the sectors “non-financial enterprises” and “foreign sector” from Finanstilsynet’s exposure database. The share of lending shown here therefore deviates somewhat from the share of lending shown in Chart 4 on page 73, which covers the corporate market.
3 Loan data at 31 December 2019. Personal services include sports and leisure activities and other instruction. Tourism includes accommodation, food and beverage serving and tour operators. Transport excludes international shipping.
4 See Hjelseth, I.N. and A. Raknerud (2016) “A model of credit risk in the corporate sector based on bankruptcy prediction”. Staff Memo 20/2016. Norges Bank.
5 For further documentation of the method, see Hjelseth, I.N., E.A. Saxegaard, H. Solheim and B.H. Vatne (2020) “Estimated bank losses on lending to non-financial enterprises“. Staff Memo 10/2020. Norges Bank (forthcoming).
6 Personal services include sports and leisure activities and other instruction. Tourism includes accommodation, food and beverage serving and tour operators. Transport excludes international shipping.
7 See discussion in Section 4 of Financial Stability Report 2018.
8 See for example Finanstilsynet (2019) Risk Outlook – June 2019 and Financial Stability Report 2018.
9 CRE groups with debt.
10 Period: 2019–2022.
11 Oil extraction companies, the firms responsible for actual production, also make substantial investments. These companies’ profitability is, however, still solid compared with many oil service firms, and banks’ losses on lending to extraction in recent years have not been as high.
12 Period: 2014 Q1 – 2020 Q2.
13 The method is described in detail in Hjelseth, I.N., E.A. Saxegaard, H. Solheim and B. H. Vatne (2020) “Anslag på bankenes tap på utlån til ikke-finansielle foretak” [Estimated bank losses on lending to non-financial enterprises]. Staff Memo 10/2020. Norges Bank.
14 Period: 2020–2022.
4.2 Climate risks
Norwegian banks have a moderate share of lending to high-emission sectors
Climate change and the transition to a low-carbon economy will be one of the greatest challenges facing Norwegian firms in the years ahead. Borrowers unable to tackle these changes present risks to the banking sector.
Climate risks are normally divided into two categories: transition – related to the shift to lower emissions – and physical – related to the physical effects of climate change. More rapid cuts in emissions will increase transition risks but reduce physical risks. In the near term, transition risks dominate, and the effect of emissions reductions on physical risks is moderate. But postponing emissions cuts now may require even larger reductions later – which will most likely increase transition risks. There is reason to believe that the cost of adaptation to reduce emissions is transitory, while the cost to the economy of accelerating climate change if emissions are not reduced could be significant and long-term.
Under the Climate Change Act, Norway is committed to substantial emission reductions in the coming years. Norway’s emissions must be reduced by 50–55% of the 1990 level by 2030, and Norway must be carbon-neutral by 2050. By comparison, greenhouse gas emissions in Norway in 2019 were 2% lower than in 1990. Researchers at Statistics Norway have estimated that in order for emission cuts to succeed, carbon pricing will have to be increased from about NOK 600 today to at least NOK 3 500 per tonne of CO2-equivalents in 2030.15 Although the transition will require substantial investment, the researchers estimate that the negative effect on overall output as Norway implements the changes necessary to reduce emissions will be moderate. However, it is important to note that even though climate change adaptation can be carried out without sizable negative effects on overall output and employment, there will be substantial redistribution effects and costs that could influence the political will to implement effective measures. For individual firms, adaptation to reduce emissions could also mean higher costs, even if the impact on the Norwegian economy in total is not as severe.
Norwegian banks are primarily exposed to transition risks through lending to firms with high emissions that thus risk being subject to higher taxes or having to depreciate assets. Four sectors stand out as sources of high emissions: transport, manufacturing, international shipping and oil-related industries. These sectors account for a moderate share of Norwegian banks’ lending (Chart 4.7). Norway introduced carbon pricing at a relatively early stage, particularly to influence domestic consumption, while most of the internationally exposed sector is subject to the common European quota system, which underpins ambitious emission reduction goals.
Chart 4.7 Moderate lending to industries with the highest emissions16 Industry’s share of greenhouse gas emissions and banks’ exposures to the industry as a share of corporate exposures. Percent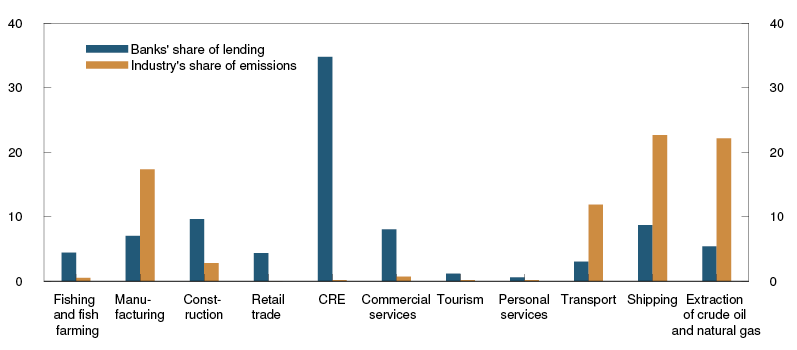
Sources: Finanstilsynet (Financial Supervisory Authority of Norway), Statistics Norway and Norges Bank
International shipping has so far generally been exempt from carbon tax. Globally, the industry is still characterised by old technology and high emissions. Substantial changes will be needed in the years ahead. Norwegian banks should therefore take account of this in their risk assessments.
If global carbon taxes are introduced more quickly, oil and gas industry assets may have to be depreciated more rapidly than assumed at the time of investment. In climate scenarios based on global cooperation to achieve Paris Agreement targets, however, oil and gas will continue to play an important role in global electricity production until 2050 (see "The Network for Greening the Financial System (NGFS) climate scenarios"). The existing Norwegian oil sector will therefore not become unprofitable owing to climate considerations alone in the near and medium term. However, there is reason to believe that oil demand will decline over time and that oil price uncertainty will increase. This will affect expected returns. Heightened uncertainty must be taken into account when assessing capital requirements for lending to such projects.
Physical risks also relevant for Norwegian banks
In climate models focusing on a higher average global temperature, Norway is one of very few countries that might experience a productivity increase if the temperature rises. This does not mean that Norway is insulated against the negative effects of physical climate change. First, Norway is also affected by the increase in extreme weather events caused by a higher temperature. Second, climate change could entail changes in local climate and biological systems that could have entirely unforeseen consequences. Furthermore, Norway will be adversely affected via the impact of climate change on countries more vulnerable than our own, particularly countries in tropical regions. Effects on food production and labour productivity in these areas could feed through to Norway via a number of channels. Norwegian banks must be prepared for potential consequences for their exposures, also indirect consequences.
Documentation of firms’ impact on the environment and climate should be strengthened
Since high-emission industries will have to undergo substantial adaptation, information about emissions and firms’ emission management plans have become an important part of the information basis in financial transactions. Surveys conducted by Finanstilsynet17 show that many companies’ sustainability reporting is still inadequate.
For investors, it is difficult to assess how banks have taken account of climate risks in their credit assessments. It will therefore be important in the period ahead for banks to enter into a dialogue with their customers in order to document their climate footprint. Green loans – where documentation of the environmental impact is one of the loan conditions – could be an instrument to achieve this.
The authorities can contribute to better disclosure of climate risks in the financial sector by providing guidance, supervision and regulation. More unified systems for assessing green loans could enhance credibility and reduce the likelihood of abuse. A range of processes have been initiated in this context. The European Commission has taken an active role by, for example, designing a new taxonomy to define what is ‘green’. Norway takes part in such processes at a European level. The forthcoming EU regulation on disclosure and classification of information on how financial sector investments and activities contribute to sustainable developments will be incorporated in Norwegian law.18 The regulation also includes requirements with regard to information when financial products are traded to make it easier for investors to compare sustainable investments. Not all European requirements can automatically be applied to Norwegian conditions. The Norwegian authorities can contribute to implementing these regulations effectively in Norway.
15 See Fæhn, T., K.R. Kaushal, H. Storrøsten, H. Yonezawa and B. Bye (2020) “Abating greenhouse gases in the Norwegian non-ETS sector by 50 per cent by 2030”. Reports 2020/23. Statistics Norway.
16 Figures for 2019. Loan data at 31 December 2020. Personal services include sports and leisure activities and other instruction. Tourism includes accommodation, food and beverage serving and tour operators. Transport excludes international shipping.
17 See Finanstilsynet’s survey of listed companies' sustainability reporting (Norwegian only).
18 See Regjeringen.no
How have government measures during the Covid-19 pandemic affected the risk of credit losses in the Norwegian banking sector?
The authorities have introduced a range of measures to support the business sector since the Covid-19 outbreak. Government schemes to supply cash and government-guaranteed bank loans show that support and loans have largely been given to the hardest-hit industries. A substantial share of banks’ borrowers in these industries have received support from one or both schemes. This has likely reduced the risk of banks’ credit losses in 2020.
Many businesses have lost substantial revenues in 2020 as a result of the Covid-19 pandemic. The authorities have introduced large-scale measures to support the business sector through a demanding period. The measures cover a wide range, from easing the rules governing furloughs and deferrals and reductions of tax payments to cash support schemes (the compensation scheme) and government-guaranteed loans.
Data on firms’ use of the compensation scheme and the loan guarantee scheme have been used together with data for banks’ individual exposures to analyse the effect of these two schemes on the risk of losses in the Norwegian banking sector.1
The compensation scheme provided businesses experiencing a substantial fall in revenues with financial compensation on a monthly basis for fixed, unavoidable costs between March and August. Businesses had to meet certain criteria in order to receive support. For example, the fall in revenues had to be at least 30% (20% in March) compared with normal monthly revenues.
The loan guarantee scheme enables banks to provide loans with a government guarantee of 90%. The loans are intended for firms with acute liquidity needs as a result of the pandemic, if the firms are otherwise creditworthy. The scheme will be in place until the end of the year and the total government guarantee is limited to NOK 50bn.
Support and loans have largely been given to the hardest-hit industries
Around NOK 6.8bn has been disbursed in cash support so far, clearly reflecting the lockdown in March and April. The number of businesses receiving support was far higher and the amounts disbursed larger in March and April than in May (Chart 4.A). The fall in support payments from March and April to May was particularly large in personal services (health services, education, hairdressing, fitness centres, etc) as these industries were physically closed down for a period, but most were able to open again at the end of April. Support payments to the retail industry also fell sharply in May when infection rates decreased and containment measures were reduced. An improved economy combined with lower compensation rates2 resulted in lower disbursements through the summer months.
Chart 4.A Cash support disbursements show clear traces of the lockdown in March and April3 Amounts disbursed. In millions of NOK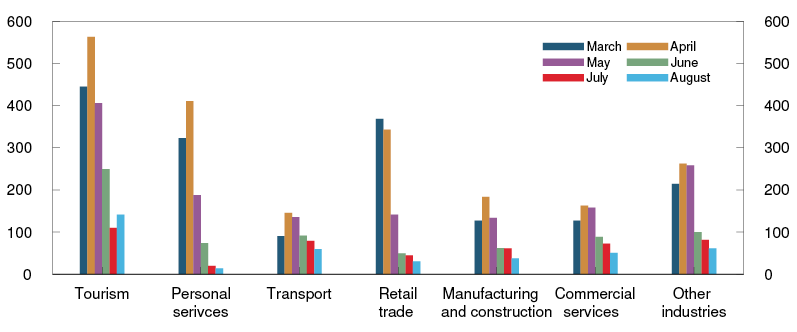
Sources: Norwegian Tax Administration and Norges Bank
Tourism overall is the largest recipient of cash support and continued to receive relatively large disbursements in August. Following an autumn with higher infection rates and low travel activity, it has been decided to extend the compensation scheme to the end of February 2021 for tourism.
NOK 10.9bn in loans to around 3600 firms have been approved under the loan guarantee scheme so far. This is considerably lower than the scheme’s limit. Loan amounts are on average far larger than the average amount disbursed under the compensation scheme. The retail industry has borrowed by far the most under this scheme, followed by manufacturing.
The schemes have reduced the risk of losses on lending to hard-hit industries
Disbursements from the schemes can improve debt servicing capacity for those bank customers that are severely affected. In order to explore the effect of the compensation and loan guarantee schemes on the risk of bank losses, information from the two schemes has been linked with data for the eleven largest banks’ exposures at the end of 2019.
Firms receiving support from one or both schemes account for nearly a quarter of the volume of banks’ exposures in the tourism industry (Chart 4.B). The figure is also relatively high in personal services, transport and retail trade. The schemes therefore play an important role for the risk of losses in this portion of banks’ portfolios, at least in the short term. These industries account for about 10% of banks’ corporate exposures.
Chart 4.B Banks› exposures to severely affected industries helped by government schemes4 Lending to firms that have received support as a share of lending to sector. Percent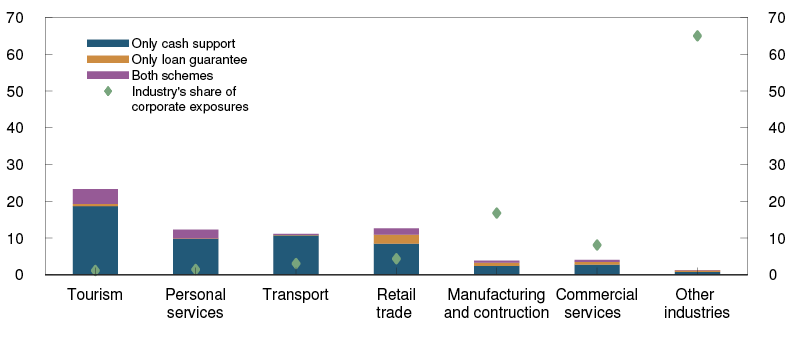
Sources: Finanstilsynet (Financial Supervisory Authority of Norway), GIEK, Norwegian Tax Administration and Norges Bank
The share of lending to firms that have received cash support is generally larger for savings banks compared with DNB and branches of foreign banks (Chart 4.C). Savings banks have also accounted for the highest share of lending through the guarantee scheme relative to lending volume.
Chart 4.C Government schemes mean the most to regional savings banks5 Loans to firms that have received support as a share of corporate exposures. Percent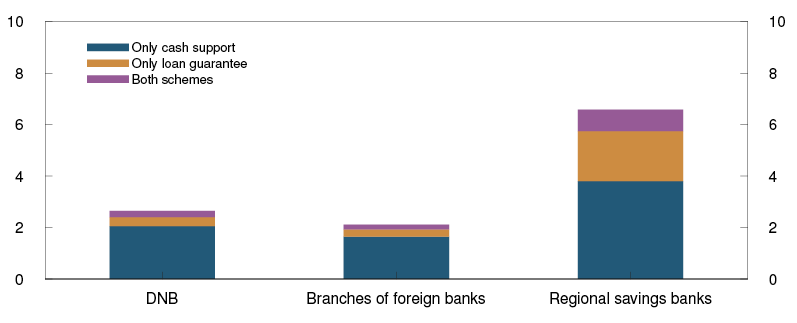
Sources: GIEK, Norwegian Tax Administration and Norges Bank
1 Microdata for other schemes, such as the wage compensation scheme, are also available. As the cash support and loan guarantee schemes are nevertheless probably the schemes that best capture the hardest hit firms, we have chosen to focus on these two schemes in this analysis.
2 In March, the compensation rate was 90% or 80%, depending on lockdown requirements. The compensation rate was 70% for all recipients in June and July and 50% in August.
3 Period: March 2020 – August 2020. Personal services include sports and leisure activities, other instruction, medical and dentistry services and other health services. Tourism includes accommodation, food and beverage serving and tour operators. Transport excludes international shipping.
4 Cash support and loans under the guarantee scheme disbursed at 5 November 2020. Loan data at 31 December 2019. Personal services include sports and leisure activities, other instruction, medical and dentistry services and other health services. Tourism includes accommodation, food and beverage serving and tour operators. Transport excludes international shipping.
5 Cash support and loans under the guarantee scheme disbursed at 5 November 2020. Loan data at 31 December 2019.
The Network for Greening the Financial System (NGFS) climate scenarios
The increased concentration of greenhouse gases is changing the global climate. Climate scenarios have been developed to explore the best way to reduce emissions and the consequences of different policy alternatives. The Network for Greening the Financial System (NGFS), of which Norges Bank and Finanstilsynet (Financial Supervisory Authority of Norway) are members, has recently published a set of climate scenarios to provide a basis for economic assessments of climate risks.
In the NGFS climate scenarios, a target is set for the concentration of greenhouse gases at a point in the future. Using a set of models and assumptions, developments are estimated for various variables, such as carbon tax and sources of energy production, that are necessary to achieve this target. A climate scenario is not a prediction. It is a systematic description of what a policy alternative might look like, given today’s knowledge base.
The NGFS has developed a set of climate scenarios to meet the need for such among member organisations. The scenarios are publicly available. In choosing a model provider, it was emphasised that the models should be openly available, so that others would have access to them and be able to develop them further.
The scenarios describe potential consequences of policies to introduce emission reductions that are sufficient to achieve the Paris Agreement goals. The NGFS have decided to focus on two alternatives:
- Global policy to reduce emissions is implemented immediately.
- Global measures to reduce emissions are delayed until 2030.
With immediate measures, emission reductions can begin now, but can be spread over an extended period, which will also allow a slower pace. If measures are delayed, emissions will be higher in the near term and will have to be reduced more rapidly later to achieve the same targets. We show the results of estimates based on the assumption of moderate developments in carbon dioxide removal (CDR), primarily by combining bioenergy production with carbon capture and storage, but with the objective of keeping the temperature increase below 2˚ rather than 1.5˚.
Transition to lower emissions costly, but more costly to wait
The scenarios provide estimates of how much carbon prices will have to rise to ensure that the private sector adapts to lower emissions. Immediate measures means that the increase in carbon prices begins now (Chart 4.D). If raising the carbon tax is delayed until after 2030, the tax will have to be raised more rapidly and to a higher level. The scenarios assuming a global carbon tax do not take into account that wealthy countries must be expected to implement larger emission cuts and a higher carbon tax than developing countries.
Chart 4.D Carbon price – increase a little now or more later?1 In USD per tonn CO2 (2010-prices)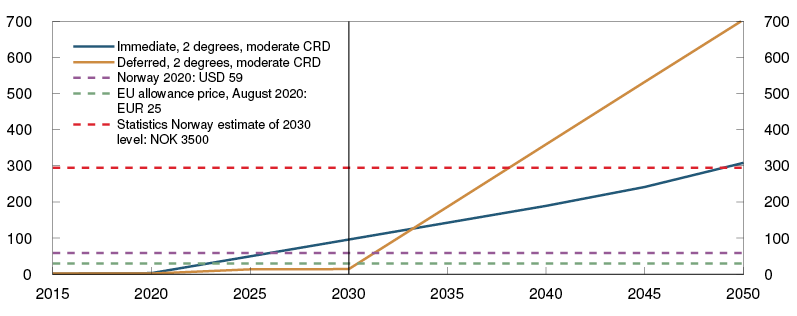
Source: NGFS climate scenarios
The scenarios also feature pathways for output, consumption, investment and pricing of various forms of energy. With immediate measures, oil demand will stabilise at today’s level (Chart 4.E), although there will still be room to burn oil towards the end of the century. If measures are delayed, oil demand could edge up in the near term, but a large share of Norway's oil reserves will thereafter have to remain unused because the need to cut fossil fuel consumption will increase.
Chart 4.E Demand for oil will remain elevated for many years2 In energy equivalents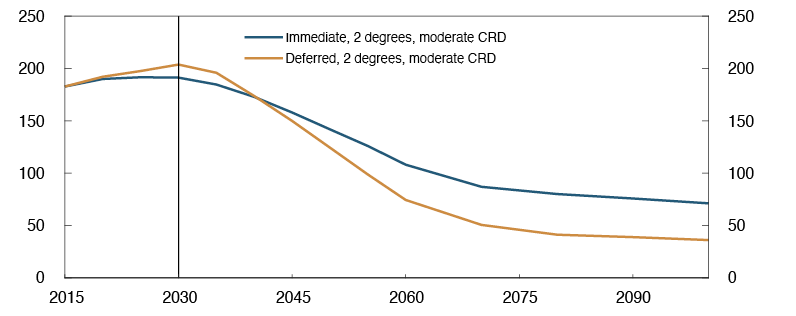
Source: NGFS climate scenarios
The scenarios also provide an estimate of the cost of these measures in the form of lower GDP. Emissions cuts in the scenarios will mainly be achieved through technological change, but higher energy costs will also reduce output volumes somewhat. The faster emissions have to be reduced, the larger these costs will be. There is of course considerable uncertainty associated with such estimates.
Immediate measures result in slightly lower global GDP than the alternative scenario where measures are delayed in the short term (Chart 4.F). Delayed measures mean that changes start later but have to be implemented more rapidly. This will result in weaker global GDP growth over time. The scenarios show that the effect of emission reductions on overall output is moderate in countries that are already technologically advanced and have already introduced emission reduction requirements. This is in line with Statistics Norway’s analyses of the effect on Norway of achieving the goals set out in the Climate Change Act (see Section 4).3 For developing countries, and particularly countries that today are dependent on coal energy, such as India, transition costs could be substantial. The fall in output owing to emission reductions must be weighed against the negative consequences of continued high emissions.
Chart 4.F Global GDP will be lower if actions are deferred4 In purchasing power equivalents. Index. 2015 = 100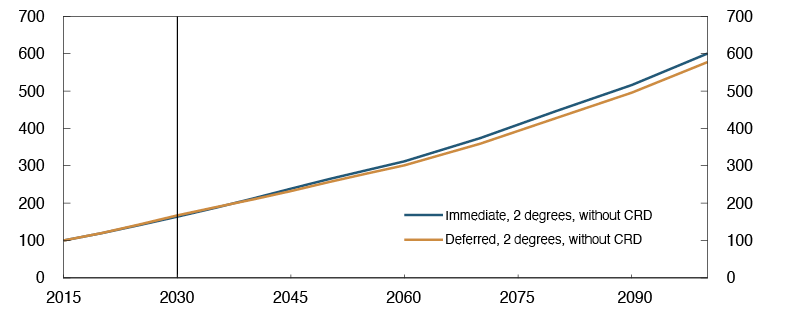
Source: NGFS climate scenarios
Climate change will result in lower economic growth
A higher average global temperature has an impact on global productivity. Warmer weather can make working outside more difficult and can reduce crop yields, particularly in areas where temperatures are already high. At the same time, climate change leads to increased risk of extreme weather events and higher sea levels. The economic consequences of such changes could have a substantial impact but are more difficult to estimate.
The economic impact of climate change is commonly estimated by applying so-called “damage functions”. This is a method of estimating the cost of replacing value lost as a result of undesirable developments. The method has some shortcomings. For example, it does not tend to capture low-probability but potentially high-impact events, such as a higher frequency of extreme weather events. The method nevertheless provides a starting-point for assessing the cost of climate change. It is also important to highlight the very wide differences across regions: It is estimated that the fall in GDP in some regions, particularly tropical areas, will be considerably larger than the global average.
The results found using “damage functions” to estimate the effect of climate change vary widely from one researcher to another. The estimated effect of a maximum temperature increase of 3˚ in 2100 varies from around a 3% lower level of global GDP in 2100 to a fall in global GDP of close to 15%. If we succeed in keeping the temperature increase below 2˚, the fall in GDP could be considerably reduced. The models that estimate the largest negative effect of climate change on GDP show that GDP could be close to 8% higher in 2100 if we succeed in limiting the rise in temperature to 2° rather than 3° (Chart 4.G).5
Chart 4.G GDP may be substantially higher if temperature rise is restrained6 Higher GDP if temperature rise is reduced from 3 degrees to 1.5 or 2 degrees, respectively. In purchasing power equivalents. KW damage function. In percentage points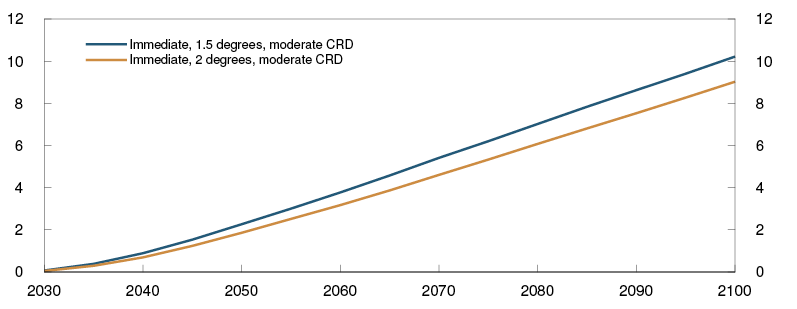
Source: NGFS climate scenarios
Along with the transition scenarios, the assessment of the economic consequences of climate change provides an opportunity to assess the costs and benefits of climate policy.
1 Period: 2015–2050. REMIND-MAgPIE is one of three models used for calculating NGFS climate scenarios. Different models will make somewhat different predictions. For more information, see NGFS (June 2020) «Guide to climate scenario analysis for central banks and supervisors».
2 Period: 2015–2100. REMIND-MAgPIE is one of three models used for calculating NGFS climate scenarios. Different models will make somewhat different predictions. For more information, see NGFS (June 2020) «Guide to climate scenario analysis for central banks and supervisors».
3 See Fæhn, T., K.R. Kaushal, H. Storrøsten, H. Yonezawa and B. Bye (2020) “Abating greenhouse gases in the Norwegian non-ETS sector by 50 per cent by 2030”. Reports 2020/23. Statistics Norway.
4 Period: 2015–2100. REMIND-MAgPIE is one of three models used for calculating NGFS climate scenarios. Different models will make somewhat different predictions. For more information, see NGFS (June 2020) «Guide to climate scenario analysis for central banks and supervisors».
5 Note that we refer here to the results of the damage function in Kalkuhl and Wenz. This is the damage function that estimates the largest economic impact of climate change of the alternatives represented in the NGFS scenarios. However, it is also the newest and most updated estimate (see NGFS Climate Scenario Database, Technical Documentation, June 2020, https://www.ngfs.net/sites/default/files/ngfs_climate_scenario_technical_documentation_final.pdf).
6 Period: 2030–2100. REMIND-MAgPIE is one of three models used for calculating NGFS climate scenarios. Different models will make somewhat different predictions. For more information, see NGFS (June 2020) «Guide to climate scenario analysis for central banks and supervisors».
5 Stress test – Bank solvency ahead and a trade-off in countercyclical capital buffer policy
In 2020 Q1, the countercyclical capital buffer rate was reduced to 1% to prevent tighter bank credit standards from amplifying the economic downturn. According to the Bank’s projections, banks will satisfy the capital requirements by an ample margin in the coming years and have the capacity to provide credit to support the recovery. At the same time, there is substantial uncertainty surrounding economic developments ahead. If losses prove to be higher, more banks will have to tighten credit to satisfy the requirements.
With a higher countercyclical capital buffer, banks are better equipped for future shocks. An illustrative exercise shows that the economic recovery may be delayed if the capital requirement is raised in bad times and banks need to tighten credit to satisfy higher capital requirements. The tightening effect of a higher buffer requirement may be less pronounced if, at the outset, banks satisfy the capital requirements by an ample margin or banks’ earnings are solid.
5.1 Bank solvency ahead
The profitability and solvency of large Norwegian banks ahead is projected based on the macroeconomic forecasts from Monetary Policy Report 3/20. The analysis focuses on a macro bank, which is a weighted average of nine large Norwegian banks.1 Uncertainty surrounding the outlook is very high. Should banks’ losses prove to be substantially higher than projected, solvency in the banking sector will be weaker than expected. A sensitivity analysis is performed to assess the significance of downside risks for banks’ profitability and solvency.
The projections from Monetary Policy Report 3/20 imply a gradual recovery in the Norwegian economy and a pick-up in GDP to pre-pandemic levels towards the end of 2021. Unemployment will decline but remain somewhat higher than prior to the pandemic to the end of the projection period.
Losses will likely decline ahead
Credit losses are important for banks’ profitability, and large credit losses can reduce capital ratios substantially. Over the past 20 years, banks’ credit losses have averaged at around 0.2% of lending. In the first three quarters of 2020, the macro bank’s annualised credit losses were around 0.6% of lending.
As activity picks up and credit risk declines further out in the projection period, losses on corporate exposures are projected to fall. The loss projections for the macro bank are based on risk of losses by individual firms assessed against the macro bank’s credit exposures (see Section 4 for a detailed description). Losses on exposures to the oil service industry are a main source of increased credit losses in the short term, while in the longer term a growing source of losses for the macro bank is expected to be exposures to industries particularly hard hit by the Covid-19 pandemic and measures to contain it. Losses on corporate exposures are expected to be about 1.4% in 2020 (Chart 5.1).
Chart 5.1 Most of the losses are on corporate exposures2 Credit losses as a share of gross lending to the sector. Percent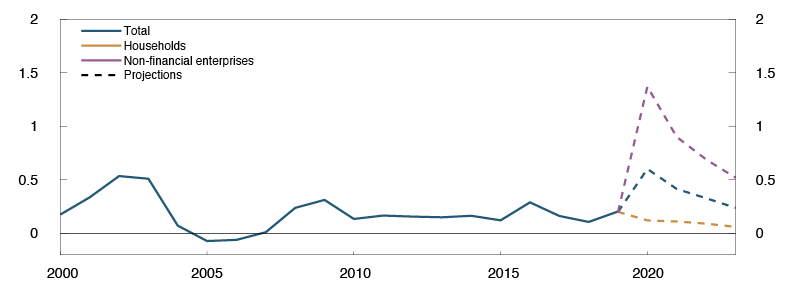
Sources: Banks’ quarterly reports, SNL / S&P MI and Norges Bank
Losses on loans to households are expected to be moderate through the projection period (Chart 5.1). Higher unemployment weighs on household income and reduces debt servicing capacity. The reduction in debt servicing capacity will be dampened by the fact that many households affected by furloughs and layoffs receive relatively generous unemployment benefits. In addition, many households have liquid buffers to draw on, at the same time as low interest rates reduce interest burdens. Overall, households’ debt servicing capacity is assessed as stable through the projection period. Residential mortgages account for the bulk of loans to households. Expected house price developments in Monetary Policy Report 3/2020 indicate that banks generally have sufficient collateral in the event of default. This also contributes to dampening losses on loans to households.
Debt growth remains stable through the projection period
Steadily rising house prices and low lending rates pull up household debt growth, while moderate wage growth pulls in the opposite direction. Overall, annual household debt growth remains stable at just over 4% through the projection period. With increased business investment and higher activity in the rest of the economy, annual corporate credit growth picks up to about 7% further out in the projection period. Higher credit risk results in somewhat higher risk weights in the near term.3 Owing to credit growth and the increase in risk weights, banks’ risk-weighted assets rise through the projection period, which reduces capital ratios.
The spread between the macro bank’s lending rate and funding rate will narrow somewhat from the current level of around 1.7% further out in the projection period. The average residential mortgage rate is projected to edge down ahead (see Monetary Policy Report 3/20), and low interest rates are expected to continue to put downward pressure on banks’ deposit rates. Falling residential mortgage rates and pressure on deposit rates contribute to a lower interest margin.
Dividend payouts have a substantial impact on banks’ loss-absorbing capacity. The Norwegian authorities have also discouraged paying out dividends until 1 January 2021, at the earliest.4 This is in line with the European Systemic Risk Board’s (ESRB) recommendation on the restriction of dividend distributions during the Covid-19 pandemic. This analysis is based on the assumption that banks that have not yet finalised the dividend policy for the financial year 2019 will not distribute dividends for that year. This implies that the macro bank’s dividend payout is about 10% of post-tax profits. This increases the Common Equity Tier 1 (CET1) capital ratio by 1.7 percentage points, compared with the level of capital adequacy that banks report. As a technical assumption, the dividend payout ratio is set at 50% in 2020.5 Thereafter, it also assumed that banks gradually increase dividend payouts to 60% of post-tax profits as the level of activity normalises further out in the projection period.
Banks satisfy the capital requirements by an ample margin
The macro bank is expected to have a total capital measure (capital requirement and margin above the capital requirement) of 15.3% at the end of 2020. The reduction of the countercyclical capital buffer (CCyB) in March has reduced the macro bank’s capital requirements, while the expected increase in the systemic risk buffer around year-end will pull in the opposite direction.6
The macro bank’s CET1 capital ratio is projected based on forecasts for profitability, dividend payouts and risk-weighted assets. High credit losses impair bank profitability in 2020, pushing down CET1 capital and CET1 ratios (Chart 5.2). The negative contribution from credit losses to CET1 ratios diminishes as the level of activity picks up. Higher credit risk exposure also results in higher risk weights, which amplifies the fall in the macro bank’s CET1 ratio. Net interest income makes a stable positive contribution to the CET1 ratio throughout the projection period. Positive dividend payouts make a steady negative contribution to banks’ CET1 ratios.
Chart 5.2 Losses weaken the macro bank’s CET1 ratio7 Change in the macro bank’s CET1 ratio and estimated contribution from different components. Percentage points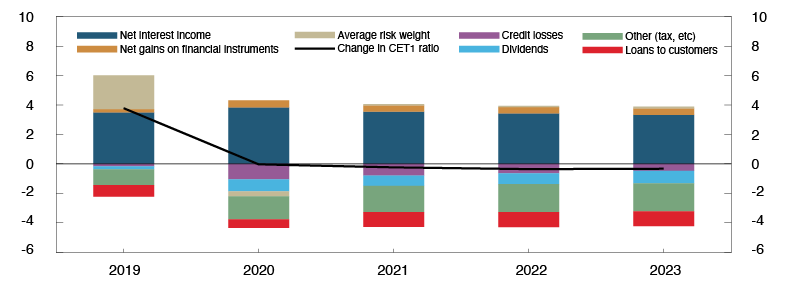
Sources: Banks’ quarterly reports, SNL / S&P MI and Norges Bank
The macro bank’s CET1 ratio is projected to be broadly unchanged in 2020 and then gradually decline further out in the projection period (Chart 5.3). The distance from the capital requirement will depend on the level of the CCyB. If we apply a technical assumption of a CCyB of 2.5%, the margin above the capital requirement will be around 2.6 percentage points in 2023. A margin above the capital requirement means that banks have the capacity to absorb losses and room to meet credit demand without breaching the capital requirements.
Chart 5.3 The macro bank satisfies the capital target by an ample margin throughout the projection period8 The macro bank’s CET1 ratio and weighted capital target under Pillars 1 and 2. Percent
Sources: Banks’ quarterly reports, Finanstilsynet (Financial Supervisory Authority of Norway), SNL / S&P MI and Norges Bank
Substantial uncertainty results in a risk of high losses
The Covid-19 pandemic is leading to substantial uncertainty about the outlook. Infection rates have risen again, both globally and in Norway, and a forceful tightening of containment measures may lead to a pronounced fall in activity. High household debt and high house prices could amplify a downturn, if another one occurs (see Section 1 for a detailed description of vulnerabilities in the Norwegian economy). Banks’ losses could then be substantially higher than assumed in the projections. A pronounced fall in rents and selling prices for commercial property could also result in high credit losses. A marked fall in global demand would pull down activity in the Norwegian economy. Reduced activity could increase bank’s credit losses. A fall in oil prices may increase bank losses through both a reduced activity level and higher risk of losses on loans to oil service companies (see Section 4 for an analysis of losses on corporate exposures).
Banks’ most important source of income, net interest income, may be reduced ahead. A weaker-than-projected pass-through from the policy rate to deposit rates could impair bank profitability. At the start of the pandemic, banks’ risk premiums on wholesale funding increased markedly. If financial turbulence were to recur and persist over an extended period, bank profitability could be impaired owing to higher financing costs.
High losses and reduced interest margins may impair banks’ capital ratios
We conduct two sensitivity analyses to assess the importance of downside risks for banks’ capital ratios. The first sensitivity analysis estimates the effect of interest margins that are 50 basis points lower than expected. Other assumptions are the same as in the analysis of expected developments, including a dividend payout ratio of just over 50%. As a result, the macro bank’s CET1 ratio is about 1 percentage point lower than expected for 2023 (Chart 5.4). Nevertheless, the macro bank satisfies the capital requirement by an ample margin. The effect of a lower interest margin on capital adequacy is sensitive to dividend assumptions. A high dividend payout ratio dampens the isolated effect, since large portions of the profits still do not accrue to capital, but it is the shareholders who are affected to a greater extent in the form of a lower dividend. If it is assumed instead that the macro bank does not pay any dividend, the isolated effect of a fall in interest margins will be a fall in the macro bank’s capital adequacy of about 2.3 percentage points over the projection period.
Chart 5.4 The macro bank must draw on capital buffers in the event of high losses9 The macro bank’s CET1 ratio and weighted capital target under Pillars 1 and 2. Percent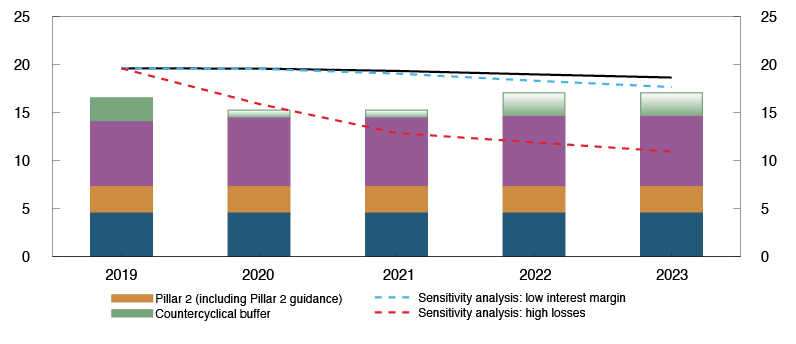
Sources: Banks’ quarterly reports, Finanstilsynet (Financial Supervisory Authority of Norway), SNL / S&P MI and Norges Bank
A forceful tightening of containment measures may lead to deeper downturn with a substantial reduction in the activity level, which in turn may increase banks’ losses markedly. The second sensitivity analysis estimates the effect of substantially higher-than-expected losses on loans and a significant loss on financial instruments. The losses assumed are based on an estimated relationship between financial imbalances and crisis depth.10 The level of financial imbalances is approximately unchanged since last year (see Monetary Policy Report 3/20), and the losses in the sensitivity analysis are therefore in line with the losses in last year’s stress test.11 This corresponds to annual credit losses as a share of gross lending of between 1.4% and 2.3%. The risk weights increase through the projection period. The value of the stock of equities is written down by 40% and fixed-income instruments by 5% in 2020. It is also assumed in the sensitivity analysis that the macro bank does not pay a dividend. Other assumptions are the same as in the analysis of expected developments.
Large losses on loans and securities substantially impair the macro bank’s profitability. Higher credit risk leads to higher risk weights. Higher losses and risk weights result in a sharp reduction in CET1 ratios (Chart 5.4). With high losses and a countercyclical capital buffer of 0%, the macro bank breaches the overall capital requirement by about 2.6 percentage points in 2023.
This analysis focuses on the macro bank’s solvency. At the same time, there may be considerable differences across banks. If banks are affected differently in a crisis, individual banks could breach the capital requirement and tighten credit standards even if the macro bank has adequate solvency. Some banks could be more severely affected in a crisis situation owing to substantial differences in banks’ corporate exposures.12
1 DNB Bank, SpareBank 1 SR-Bank, Sparebanken Vest, SpareBank 1 SMN, Sparebanken Sør, SpareBank 1 Østlandet, SpareBank 1 Nord-Norge, Sbanken and Sparebanken Møre.
2 Period: 2000–2023. Projections for 2020 Q3 – 2023 Q4 for the macro bank.
3 The risk weight projections are based on a relationship between credit losses and risk weights. For more detail, see Syversten, B. D., R. M. Johansen, Ø. A. Lind, H. Solheim and N. Stefano “The bank model and the stress test in Financial Stability Report 2015” Staff Memo 5/2015. Norges Bank.
4 See the Ministry of Finance’s website.
5 A 50% dividend payout ratio in 2020 implies tht 50% of after-tax profit in 2020 is distributed in 2021.
6 The projections are based on the existing capital framework and changes to the systemic risk buffer from year-end 2020 and 2022 (see the Ministry of Finance’s website). A systemic risk buffer of zero is assumed for foreign exposures. We use the reported institution-specific rate for the CCyB. For foreign exposures, this implies that the host state’s countercyclical capital buffer rate is used and that the Norwegian rate is used wherever the host state has not set its own rate. In the assessment of Finanstilsynet, banks should hold a margin in the form of CET1 capital over and above the total CET1 requirement. Pillar 2 guidance of 1% is therefore included in the macro bank’s total capital target to reflect Finanstilsynet’s capital targets for banks.
7 Period: 2019–2023. Projections for 2020 Q3 – 2023 Q4. The contributions are calculated using a linear approximation.
8 Period: 2019–2023. Projections for 2020 – 2023. Pillar 1 and Pillar 2 requirements for the banks in the stress test are weighted by their risk-weighted assets. Pillar 2 guidance of 1% is included in the Pillar 2 requirement. In estimating the opportunity set for the CCyB, we assume that advice to increase the CCyB will be issued in 2021 Q1 at the earliest. We further assume that earliest implementation of a higher CCyB will then be in 2022 Q1.
9 Period: 2019–2023. Projections for 2020 – 2023. Pillar 1 and Pillar 2 requirements for the banks in the stress test are weighted by their risk-weighted assets.
Pillar 2 guidance of 1% is included in the Pillar 2 requirement. In estimating the opportunity set for the CCyB, we assume that advice to increase the CCyB will be issued in 2021 Q1 at the earliest. We further assume that earliest implementation of a higher CCyB will then be in 2022 Q1.
10 See page 41 of Financial Stability Report 2019.
11 In the stress test in Financial Stability Report 2019 we used a simple rule for credit losses as a function of GDP developments (see page 42 of Financial Stability Report 2018).
12 See page 38 of Financial Stability Report 2019 for a further discussion.
5.2 Illustration of a trade-off in countercyclical capital buffer policy
We analyse how different paths for the countercyclical capital buffer (CCyB) can affect banks’ credit provision and macroeconomic developments. The analysis is performed in a framework where banks are influenced by, and in turn influence, economic developments.13 This is a stylised exercise intended to highlight key mechanisms and possible CCyB policy trade-offs in the wake of the Covid-19 pandemic.
The analysis begins with the current situation in the banking sector and wider economy following the Covid-19 outbreak. We assume that a stress scenario with high credit losses will occur in 2022. In the stress scenario, financial imbalances that have built up contribute to high losses in line with observations from previous financial crises. We start with the losses underlying the sensitivity analysis earlier in this chapter. In the stress scenario, the macro bank maintains its capital requirements by tightening credit standards, which amplifies the downturn.
In the analysis, we focus on how much the CcyB can dampen feedback effects from the banking sector, if any, on the real economy in the event of high credit losses. Therefore, in the stress scenario, no further extraordinary fiscal or monetary policy measures are assumed in the new hypothetical downturn in 2022. As a technical assumption, the policy rate is kept at zero.
We examine the effect of two stylised alternatives for the CcyB:
- The CCyB rate is kept at 1%, but is set at zero when the stress scenario arises. The buffer is kept at zero for the remainder of the analysis period, which extends to 2023. (Alternative 1)
- It is announced in 2021 Q1 that the CCyB rate will be raised to 2.5% from Q1 2022, but is set at zero when the stress scenario arises. The buffer is kept at zero for the remainder of the analysis period. (Alternative 2)
Macroeconomic developments in these two alternatives are compared with the effect of an unchanged buffer throughout the analysis period (Chart 5.5).
An increase in the capital requirement results in a more robust banking sector, but a slower economic recovery
In the pre-stress scenario, we start with macroeconomic developments described in Monetary Policy Report 3/20. A higher CCyB in Alternative 2 will make banks more resilient to a situation with high loan losses and financial stress than in Alternative 1, where the buffer remain at today’s level (Chart 5.5) By ensuring that banks have more capital to draw on, a higher buffer rate may counteract a severe tightening of bank lending in the event of a downturn. Furthermore, higher capital ratios reduce the risk facing banks’ debt investors. This could help reduce banks’ financing costs in a situation with high losses. Lower financing costs will improve profitability and thus improve loss absorbency capacity.
Chart 5.5 Paths for the countercyclical capital buffer (CCyB)14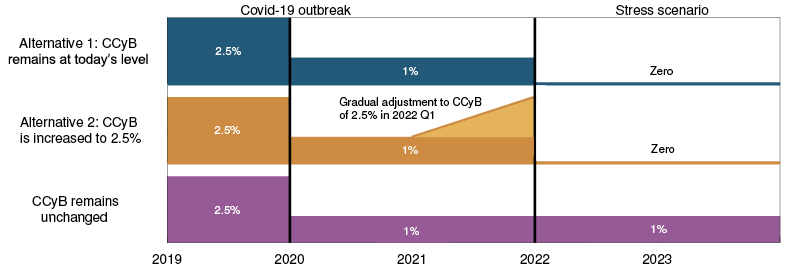
Sources: Ministry of Finance and Norges Bank
In this stylised exercise, the macro bank will gradually adjust to a higher requirement in Alternative 2 in the pre-stress scenario (Chart 5.5), but there is considerable uncertainty regarding how banks would actually have adjusted to such an increase. Banks’ distance from the capital requirements may be good at the outset, owing to solid earnings and a low dividend payout ratio, or because they already expect an increase in the buffer rate. In that case, increased requirements may have little of a tightening effect on credit provision. In the exercise, we assume that banks continue to maintain a margin above the requirements to take into account that a recovery from a downturn is shrouded in considerable uncertainty. This means that banks will tighten credit and raise lending rates (Chart 5.6). Higher credit risk and risk weights on loans to firms make it more advantageous to limit lending to firms rather than to households. Retaining earnings will in isolation dampen the need for tighter credit standards Since we assume a constant margin above the capital requirements, the credit tightening in Alternative 2 is in the upper range of what may be expected from an increase in the buffer rate.
Chart 5.6 Banks tighten credit15 Four-quarter growth in total credit for mainland Norway in two alternative paths for the CCyB and with an unchanged CCyB. Moving average. Percent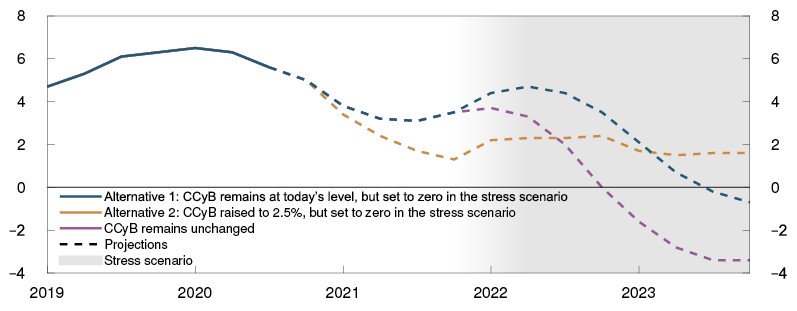
Sources: Statistics Norway and Norges Bank
In Alternative 2, the tightening of the macro bank’s provision of credit will be result in lower output through weaker consumption and investment (Chart 5.7). It then takes longer for firms’ earnings to normalise. A range of households and firms will find it difficult to increase earnings and build up financial buffers, so that the real economy is more vulnerable in the pre-stress scenario.
Banks tighten lending in the stress scenario and deepen the crisis
In the stress scenario, large losses on loans and securities result in negative results for the macro bank. Combined with higher risk weights, the macro bank suffers a large negative contribution to capital ratios.
Banks may have incentives to maintain their capital ratios despite the fact that regulation allows a breach of the overall buffer requirements in the event of high losses. For example, banks will probably seek to avoid restrictions by the authorities and negative investor attention. Banks that breach the buffer requirement risk facing higher financing costs or reduced access to financing because investors will require a higher risk premium or may not want to provide financing.
We assume that the macro bank adapts to weaker earnings by tightening credit provision and reducing dividends. In periods of large loan losses, access to new Tier 1 capital through issuance will often be limited or costly for the bank’s owners.
If the CCyB requirement remains unchanged in the stress scenario, the macro bank will substantially tighten credit provision in order to satisfy the capital requirements (Chart 5.6).16 Higher lending rates and stricter collateral requirements contribute to lower credit growth, and output in the economy falls on the back of weaker investment and consumption (Chart 5.7). Credit demand also falls, because firms’ and households’ willingness to invest is reduced.
Reducing the CCyB dampens the downturn
In Alternatives 1 and 2, the authorities set the CcyB at zero in the stress scenario (Chart 5.5). By using the freed-up buffer capital, banks can maintain credit provision to a greater extent. This also dampens credit losses, since the downturn is not amplified to the same extent (Chart 5.7).
Chart 5.7 CCyB dampens the downturn17 Output gap in two alternative paths for the CCyB and with an unchanged CCyB. Percent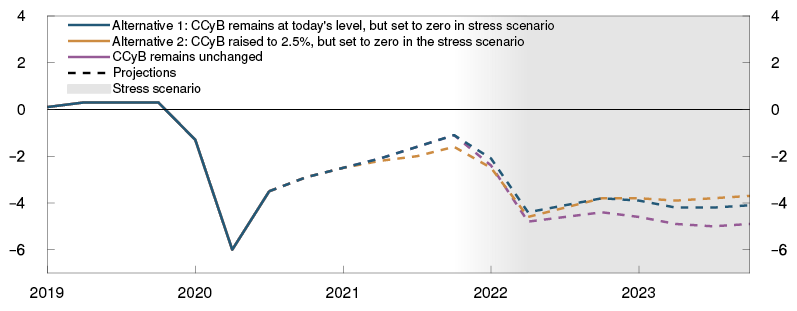
Source: Norges Bank
In Alternative 1, the capital requirement for the macro bank is reduced by 1 percentage point and the bank quickly adapts its capital ratios to the lower capital requirement. The losses erode the macro bank’s capital adequacy, but the macro bank’s tightening is substantially smaller than in the scenario where the buffer remains unchanged (Chart 5.6).
In Alternative 2, the macro bank’s CcyB rate is higher when the stress scenario begins, and its capital requirement is reduced by a further 1.5 percentage points compared with Alternative 1 (Chart 5.5). Credit growth remains positive owing to the greater easing (Chart 5.6).
CCyB policy trade-off in a downturn
The analysis shows a CCyB policy trade-off between a banking sector that better supports an expected recovery after a downturn (Alternative 1) and a banking sector that is better poised to face a potential sharp increase in losses on banks’ loans and financial instruments further out (Alternative 2). This trade-off may be relevant in the wake of the Covid-19 pandemic.
To what extent an increase in the buffer requirement affects banks’ credit standards and the Norwegian economy in a recovery is uncertain. The analysis suggests that the recovery will take longer if the CCyB rate is raised markedly. A more gradual increase in the buffer requirement will likely dampen the potential tightening effect of higher capital requirements, but it will also take longer to ensure that banks have capital to draw on in the event of high losses. If banks have good distance from the capital requirements and reduce it when the buffer rate is raised, the buffer can be increased faster without a need for banks to tighten credit standards.
13 A detailed description of the stress testing framework is provided in Andersen, H., K. Gerdrup, R.M. Johansen and T. Krogh (2019) “A macroprudential stress testing framework”. Staff Memo 1/2019. Norges Bank.
14 Period: 2019 Q1 – 2023 Q4. Projections for 2020 Q4 – 2023 Q4.
15 Period: 2019 Q1 – 2023 Q4. Projections for 2020 Q3 – 2021 Q4 based on expected developments in Monetary Policy Report 3/20. Total credit for mainland Norway is the sum of C2 households and C3 non-financial enterprises in mainland Norway. Change in stock measured at quarter-end. Moving average of growth in the past four quarters.
16 Effect on the economy of lower capital requirements is uncertain, but a number of international studies find significant, positive effects of countercyclical capital requirements on lending and the real economy, see Jiménez, G., S. Ongena, J.-L. Peydró and J. Saurina (2017) “Macroprudential Policy, Countercyclical Bank Capital Buffers, and Credit Supply: Evidence from the Spanish Dynamic Provisioning Experiments”. Journal of Political Economy, 125 (6), December, pages 2126–2177 and Imbierowicz B., J. Kragh and J. Rangvid (2018) “Time-Varying Capital Requirements and Disclosure Rules: Effects on Capitalization and Lending Decisions”. Journal of money, credit and banking, 50 (4), May, pages 573–602. Arbatli-Saxegaard, E.C.and R.E. Juelsrud (2020) “Countercyclical capital requirement reductions, state dependence and macroeconomic outcomes”. Working Paper 9/2020. Norges Bank, studies the effect of lower capital requirements during the phasing in of Basel II in Norway and finds that banks with a larger reduction in capital requirements increased lending more.
17 Period: 2019 Q1 – 2023 Q4. 2019 Q1 – 2021 Q4 based on Monetary Policy Report 3/20. Output gap measures the percentage difference between mainland GDP and estimated potential mainland GDP.
Annex
National measures to dampen the crisis
The Covid-19 outbreak and measures to contain it have had serious consequences for the Norwegian economy. The Norwegian authorities have taken a number of actions to cushion the impact and promote economic stability, including:
- Reduced policy rate: Norges Bank lowered the policy rate in three steps. First, from 1.5% to 1.0% on 13 March, then to 0.25% on 20 March and finally to 0% on 7 May. The intention was to dampen the downturn in the Norwegian economy, mitigate the risk of more persistent effects on output and employment and reduce the interest burden on households and firms. Low interest rates will fuel a faster pick-up in activity.
- Liquidity measures: Norges Bank has implemented a number of measures to improve market liquidity and ensure that the lower policy rate passes through to money market rates (see Section 2).
- Since 13 March, banks have been offered fully allotted extraordinary F-loans, with maturities of one week up to 12 months. The number of maturities and frequency of the loans has since been reduced, while the interest rate on the loans has risen. Norges Bank will offer such loans as long as is necessary.
- Temporary changes to the guidelines for collateral for loans from Norges Bank were announced on 18 March. The purpose is to increase the potential use of the Bank’s extraordinary lending facility (F-loans). Norges Bank has announced that the easing of collateral requirements will be reversed in part from 2021.
- On 19 March, Norges Bank and a number of other central banks announced the establishment of temporary USD liquidity arrangements (swap lines) with the Federal Reserve. The reason was heavy demand for USD in global financial markets and thus high premiums on USD funding. The arrangement has been extended to the end of March 2021.
- Extraordinary NOK purchases totalling NOK 3.5bn were made in the foreign exchange market in March in order to support a well-functioning NOK market.
- Reduction in the countercyclical capital buffer: On the advice of Norges Bank, the Ministry of Finance decided on 13 March to reduce the countercyclical capital buffer rate for banks from 2.5% to 1%, effective immediately. The purpose was to prevent tighter bank lending standards from amplifying a downturn in the Norwegian economy.
- Increased flexibility quotas in the regulation on residential mortgage loans: On 23 March, the Ministry of Finance decided to increase the flexibility quotas from 8% of the lending volume each quarter in Oslo and 10% in the rest of Norway to 20% in both Oslo and the rest of Norway (see "Regulation of financial institutions’ credit standards"). This measure lasted until the end of September. The purpose was to strengthen banks’ ability to help their customers through a difficult period.
- Easing of the consumer credit regulation: On 30 April, the Ministry of Finance decided to grant exemptions from the requirements in the consumer credit regulation for loans to persons receiving advance payments of unemployment benefits from the Norwegian Labour and Welfare Administration (NAV). The measure was in effect until the end of September and was intended to support banks’ ability to grant short-term loans to individuals in a difficult situation.
- Substantial fiscal policy measures have been implemented since mid-March. The stimulus packages include the loan guarantee scheme and the compensation scheme for businesses (see "How have government measures during the Covid-19 pandemic affected the risk of credit losses in the Norwegian banking sector?"). The measures also include increased allocations in other areas, temporary relaxation of furloughing rules and temporary changes in direct and indirect tax rates, rules and deadlines for submitting reports to government authorities. The purpose of these measures was to protect businesses and jobs (see the Government’s overview of measures1).
1 See Government.no: “Timeline: News from Norwegian Ministries about the Coronavirus disease Covid-19”.
The Norwegian banking sector
See also Norway´s financial system 2020 for a description of the Norwegian financial system.