Business cycles, crises and public finances – will governments be able to honour their debts?
Lecture by Governor Svein Gjedrem at the Norwegian School of Economics and Business Administration on 24 September 2010.
The text below may differ from the actual presentation. This speech does not contain assessments of the economic situation or current interest rate setting.
Charts in pdf-format (228 kB)
1. Imbalances and financial crisis
The financial crisis had its origins in an abundant supply of credit, market participants who took steadily higher risk and a lack of oversight on the part of banks, companies and authorities.
The global economy entered a severe downturn. The acute crisis in financial markets has been succeeded by substantial labour market and fiscal imbalances in countries around us. Severe shortcomings in the management of public finances in several advanced economies have also been revealed.
How public finances are managed in these countries will also be important to Norway.
In the period from 1993 to 2008, global output expanded by more than 60 per cent, or an annual rate of just under 4 per cent. At the same time, inflation remained low.
This period in the Norwegian economy could be described as two golden decades.
But imbalances were building up in Europe and North America. With strong income growth and easy access to loans, the number and size of homes purchased by households grew. House prices surged in many countries. The building industry and the financial sector expanded more than other segments of the economy.
Many governments allowed their expenditure to rise in pace with higher tax revenues. Like the banks, many governments also moved some expenditure off the balance sheet, through public private partnership (PPP) agreements, for example.
The bubble was allowed to expand. Households borrowed too much, house prices were too high, banks and the building industry were too big and government expenditure and debt grew too rapidly. The imbalances gradually surfaced. The problems arose initially in the US housing market and spread in earnest when money and capital markets abruptly dried up in September 2008.
Once the crisis had become a reality, the authorities responded rapidly. To begin with, they provided support where the financial markets had failed, by providing guarantees, offering liquidity and funding and purchasing securities. Central bank key rates were aggressively cut. The crisis in the 1930s had shown that the cost of failing to implement such measures was very high.
Chart: Sovereign debt to GDP in the G7
The rescue packages moved private debt onto government and central bank balance sheets. In addition, tax revenues declined and social security expenditure increased. In the next phase, governments had to counteract falling corporate and household demand for goods and services by increasing public consumption and investment. Many countries entered the crisis with deficits and a relatively high level of debt. Public debt in the major advanced economies is now as high, as a share of GDP, as it was after World War II, when high military spending had been financed by borrowing.
Chart: Government bond yields
In late autumn 2009, fears arose in financial markets that some countries would be unable to pay their debts. The unrest was triggered when Greece announced that its public finances were in poor shape. Government bond yields rose markedly in Greece, Spain, Portugal and subsequently Ireland compared with German bond yields. Sovereign credit ratings were downgraded and the price of insurance against sovereign debt default soared.
Chart: Credit risk on sovereign debt
Sovereign debt has been regarded as the safest form of investment in advanced economies since World War II. Until recently, sovereign risk premium differentials in Europe have been small. This has changed. It now costs more to insure against a sovereign debt default by Spain and Italy than to insure against default by Latin American countries such as Brazil and Mexico.
Chart: Bond yields
States in southern Europe also have to pay higher interest rates than sound private borrowers in the euro area. There are also examples of states paying higher interest rates than the soundest of private borrowers in the same country.
In spring 2010, Greece encountered acute payment problems. On 2 May, agreement was reached between Greece, the IMF and the other euro area countries on a three-year loan package with a maximum limit of EUR 110 billion. The agreement included a comprehensive IMF adjustment program. Greece has borrowed approximately EUR 30 billion from the IMF and the euro area countries since May.
Other European countries with weak public finances were also being scrutinised and there was a risk of contagion to the banking system in Europe, which was behind many of the loans. On 10 May the EU and the European Central Bank announced extensive support measures for EU countries, including the European Financial Stability Facility, which can provide loans to countries in difficulty up to a total limit of EUR 500 billion, with additional loans of up to EUR 250 billion made available by the IMF through its program facilities. Countries may draw on these loan facilities provided that taxes are increased and expenditure cut so as to enable the country to gradually become self-supporting. At the same time, the European Central Bank began to buy government bonds, which had become difficult to trade on the market, enabling markets and monetary policy to function more effectively.
Economic history shows that periods of surging corporate and household debt and sharply rising property prices often precede banking crises. The fates of banks and states are inextricably linked. Banking crises usually lead to fiscal crises. Similarly, weak government finances will undermine banks’ financial position. (1)
Crises are costly. A historical study of financial crises shows that annual economic growth has been about 1 per cent lower in the decade following a crisis than in the decade preceding it. (2) Unemployment also typically remains higher throughout the decade following the crisis.
We should perhaps not be surprised by these results. Since the activity level is usually high and unemployment low just before a crisis, we cannot expect economic growth to be as strong after the crisis as it was in the preceding period.
Crises can have their advantages. In Norway, and in the other Nordic countries, the crisis years around 1990 brought changes in regulation, more open markets and the restructuring of public and private enterprises. In the crisis, the foundations were laid for the two golden decades that followed for the Norwegian economy.
2. Why should governments repay debt?
Governments borrow and save in order to smooth income and expenditure over time. Sovereign debt can be denominated in domestic or foreign currency, and can be issued domestically or abroad. The Norwegian government relied on foreign funding in the 1970s to develop Norway’s oil industry and welfare state. Since that time, North Sea oil revenues have been substantial, and today the Norwegian government invests its large surpluses in equities and bonds in other countries.
Sovereign debt differs from private debt. Private debt is protected by the law in the country where the loan is contracted. The creditor can recover debt by legal means in the event of default. Similar mechanisms do not in principle exist for sovereign debt. There is no supranational body that can recover government debt when a government defaults. (3)
If a government does not consider itself to be legally obliged to repay its creditor, it might be tempting to default. In the economic literature the question has therefore been raised: Why should a government repay debt? This question begs another: If governments can turn their backs on commitments, why do investors lend them money?
We observe that most countries choose to repay debt. This must mean that there are costs associated with default.
Even if the creditor has no legal recourse for collecting debt, there are forms of costs that can be imposed on the debtor.
First, creditors can refrain from providing new loans to a government in default. When a government is in debt negotiations, it is naturally difficult to raise new capital. But recent history shows that it does not take long before creditors are again willing to provide loans.
Second, borrowing costs may increase. Funding rates rise when fears of sovereign default spread through the markets. For 30 countries that have defaulted on sovereign debt in recent decades, the interest rate on government bonds was 4 percentage points higher than normal one year after default and 2.5 percentage points higher the second year. (4) Thereafter, interest rates fell rapidly to more normal levels.
Third, a creditor can impose sanctions, such as trade blockades, seizure of foreign assets or choose even more severe measures.
At the end of the 19th century, England took control of Egypt’s government finances because of the country’s payment problems. Egypt had raised a number of loans to finance the construction of the Suez Canal. The administration established by the British government restored order to Egypt’s government finances and remained in the country for 40 years.
It is likely that economic incentives also play a part in today’s armed conflicts, but such instruments are not used to recover sovereign debt. The most effective weapon available to a creditor today is probably to take legal action to seize the debtor’s foreign assets. In the past 30 years, creditors have won several such cases.
Several studies of sovereign debt crises over the past century have shown that creditors’ actions have not resulted in particularly high costs for the debtor state. A state soon regains access to capital markets after default and borrowing costs fall back fairly rapidly.
If the costs of default are transient, defaulting could be a profitable proposition. When a loan matures, it may therefore be tempting for a government to renege on its promise to repay the debt. In economic policy this is known as a time-inconsistency problem. It can be profitable to make lofty promises, but turn your back on them once you have cashed in the benefits.
Why do countries not renege on commitments in stable times? We observe that they do honour their commitments, but the economic literature does not provide us with a good explanation for why this is the case. Countries want to preserve a good reputation. Governments that default do so in adverse times, but only after sharp fiscal retrenchment to avoid that fate.
3. Countries default more frequently than we believe
Chart: Sovereign debt default
It is no new phenomenon that some countries live beyond their means and fail to settle the bill. History shows that many countries have defaulted on sovereign debts. This has occurred during emerging phases. From 1500 to 1900, Spain defaulted on its sovereign debt 14 times. (5) France defaulted nine times in the same period, while the states that later became Germany defaulted six times. England also defaulted once, but as far back as in 1594.
The Norwegian government has not always managed to settle its debts, but by little fault of its own as Norway was left with considerable government debt after the secession from Denmark in 1814. The government had no Treasury or liquid assets. Attempts to increase tax revenues failed. Moreover, Norway had little creditworthiness. At the beginning of 1816 the government was not in a position to service its debt. After more than four years, the debt was negotiated down from 6 to 3 million speciedaler. The entire principal was to be repaid over a ten-year period. In January 1820, Norway concluded a loan contract with the finance company Benecke Brothers in Berlin. (6) It was positive for a young nation to be able to borrow, but the terms of the loan were generally perceived as being poor, and the loan was popularly referred to as “tyvlånet” (highway robbery). All government property and current customs revenues were required as collateral. After a period, the “tyvlån” was replaced by a loan on more favourable terms.
After the Great Depression in the 1930s, many European states struggled with debt problems. Government debt was written down in Austria, Greece, Hungary, Poland, Romania and Turkey in the 1930s and 1940s. Germany was not able to pay war reparations after World War I.
Since World War II sovereign defaults have only occurred in developing countries and emerging economies, particularly in the period between 1980 and 2000. Many of the countries pursued a policy that resulted in high inflation. It became increasingly difficult for these countries to raise loans in domestic currency, particularly loans with long maturities. Attempts were made to keep inflation and the magnitude of foreign debt in check by pegging the domestic currency to the US dollar. But fiscal mismanagement often triggered currency crises, a fall in the value of domestic currency and a surge in foreign debt. This is when the government gave up and stopped servicing debt.
The degree of losses incurred by creditors in connection with sovereign default has varied. The most recent default episodes have left creditors with losses ranging between an estimated 30 and 75 per cent. (7) These experiences will probably influence interest rates on sovereign loans when a country’s debt-servicing capacity is in question.
A forum was established, the Paris Club, which meets regularly to find solutions to bilateral debt problems. The Paris Club consists of 19 creditor governments, including Norway. A solution is contingent on the implementation of reforms in the debtor country as part of an adjustment program supported by the International Monetary Fund (IMF). Since 1956, the Paris Club has negotiated 417 debt reduction agreements with 87 countries. The Paris Club primarily negotiates debt relief with countries - often poor countries - that do not have access to traditional international funding markets.
There is no supranational body for debt negotiations for countries that have borrowed in international capital markets. Some years ago, the IMF attempted to draw up a regulatory framework for governments and creditors, but did not receive the necessary support from member countries. The IMF’s work has, however, led to more frequent inclusion of clauses in international loan agreements that facilitate constructive debt negotiations.(8)
In our economic system, the bankruptcy system is a useful instrument. It enables businesses to put earlier mistakes behind them and reemploy real capital and labour. Debt arrangements for governments can play a similar role and counteract downward spirals.
Chart: Inflation
There are two forms of debt default. Breach of contract is one form where the borrower fails to honour the contractual obligations, as illustrated in the example here. For debt denominated in domestic currency, the state can also default by pursuing an inflationary economic policy, reducing the real value of the loan. Over the past 100 years inflation in Norway surged during the two world wars and during the Korean War. The last period of soaring inflation was in the 1970s and 1980s, which resulted in a sharp fall in the real value of the bonds issued in the 1950s and 1960s.
I would also like to cite a curious example from our own monetary history (9):
The Norwegian state took advantage of a fall in the value of money when it was to redeem government bonds issued between 1896 and 1909. France was one of the primary bondholders. The bonds were issued during the gold standard period when the value of the krone was directly linked to the value of gold. The lenders were promised repayment in “monnaie d’or” (gold coins). When the bonds fell due, the Norwegian government insisted on repaying the debt using banknotes that had lost a substantial share of their value. France took legal action. The case was brought before the Norwegian Supreme Court in 1962, and the Court invoked a law from 1923 stipulating that the gold clause, i.e. repayment in gold coins, did not apply when the redemption obligation was suspended, which it was definitively in 1931. The Supreme Court also invoked “society’s vital interests” in its argumentation behind the decision. The cost of repaying the gold coins that were borrowed 60 years earlier would have been excessively high for Norwegian state.
The ruling is probably an example of the limited benefit to be gained by a creditor when such a case is tried by the debtor country’s legal apparatus.
For Nicolai Rygg, governor of Norges Bank from 1920 to 1946, the value of money was a moral issue. The aim of the policy of gold parity in the 1920s was to bring the krone back to the value prevailing before World War I:
“Our monetary regime is enshrined in law. (…) The regime is anchored in our legal system, which we cannot break down. Inherent therein is a moral obligation to restore the monetary system to its previous condition. (…) This is a question of fundamental importance to the nation through time.
The difficulties that arise in connection with the transition to normal, legal conditions are transient. No one can close his eyes to the fact they are very serious. But the life of the people is eternal and this involves a decision of significance across generations.” (10)
4. What is a sustainable sovereign debt load?
A debt level that is high in one country can be sustainable for another. When Norway experienced payment difficulties in 1816, government debt stood at 6 million speciedaler, or about NOK 700 million at today’s value of the krone, and was probably considerably smaller than annual GDP in the country at that time.
Germany met its tolerance threshold after World War I. The Treaty of Versailles obliged Germany to pay war reparations to the allies after the war. The total sum of reparations was estimated at twice Germany’s national income at the time. The annual payments, which were linked to export revenues, came to 5-6 per cent of Germany’s national product. The economist John Maynard Keynes argued that it was impossible for the country to make these payments and that the reparations demanded would have fatal consequences, not only for Germany, but for all of Europe.
“I believe that the campaign for securing out of Germany the general costs of the war was one of the most serious acts of political unwisdom for which our statesmen have ever been responsible.” (11)
The countries that have defaulted on debt in the past two decades have systematically experienced problems when debt has reached around 50 per cent of GDP. Today, average sovereign debt for advanced economies is around 80 per cent of GDP. Japan’s gross public debt – one of the world’s wealthiest nations – is almost 220 per cent of GDP, but given its considerable assets net debt is about 110 per cent of GDP.(12)
Sustainability of government debt is to a large extent determined by a country’s governance system, tax system and growth capacity. Developed democracies with sound public financial management and solid institutions have a considerable capacity to collect taxes to service debt. In developing countries and emerging economies, where tax collection and institutions are weaker, debt tolerance is lower. In addition, borrowing costs tend to be higher. On the other hand, they have greater scope for growing out of high debt.
Chart: Debt at the time of default
When the euro area was established, the Growth and Stability Pact stipulated that a country’s budget deficit should not exceed 3 per cent of GDP and that debt should not exceed 60 per cent of GDP. When France and Germany were among the first countries to breech the criteria in 2003, the rules of the game were changed. This influenced the discipline of the other member states. It would almost seem that several countries viewed the limits as a floor rather than a ceiling.
The crisis set in motion a dangerous debt dynamic, which can be illustrated by the following simple formula (13):
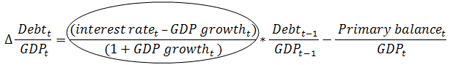
where changes in public debt (on the left) are determined by the variables on the right: the interest rate on the debt, nominal economic growth in the country and the budget surplus or deficit excluding interest expenses, referred to as the primary balance.
If the changes in debt (left side) are set at zero, the right side of the formula yields various conditions that must be met to achieve stable sovereign debt. If the interest rate is equal to GDP growth, the debt will be stable when the government budget excluding interest expenses is in balance. If the interest rate is higher than the rate of growth, the debt burden will be heavier and the government budget will have to be settled in surplus before interest payments. If GDP growth is higher than the interest rate, the country’s economy can grow out of its problems and sovereign debt will remain stable even with some degree of fiscal deficit.
The formula also provides an answer to the question of why sovereign debt rose so rapidly in many countries. The term indicated by the circle is known as the snowball effect and depends on the difference between the interest rate level and GDP growth. Low growth or a fall in GDP results in a rising debt burden. When debt approaches an unsustainable level, investors will demand higher compensation for new loans and interest rates on loans will rise, hence the snowball effect.
Chart: Fiscal deficit and Public debt
Large deficits have a direct impact on sovereign debt. From 2007 to 2010, fiscal deficits in euro area countries rose from 0.6 per cent of GDP to 6.6 per cent. In the same period, public debt rose from 66 per cent of GDP to 85 per cent, and there are prospects that debt will approach 100 per cent of GDP in the next few years. Fiscal deficits in the UK and the US will reach 11-12 per cent this year and public debt is rising rapidly to high levels.
In order to rein in this development, fiscal tightening must be implemented and government budgets must be brought into surplus. This can be particularly costly in downturns. Several European countries have recently announced tax increases and cuts in expenditure. This typically involves raising the retirement age, broad-based wage reductions and lower welfare spending. These sharp measures may well boost growth capacity in these countries in the long term, but in the short run they will result in lower demand for goods and services and probably lower activity. Since several countries are tightening fiscal policy at the same time, export markets may also shrink. However, reduced fiscal deficits will hopefully restore confidence in economic policy so that growth in household and corporate consumption and investment resumes.
Chart: Sweden and Finland in the 1990s
There are examples of heavily indebted countries that have stopped the snowballing process before it led to default. The banking crisis in the early 1990s left Sweden with a substantial fiscal deficit. Lower tax revenues, increased social security expenditure and rescue measures for banks brought the deficit close to 11 per cent of GDP in 1993. Sweden’s public debt rose to 80 per cent of GDP. Fiscal consolidation continued for several years and resulted in stabilisation of government debt and provided room for its eventual reduction. The UK and Finland conducted a similar process in the 1990s. The Nordic countries in crisis at that time learned their lesson and have kept public finances in order during this crisis.
The euro area countries are in a special position. They have a common currency and a common monetary policy. Governments raise loans in the area’s single currency. Monetary policy – management of the euro’s value – is a common policy, conducted by the European Central Bank with a view to maintaining price stability. The countries have common guidelines for fiscal policy, but as mentioned earlier, these have not been followed. On the contrary, lack of discipline has been inherent in the system. Confidence in monetary policy and general economic policy has been strong in the area and thanks to this confidence – and as free riders – countries have been able to raise loans at low interest rates. A committee headed by Herman Van Rompuey, President of the European Council, is assessing how coordination and monitoring of EU economic policy in the various countries can be improved. The goal is to reduce deficits and at the same time ensure that conditions are favourable for future economic growth.
Without stretching the comparison too far, management of public finances in euro area countries can perhaps be compared to the management of Norwegian counties and municipalities. Under the law, they cannot go bankrupt. The government stands behind them. They have access to funding markets and can make use of the Norwegian central government’s creditworthiness. There is an obvious temptation here to borrow too much – to act as free riders – that is reminiscent of the temptation faced by the euro area states. But the Norwegian system is balanced. If local government administrations in Norway borrow too much, the central government intervenes. Municipalities and counties with a budget imbalance must apply to the Ministry of Local Government and Regional Development for approval when decisions are made on borrowing or long-term leasing agreements. The county governor, as representative of the state, supervises the municipalities. About 10 per cent of Norwegian municipalities are currently in this position and are on the Norwegian ROBEK list. (14)
A firm hand such as this is lacking in the euro area.
5. The Norwegian government’s long-term obligations
The Norwegian government’s financial position contrasts sharply with developments abroad. While government debt in Europe is approaching 100 per cent of GDP, the Norwegian government has net financial assets exceeding 100 per cent of GDP. We have been lucky because we discovered oil and gas. The Norwegian state with its large territory – or should we say territorial waters – has been adept at reaping the economic rent from petroleum activities and managed to set aside a large portion of our petroleum revenues.
Although the Norwegian government is not in a net debt position, it does have obligations under welfare schemes. These are not liabilities in the same legal sense as debt, but nor are they schemes that can easily be changed. The Supreme Court has established that future national insurance entitlements are protected, in principle, by Article 97 of the Norwegian Constitution prohibiting legislation with retroactive effect, but that changes to national insurance entitlements will only be in contravention of the Constitution if they are “clearly unreasonable or unjust”. (15) This gives the political authorities the freedom to adjust their obligations. Public occupational pension schemes seem to enjoy slightly stronger constitutional protection than national insurance pensions, but the Supreme Court has repeatedly stressed the authorities’ need for freedom of action when it comes to making changes to pension schemes.
The Norwegian national insurance scheme is a pay-as-you-go system. This means that a given year’s pension payments from the scheme are covered by government budget revenues that year. When the national insurance scheme was introduced in 1967, a fund was established to provide for an expected reduction in private saving. However, pensions were still included in the central government budget at an early stage and financed by current tax revenues. Transfers to the National Insurance Fund were soon discontinued.
Nevertheless, confidence in the pension system has actually remained intact, reflected in a low level of household saving, primarily through home investment. Perhaps there is some element of miscalculation here. A fall in value may occur if many homeowners free up housing capital to cushion old age.
Chart: Government Pension Fund Global
It was only when transfers to the Petroleum Fund were introduced in 1996 that funds were accumulated that could also be used to cover future pension payments. The Fund, which has since changed its name to the Government Pension Fund Global (GPFG), has grown to almost NOK 3 000 billion. Its rapid growth was neither expected nor planned and was due to the sharp improvement in government finances during the economic upturn from the late 1990s. After the turn of the millennium, the rise in oil prices also provided a boost.
The size of the Fund is now equivalent to approximately 18 months’ mainland GDP and may double in the next five to ten years. Total public expenditure is equivalent to less than half of total GDP. If the government spends 4 per cent of the Fund annually – the expected real return – this will finance close to 20 per cent of public expenditure ten years ahead. The return on the Fund will by then have become such an important source of funding that it is difficult to imagine that the government authorities would find any sound arguments for drawing on the accumulated capital. It is also a flow of revenues that does not have an adverse effect on private sector production capacity, unlike taxes.
Chart: Pension obligations and the Government Pension Fund
However, only a share of future pension payments will be matched by revenues from the Government Pension Fund. The Government Pension Fund is estimated to cover around half of the national insurance scheme’s retirement and disability pension obligations.(16)
Chart: Pension costs and expected fund returns
Over the next few years, the return on the Pension Fund is expected to rise roughly in line with government expenditure on retirement pensions through the national insurance scheme. Revenues from petroleum activities will nonetheless gradually decline, pulling down growth in the Fund. Over time, therefore, the national insurance scheme’s retirement pensions will grow considerably faster than the expected real return on the Fund.
Chart: Generational account
However, it is wrong simply to compare the Pension Fund and obligations under the national insurance scheme. The government has the option of taxing households and businesses, and this naturally also has a considerable net present value. Generational accounts allow for this. These accounts show whether there is a need to raise taxes or lower expenditure for the government budget to balance in the long term, based on forecasts for benefit and pension payments and oil revenues. The generational accounts reveal that there is currently a need for fiscal tightening equivalent to 10 per cent of GDP or of the order of NOK 200 billion. Long-term forecasts from the Ministry of Finance, that also take the pension reform into account, show a shortfall of around 6 per cent of mainland GDP. Calculations by professors Alf Erling Risa and Erling Vårdal here in Bergen paint a similar picture. The need for fiscal tightening roughly corresponds to current spending of oil revenues. Estimates of this kind are highly uncertain by their very nature and, as we can see, have varied over time. Although Norway is in a stronger starting position than other industrialised countries, with considerable wealth at the government’s disposal, these calculations show that there are certainly clouds on the horizon.
Increases in oil revenue spending cannot be sustained for much longer. Production of oil and gas will decline. At the same time, we have been through a period where the need for welfare services has been relatively stable. The dependency ratio has shown little change. Demographic developments will not be as favourable in the coming decades. Although we have built sound institutions for the management of our petroleum wealth, it is too early to say whether Norway is managing its wealth soundly. It could easily slip. And although there has now been considerable pressure to increase oil revenue spending, there is good reason to believe that future generations will feel that we could have set aside even more.
Thank you for your attention.
1) Carmen M. Reinhart and Kenneth S. Rogoff (2010): “From Financial Crash to Debt Crises” NBER Working Paper No, 1579, March 2010
2) Carmen M. Reinhart and Vincent R. Reinhart (2010): “After the fall”, NBER Working Paper No. 16334, September 2010
3) See Carl August Fleischer (2005): Folkerett (International law)
4) Eduardo Borensztein and Ugo Panizza (2009): “The Costs of Sovereign Default”, IMF Staff Papers, Vol. 56, No. 4
5) Carmen M. Reinhart and Kenneth S. Rogoff (2009): This Time is Different. Eight centuries of Financial Folly
6) Sverre Steen (1954): “Krise og avspenning”, Det Frie Norge Vol 3
7) Panizza et al (2009): “The Economics and Law of Sovereign Debt and Default”, Journal of Economic Literature 47
8) For more discussion of the IMF proposal, see Pål Winje (2002): “Gjeldsordning for land (Sovereign debt restructuring)”, Penger og Kreditt 4/2002, Norges Bank
9) Henrik Bahr (1962): “ Høyesteretts dom i gullklausulsaken (The Supreme Court’s ruling in the gold clause case)”, Lov og Rett, Norsk Juridisk Tidsskrift, No. 5. See also Jan F. Qvigstad (2008): “On keeping promises”, 11 November 2008
10) Sejersted, Francis (1973): Ideal, teori og virkelighet. Nicolai Rygg og pengepolitikken i 1920-årene (Ideals, theory and reality. Nicolai Rygg and monetary policy in the 1920s)
11) J. M. Keynes (1919): The economic consequences of the peace. Keynes probably based his argument on the assumption that the payments would constitute a far larger share of the national income than indicated here
12) International Monetary Fund (2010): “Navigating the Fiscal Challenges Ahead”, Fiscal Monitor
13) See Michael Hoel and Jan F. Qvigstad (1986): "Statsgjelden - et problem når veksten er lav og renten er høy (Public debt – a problem when growth is low and interest rates high)", Sosialøkonomen, and Unni Larsen and Bente Støholen (2010): “ Public finances – the difficult path back to sustainable levels”, Economic Commentaries 2/2010, Norges Bank
14) ROBEK - register of all municipal and county authorities subject to approval pursuant to Section 60 of the Local Government Act
15) See discussion in Appendix 5 to the Report of the Pension Commission (NOU 2004:1)
16) Revised National Budget 2010