Financial stability outlook
Norwegian banks are solid, liquid and highly profitable. Problems at some banks abroad have led to substantial movements in financial markets. If the uncertainty in the financial sector grows and spreads, Norwegian banks’ wholesale funding may become more costly. It is uncertain how households and firms will adjust to higher interest rates and higher costs. In the event of a severe economic downturn, bank losses may be substantial, but banks are able to absorb considerable losses.
The financial system is marked by high inflation and uncertainty
There have been large and abrupt swings in financial markets since the beginning of 2022. Central banks in many countries have raised policy rates quickly to dampen high inflation. The rapid rise in interest rates has led to a fall in the value of bonds and loans with fixed rates and long maturities. This has resulted in doubts about the solvency of a number of US banks, and fuelled depositor flight from small and medium-sized US banks this year. The US and Swiss authorities have implemented measures to safeguard financial stability. A substantially higher interest rate level and the uncertain inflation outlook are adding to international economic uncertainty, as are the ongoing war in Ukraine and the geopolitical tensions. The unwinding of many central banks’ asset purchase programmes may also push up risk premiums and raise market volatility.
The problems in the banking sector have roiled the markets but have not had any significant impact on the risk premiums of Norwegian banks or other financial institutions. Households and firms are facing higher financing costs due to higher interest rates. Growth in the Norwegian economy has slowed, but activity remains high. The labour market is tight. The growth projections for the Norwegian economy have been revised up over the past six months, but there is still uncertainty about future economic developments. The uncertainty is continuing to have an adverse impact on the financial stability outlook.
Cyber attacks continue to represent a threat to financial stability, and it is essential to further develop resilience and contingency arrangements in the financial system to deal with such incidents.
Owing to higher interest rates, real estate market developments are more uncertain than usual
Vulnerabilities in the Norwegian financial system could amplify an economic downturn. High indebtedness makes households vulnerable to loss of income, higher interest rates or a fall in house prices. Higher living costs and interest rates have led to tighter finances for many households over the past year, but low unemployment and accumulated savings better equip households to meet higher expences. Household debt growth has slowed, and there are prospects of a decline in household debt burdens in the coming years. This may help mitigate vulnerabilities further out.
House prices have risen faster than household income over time, which has increased the risk of a more pronounced house price fall. Large and abrupt falls in house prices may result in a tightening of household consumption and higher bank credit losses. House prices fell through autumn 2022 but have since edged up. Future house price developments are uncertain, but the potential fall is cushioned by the fairly low level of residential construction. Commercial property prices (CRE) also rose over a long period but have fallen since summer 2022, and a further decline is expected. Owing to heightened uncertainty about future economic developments and low yields relative to long-term interest rates, the forecasts for CRE prices are more uncertain than usual.
A large share of bank loans is secured on commercial real estate. CRE firms’ financing costs have risen, but strong rental market developments and inflation adjustment of leases are dampening the impact on profitability. A number of CRE firms hold substantial bond debt that will soon mature. Analyses in this Report show that banks have limited exposure to CRE firms with the weakest financial strength and substantial bond debt maturing in the near future. Nevertheless, an economic downturn accompanied by a sharp fall in selling prices and rental income may result in considerable bank losses. Structural changes in the demand for offices or other commercial space as well as higher energy costs may also lead to a fall in selling prices and rental income and hence to bank losses. Moreover, CRE firms are facing regulatory changes in energy efficiency standards. The analyses in this Report show that CRE is more exposed to physical climate risk than dwellings.
Norwegian banks are well positioned to deal with market stress and an increase in losses
The problems in the US and European banking sector have illustrated the importance of sound risk management at financial institutions, but also of oversight and proper regulation with solvency and liquidity requirements, as well as deposit guarantee schemes.
Norwegian banks are solid, liquid and highly profitable. Tightened risk management, capital and liquidity requirements since the financial crisis have increased the capacity of Norwegian banks to deal with market stress and absorb losses while maintaining their capacity to extend loans to creditworthy firms and households. Norwegian banks satisfy the capital and liquidity requirements by an ample margin and have a diversified funding structure with a large share of guaranteed deposits. The Norwegian scheme, which guarantees deposits of up to NOK 2m per depositor per bank, is an important contribution towards maintaining confidence in Norwegian bank deposits and ensuring financial stability.
Solid profitability in the banking sector is the first line of defence for absorbing losses. The rise in interest rates has not led to reduced profitability for Norwegian banks, as for many US banks, since Norwegian banks’ assets and liabilities primarily feature a floating rate or a short fixed-rate period. Norwegian banks’ net interest income has increased since interest rates began to rise in 2021. Bank profitability is still expected to be solid, even though losses may edge up. If financial sector uncertainty increases and spreads, it may become more costly for Norwegian banks to obtain wholesale funding. This may in turn lead to increased borrowing costs for households and firms.
In the event of a sharp downturn, credit losses may become so large that bank profitability turns negative, and banks drawn down the capital buffers that they have built up. The capital requirements banks are facing reflect the vulnerabilities in the Norwegian financial system. The vulnerabilities are little changed over the past six months. Stress tests and sensitivity analyses, including those in Financial Stability Report 2022, show that banks are resilient and are capable of absorbing losses and maintaining lending, even in the event of a sharp economic downturn. The countercyclical capital buffer rate of 2.5% makes a contribution in this regard.
Overall, the financial stability outlook has not changed substantially since the previous Report in November. On the one hand, economic growth prospects in Norway have improved somewhat over the past six months. On the other hand, problems at some banks abroad have led to large movements in financial markets and the outlook for both the markets and the economy ahead is uncertain.
Ida Wolden Bache
Pål Longva
Øystein Børsum
Ingvild Almås
Jeanette Fjære-Lindkjenn
1. International conditions and financial markets
The past few years have been marked by a number of events that have led to considerable volatility in international financial markets. The outlook for global financial stability has recently weakened. The financial market volatility is also affecting the Norwegian financial system, but creditworthy households and firms in Norway have ample access to credit.
High inflation and monetary tightening internationally
In the years after the financial crisis, inflation was low and interest rates were at historically low levels in most countries. Several large central banks launched asset purchase programmes and expanded their lending facilities to stimulate economic activity. This led to financial asset and property price inflation. In the wake of the pandemic and government support measures, inflation began to accelerate in 2021. Russia’s invasion of Ukraine, with the subsequent energy crisis, amplified the rise in prices. Persistently high inflation has prompted many central banks to raise policy rates to their highest levels since the financial crisis in 2008, and many have begun to wind down their asset purchase programmes and extraordinary lending facilities (see "Prospects for central bank balance sheet normalisation").
High global debt raises the risk of a sharp tightening
The expansionary monetary policy pursued during the years after the financial crisis has driven global debt higher than economic activity. The global debt burden began to rise dramatically at the onset of the pandemic, owing to both higher debt growth and a sharp fall in GDP. In 2021 and 2022, the global debt burden fell as activity picked up but is still relatively high in a historical context. At the end of 2022 Q3, the global debt burden was at around 240%. The high levels of household, non-financial corporate (NFC) and public debt increase the risk that an abrupt and sharp tightening of financial conditions will have repercussions for economic growth.
Global growth prospects are still the lowest in many decades.1 The economic outlook is still uncertain, as are the effects of monetary tightening. The war in Ukraine and the geopolitical tensions between the US and China are also adding to the uncertainty. Turmoil in the banking sector and financial markets may lead to even tighter international financial conditions than those engendered by a contractionary monetary policy.
Turmoil at US and European banks
In recent years, there has been considerable volatility in international financial markets, weaker liquidity and several serious incidents in the financial system. This year there has been considerable turmoil in the banking sector in many countries after some US banks faced serious problems and were closed by US regulators.
Deposits in US banks rose markedly during the pandemic, thanks in part to government support measures. Higher bank balances were largely invested in long-dated fixed-rate bonds. As interest rates rose sharply through 2022, the value of these securities fell. When customers of Silicon Valley Bank (SVB) made large withdrawals, the bank had to sell bonds at a loss to cover the subsequent need for liquidity. This created doubts about the bank’s solvency and amplified the liquidity problems by triggering a run. In March, the US authorities placed the bank in receivership.
The problems at SVB also weakened confidence in other small and medium-sized US banks, and many banks experienced depositor flight. Signature Bank (SB) was closed a few days after SVB. To stabilise US banks’ deposit funding, the authorities guaranteed all deposits in the two closed banks. In addition, the Federal Reserve established the Bank Term Funding Program under which banks can borrow against investment-grade collateral valued at par with no haircuts applied. These measures were intended to restore confidence in deposits with US banks.
The events at US banks led to considerable volatility in international financial markets, which had already felt the impact of uncertainty about the inflation outlook and future economic developments. Equity prices fell, and debt financing became more costly. In Europe, the share price of the global systemically important bank Credit Suisse (CS) fell markedly, apparently triggered by the market stress and by indications from its largest shareholder that it could not contribute more capital. The Swiss authorities made a deal with UBS for UBS to acquire the bank. Under the terms of the deal, CS shareholders were paid in UBS stock, and CS’s Additional Tier 1 (AT1) capital was written down.
At the end of April, the US resolution authority seized First Republic Bank (FRB), and most of FRB's assets were sold to JPMorgan Chase. FRB’s offices were reopened as branches of JPMorgan Chase on Monday, 1 May, and customers had full access to their deposits. The seizure took place after FRB had reported large deposit outflows and substantial losses. The rapid rise in interest rates led to a sharp fall in the value of banks’ fixed-rate loans with long maturities, and there was a collapse of investor confidence.
The Federal Reserve has examined the factors that contributed to the failure of SVB and reviewed the supervisory role of the Federal Reserve.2 SVB failed because of mismanagement of basic rate and liquidity risk. The review concludes that banking regulation needs to be strengthened, especially regarding liquidity and interest rate risk. Supervision must also be more stringent, and supervisors should react more quickly and with more tools than is currently the case.
Market participants’ assessments of sources of risk in the Norwegian financial system
In a new survey, Norges Bank has asked market participants such as banks, mutual funds, insurance companies, large non-financial corporates and financial market infrastructures for their assessments of systemic risk. These participants were asked about possible events that could have the biggest impact on the financial system ahead, the probability that these events will occur and whether confidence in the Norwegian financial system will be stable ahead.
The responses indicate that participants consider a fall in property prices, cyber attacks and a recession to be the main sources of risk to the Norwegian financial system (Chart 1.1). In addition, they also judge that there is an increased probability of an event with a substantial impact on the financial system occurring in the next three years, but that confidence in a stable financial system is high and unchanged.
Which source of risk do you consider most likely?
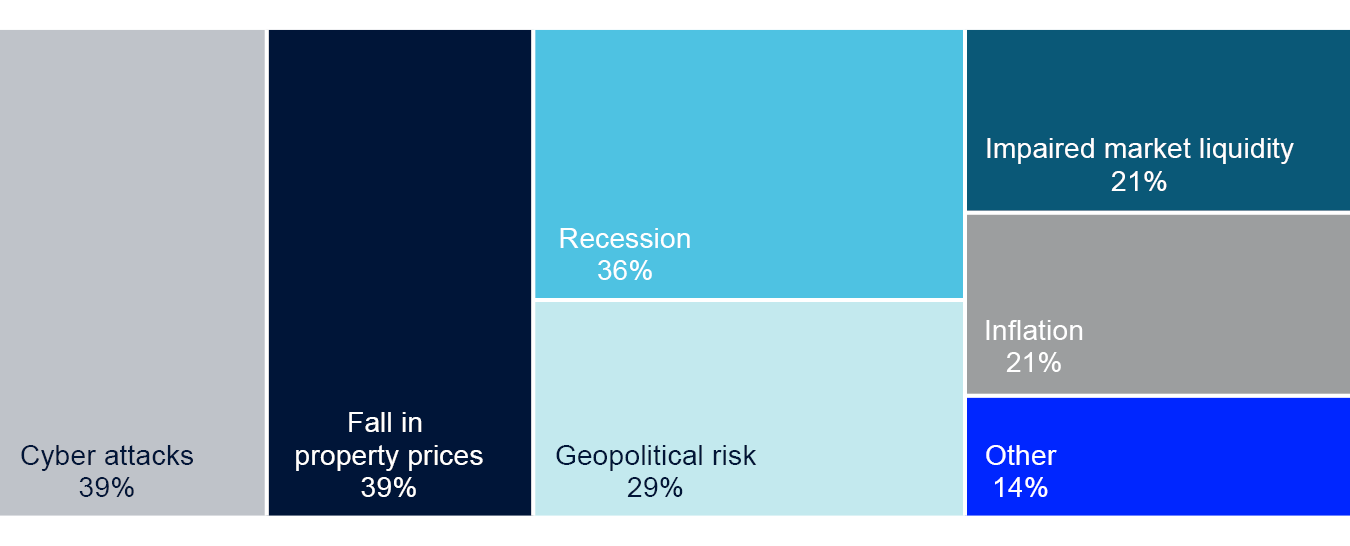
1 Most likely risk reported by respondents (more than one response was possible).
Weaker global financial stability outlook
In its latest Global Financial Stability Report 3, the IMF writes that the global outlook for financial stability has weakened substantially since the October 2022 Report. Even though the regulatory changes since the financial crisis have made the global financial system more resilient, episodes of market stress have highlighted vulnerabilities of banks and other financial institutions. These vulnerabilities may result in sudden and broadly based price declines in financial and asset markets in response to further shocks. Such shocks may include renewed stress at individual banks or other financial institutions, persistently high inflation, weaker earnings and bankruptcies in the corporate sector or an escalation of geopolitical tensions.
Participants in the Norwegian financial system cite a fall in property prices, cyber attacks and a recession as the main sources of risk to the Norwegian financial system (see "Market participants’ assessments of sources of risk in the Norwegian financial system").
Large movements in international financial markets and contagion to Norway
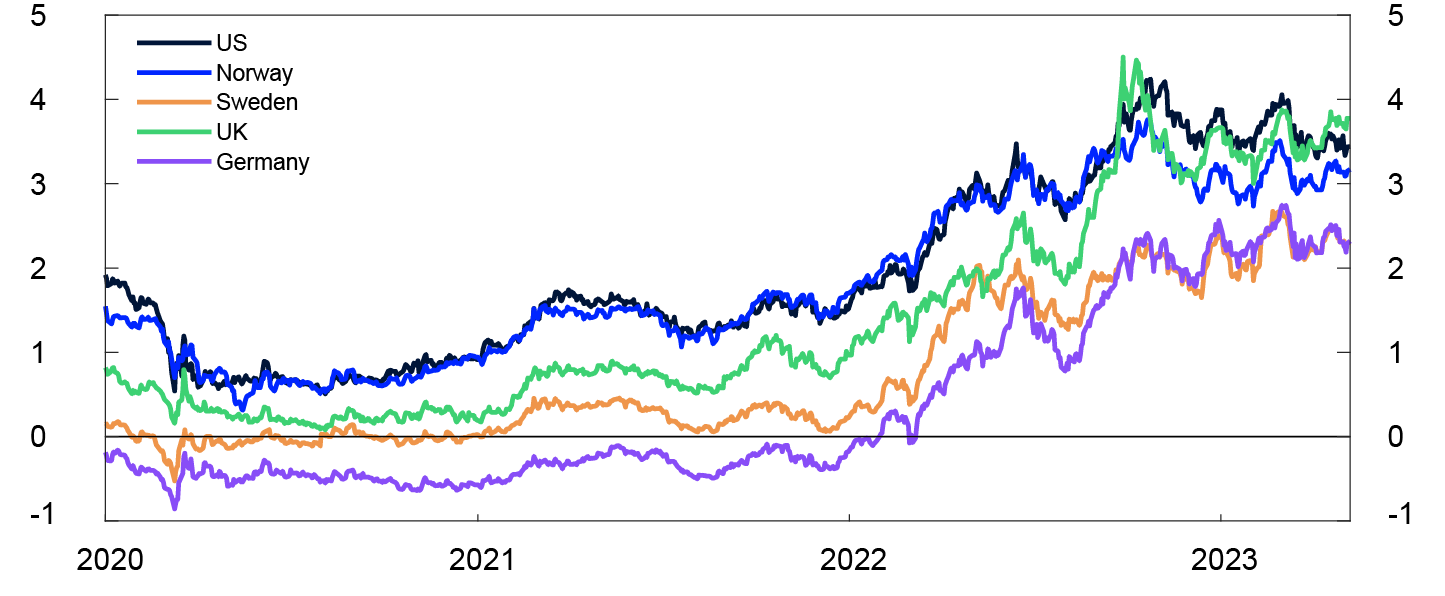
Market policy rate expectations rose markedly in a number of countries after the turn of the year owing to a brighter growth outlook and persistently high inflation but fell back sharply when the banking sector problems in the US and Switzerland erupted. Market participants became uncertain about whether central banks would be able to continue tightening if these problems spread. The same concerns resulted in large swings in long-term interest rates (Chart 1.2). Market interest rates have rebounded since March.
Yields on 10-year government bonds in selected countries. Percent
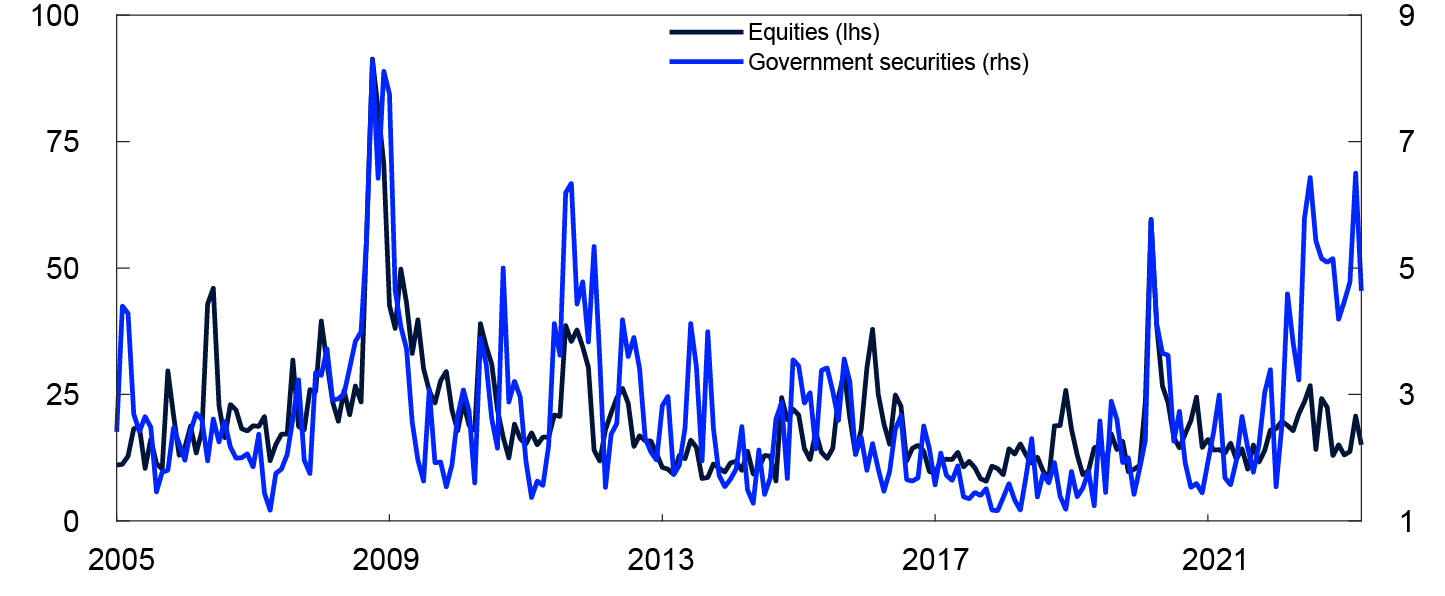
Volatility in the Norwegian fixed-income and equity markets rose markedly through 2022 and has since remained at a high level (Chart 1.3). Large price fluctuations may prompt market makers to quote a wider bid-ask spread to protect themselves against price risk, which may impair market liquidity and increase the risk of sudden market reactions. In Norges Bank’s market liquidity survey for 2022 H2, contacts reported somewhat poorer liquidity in the covered bond and government securities segments. Contacts pointed out that larger swings in policy rate expectations were leading to higher volatility in bond prices. This applies especially to bonds with high interest-rate sensitivity such as fixed-rate long-term sovereign bonds. For local government, non-financial corporate and senior bank bonds, market liquidity was assessed as marginally better. Contacts assessed market liquidity conditions on the whole to have worsened since the end of 2020 for all types of securities.
30-day annualised volatility. Monthly average. Percent
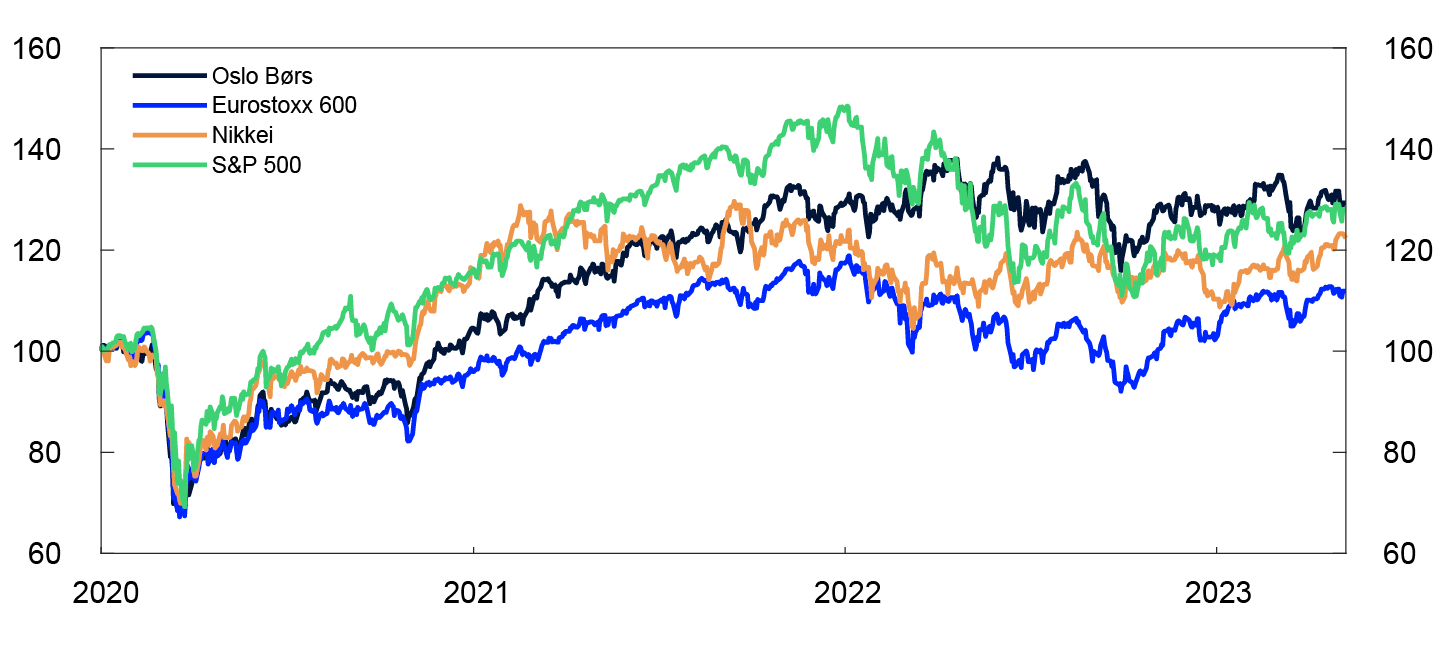
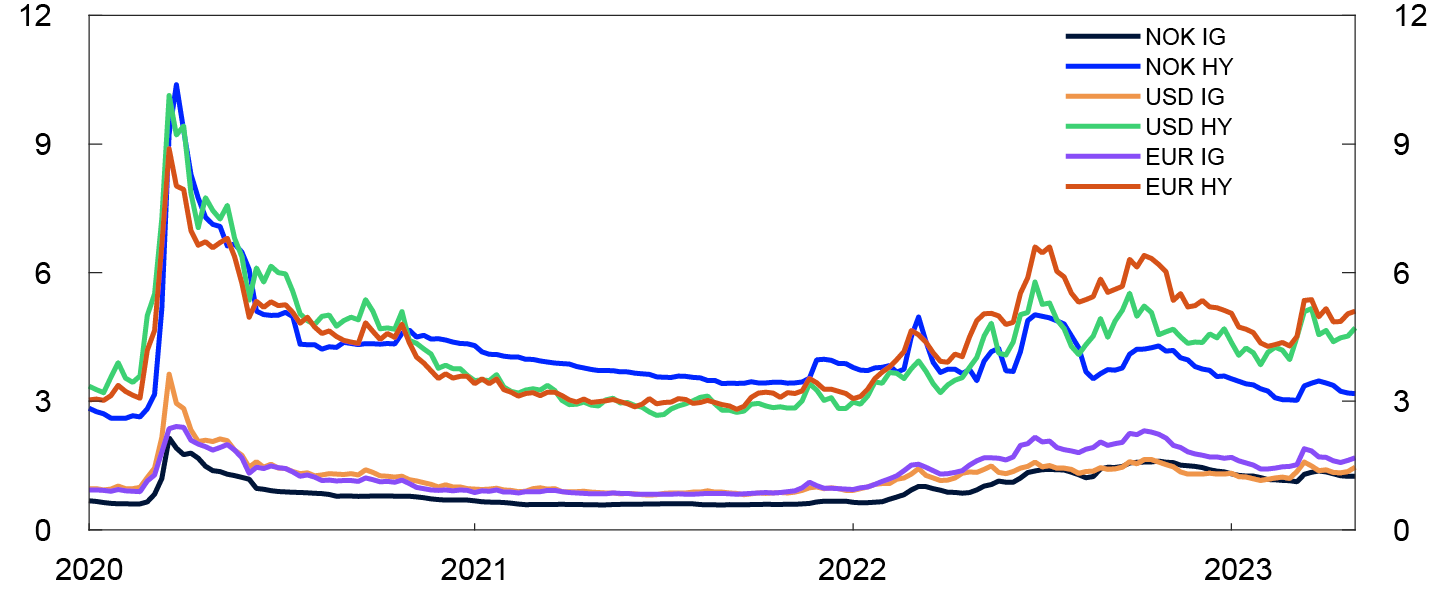
Leading European and US equity indexes have advanced since November. The Oslo Børs Benchmark Index has also moved higher, but the rise is less pronounced than in Europe and the US (Chart 1.4). The relatively weak performance of Norwegian equities reflects a fall in petroleum sector equity prices. In the bond market, credit premiums on corporate bonds fell towards the end of 2022 and at the beginning of 2023 but have edged up again in response to the banking sector turmoil in March, both internationally and in Norway (Chart 1.5).
Equity indexes
Percentage points above the benchmark index
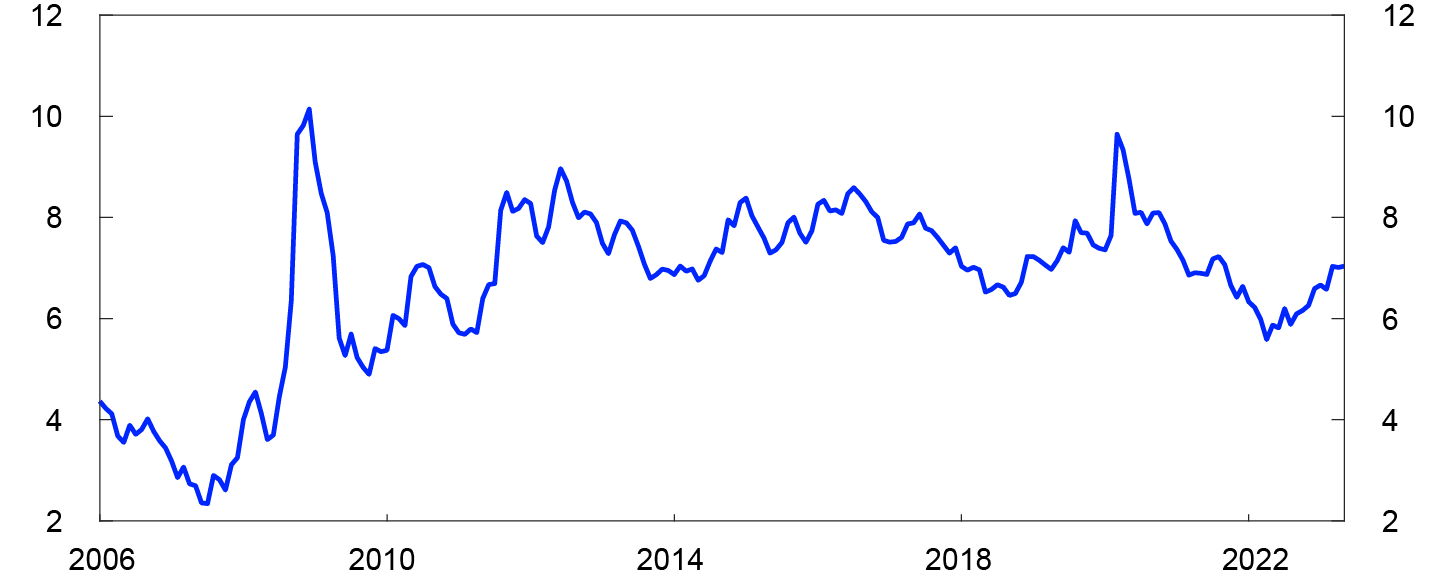
The rise in financial asset prices in the years following the onset of the pandemic has been driven in part by lower yields. The decline in yields has been driven by lower interest rates and falling risk premiums. Over the past year, however, several measures of equity and bond risk premiums have risen in Norway and are now close to historical median values (Chart 1.6). In isolation, this reduces the risk of sudden, disorderly price declines, compared with a situation where risk premiums are low. Nevertheless, owing to the heightened uncertainty, financial asset prices may fall sharply in response to new information.
Monthly average. Percentage points
Many of the large Nordic banks raise short-term wholesale funding in the US commercial paper market and the foreign exchange swap market. In response to the banking sector turmoil in March, risk premiums in the US money market rose. Nevertheless, the rise was less pronounced than at the time of Russia’s invasion of Ukraine in spring 2022. Norwegian and Nordic banks have ample access to short-term wholesale funding.
There have been large movements in the foreign exchange market, and the Norwegian krone has depreciated sharply over the past year. This reflects a larger increase in interest rates abroad than in Norway and the turbulence in international financial markets, which have increased the risk premium on the krone. In addition, the krone is partly influenced by oil prices, and falling oil prices tend to lead to a weaker krone. There have not been signs that asset managers are facing liquidity problems as at the time when the krone depreciated suddenly following the onset of the pandemic.
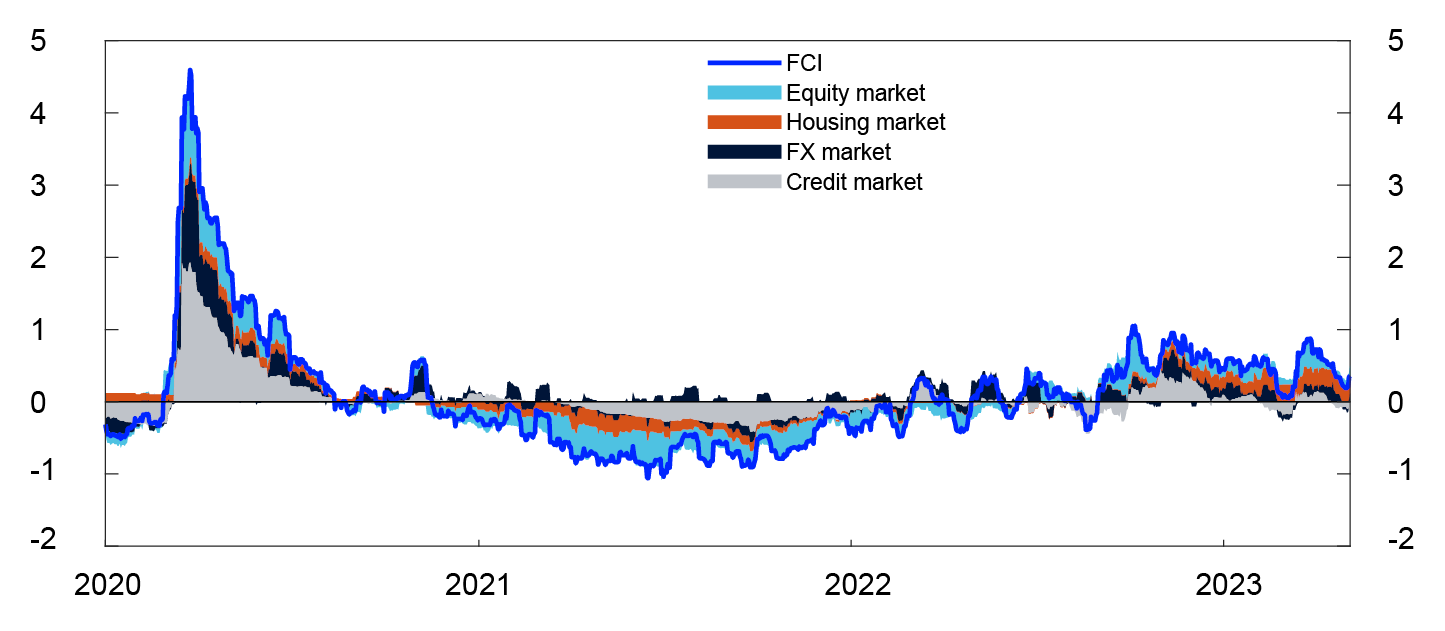
Norges Bank’s financial conditions index (FCI) provides an overall picture of the price and availability of different types of financing beyond that indicated by the policy rate and policy rate expectations further out.9 The FCI provides an indication of the tightness or accommodativeness of financial conditions compared with a historical average. Lower premiums in money and credit markets contributed to a fall in the FCI at the beginning of 2023 (Chart 1.7). In response to turbulence in international financial markets, premiums rose again in March, and equity market volatility accelerated, leading to tighter financial conditions. Less turbulence in equity markets contributed to a decline in the indicator in April. Overall financial conditions are a little tighter than the historical average.
Financial conditions index (FCI). Standard deviation from the mean
Households and firms in Norway have ample access to credit
Banks are the dominant source of credit for Norwegian households and firms. Norwegian banks are solid, liquid and highly profitable (see Section 3). This gives them the flexibility to extend loans to creditworthy firms and households, even if bank funding conditions deteriorate. The financial market stress in March has not led to funding problems for Norwegian banks.
Creditworthy households and firms have ample access to credit. In Norges Bank’s lending survey for 2023 Q1, banks report unchanged credit standards for households after tightening a little in 2022 Q4. On the whole, banks’ credit standards for corporates have been broadly unchanged. However, over the past three quarters, banks have reported somewhat tighter credit standards for commercial real estate (CRE) firms.
Large corporates often combine bank loans with bond issues. Primary market activity in the corporate bond market was lower than normal through 2022. As market sentiment improved and credit premiums declined, activity picked up somewhat towards the end of 2022 and at the beginning of 2023, but issuance volumes are still low compared with the past five years. In Norway, low volumes may partly reflect the more favourable terms for bank loans than for bonds for many corporates. Issuance volumes for corporate bonds internationally have also been lower than normal over the past year.
The turmoil in the international banking sector had a limited impact on the risk premiums for Norwegian banks and other financial institutions. If the uncertainty relating to the banking sector increases and has a greater impact on Norway, it may become more difficult and costly for Norwegian banks to obtain wholesale funding. Such a situation may lead to tighter credit standards.
1 See International Monetary Fund (2023) “World Economic Outlook – April 2023".
2 See Federal Reserve (2023) “Review of the Federal Reserve’s Supervision and Regulation of Silicon Valley Bank”. 28 April 2023.
3 See International Monetary Fund (2023) "Global Financial Stability Report – April 2023".
4 Period: 1 January 2020 – 8 May 2023.
5 Period: January 2005 – April 2023.
30-day annualised volatility on Oslo børs Benchmark Index and compound index for Norwegian government securities.
6 Period: 1 January 2020 – 8 May 2023.
7 Period: Week 1 2020 – week 18 2023.
Five-year credit premium for non-financial enterprises with low (IG) and high (HY) risk.
8 Period: January 2006 – May 2023.
Estimated share premium by dividend model (DDM) for main index on Oslo Børs.
9 See page 22 of Monetary Policy Report 4/22 and Bowe, F., K.R. Gerdrup, N. Maffei-Faccioli and H. Olsen (2023) “A high-frequency financial conditions index for Norway”. Staff Memo 1/2023. Norges Bank.
10 Period: 1 January 2020 – 5 May 2023.
Prospects for central bank balance sheet normalisation
Many of the largest central banks have begun to unwind the asset purchase programmes and extraordinary lending facilities they implemented over the past decade (Chart 1.A). Before the introduction of the Bank Term Funding Program (BTFP) in response to the turmoil in the US banking sector, the Federal Reserve reduced its balance sheet by USD 95bn per month. Euro area banks have repaid a portion of their long-term loans from the European Central Bank (ECB), and the ECB is reducing its asset holdings by EUR 15bn per month until the end of June 2023 by reinvesting only portions of maturing securities. From July, the ECB will discontinue the reinvestments, and securities holdings will be reduced by around EUR 30bn per month. Other countries’ central banks have also announced or begun balance sheet normalisation, either as active asset sales or a reduction of reinvestments.
Balance sheet size of selected central banks. Index. January 2000 = 100
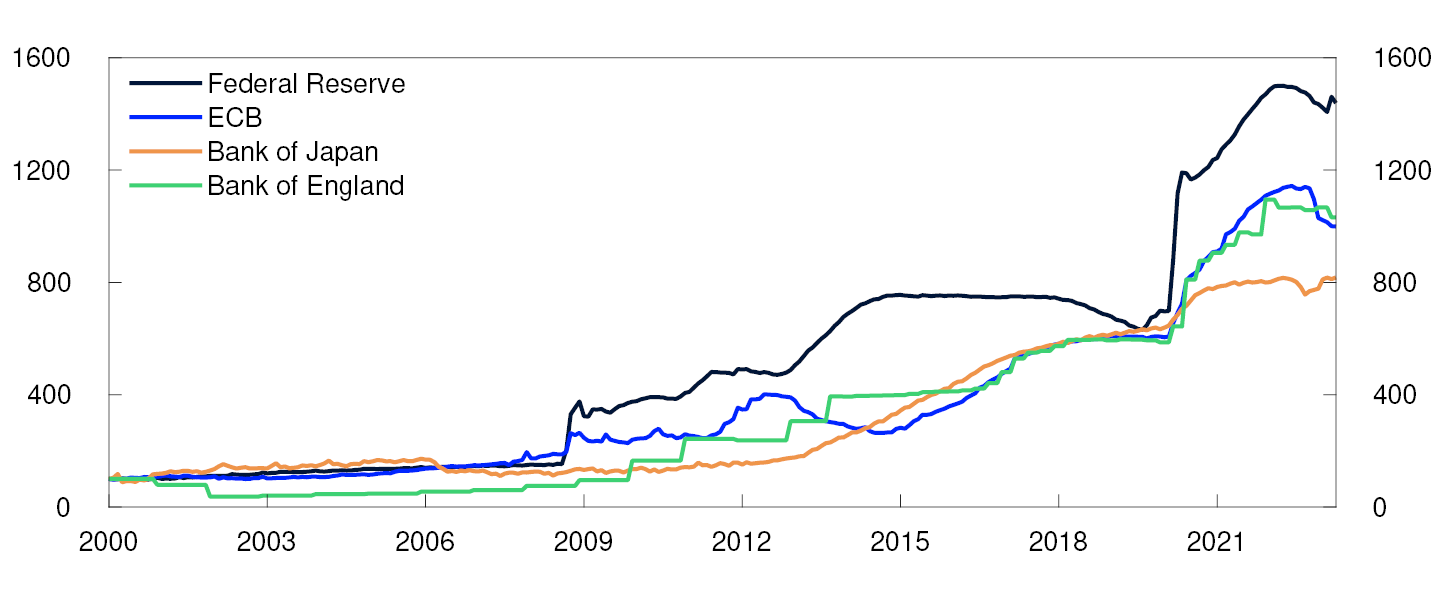
Asset purchase programmes have likely contributed to lower risk premiums and lower volatility in financial markets. Such programmes are thought to work through a number of channels. Central bank government bond purchases push down the yields on investment-grade securities in order to encourage investors to take risks to get the economy moving again. In addition to purchasing government securities, a number of central banks have also purchased bonds issued by banks, other financial institutions and non-financial corporates and have offered long-term loans to banks directly. This is likely to have contributed directly to lower bond market risk premiums and eased access to funding by banks and corporates.
The normalisation of central bank balance sheets may drive up interest rates and risk premiums. However, it is far from obvious that unwinding these measures will lead to a one-for-one reversal of the above-mentioned effects. If investors’ preferred portfolio composition has changed since the asset purchase programmes were launched, risk premiums may find a new equilibrium level. In addition, it is conceivable that market participants are more likely to assume a renewal of central bank measures in turbulent times than they once did. This in and of itself may push down risk premiums. There is further uncertainty about the eventual extent of central banks’ balance sheet reductions. Nevertheless, there is reason to believe that the unwinding of central bank asset purchase programmes may lead to higher risk premiums and higher volatility in both international and Norwegian bond and equity markets.
1 Period: January 2000 – April 2023.
2. Financial system vulnerabilities
The vulnerabilities of the Norwegian financial system could amplify an economic downturn. Many households are highly indebted, and banks have substantial exposures to the commercial real estate (CRE) sector, which is vulnerable to higher interest rates. So far, households and firms have coped with higher interest rates and higher prices, but there is considerable uncertainty about future economic developments. Cyber attacks continue to pose a threat to financial stability.
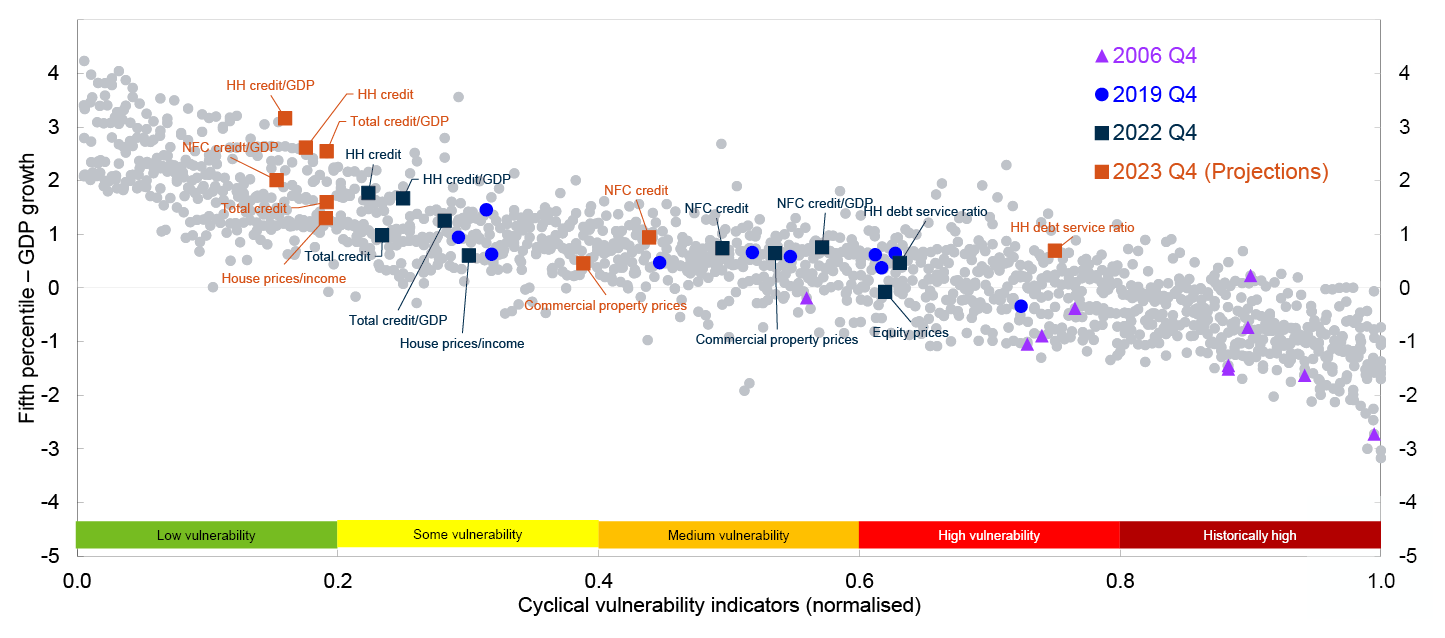
Over the past year, there has been a steep and rapid rise in interest rates, and property price inflation and credit growth have slowed. However, low interest rates over a long period led to a sharp rise in property price inflation and debt, which remain cyclical vulnerabilities of the financial system. A broad set of cyclical vulnerability indicators is now at a medium level from a historical perspective (Chart 2.1) and shows little change overall over the past six months and since before the pandemic. However, there is now a wide variance in the indicators. For example, the indicator associated with household debt growth points to fairly low cyclical vulnerabilities, and the projections imply that cyclical vulnerabilities will decrease ahead. On the other hand, the indicator for household debt service ratios points to high vulnerabilities, and will increase ahead. Prior to the financial crisis, all the indicators signalled high cyclical vulnerabilities.
Cyclical vulnerability indicators (normalised) on horizontal scale and estimate for fifth percentile of GDP growth on vertical scale
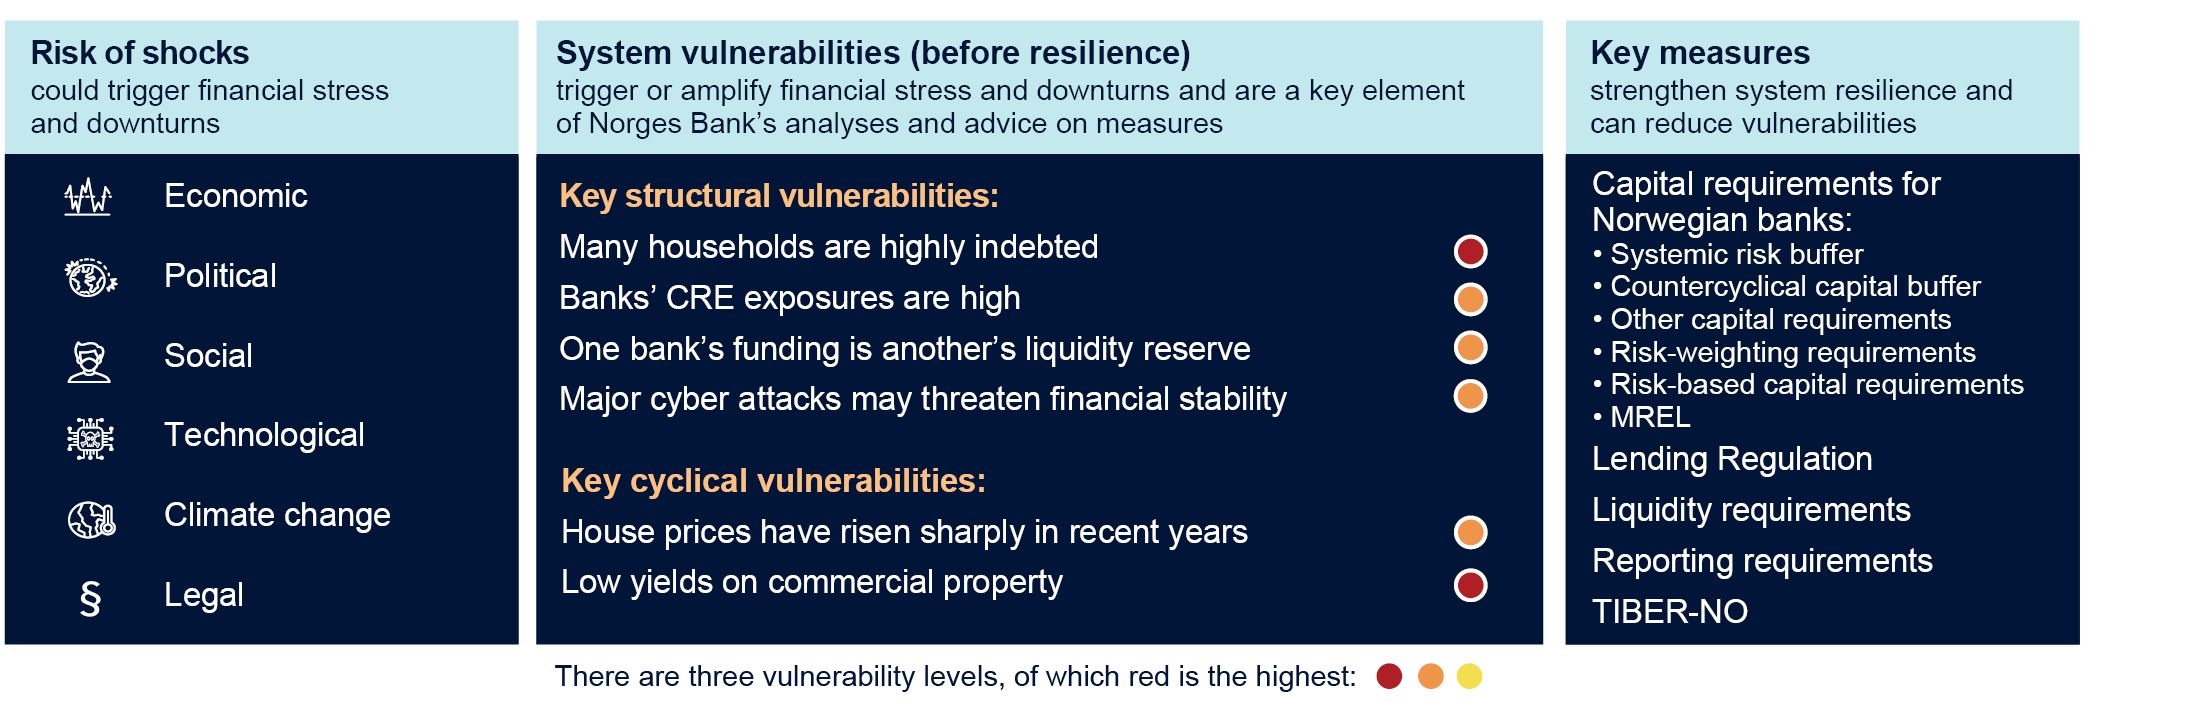
The high indebtedness of many households, banks’ substantial CRE exposures and the fact that one bank’s funding is another bank’s liquidity reserve are key structural financial system vulnerabilities (see box below). These vulnerabilities show little change from year to year and can be characterised as structural. The risk of major cyber attacks is also a key structural vulnerability. In Norges Bank’s assessment, structural vulnerabilities are at approximately the same level as in November 2022.
Systemic risk in the Norwegian financial system
Shocks can come from different parts of the economy and financial markets. Negative events related to, for example, technology, climate change and geopolitical and social conditions may also trigger financial crises. The shocks to financial stability that may occur in the future are difficult to foresee.
The vulnerability assessments are based on historical experience regarding what causes or amplifies downturns and financial turbulence and on assessments of new features of the financial system. We distinguish between cyclical vulnerabilities, which fluctuate more over time, and structural vulnerabilities, which are more persistent. It is difficult to clearly distinguish among vulnerabilities, and vulnerabilities can be mutually reinforcing. The most important vulnerabilities are shown in the table. The vulnerabilities are the same as in Financial Stability Report 2022 published last November, but the vulnerability associated with the rise in prices of many securities over a long period has been removed. In November, this vulnerability was coded yellow. Equity risk premiums have since risen and are close to historical median values (see Section 1), which lowers this vulnerability somewhat, even though a sharp price fall may still result in or amplify a downturn.
Since the financial crisis in 2008, the Norwegian authorities have introduced a number of rules to mitigate vulnerabilities and increase financial system resilience. For more detailed information about these measures, see Section 4. The measures primarily serve to increase financial system resilience but can also mitigate vulnerabilities. Financial institutions’ resilience is described in Section 3.
1 Period: 1985 Q1 – 2023 Q4.
2023 Q1 projection from MPR 1/23 and FSR – 2023 H1. Cyclical vulnerability indicators include five-year credit growth, house prices, household debt service ratios, three-year changes in commercial property and equity prices. Each indicator is normalised based on its historical distribution in the period, so that all indicators are scaled the same. Historical observations indicate that the estimated risk of a fall in GDP (vertical scale) rises with the level of cyclical vulnerabilities (horizontal scale).
2.1 Households and the housing market
Many households are highly indebted
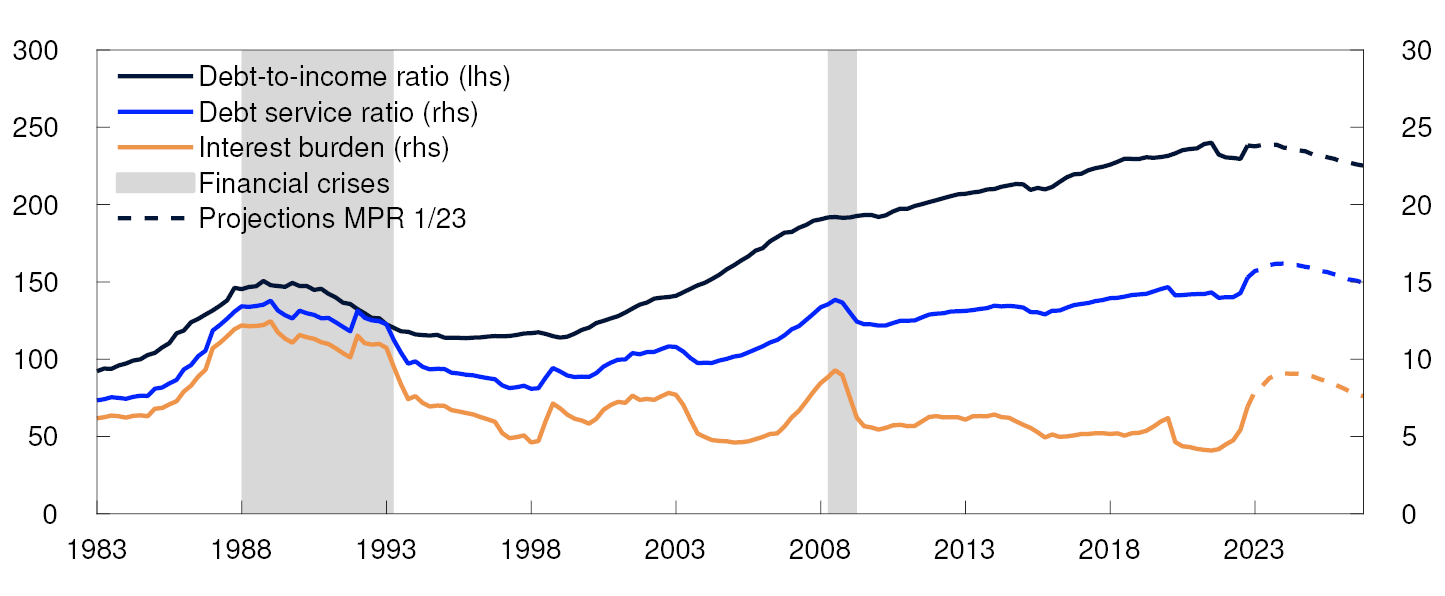
High indebtedness makes many households vulnerable to loss of income, higher interest rates or a fall in house prices. The high indebtedness largely reflects elevated house prices and widespread home ownership. Household debt is unevenly distributed, and debt-to-income ratios are particularly high among younger age groups, which account for many first-time home buyers.
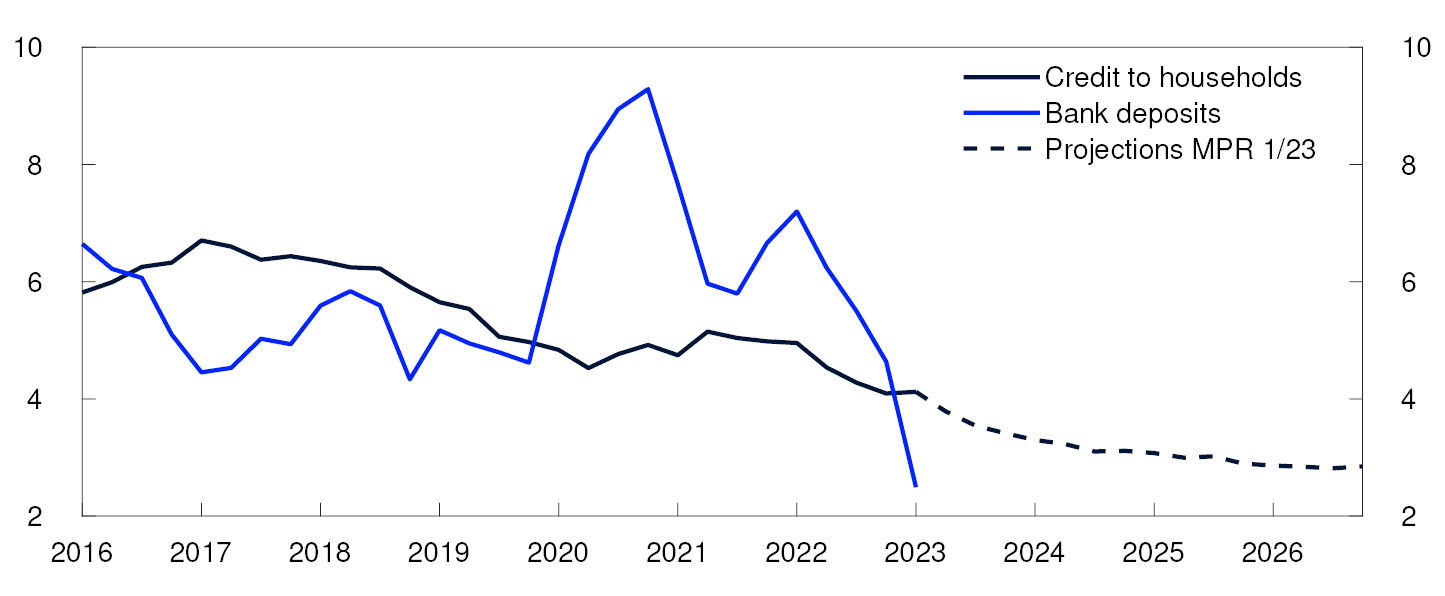
Household credit growth slowed gradually in 2021 and 2022 (Chart 2.2). Credit growth is expected to edge down further ahead (see Monetary Policy Report 1/23) on the back of higher lending rates and a weaker housing market. A lower credit-to-income ratio implies a fall in household debt burdens. In the somewhat longer term, this may help reduce household and financial system vulnerabilities.
Four-quarter growth. Percent
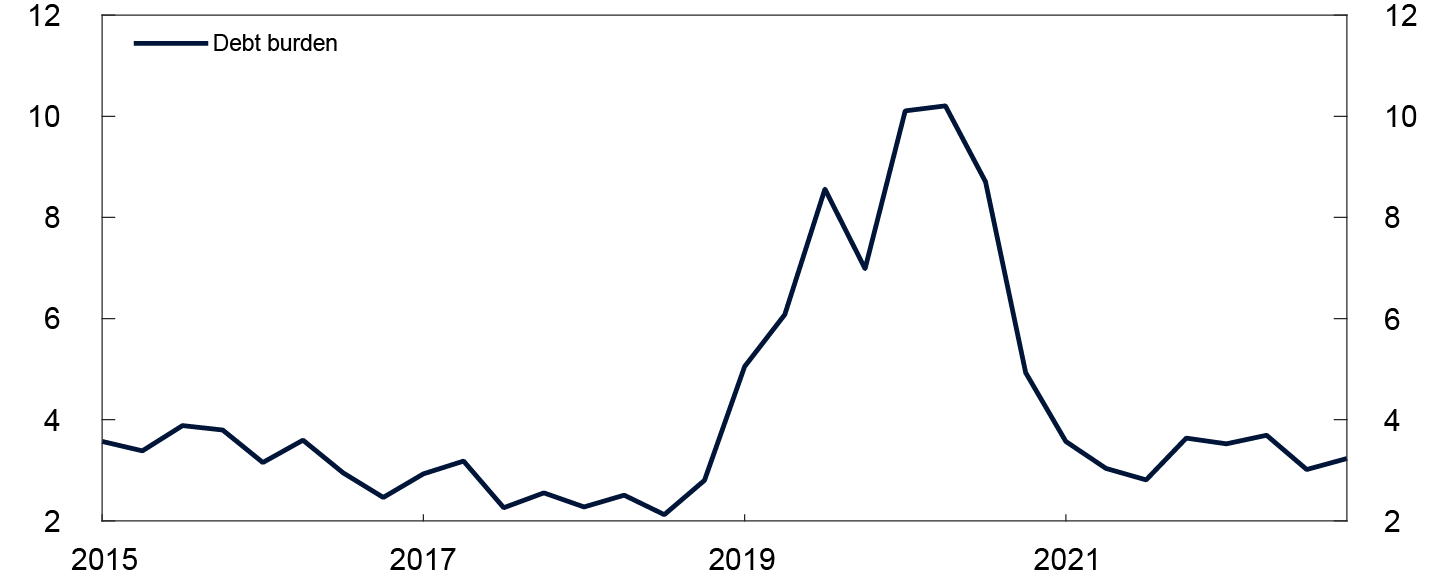
Given higher lending rates, households will have to spend a larger share of income on interest payments (Chart 2.3). Given the policy rate forecast in Monetary Policy Report 1/23, household interest burdens are set to increase from close to 7% in 2022 Q4 to just over 9% in the course of 2023. Interest burdens in 2020 Q4 were at around 4%. Household debt service ratios, which include both interest and ordinary principal payments, are expected to rise to a historically high level.
Percent
Analyses of microdata on household income and wealth show that most households are able to service their debt.4 However, in response to higher interest rates and costs, several households will need to tighten consumption. If many households reduce consumption substantially at the same time, firms’ earnings and debt servicing capacity could fall and in turn lead to higher losses on banks’ loan portfolios and amplify a downturn in the Norwegian economy. The Financial Stability Report for the second half of 2023 will present analyses of household debt based on the latest available microdata on income and wealth.
Low unemployment and accumulated savings better equip households to meet higher expenses and help cushion the fall in consumption. Owing in part to limited spending options, many households accumulated substantial savings during the pandemic, and households’ bank deposits increased markedly (Chart 2.2). Over the last half year, households have begun to draw on these deposits, but deposits are still higher than prior to the pandemic.
Unsecured debt, such as consumer credit, accounts for around 3% of household debt. Following the introduction of the Consumer Credit Regulation in 2019 and the establishment of credit registers, consumer credit declined. In 2022, the decline came to a halt, and consumer credit has again shown weak growth since then. Since 2022, the rise in consumer debt has been particularly strong among lower-income households and non-homeowners.5 While residential mortgage rates rose, the average interest rate on consumer debt remained broadly unchanged in 2022.
House prices have risen substantially in recent years
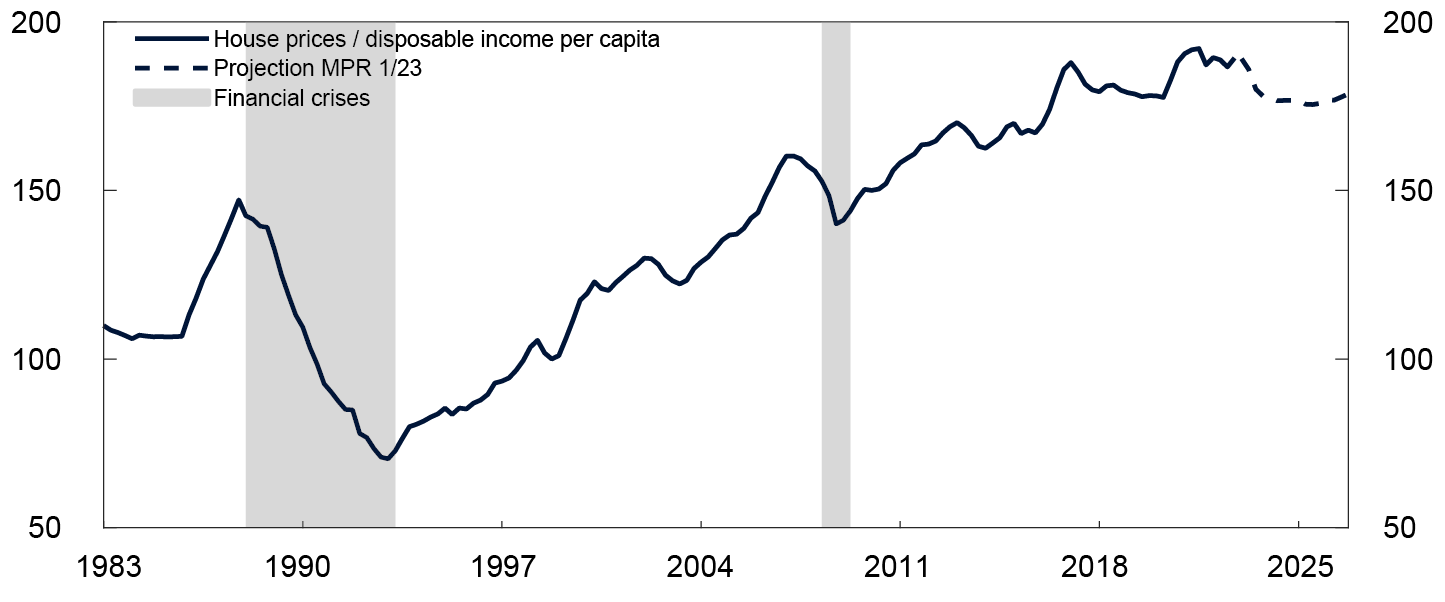
House prices have long risen faster than income (Chart 2.4). Together with the high indebtedness of many households, this has increased the risk of a fall in house prices that could trigger a tightening of household consumption and push up bank losses.
Index. 1998 Q4=100
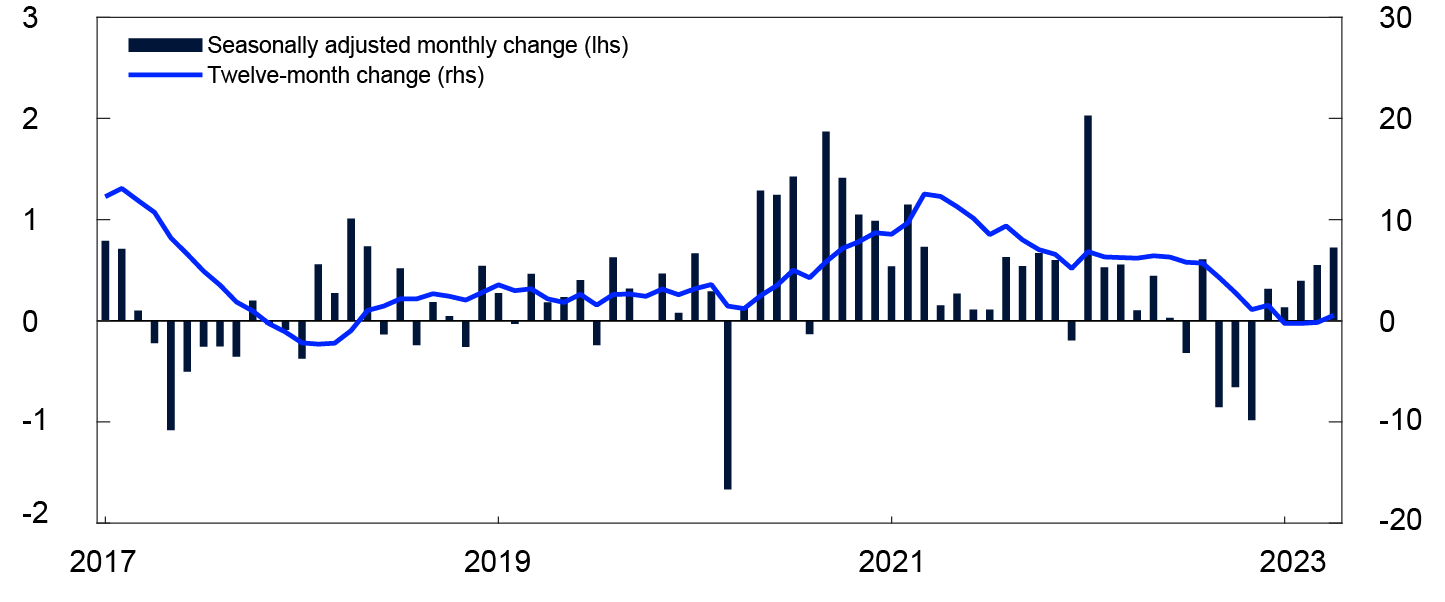
In autumn 2022, house prices fell but have since risen again (Chart 2.5) and are now close to the August peak. A tight labour market has likely contributed to underpinning housing demand so far in 2023. In addition, amendments to the debt-servicing capacity requirements in the Lending Regulation in force from the beginning of 2023 may have boosted housing demand.
Percent
In autumn 2022, a large number of homes were listed for sale, and housing market turnover was slightly lower than normal. This led to a marked rise in the stock of unsold homes. This year, housing market turnover has picked up, and the number of unsold homes has fallen back to a fairly normal level. The Bank’s analyses show that house prices respond fairly quickly to changes in the stock of unsold homes (see box below).
2 Period: 2016 Q1 – 2026 Q4.
2023 Q1 projection from MPR 1/23 for credit to households.
3 Period: 1983 Q1 – 2026 Q4.
2023 Q1 projection from MPR 1/23. Household debt-to-income ratio is debt as share of disposable income. Disposable income is after-tax income less interest expenses. Household debt service ratio is interest expenses and estimated principal payments on loan debt to after-tax income. Interest burden is interest payments as a percentage of after-tax income.
4 For analyses of homeowners, see Financial Stability Report 2022 and Lindquist, K.-G., H. Solheim and B.H. Vatne (2022) “Norwegian homeowners’ debt-servicing capacity is adequate”. Staff Memo 8/2022. Norges Bank. A new analysis takes a look at non-homeowner households (see Lindquist, K.-G., H. Solheim and B.H. Vatne (2023) “Betalingsevne og boligkjøpekraft blant husholdninger som ikke eier bolig” [Capacity to pay and home affordability among non-homeowner households] Staff Memo 9/2023. Norges Bank (in Norwegian only)).
5 See Solheim, H. and B.H. Vatne (2023) “Lavtlønte og de uten bolig økte forbruksgjelden i 2022” [Rise in consumer debt among lower-income groups and non-homeowners in 2022]. Blog post published on the Bankplassen blog 6 February 2023. Norges Bank (in Norwegian only).
6 Period: 1983 Q1 – 2026 Q4.
2023 Q1 projection from MPR 1/23.
7 Period: January 2017 – April 2023.
House prices respond quickly to changes in the stock of unsold homes
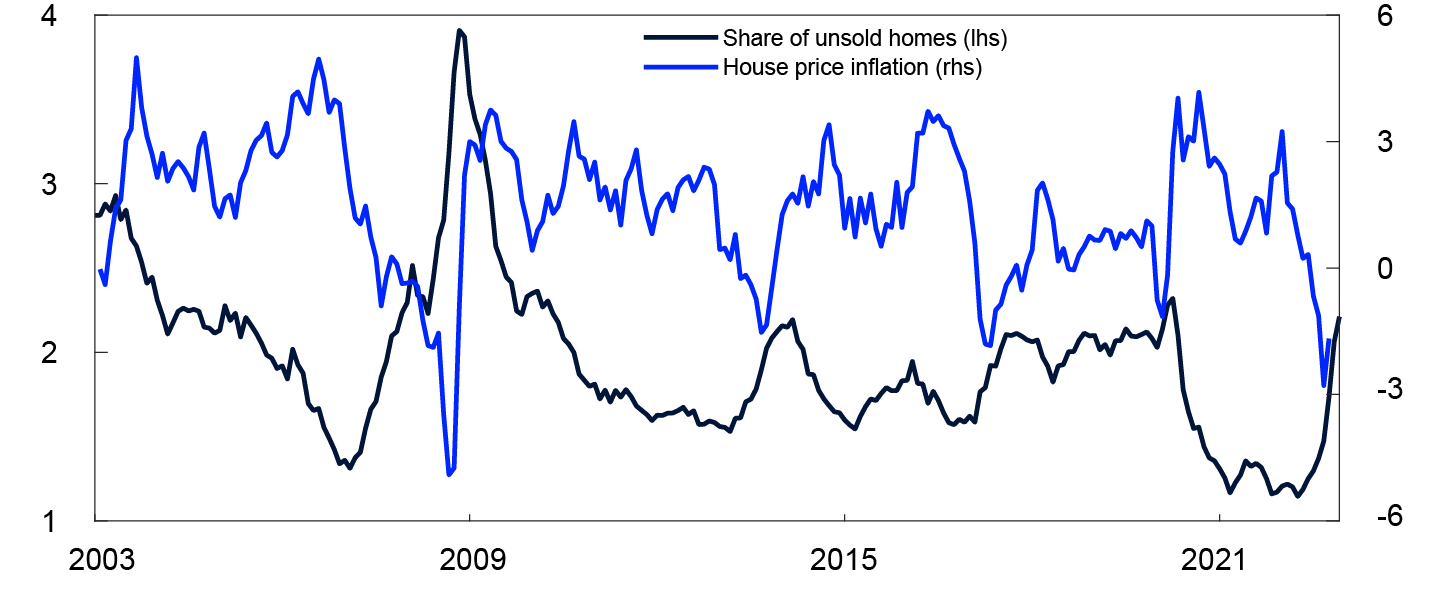
In a new analysis, Norges Bank takes a closer look at the relationship between house price developments and the stock of unsold homes1 and examines the speed and magnitude of house price responses to changes in the stock of unsold homes. In the analysis, unsold existing homes are measured as a share of existing homes sold, which can be interpreted as the number of months required to sell all unsold homes at the current sales frequency. There is an inverse relationship between this share and house price inflation (Chart 2.A). When the stock of unsold homes relative to home purchases is low, an indicator of housing market scarcity, house price inflation is often high.
Percent2
There are differences in the functioning of the housing market across countries. Norges Bank found that in Norway, a relationship exists between the share of unsold homes and house price inflation over a fairly short horizon, approximately three months ahead. There is no clear relationship over longer horizons. However, in the US, this relationship is strong for house price inflation 12 months ahead. Thus, the house price response to changes in the share of unsold homes is more rapid, but weaker, in Norway compared with the US. On average, it takes more months to sell a home in the US than in Norway, an indication that the Norwegian housing market is more efficient than its US counterpart.
An increase in the stock of unsold homes in Norway corresponding to one month of normal turnover is associated with an approximately 4 percentage point decline in house prices within six months (Chart 2.B). Between August and December 2022, the number of unsold homes increased by an amount close to one month’s turnover. According to the analysis, this suggests in isolation that overall house prices should have fallen by around 2.7% in this period but the actual house price fall was 2.2%. In 2023, however, the number of unsold homes has fallen, which in isolation pulls up house prices.
Percentage points
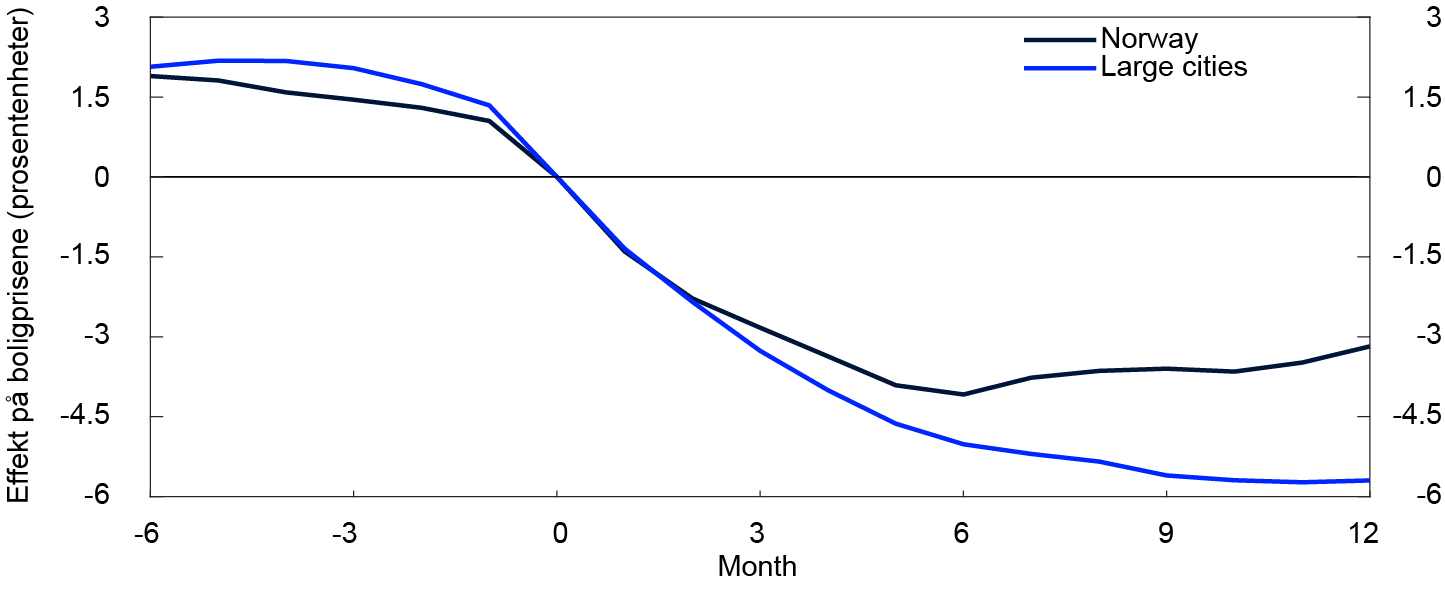
The relationship between house prices and unsold homes is stronger in cities such as Oslo, Bergen, Trondheim and Stavanger than in the rest of the country (Chart 1.B). This means that in Norway, the house price response to changes in the share of unsold homes is stronger in cities than in less urbanised areas. On average, homes are sold faster in cities than in the rest of Norway. This indicates that housing markets are more efficient in cities compared with less urbanised areas, which may reflect the larger markets and the larger stock of fairly similar homes in Norwegian cities.
1 See Kirkeby, S.J. and P. Nenov (2023). “The Housing Phillips Curve and Momentum in the Norwegian Housing Market”. Staff Memo 10/2023. Norges Bank.
2 Period: January 2003 – December 2022.
Share of unsold homes: as share of turnover (three-month moving average).
House price inflation: three-month change in house prices (percent).
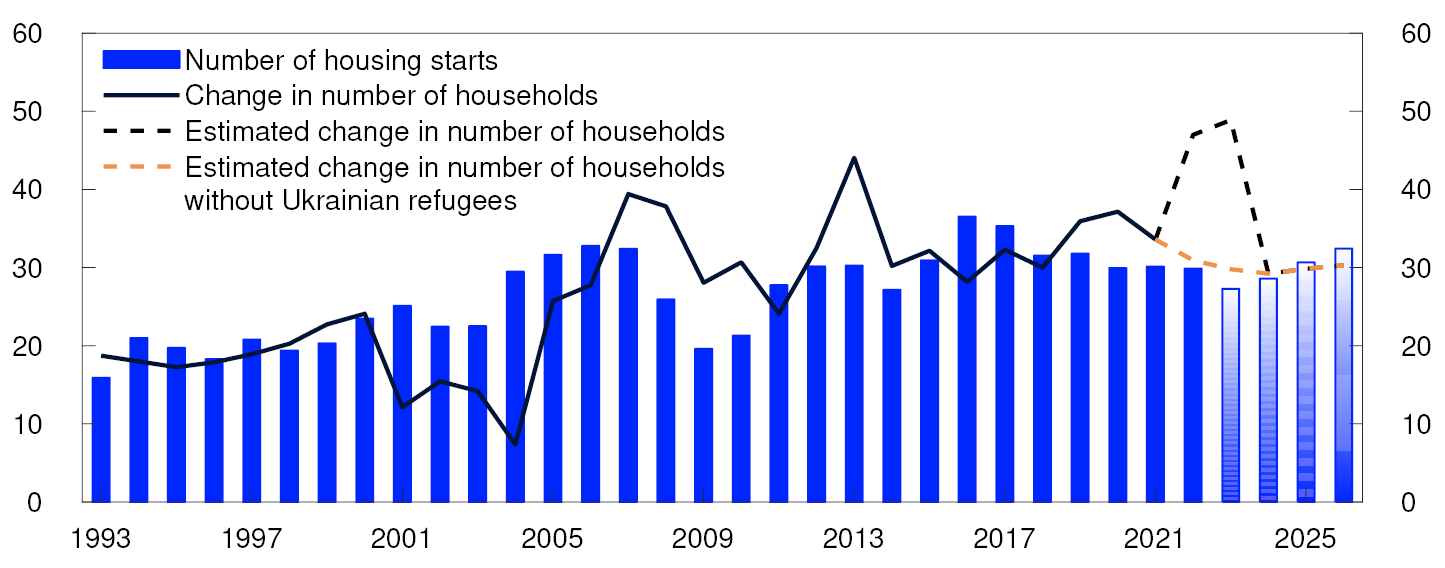
New home sales have been low since summer 2022, which reflects higher interest rates and construction costs. Residential construction activity over the past three years has been lower than household formation, a situation that is expected to persist in the coming years (Chart 2.6). A low level of residential construction is helping to mitigate the risk of a sharper fall in house prices and may push up house price inflation further out.
Housing starts and annual change in number of household. In thousands
In the projections in Monetary Policy Report 1/23, house prices edge down in the course of this year in response to higher lending rates. However, there is considerable uncertainty about price developments further ahead. A new analysis based on historical relationships indicates a normal downside risk to house prices (see "Model estimates of uncertainty in house price developments"). Following a period of very low lending rates, it is uncertain how households will respond to high inflation and the rapid rise in interest rates over the past year. This implies greater uncertainty about house price developments than captured by the analysis.
In Norway, owner-occupied housing currently receives favourable tax treatment compared with other forms of investment. This has contributed to widespread home ownership but also to high levels of household debt. A new tax commission proposes taxing the rental value of owner-occupied housing.9 In the interest of financial stability, Norges Bank’s consultation response supported the proposal to reduce the asymmetry resulting from the tax deductibility of mortgage interest while the benefit of home ownership is not taxed.10 This will weaken incentives to take out large home equity loans. The tax changes may help to reduce household debt and pull down house prices and thus mitigate financial system vulnerabilities.
8 Period: 1993–2026.
2023 Q1 projection from MPR 1/23 for households and from 2023 for completions.
Estimated change in number of households: Estimates for household growth are based on population projections from Statistics Norway adjusted for population figures for 2022 and changes in the number of people per household in the past five years.
Estimated change in number of households without Ukrainian refugees: 40 000 Ukrainian refugees excluded in 2022 and 40 000 in 2023.
9 See Official Norwegian Reports (NOU 2022: 20). “Et helhetlig skattesystem”. [A comprehensive taxation system] (in Norwegian only).
10 See consultation statement of 13 April 2023, Norges Bank’s consultation response to NOU 2022 (in Norwegian only).
Model estimates of uncertainty in house price developments
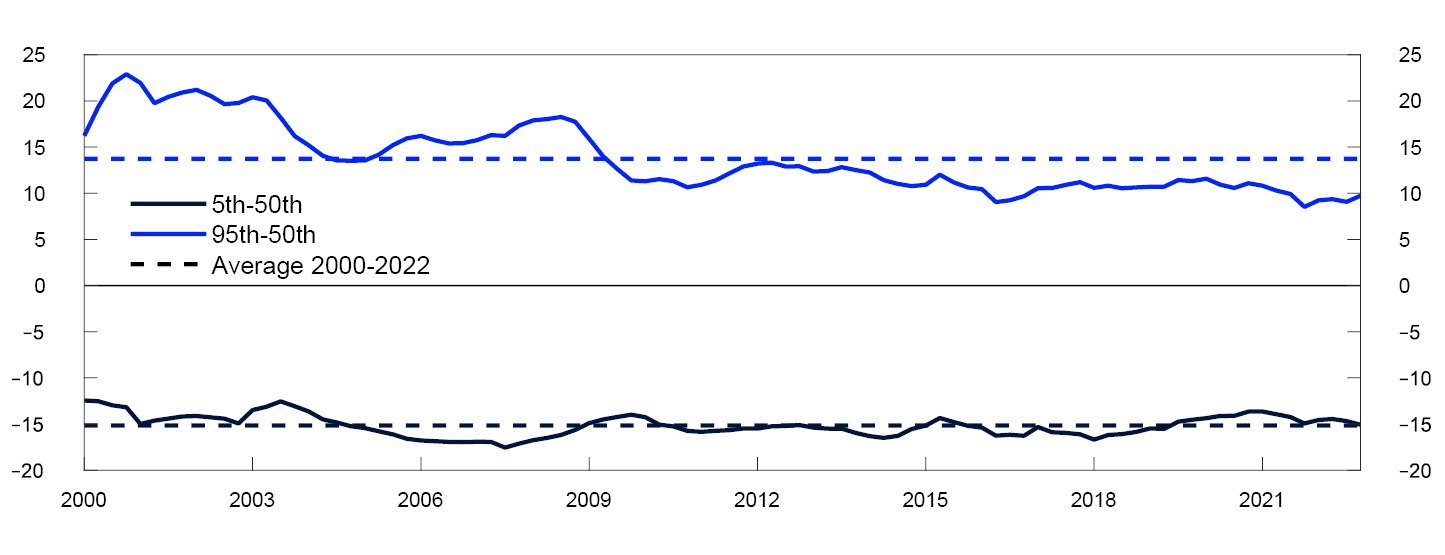
In a new analysis, Norges Bank has quantified the uncertainty in house prices using various indicators and quantile regressions.1 The indicators include the house price-to-income ratio, house prices as a deviation from an estimated trend, financial indicators, credit, income, interest rates and debt service ratios. These indicators have proved to be important for explaining house price movements.
As a measure of downside risk in the housing market, we look at the difference between the 5th percentile and the median (50th percentile) from the quantile regressions. The 5th percentile means that five out of 100 cases of possible house price developments are expected to be lower than this, while the median has an equal number of downside and upside cases. Similarly, we measure the upside risk to house prices as the difference between the 95th percentile and the median.
The analysis indicates that house prices are normally highly uncertain. Over the past 22 years, the downside risk, as estimated in the analysis, has been around 15 percentage points (Chart 2.C). The upside risk has been nearly as large. The analysis currently indicates a fairly normal downside risk, while the upside risk is somewhat less than normal. Prior to the financial crisis, both the downside and upside risks were greater than normal.
The analysis is based on historical relationships. Lending rates have recently risen quickly, following a period of historically low rates. This indicates greater uncertainty regarding household behaviour in the housing market than captured by the analysis.
Spread between percentiles and median from quantile regressions. Four-quarter change in house prices two years ahead. Percentage points
2.2 Corporates and the CRE market
High corporate credit growth
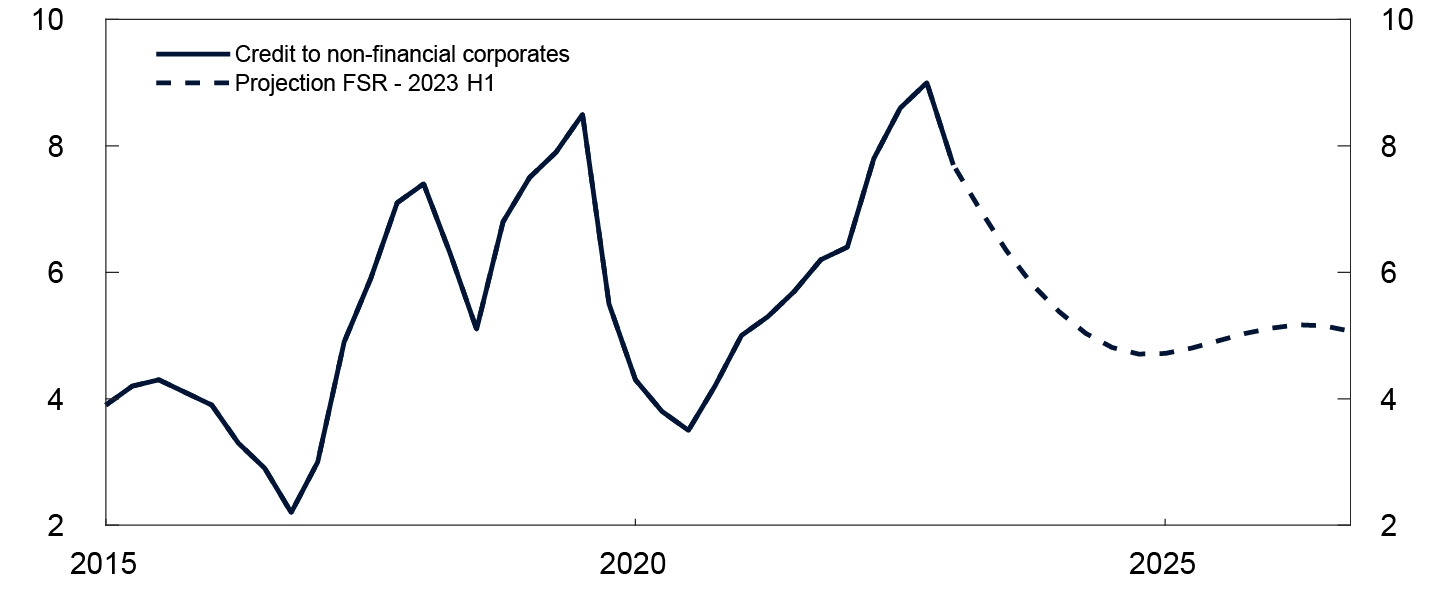
Growth in corporate credit picked up in 2022 and has been high so far in 2023 (Chart 2.7). The increase is primarily attributable to an increase in bank lending, particularly to manufacturing, services and the CRE sector, which likely reflects higher investment. In line with the investment projections in Monetary Policy Report 1/23, growth in total bank credit to corporates is expected to decline in 2023 and stabilise at a more moderate level.
Four-quarter growth. Percent
Financial reporting figures for Norwegian listed companies indicate that corporates as a whole are profitable, with good debt-servicing capacity. Over the past decade, corporate debt has increased in pace with profitability (Chart 2.8). In 2019 and 2020, corporate profitability was low, leading to a temporary rise in debt ratios. In 2022 Q4, profitability, measured by return on equity, was slightly above the average for the past ten years.
Net interest-bearing debt relative to earnings before tax
Since autumn 2022, the number of corporate bankruptcies has risen from the unusually low level during the pandemic, which must be viewed in the context of public support measures. There has recently been a higher number of bankruptcies, especially in construction, retail trade and food and beverage service activities. Nevertheless, the number of bankruptcies and total bank debt held by failed businesses are not higher than normal.
Commercial property selling prices are expected to fall ahead in response to higher interest rates
A large share of banks’ assets are exposures to CRE firms, which are often highly indebted and therefore vulnerable to falling revenue and rising interest rates. Even though losses have been historically low in normal times, during crises, CRE is the sector where banks’ losses have been highest. During the banking crisis between 1988 and 1993, banks lost approximately one-third of their CRE exposures.13
Commercial property prices in Norway and many other countries have risen substantially over a long period. Price statistics for prime office space in Oslo are an important indicator of price developments in the Norwegian CRE market. Commercial property selling prices are calculated as rents divided by yield. In autumn 2022, selling prices fell on the back of higher yields (Chart 2.9). In 2023 Q1, selling prices rose owing to higher rents, although yields remained unchanged according to price statistics.
Estimated selling prices for prime office space in Oslo. In thousands of NOK per square metre
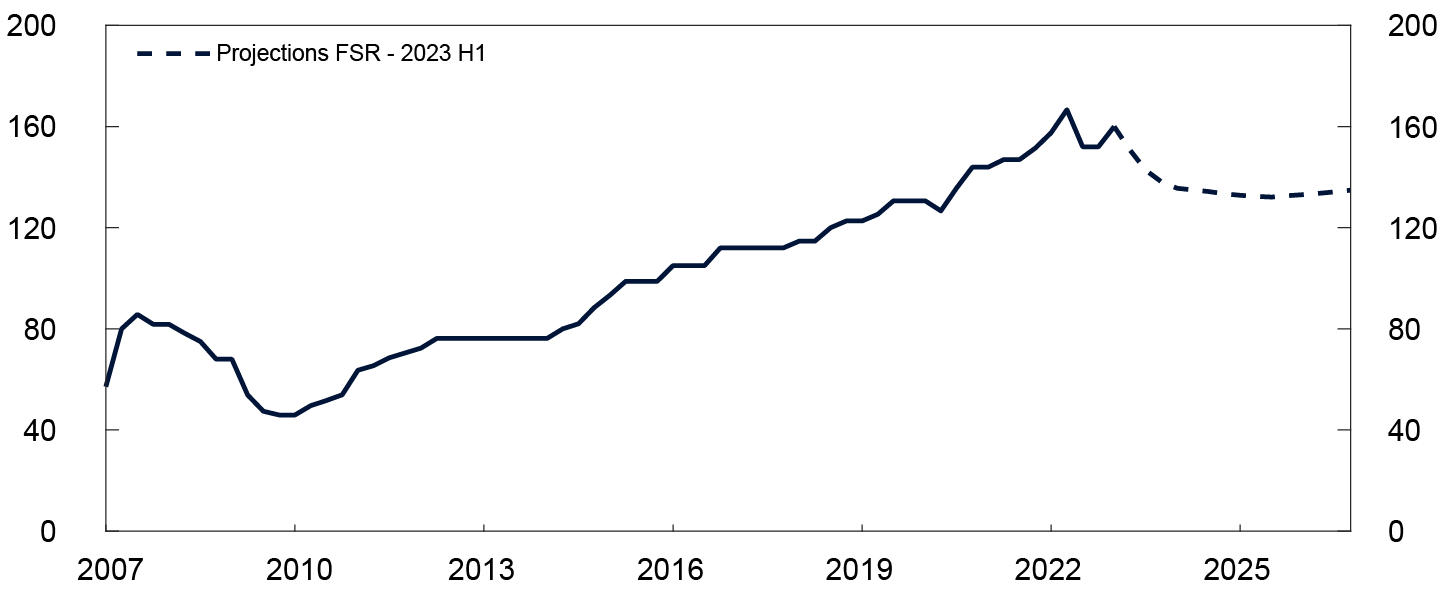
Since transaction volumes have been low since summer 2022, it is uncertain whether market prices have fallen more than indicated by price statistics. Investor surveys indicate a larger rise in the yield than in the price statistics.
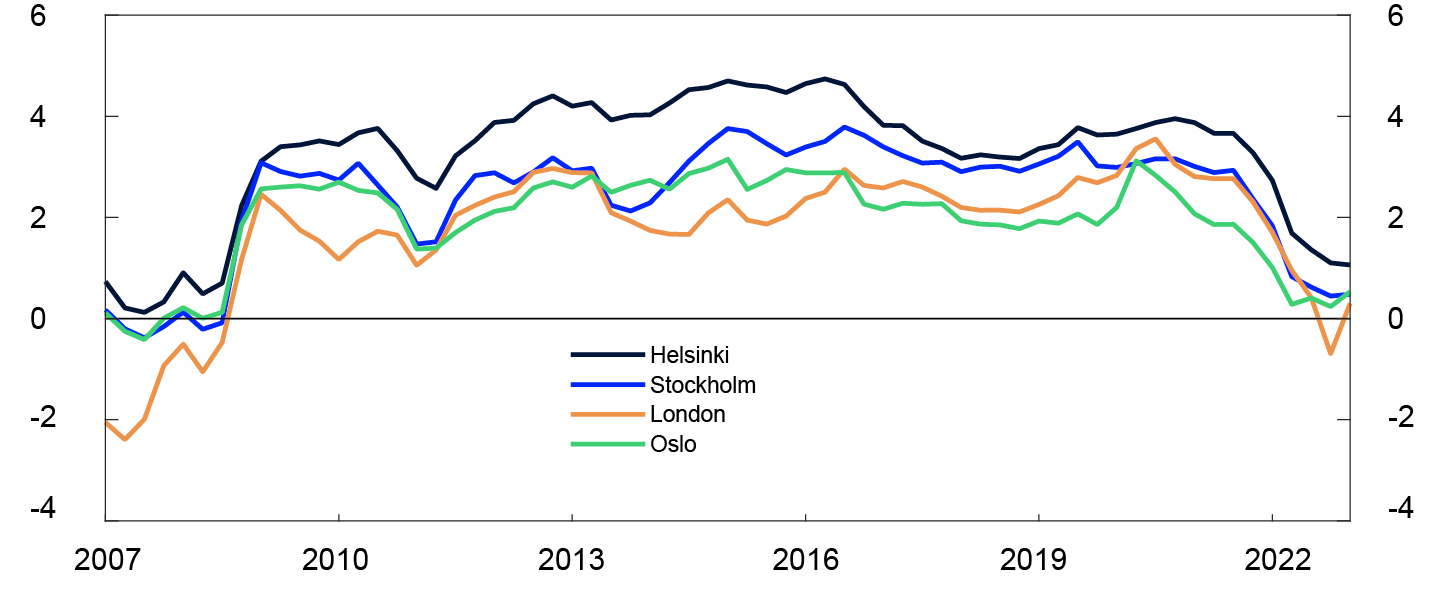
The yield depends on developments in long-term interest rates and risk premiums. Even though the yield in Oslo and other large European cities has edged up since summer 2022, it remains low compared with long-term interest rates (Chart 2.10). The yield is therefore expected to rise ahead.
Yield less five-year swap rate. Percentage points
The limited supply of new office buildings, high employment and high economic activity have sustained the rise in rents and dampened the fall in selling prices. Looking ahead, a moderate rise in rents is expected in line with slower growth in the Norwegian economy.
Norges Bank’s analyses show that given the strong rental market over the past two years and CPI lease adjustments, many CRE firms’ rental income is likely to rise in the years ahead (see "Higher rental income will enable many CRE firms to cover higher financing costs"). Simple sensitivity analyses indicate that most CRE firms will be able to cover the increase in financing costs out of current profitability.
Overall, the projections for the rise in rents and the yield indicate a decline in commercial property selling prices ahead. Commercial property prices are projected to be at pre-pandemic levels at the end of 2024, rising moderately thereafter.
Higher rental income will enable many CRE firms to cover higher financing costs
Rental income for CRE firms depends on developments in market rents and rents under existing leases, provided that the premises are let and tenants are able to pay rent. The average term of office leases is just under five years. High rent inflation over the past few years means that in the coming years, new leases will be entered into at higher rents than under expiring leases, even if developments in market rents are weak. Most rents under existing office leases are linked to the CPI. In isolation, this strengthens the debt-servicing capacity of many CRE firms in periods of high inflation. The Bank’s estimates show that in the period between 2021 and 2024, these factors may gradually contribute to an increase in rental income, by a total of about 20% for a typical CRE firm that rents out office space in Oslo.1
The increase in interest rates and higher risk premiums will gradually be phased into corporate cash flows in the years ahead. In the near term, changes in interest rates only affect interest payments on floating-rate debt. Higher credit premiums do not normally affect cash flows until the debt matures. Norges Bank’s calculations show that a typical CRE firm with high creditworthiness will experience an average interest rate increase of just over 2.5 percentage points in the period between 2021 and 2024. For several large office segment participants, this means more than a doubling of interest expenses over the period. Firms with low creditworthiness or a low proportion of fixed-rate loans are likely to experience a larger increase in the average interest rate on their debt.
Share of corporate group companies with a negative pre-tax profit. Percent
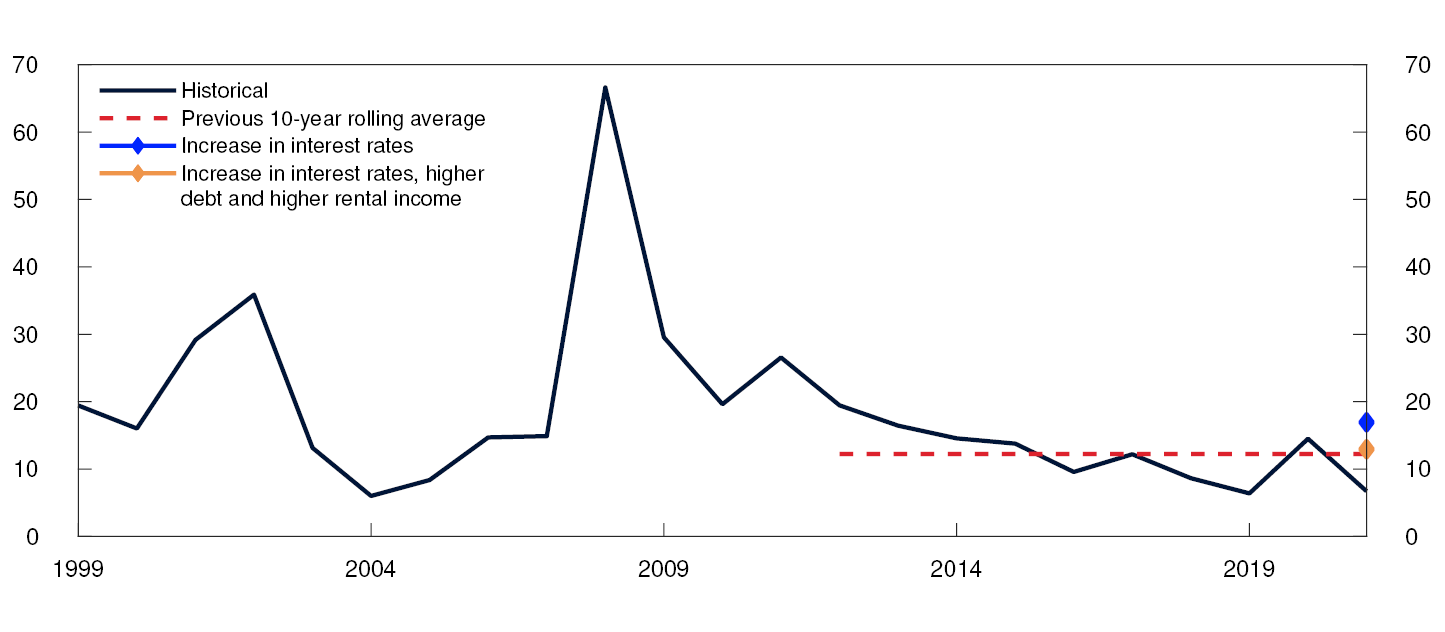
CRE firms’ profitability has been solid in recent years. In 2021, 7% of CRE firms’ total interest-bearing debt was held by corporate group companies with a negative pre-tax profit (Chart 2.11). This is at approximately the same level as in 2019, which was also low compared with previous years. The share can rise quickly, as during the financial crisis in 2008, when it was about 60%. A simple sensitivity analysis shows that 17% of the debt will be held by CRE firms whose profitability in 2021 was insufficient to meet a 4 percentage point average interest rate increase (Chart 2.11). If the estimated increase in debt levels and rental income in the same perid are also taken into account, this share falls to 13%, which is around the same level as the historical average for the past 10 years.
1 See Bjørland, C. (2023) “Næringseiendomsforetakenes refinansiering og kontantstrømmer i moderne dyrtid” [CRE firms’ refinancing and cash flows in inflationary times]. Staff Memo 11/2023 . Norges Bank (in Norwegian only, forthcoming in English). 2021 is the latest year consolidated financial reporting data for a large number of CRE groups was available. In this calculation, several simplifying assumptions are made, including a technical assumption of zero growth in market rents in 2023 and 2024.
2 Period: 1999–2021.
In the sensitivity analysis, the increase in interest rates is four percentage points, debt increases by 20% and rental income increases by 19%
A weak economy and increased market stress may result in a larger fall in prices and substantial bank losses
A number of factors may lead to a larger-than-anticipated fall in commercial property prices. Developments in rental prices largely depend on developments in employment.16 A more pronounced economic slowdown than envisaged may drive down rents and selling prices. Yields that are low relative to long-term interest rates increase the risk of a sharp fall in commercial property selling prices. Renewed periods of substantial market stress may lead to a higher risk premium and higher yields than assumed. An additional increase in long-term interest rates could also push up the yield further.
Bank debt accounts for the largest share of CRE firms’ debt, but bond debt has increased substantially over the past decade. A large amount of the bond debt will mature in the years ahead. Higher interest rates and risk premiums will then mean that rolling over bond debt will be considerably more costly than maturing debt. According to a new analysis from Norges Bank, firms with elevated refinancing risk account for just under one third of the bond debt outstanding.17
Norwegian banks have limited exposure to CRE firms with the weakest financial strength and elevated refinancing risk in the bond market. The analysis finds that banks' loans to CRE companies with elevated refinancing risk account for about 10% of their total CRE exposures, and a third of this in turn is to firms with the weakest financial strength. 18 The analysis also finds that CRE firms with bond financing as a whole have a weaker debt servicing capacity than firms with only bank loans. This reflects both a lower return on equity and a higher debt-to-income ratio for firms that have issued bonds. Although banks have limited direct exposure to firms that may find it difficult to roll over bond debt, rollover challenges may drive fire sales of properties. This may in turn lead to a more pronounced fall in commercial property prices and increase the overall credit risk on banks' CRE loans.
Potential structural changes within different CRE segments are also a source of uncertainty for future price developments. The longer-term effect of increased remote working on the office segment is still uncertain. So far, there are no signs that remote working has significantly weakened the demand for office space in Norway. Office vacancy rates in the largest Norwegian cities are low.19 Globally, however, office vacancy rates are higher in most countries than before the pandemic, despite strong labour market developments. Office vacancy rates have increased considerably in the US and were higher at the end of 2022 than during the 2008 financial crisis.20 Office vacancy rates have increased markedly in a number of the largest cities, and analyses by market participants indicate that the fall in office demand has been more pronounced in cities where commutes to work are longer.21
If a fall in commercial property prices leads to negative equity in mortgaged property, banks may incur losses if mortgages are defaulted on. However, the rise in commercial property prices since the financial crisis has not been matched by corresponding borrowing by CRE firms. On average this has pushed up CRE firms’ equity ratios, and the sector is better positioned to deal with price falls than previously. Stress tests conducted by Norges Bank show that in a severe economic downturn where commercial property prices are almost halved, banks’ losses on CRE exposures may be substantial (see Financial Stability Report 2022).
Climate risk and energy performance can affect selling prices
CRE is also exposed to climate risk. There is reason to believe that higher global temperatures will lead to more unstable weather conditions and thus to more property damage ahead.22 In the long term, the Bank’s analyses show that the current share of commercial property at risk of storm surges is considerable (see "Many commercial buildings are exposed to physical climate risk").
Another analysis by Norges Bank shows that a large share of commercial buildings has poor energy performance or uses less environmentally friendly energy sources.23 The costs for buildings with poorer energy performance may increase considerably when electricity prices are persistently high, which may make such buildings less attractive to prospective tenants. In the EU, minimum energy-efficiency standards for commercial and residential buildings are being developed for the years ahead. The actual wording of the final directive and how it will be transposed into Norwegian law are uncertain. The European Parliament’s draft directive requires all new residential and commercial buildings to be so-called zero-emission buildings by a set date. It also calls for the adoption of new energy efficiency classes for buildings in a few years’ time and for the eventual upgrade of existing buildings. There is considerable uncertainty about the scope of this work and the effect it may have on selling prices.
The information basis for CRE lending should be improved
Norges Bank and Finanstilsynet (Financial Supervisory Authority of Norway) are working to improve the information basis for analyses of systemic risk in the CRE sector, in light of the sector’s importance to the economy and financial stability. The volume of information has improved considerably in recent years24, but there is still a need for more comprehensive and up-to-date information on banks’ commercial property mortgages, such as an overview of the share of fixed rate CRE loans and maturity structures. In December 2022, the European Systemic Risk Board (ESRB) made a recommendation to the authorities in EU/EEA countries on monitoring and managing risk in commercial real estate.25
11 Period: 2015 Q1 – 2026 Q4.
2023 Q2 projection from FSR - 2023 H1. Mainland non-financial corporates.
12 Period: 2015 Q1 – 2022 Q4.
Norwegian listed companies, excluding financial institutions, companies engaged in oil production etc, companies registered abroad, companies without interest bearing debt and companies presenting incomplete financial reports.
13 See Andersen H. “Næringene som påfører bankene størst tap” [Sectors where banks incur the largest losses]. Blog post published on the Bankplassen blog 24 March 2023. Norges Bank (in Norwegian only).
14 Period: 2007 Q1 – 2026 Q4.
2023 Q2 projection for FSR – 2023 H1.
15 Period: 2007 Q1 – 2023 Q1.
Prime office space.
16 See Bjørland, C. and M. Hagen (2019) “What drives office rents?”. Staff Memo 12/2019. Norges Bank.
17 See Bjørland. C, “Næringseiendomsforetakenes refinansiering og kontantstrømmer i moderne dyrtid” [CRE firms’ refinancing and cash flows in inflationary times]. Staff Memo 11/2023 (in Norwegian only, forthcoming in English).
18 In the analysis, firms are identified with elevated refinancing risk in the bond market based on criteria related to the debt’s term to maturity. Heuristic criteria are used for the equity ratio in 2021 when assessing which groups have a relatively weaker financial position. If the CRE firm’s properties are carried at historical cost, the firm’s financial strength is assumed to be weaker if the equity ratio is below 25%. This criterion is set at 35% if CRE firm’s assets are carried at fair value.
20 See JLL's webpage.
21 See LaSalvia, T., N. Villa, C. Rosin and R. Rosas (2023) “Commute Times and Office Vacancy Rates in an Evolving Labor Situation”. Analysis published by Moody’s Analytics 7 April 2023.
22 Simpson, M.J.R., J.E.Ø. Nilsen, O.R. Ravndal, K. Breili, H. Sande, H.P. Kierulf, H. Steffen, E. Jansen, M. Carson and O. Vestøl (2015) “Sea Level Change for Norway. Past and Present Observations and Projections to 2100”. NCCS report no. 1/2015. Kartverket (The Norwegian Mapping Autority), Nansen Environmental and Remote Sensing Center and Bjerknes Centre for Climate Research.
23 See Bjørland, C., H. Solheim and B. H. Vatne (2022) “Behov for økt innsats på kartlegging og energieffektivisering av næringsbygg” [Need for stepped-up efforts to survey commercial buildings’ energy efficiency]. Blog post published on Bankplassen blog 9 November 2022. Norges Bank (in Norwegian only).
24 See eg Bjørland, C, I. N. Hjelseth, J. H. Mulelid, H. Solheim and B. H. Vatne (2022) “The Commercial Real Estate Market – no longer a black box”. Staff Memo 6/2022. Norges Bank.
25 See European Systemic Risk Board (2019) “Recommendation of the European Systemic Risk Board of 1 December 2022 on vulnerabilities in the commercial real estate sector in the European Economic Area” and European Systemic Risk Board (2019) “Recommendation of the European Systemic Risk Board of 21 March 2019 amending Recommendation ESRB/2016/14 on closing real estate data gaps”.
Many commercial buildings are exposed to physical climate risk
Real estate has always been exposed to physical risk from storms and other natural phenomena. Looking ahead, there is reason to believe that higher global temperatures will result in more unstable weather conditions and more damage to real estate. This may reduce bank collateral values and make certain properties more difficult to insure.
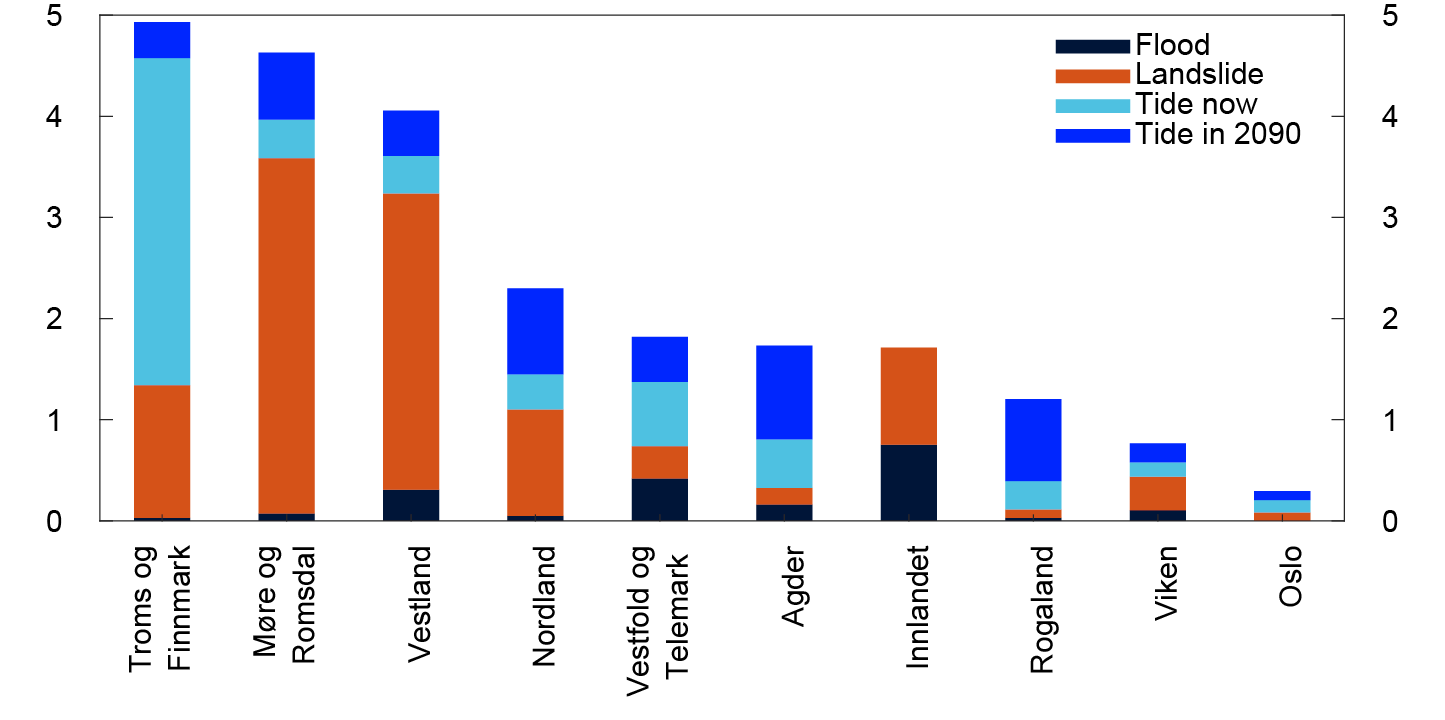
In an analysis, Norges Bank uses the Land Registry to identify properties pledged as collateral to banks and looks at how many of these properties are in risk zones for storm surges, floods, landslides and quick clay. The analysis distinguishes between residential and commercial buildings. The storm surge zones distinguish between the current situation and a scenario for 2090 where a sea level rise of between 50 cm and 80 cm has been assumed, depending on the location in Norway. The analysis assumes that current zones for flooding and landslides also represent future risk. In the long term, however, one could envisage a somewhat higher probability of landslides and avalanches owing to increased precipitation, but at the same time somewhat less probability of flooding because the volume of the spring snowmelt is smaller when snowfall is lower.
Residential properties are normally located at some distance from the sea and are therefore little exposed to storm surges. Instead, they are more vulnerable to avalanches and landslides. There are large regional differences (Chart 2.D). In relative terms, most exposed residential properties are in Troms og Finnmark and in Møre og Romsdal. The relatively large proportion of the housing stock in northern Norway that is located along the coast accounts for the high share of properties at risk of flooding there.
Share of square metres
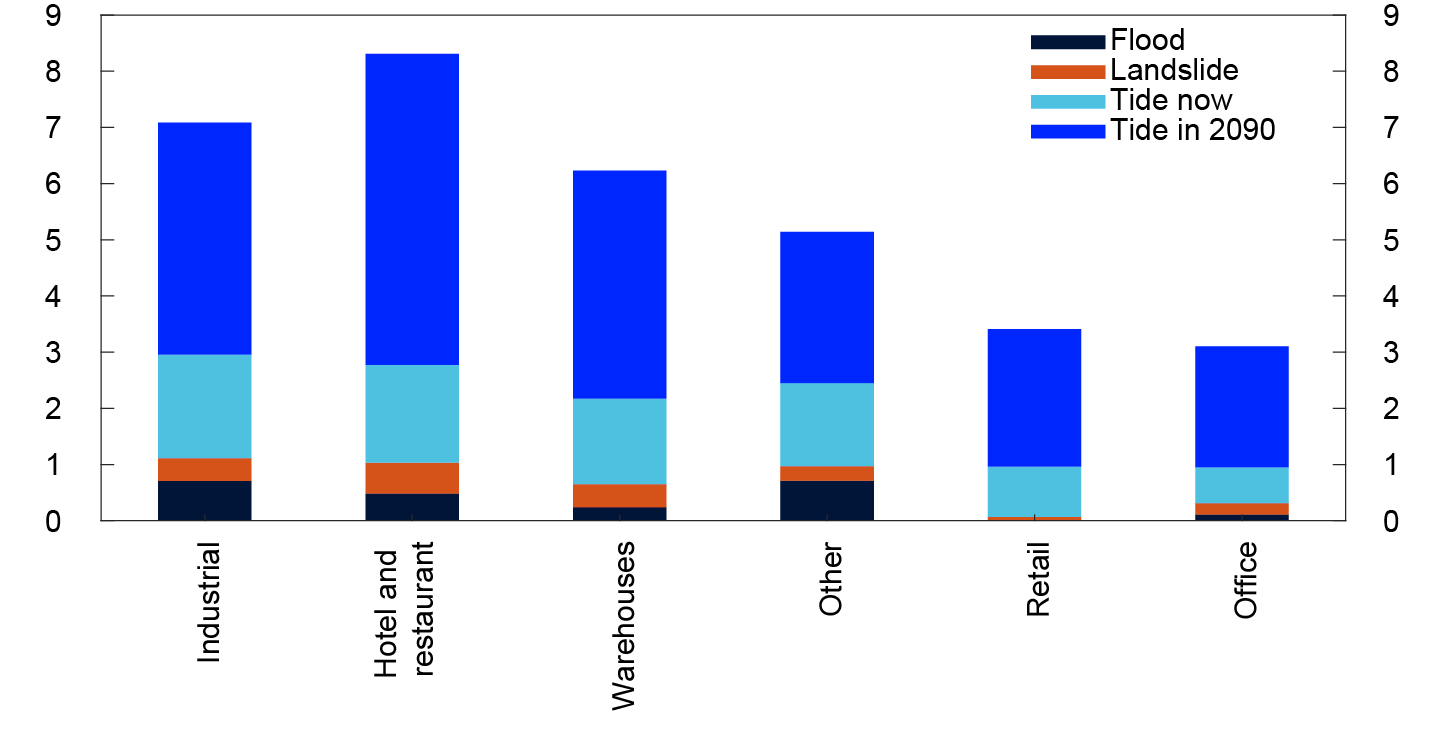
Commercial property is more exposed to storm surges. The share of commercial property currently at risk of storm surges in 2090 is substantial, which underlines the need for long-term planning and infrastructure improvements to meet climate challenges. Banks can contribute to this effort by setting requirements for CRE loans on properties in high-risk zones. Hotel, restaurant and industrial buildings are particularly vulnerable (Chart 2.E). Office buildings, which account for the largest part of banks’ lending, are typically located in cities and are less exposed.
Share of square metres
There are wide differences in the share of banks’ loans secured on buildings exposed to physical climate risk. A major storm surge or landslide may lead to loan losses for banks with large loan exposures to buildings in potential risk zones. For banks, this risk is mitigated by the fact that fire insurance for buildings also covers natural disasters. However, such insurance is not a guarantee against a fall in value if the probability of a natural disaster increases. Potential falls in value may increase banks’ credit risk for loans secured on vulnerable buildings.
2.3 Other financial system vulnerabilities
One bank’s funding is another bank’s liquidity reserve
Banks are interconnected through interbank exposures and common or similar securities portfolios. Close interconnectedness means that problems in one bank can easily spill over to other banks. At the same time, a high level of interbank cooperation in the money market is important for promoting the efficient distribution of liquidity and the transmission of monetary policy. Banks also have an important role to play as market makers, where they contribute to maintaining liquidity.
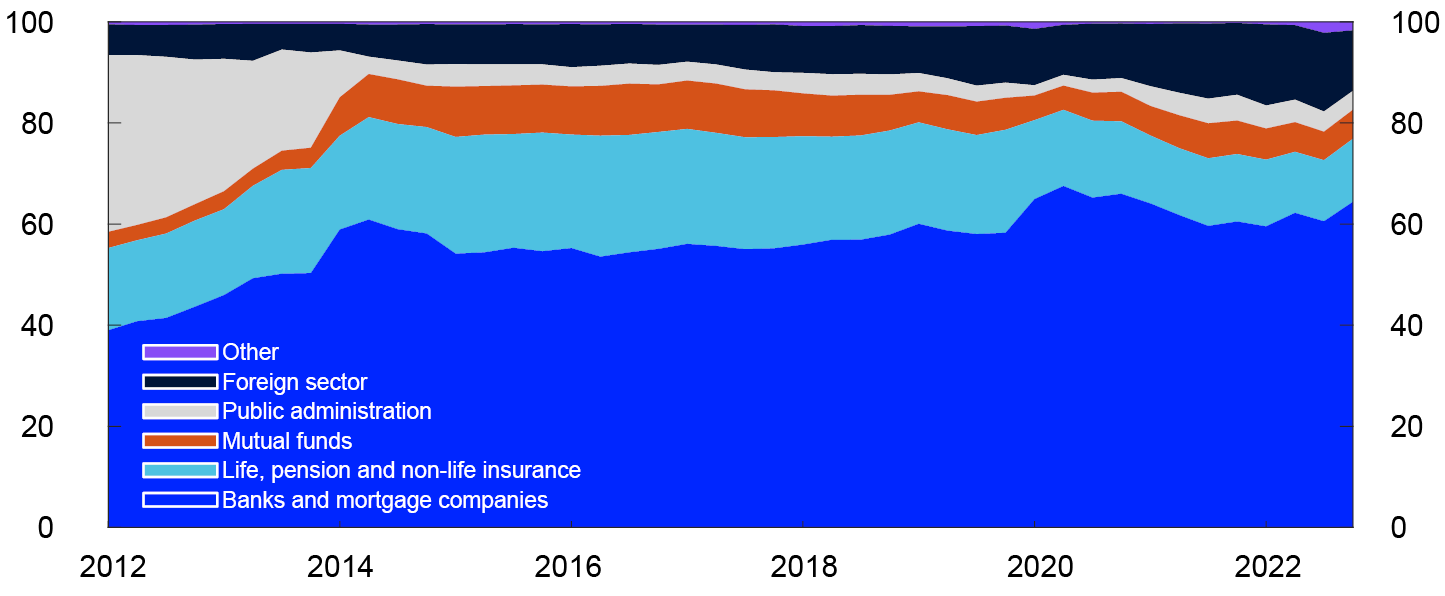
Covered bonds account for a substantial share of banks’ wholesale funding. At the same time, banks own close to 60% of outstanding covered bonds issued in NOK (Chart 2.12). Norges Bank’s market liquidity survey indicates that market participants regard the covered bond market as the most liquid bond market segment. The purpose of owning liquid securities is to enable banks to sell or pledge these securities if they have difficulties obtaining new funding. In the event of simultaneous fire sales of covered bonds by a large number of banks, prices may fall sharply. Since many banks hold the same or similar securities, the value of banks’ liquidity reserves may fall, weakening banks’ resilience to liquidity problems.
Ownership breakdown of bonds issued by Norwegian mortgage companies in NOK. Percent
In recent years, the composition of Norwegian banks’ liquidity reserves in NOK has changed somewhat. The share of covered bonds in banks’ liquidity reserves has fallen from about 55% to just under 50% (Chart 2.13). The fall in the share of covered bonds has been matched by a higher share of securities issued in NOK by multilateral development banks, foreign public sector companies and foreign local governments.
Norwegian banks’ liquidity reserves by securities type
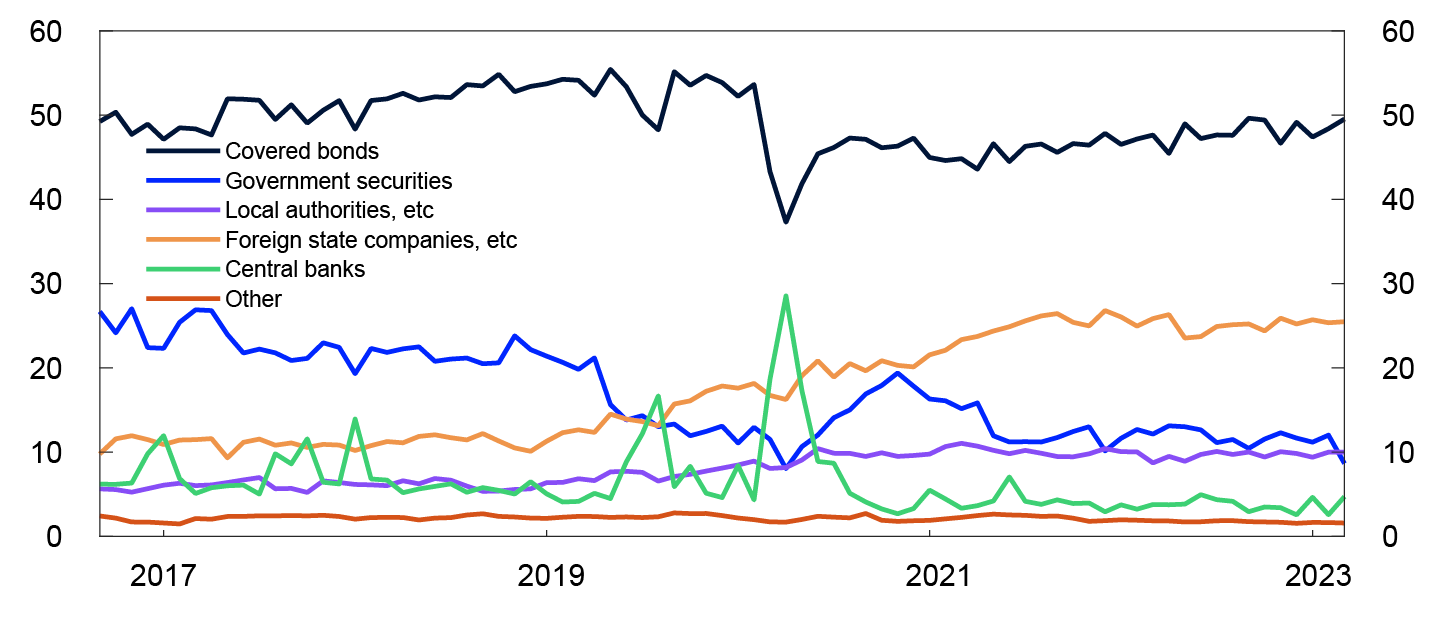
Owing to the high proportion of covered bonds in banks’ liquidity reserves, marketability and value preservation in the covered bond market are important for banks’ ability to sell such securities.
Covered bonds are primarily secured on residential mortgage loans, where losses have historically been low.28 Overcollateralisation, where the value of the cover pool exceeds the value of covered bonds issued and a relatively low average loan-to-value (LTV) ratio means that house prices must fall considerably before the collateral values are lower than the bonds’ face value (see Financial Stability Report 2022).
Under the Liquidity Coverage Ratio (LCR) rules, covered bonds are subject to a 7% haircut, which enables banks to absorb a fall in value and still have sufficient liquid assets in a hypothetical stress situation. At the same time, there is limited experience with how easily covered bonds can be traded and issued, or how well their value will hold up in the event of a fall in house prices.
Major cyber attacks may threaten financial stability
The number of serious cyber attacks on the financial sector has increased in recent years. As threat actors have become more sophisticated and specialised, cybercrime is becoming more complex and difficult to defend against. The Norwegian National Security Authority (NSM) points out that vulnerable supply chains are increasingly being subjected to targeted attacks.
In serious cases, attacks against individual institutions may have repercussions for the financial system as a whole. This applies especially to entities that perform critical functions, which means a need for institutions to be resilient to cyber attacks at both individual entity and system levels. So far, however, cyber attacks have not given rise to financial crises in Norway or globally.
Cyber attacks are being extensively used in the war in Ukraine. So far, there has not been an increased number of serious attacks against the Norwegian financial system. Nevertheless, the threat landscape has become more unpredictable and difficult to gauge. The threat landscape is now approximately the same as in 2022. A more detailed discussion of the threat landscape will be provided in the forthcoming Financial Infrastructure Report 2023, which will be published on 25 May 2023.
The geopolitical situation, a rising number of cyber attacks in recent years and the high degree of digitalisation in society have highlighted the need for comprehensive cross-sector preparedness work. The Norwegian financial sector has a long tradition of cooperation between key actors in both private and public sectors. In the field of cyber resilience, cooperation is coordinated by the Nordic Financial CERT (NFCERT).29 Norges Bank is working with Finanstilsynet to introduce cyber resilience testing based on the Threat Intelligence-based Ethical Red Teaming framework in Norway (TIBER-NO) and is promoting knowledge-sharing between private entities through the TIBER-NO Forum.
26 Period: 2012 Q1 – 2022 Q4.
27 Period: September 2016 – March 2023.
Foreign state companies also include local authorities and development banks, etc.
28 See Andersen H. (2023) “Næringene som påfører bankene størst tap” [Sectors where banks incur the largest losses]. Blog post published on the Bankplassen blog 24 March 2023. Norges Bank (in Norwegian only).
29 Nordic Financial CERT (NFCERT) is a non-profit organisation in the Nordic financial sector. Its purpose includes sharing threat intelligence and information about vulnerabilities and assisting financial institutions in dealing with cyber attacks (see NFCERT’s website).
3. Financial institutions
Norwegian banks are solid, liquid and highly profitable. The market stress owing to the problems at some banks abroad has not led to funding difficulties for Norwegian banks, and a rapid rise in interest rates has not led to an increase in losses either. A severe economic downturn can lead to substantial bank losses, but Norwegian banks are well positioned to cope with market stress and an increase in losses. The recent wave of financial market stress has not had any significant repercussions for asset managers in Norway.
Financial institutions perform important tasks in the economy. They provide saving, financing and payment services and products, and they redistribute risk (see Norway’s financial system 2022). To be able to perform these economically important tasks also in periods of market stress and increased losses, the public must have confidence in financial institutions and their resilience.
3.1 Bank funding and liquidity
The turbulence in financial markets has not led to funding problems for Norwegian banks
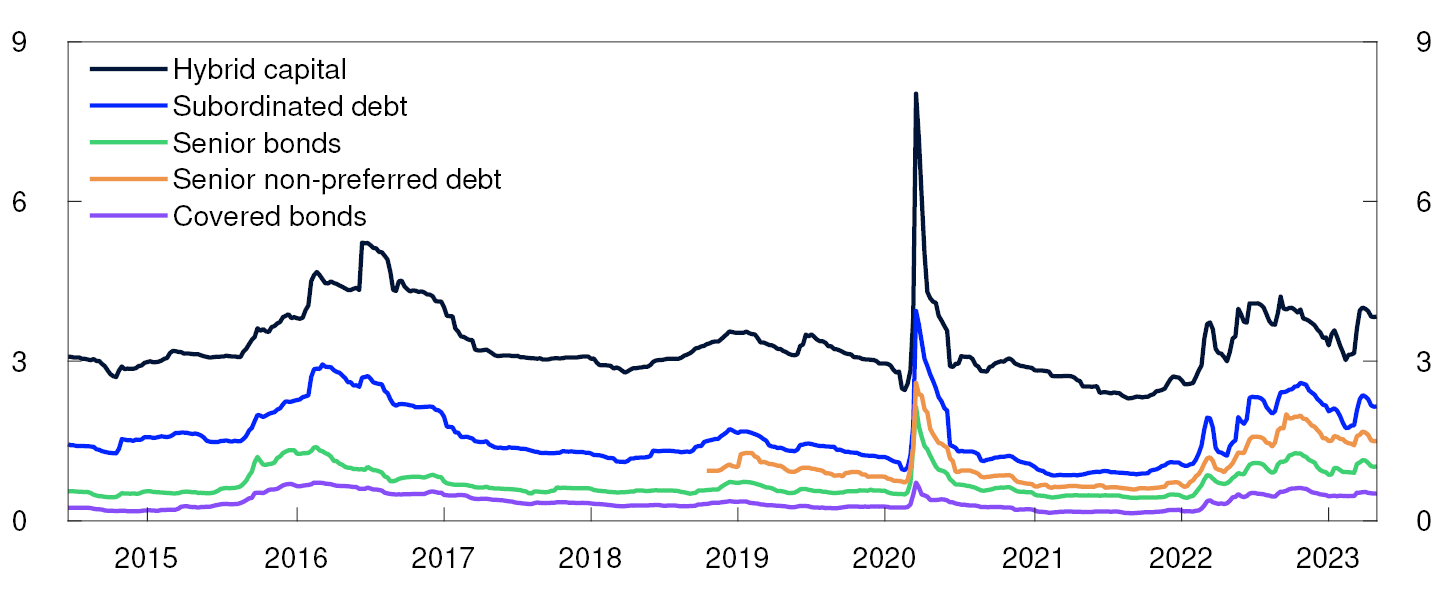
Over the past six months, there has been considerable volatility in international financial markets, which in March was heightened by problems at certain US and Swiss banks (see Section 1 for a further discussion). Risk premiums on Norwegian banks’ long-term wholesale funding have edged up so far this year (Chart 3.1), with a rise in premiums on Additional Tier 1 (AT1) capital in particular. It is likely that the increase was further amplified by the write-down of AT1 securities ahead of equity capital prior to UBS’s acquisition of Credit Suisse in March. The risk premiums on AT1 instruments have since edged down and are now closer to the levels prevailing at the time of the publication in November 2022, while the risk premiums on banks’ other wholesale funding are somewhat lower. The risk premiums are higher than prior to the outbreak of the war in Ukraine.
Percentage points above three-month Nibor
Norwegian banks have already covered a good portion of this year’s refinancing needs. This increases their resilience if financial market stress flares up again. Nor were there abnormal deposit withdrawals from Norwegian bank in the wake of banking market stress in the US and Europe.
Banks’ deposit funding has increased but is diversified
Customer deposits are the most important funding source for Norwegian banks. Through the pandemic, total bank deposits rose by over NOK 600bn and reduced banks’ needs for wholesale funding. Customer deposits now account for 42% of total bank funding, compared with 39% at the end of 2019 (Chart 3.2).
Percent
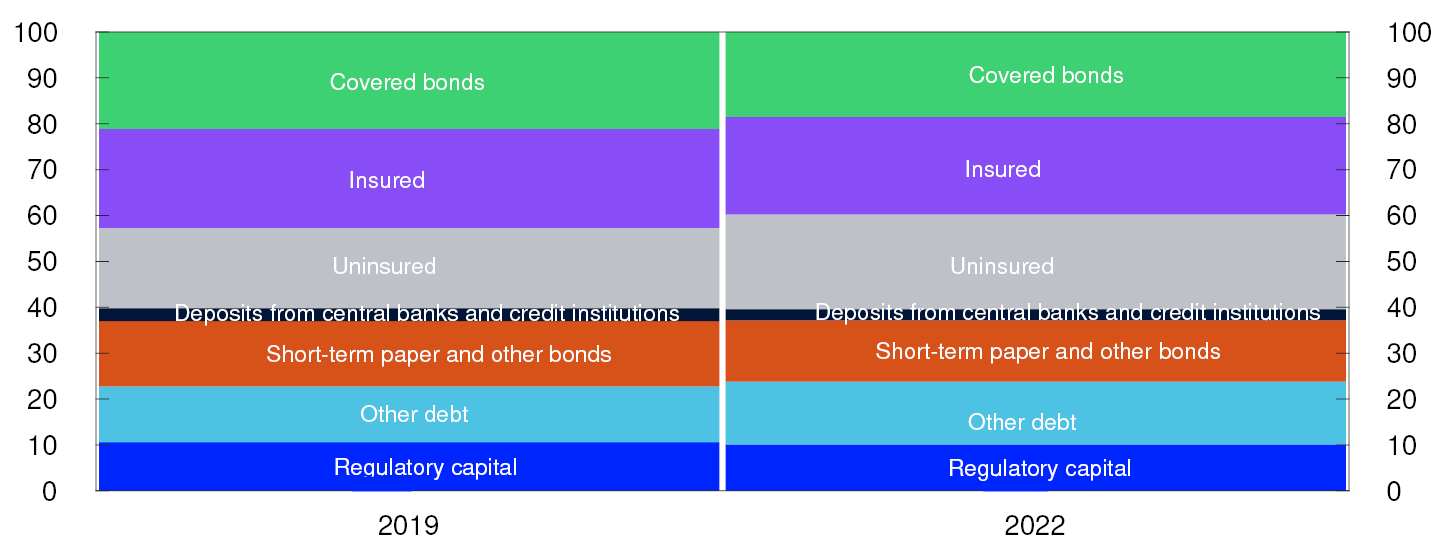
Customer deposits, particularly those covered by the deposit guarantee scheme, are viewed as a stable funding source that reduces banks’ liquidity risk. In Norway, the deposit guarantee scheme covers deposits of up to NOK 2m per depositor per bank. The guarantee also applies to larger amounts if the funds were deposited in the course of the previous 12 months following a particular life event, such as a home sale or insurance payout.
Around 90% of household deposits and 30% of corporate deposits with Norwegian banks are covered by the deposit guarantee scheme. Overall, around half of customer deposits are insured, down from 55% at year-end 2019. Most of the corporate deposits are demand deposits, which can be withdrawn without prior notice. Moreover, corporate deposits with the largest Norwegian banks are well-diversified across industries, both as a whole and for individual banks (Chart 3.3). This reduces the risk that problems in individual sectors lead to large withdrawals.
Deposits by sector and industry. At 31 December 2022. Percent

Liquidity requirements help to mitigate banking sector risk
Banks extend loans with long maturities and receive deposits that can often be withdrawn without prior notice. This maturity transformation enables banks to give depositors immediate access to their savings while allowing them to lend at long maturities, which is fundamental to traditional banking. Maturity transformation entails a liquidity risk because portions of banks’ assets have longer maturities than their liabilities. Thus, banks may find it difficult to replace withdrawn deposits or roll over maturing wholesale funding without incurring substantial additional costs. Bank regulation is especially designed to help minimise the risk of deposit run-offs and the inability to roll over wholesale funding.
Under the Liquidity Coverage Ratio (LCR) requirement, banks must hold sufficient liquid assets to meet their liquidity needs for a 30-day period of deposit run-offs and financial market stress. The purpose is to enable banks to sell or pledge liquid assets if they experience difficulty rolling over funding. In the stress scenario, it is assumed that there will be large withdrawals of deposits not regarded as stable, so that banks must hold more liquid assets if they use such deposits to fund their lending. The LCR is accounted for at fair value and is subject to a haircut that reflects the assumed loss of value in the event of market stress.
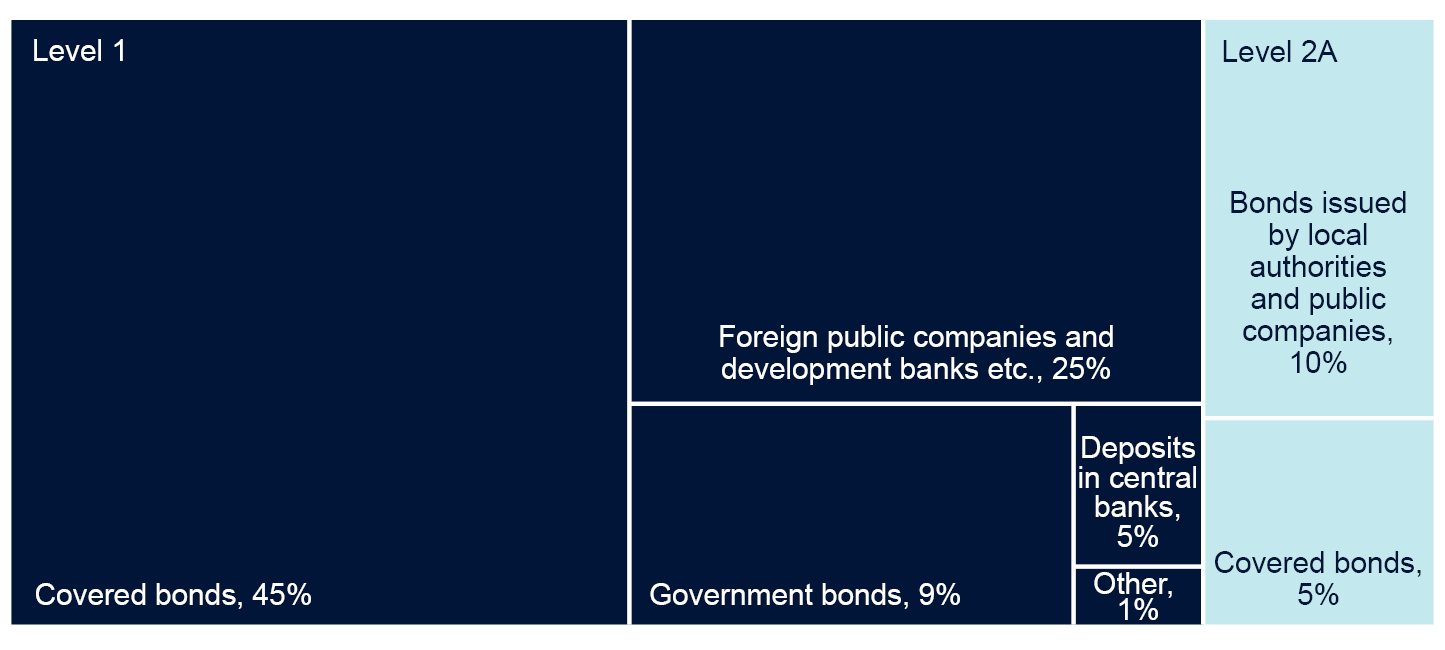
Norwegian banks’ liquidity reserves in NOK primarily comprise covered bonds and sovereign and government-guaranteed securities (Chart 3.4). For a further discussion of covered bond exposures in banks’ liquidity reserves, see "One bank’s funding is another bank’s liquidity reserve". The interest rate risk of Norwegian banks’ liquidity portfolios is low, which means they are less exposed to losses when market interest rates rise. Most of the covered bonds and securities issued by foreign state enterprises and development banks are floating-rate instruments. Sovereign securities are mostly fixed rate, but fixed rates are largely swapped for floating rates by using interest rate derivatives to hedge against interest rate risk. In addition, the securities in liquidity portfolios are relatively short dated, with a large share maturing within three years, which means that the securities will be less sensitive to interest rate changes compared with longer maturities. Besides being readily saleable on account of their liquidity and safety, the securities in banks’ liquidiy portfolios are also usually eligible as central bank collateral, which provides additional assurance.
NOK liquidity portfolio by asset type. At 31 March 2022. Value after haircut. Percent
The Net Stable Funding Ratio (NSFR) requirement is intended to ensure that banks finance illiquid assets, such as loans, with stable funding. This reduces banks’ risk of having to frequently roll over funding. Equity capital and bond debt with residual maturity over one year, along with guaranteed deposits and deposits from small and medium-sized enterprises (SMEs), are regarded as stable funding. The NSFR limits the ability of banks to fund illiquid assets with volatile deposits and short-term loans.
Norwegian banks satisfy both the LCR and NSFR requirements by an ample margin. However, liquidity regulation does not eliminate all liquidity risk, and a bank may experience liquidity problems if a large number of customers withdraw their funds at the same time. A simple stress test shows that if 5% of the insured deposits are withdrawn and other payouts are as in the LCR requirement, half of banks’ uninsured deposits can be withdrawn before the liquid resources are depleted.5 Withdrawals can be significantly higher if the bank loses the confidence of its customers.
Confidence in banks is fundamental to deposit stability
A loss of confidence and subsequent bank run were the primary reasons for the problems arising at Silicon Valley Bank, Signature Bank, Credit Suisse and First Republic Bank. Well-capitalised, cost-efficient and profitable banks lessen the risk of a similar event occurring in Norway. This creates confidence in banks, at the same time as they are strictly regulated and subject to effective supervision. Banks must also ensure proper risk management. Furthermore, banks are required to publish disclosures that enable market participants to assess risk profile, capitalisation and governance and control (Pillar 3 disclosure requirements). This contributes to market discipline and makes it easier for investors to assess banks’ risks. On the other hand, deposits are not reported in a standardised format. In order to better facilitate market participants’ assessment of the funding risk of banks’ deposits from different industries, the financial industry should agree on a standardised deposit reporting system that includes industry breakdown and size of individual deposits. Transparency of a bank’s governance, risk profile and financial position can make an important contribution to ensuring confidence in banks, which is fundamental to deposit stability.
1 Period: Week 25 2014 – week 18 2023.
Premiums on bonds issued by large banks and mortgage companies in the Norwegian market. 5-year maturity.
2 At 31 December 2019 and 31 December 2022. All banks and mortgage companies excluding branches and subsidiaries of foreign banks in Norway.
3 Deposits excluding retail deposits. Aggregated for the seven largest Norwegian banks: DNB Bank, Sparebank 1 SR-Bank, Sparebank 1 SMN, Sparebank 1 Østlandet, Sparebanken Vest, Sparebank 1 Nord-Norge and Sparebanken Sør.
4 Norwegian banks and covered bond mortgage companies. Level 1 assets are very high-quality liquid assets. Level 2 assets are high-quality liquid assets. Level 2 assets are divided further into levels 2A and 2B. At least 60% of liquid assets shall comprise level 1 assets and at least 30% of liquid assets shall comprise level 1 assets excluding covered bonds. Up to 15% of liquid assets may comprise level 2B assets.
5 For the seven largest Norwegian banks as a whole.
3.2 Profitability
Improved bank profitability
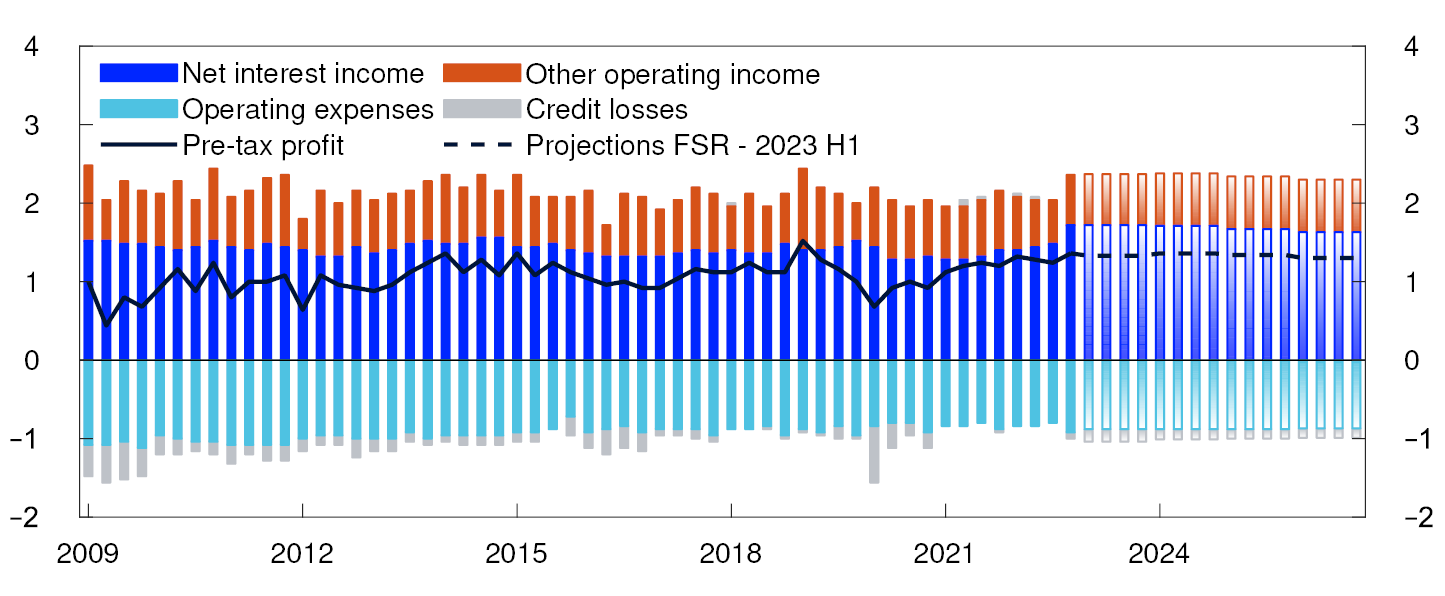
Bank profitability has improved since 2020 Q1. At that time, higher credit loss provisions early in the pandemic pulled down profits (Chart 3.5). Losses proved to be lower than expected and the credit loss provisions have partly been reversed. This has boosted profitability. In addition, banks’ net interest income has risen since interest rates began to rise in 2021. The solid results in 2022 Q4 pulled up return on equity for 2022 to 12.7% for the largest banks (Chart 3.6).
Income statement items as a percentage of average total assets
Return on equity after tax. Percent
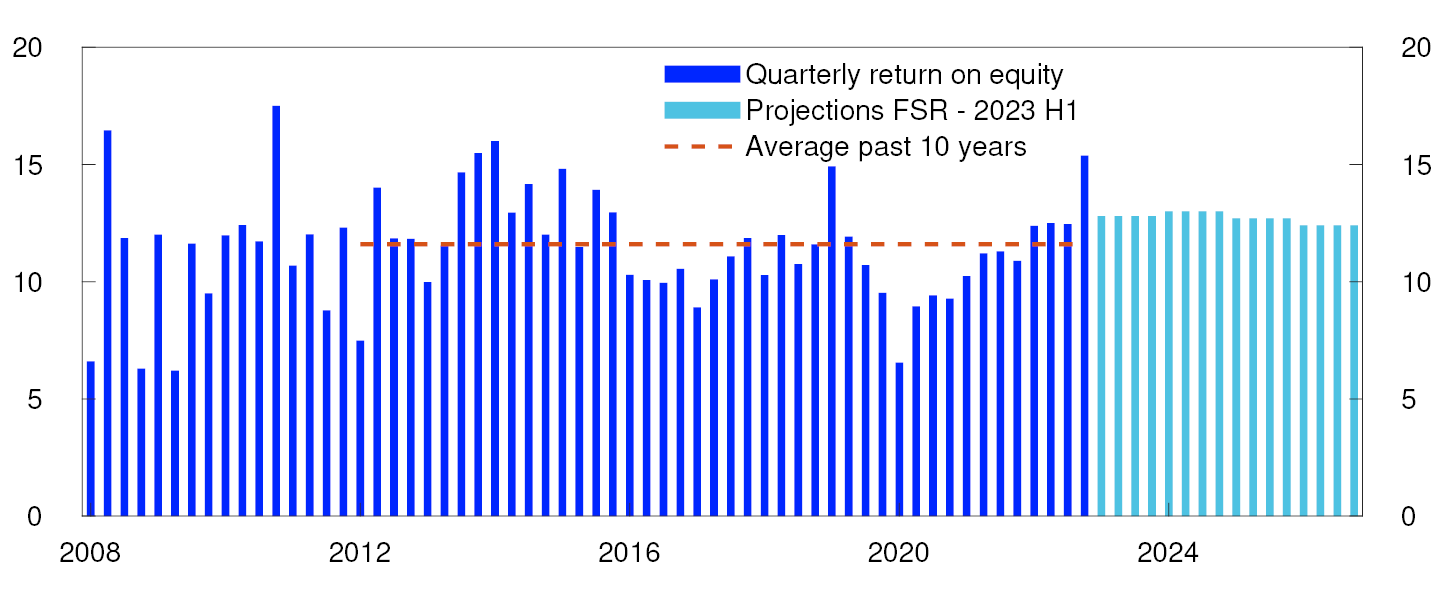
Based on the economic forecasts in Monetary Policy Report 1/23, net interest income is projected to remain at a high level and losses to be modest in the projection period to the end of 2026. Consequently, banks’ return on equity is expected to be high, close to 12% in the coming years (Chart 3.6). European banks have also increased their profitability since interest rates started to rise in 2021. Profitability is being driven by increased net interest income. In recent years, the profitability of Norwegian and Swedish banks has been higher than the average for European banks.
Net interest income has increased as interest rates have risen
Net interest income is banks’ main source of revenue (see "Interest margin and net interest income" for a definition). Net interest income broadly moves in tandem with the interest margin (Chart 3.7).
Percent and percentage points
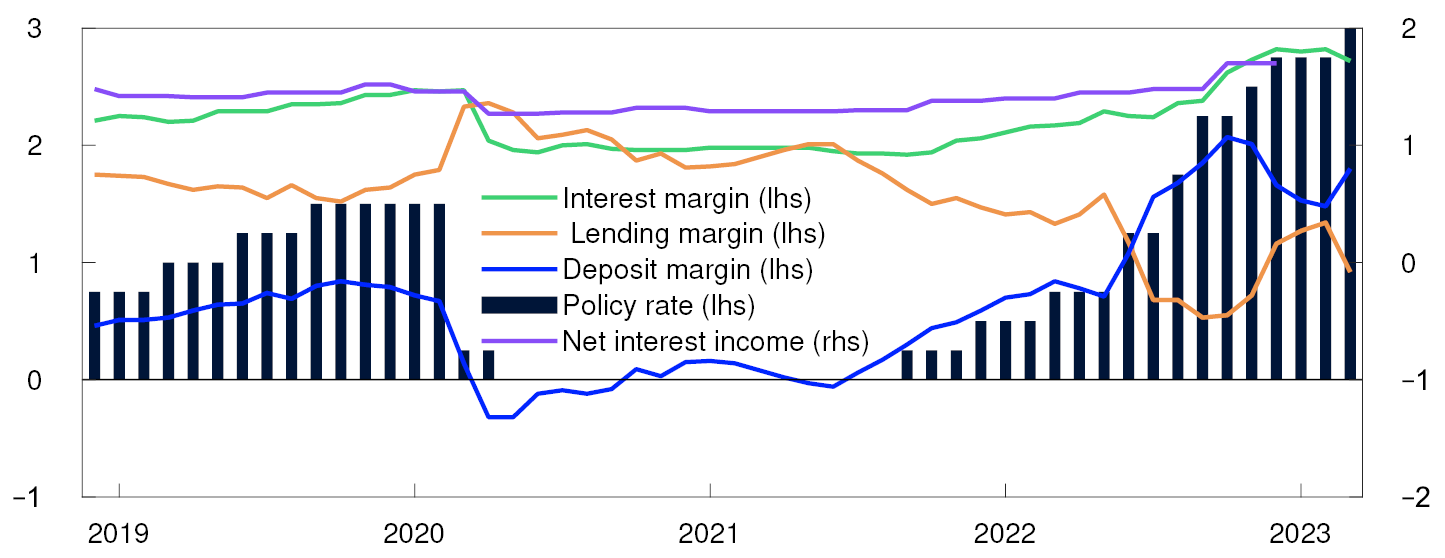
Since interest rates started to rise in autumn 2021, the deposit margin and the interest margin have increased (Chart 3.7), while the lending margin has declined. The increase in the deposit margin can be viewed as a normalisation after a period of very low interest rates. The deposit margin may increase less or decline ahead, amid stronger competition for customer deposits to keep them from being moved.
The lending margin covers banks’ costs of lending, ie expected losses, funding costs (borrowing costs), operational costs and a profit element for the bank. Mortgages and other loans with low credit risk that are small, similar and issued in large numbers are simple to price. This increases competition and lowers the lending margin on residential mortgages. Expected losses on corporate loans are often higher (higher credit risk), which requires more tailored evaluation and processing. The lending margin for business loans are therefore often higher than for mortgages.
Customer deposits along with bond debt constitute banks’ debt funding. The price of bond funding is determined as a premium above the money market rate, and owing to a floating rate, the cost changes when the money market rate changes. Deposit rates are ordinarily lower than the money market rate, but they do not change automatically when the money market rate changes. A high deposit margin results in a substantial cost saving for banks that fund their activities with deposits rather than bonds. The deposit margin covers the cost of accepting deposits and a profit element to the bank.
Interest margin and net interest income
The interest margin can be divided into a lending margin and a deposit margin. The lending margin (the lending rate less the money market rate) expresses how much the bank earns on loans funded at an interest rate equal to the money market rate. The deposit margin (the money market rate less the deposit rate) shows how much the bank earns on deposits if they are remunerated at an interest rate equal to the money market rate. The interest margin expresses what the bank earns on deposits that are lent to customers.
Banks’ net interest income is equal to interest income less interest expense. To simplify the comparison between banks and over time, net interest income is often normalised by calculating it as a percentage of total assets.
Interest income comprises interest on loans and fixed-income securities (bonds and short-term paper) held by the bank. Interest expense comprises interest on deposits and on fixed-income securities that the bank has issued. The premium for the Norwegian Banks’ Guarantee Fund is also included in interest expense.
Current earnings are the first line of defence against losses
Current earnings enable banks to cover losses before they begin to operate at a loss and need to draw on capital. Banks’ net interest income is projected to be high in the coming years (Chart 3.5).
Given net interest income as in 2022, banks as a whole will be able to absorb an estimated credit loss in 2023 of just over 2% of banks’ gross lending without drawing on capital (Chart 3.8). Banks will be able to absorb a loss of around 2.5% of their exposures before breaching the capital requirements.
Combinations of net interest income and losses that result in zero overall earnings for the largest banks
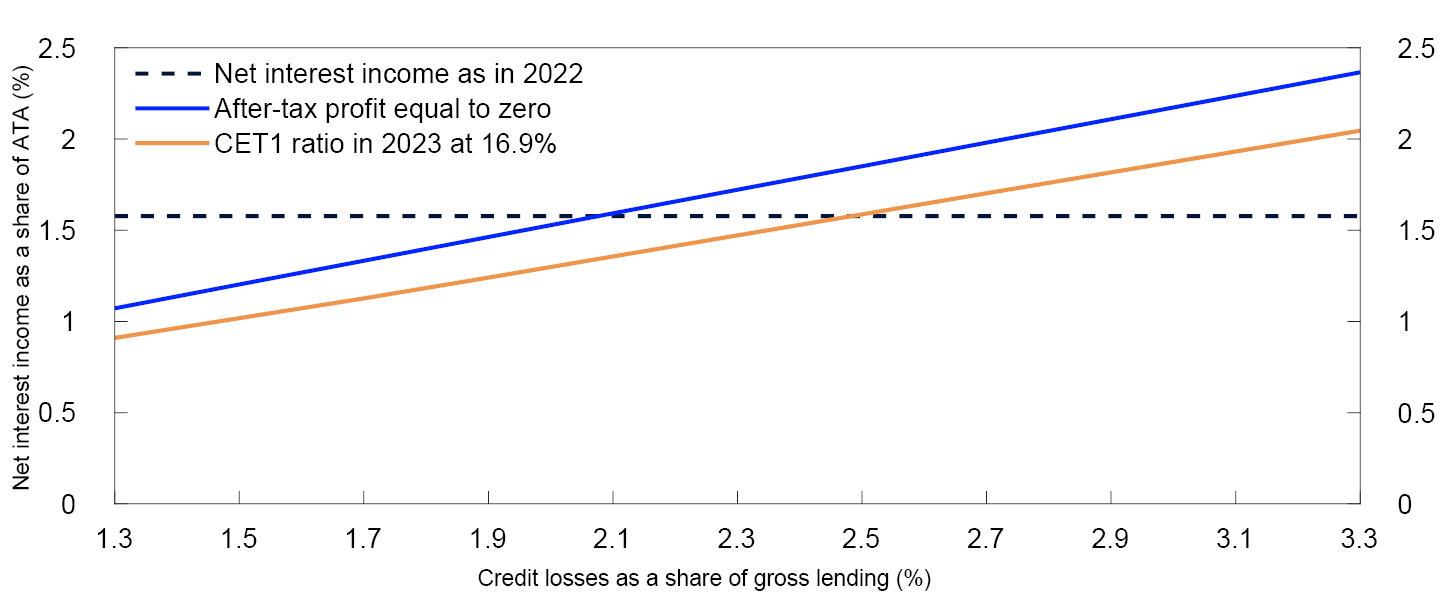
A reduction in net interest income may be caused by reduced interest margins. When lending or deposit-taking are highly profitable, banks have an incentive to compete on price. When lending and deposit-taking in Norway are highly profitable, foreign financial institutions may seek to offer services in Norway. Over time, margins on deposits and lending may therefore adjust so that banks’ profitability edges down. Owing to strong competition among banks, increased operating costs can only partially be compensated by increased lending or deposit margins. There is therefore an incentive to increase efficiency and reduce costs. Another cause of reduced net interest income is market stress. Market stress may increase interest expenses more than interest income.
Banks’ earnings are little affected by changes in securities prices
The rise in interest rates has resulted in a fall in the market value of fixed-rate loans and bonds. If bonds are carried at amortised cost, this fall in value will not appear in the financial statements. Norwegian banks primarily hold floating-rate loans and fixed-income securities, and they also fund their activities at floating rates. Norwegian banks’ interest rate risk is therefore low compared with banks in jurisdictions where fixed-rate loans are the norm and a large portion of banks’ assets are fixed-rate instruments.
Banks may carry financial assets either at amortised cost or at fair value (see "Accounting value of banks’ financial assets"). Gains and losses on financial assets carried at fair value affect banks’ earnings and capital adequacy, also when the assets are not sold. Banks and mortgage companies held fixed-income securities with a total face value of around NOK 820bn at year-end 2022. The vast majority of these are carried at fair value. Most of banks’ fixed-income securities, around NOK 680bn, are held to meet unforeseen liquidity needs. Along with little proprietary trading in financial instruments, liquid, safe securities carried at fair value reduce the potential for losses on securities portfolios. The capital requirement for market risk for Norwegian banks is therefore low (see discussion in "The capital requirement for market risk accounts for a small share of total capital requirements").
Accounting value of banks’ financial assets
International Financial Reporting Standard (IFRS) 9 Financial instruments contains rules for classification and measurement of financial assets. Financial assets may be classified as measured at amortised cost or at fair value. Under IFRS 9, the method chosen depends on the contractual terms for the financial assets and on the management of the portfolio the assets are held in. Banks’ financial reporting discloses the criteria used to classify assets according to the two alternatives.
Financial assets measured at amortised cost, such as loans or bonds held to maturity, are measured at the asset’s original carrying amount discounted by expected credit losses and principal payments. The market values of such assets may deviate from their carrying amounts, and the financial statements contain note disclosures on the deviation between carrying amounts and fair value.
Fair value is closely related to market value, ie what the asset can be sold for. Fair value may be determined on the basis of observable market transactions or a pricing model. If the pricing model relies on unobservable inputs, assumptions other than market inputs are applied.
Gains or losses from changes in the fair value of assets will affect earnings. IFRS 9 permits recognition of fair value changes in profit and loss or in other comprehensive income.
Bank losses are expected to edge up
Losses ahead are projected to edge up and hover around the average for the past 20 years (Chart 3.9). At the end of 2022, bank losses from property management and construction exposures rose (Chart 3.10). However, figures for some of the largest banks indicate that losses were lower in 2023 Q1.
Credit losses as a share of lending. Annualised. Percent

Percent
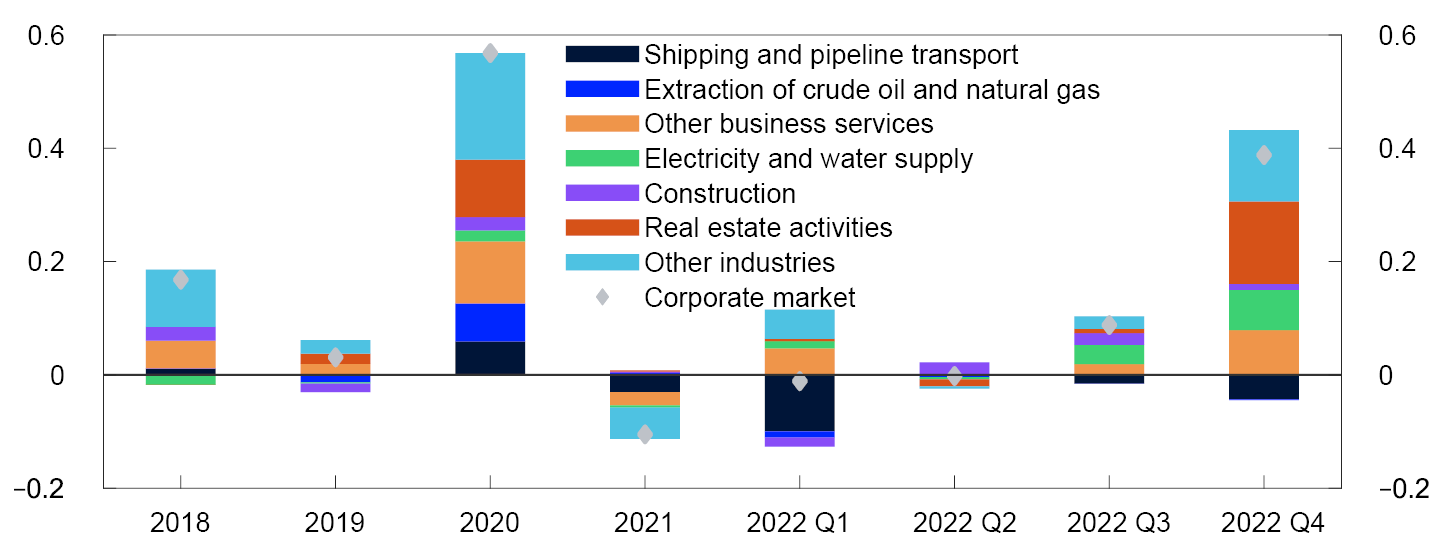
A large portion of banks’ lending is to commercial real estate (CRE) firms, which are typically highly indebted and vulnerable to falling revenue and higher interest rates. Banks’ high CRE exposures are a key vulnerability in the Norwegian financial system. Commercial property prices in Norway have risen markedly over a lengthy period. We expect property prices to fall in response to higher interest rates (see Section 2). This will push up bank losses somewhat. Owing to heightened uncertainty surrounding the economic outlook and low yields relative to financing costs, the forecast is more uncertain than usual. Weak economic developments and increased market stress may trigger a steeper fall in prices and lead to considerable bank losses.
However, thanks to rapidly rising rents over the past few years and consumer price indexing of leases, many CRE firms will likely manage to cover their funding costs out of current profitability. The Bank’s analyses show that banks have limited exposures to CRE firms whose bond refinancing risk is elevated and financial position is weakened (see further discussion in Section 2).
6 Period: 2009 Q1 – 2026 Q4.
Projections from 2023 Q1 for FSR – 2023 H1. The values refer to the seven largest Norwegian-owned banking groups.
7 Period: 2008 Q1 – 2026 Q4.
Projections from 2023 Q1 for FSR – 2023 H1. Return on equity after tax for the seven largest Norwegian-owned banking groups.
8 Period: December 2018 – March 2023.
Interest margin, lending margin and deposit margin for a sample of banks and mortgage companies in Norway. Net interest income as a percentage of average total assets for the seven largest Norwegian-owned banking groups.
9 The chart shows the size of losses that the seven largest banking groups can cover with current earnings before they collectively begin to draw on the buffers. The calculations apply to 2023. ATA (Average total assets).
10 Period: 1987 Q1 – 2026 Q4.
All banks and mortgage companies in Norway. Projections from 2023 Q1 for the macro bank, which is a weighted average of DNB Bank, SpareBank 1 SR-Bank, Sparebanken Vest, SpareBank 1 SMN, Sparebanken Sør, SpareBank 1 Østlandet and SpareBank 1 Nord-Norge.
11 Years for 2018–2021. Annualised quarterly data from 2022 Q1. The figures apply to the seven largest Norwegian-owned banking groups.
3.3 Solvency
Norwegian banks are solid, which gives them the flexibility to extend loans to creditworthy firms and households even in the event of market stress and higher losses.
Banks are required to meet risk-based capital requirements and a leverage ratio requirement. The risk-based requirements are intended to ensure that bank capital is sufficient in relation to the risk of losses, so that banks with riskier assets must hold more capital than banks with safer assets. This can contribute to more effective risk management at banks. If the risk weights underlying the risk-based requirements do not reflect all risk of losses, the risk-based capital ratio may give the impression that banks’ loss-absorbing capacity is higher than it actually is. The leverage ratio requirement is a backstop against incorrect risk weighting.
Banks meet capital requirements by an ample margin
Banks’ risk-based capital ratio has been above 18% since 2020, and is expected to remain high in the coming years (Chart 3.11). The leverage ratio is also expected to be high in the coming years, just below 8% (Chart 3.11). The largest banks all meet the regulatory capital requirements by an ample margin. The CET1 capital ratio is also above banks’ own target ratios (Chart 3.12).
Norwegian banks’ CET1 ratio and leverage ratio. Percent
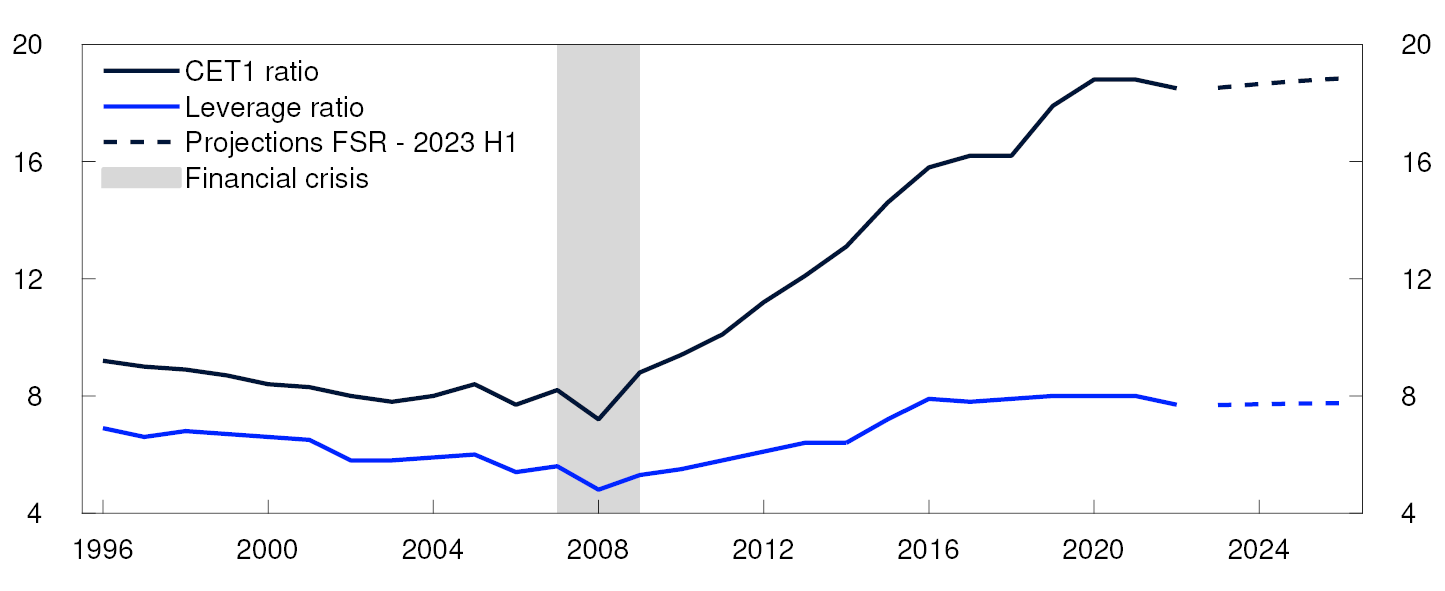
At 31 December 2022. Percent
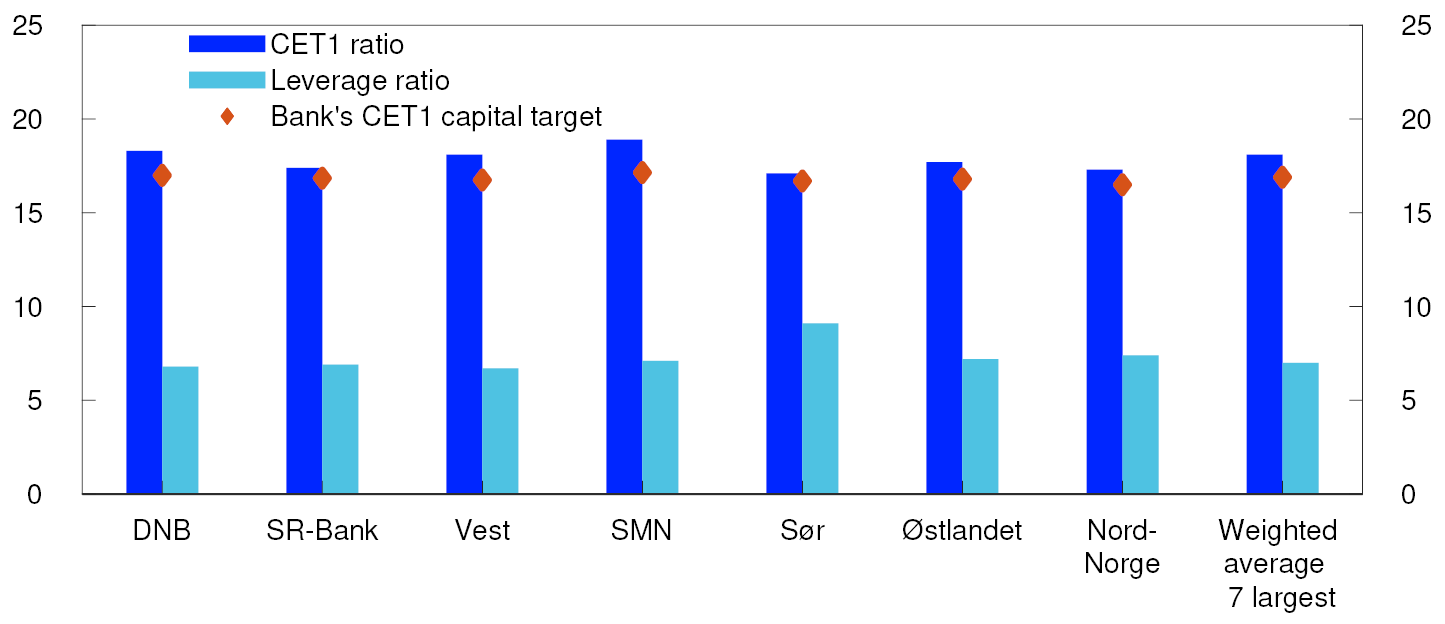
The capital requirement for market risk accounts for a small share of total capital requirements
Total capital requirements under Pillar 1 comprise capital requirements for credit risk, counterparty risk, settlement risk, market risk and operational risk. For Norwegian banks, the capital requirement for credit risk represents the largest requirement by far. This also applies to the largest Nordic banks (Chart 3.13). DNB’s risk exposure amount for market risk totals 0.9% of the total risk exposure amount and is markedly lower than that of the other large Nordic banks.
At 31 December 2022. Percent

The term market risk covers the risk of bank losses owing to unfavourable price changes in financial markets. The actual capital requirement for market risk is intended to cover losses that may arise from price changes in a bank’s trading book. The trading book comprises all positions in financial instruments held by the bank for resale or to hedge other positions that are held for trading. The capital requirement for market risk also covers the risk of foreign exchange losses on the bank’s activities overall (and not just on the trading book).
The portion of a bank’s activities not included in the trading book, mostly loans, is covered by the capital requirements for the banking book. For these assets, the capital requirement for interest rate and equity price risk is a part of the Pillar 2 requirement.
Following the financial crisis in 2008, the Basel Committee on Banking Supervision began work to tighten the capital requirement for market risk in banks’ trading books.15 The tighter requirements have not yet been introduced in the EEA, but banks are obliged to report market risk exposure to supervisory authorities in accordance with the new rules. The new rules are more risk-sensitive than the current ones, and the capital requirement for market risk is expected to edge up when the new rules are introduced. For DNB and other Norwegian banks, the capital requirement for credit risk will still be the largest capital requirement by far.
Changes in capital rules may lead to reduced capital requirements for small and medium-sized banks
A number of regulatory changes are in the offing. One of these is the planned changes in EU bank capital requirements in 2025, which will be introduced in Norway under the EEA Agreement. Analyses show that the regulatory changes may lead to a substantial reduction in capital requirements for small and medium-sized banks (standardised approach banks).16 The new rules will have limited relevance for the largest Norwegian banks (IRB banks) but may contribute to more similar and more comparable capital requirements for Norwegian and foreign banks. Overall, the regulatory changes may result in a more level playing field for banks in Norway.
12 Projections from 2023 Q1 for FSR – 2023 H1. Banks did not report leverage ratios prior to 2014. The chart therefore shows CET1 ratio as a share of total assets up to and including 2014 and leverage ratio from 2014. Both are non risk-based solvency measures and were virtually equal in 2014. Highest level of consolidation.
13 The seven largest Norwegian-owned banking groups and weighted average. Capital targets are defined here as regulatory requirements with a margin above the capital requirements.
14 Total risk exposure amount.
15 This work is referred to as the “Fundamental review of the trading book”, see eg Basel Committee on Banking Supervision (2019) “Explanatory note on the minimum capital requirement for market risk”.
16 See Andersen, H. and J. Johnsen (2023) “Effects of the new standardised approach and the new output floor for IRB banks”. Staff Memo 8/2023. Norges Bank.
3.4 Non-bank financial institutions
In a bank-based financial system like Norway’s, banks and mortgage companies are the largest providers of credit to households and firms. Banks are also particularly important owing to their role in the payment system. Among the financial institutions in the sector referred to as non-bank financial intermediation (NBFI), insurance companies, pension funds and mutual funds are the largest and most important. They contribute to the market financing of banks and corporates by purchasing debt instruments issued by banks and corporates.17
Asset managers can influence prices and liquidity in securities markets
Asset managers (mutual funds and insurance companies) hold around 30% of the bonds in the Norwegian bond market, which means that they can influence prices in the short term if a large number of investors want to buy or sell the same type of security simultaneously. Simultaneous sales may be fire sales of securities needed to raise funds for unit holders seeking redemptions or to raise cash for margin calls on derivatives contracts. Such sales can amplify price declines in times of market stress.
No serious repercussions for asset managers in Norway from global market stress
Following the pandemic outbreak in spring 2020, the krone depreciated sharply, with the result that asset managers faced losses on the foreign currency swaps they used to hedge foreign investments. This led to selling pressure on fixed-income securities to raise cash for margin calls by swap contract counterparties.
The turbulence in international financial markets in March following the problems at certain US and Swiss banks and the substantial krone depreciation have not led to selling pressure from asset managers. Since 2020, a number of Norwegian asset managers have made changes to their risk management practices, including greater use of repurchase agreements and increased collateral eligibility of bonds.
Some increase in mutual fund investing
Net mutual fund subscriptions in 2023 have been positive (Chart 3.14). Foreign investors, Norwegian institutional customers and individual pension savings funds accounted for the largest increase in net subscriptions. Many US households are invested in and have debit cards linked to money market funds. Low interest rates and uncertainty caused by the turbulence in the banking sector led to an increase in withdrawals of bank deposits, which were invested in money market funds. On the other hand, abnormally large withdrawals of bank deposits for investment in money market funds have not been observed in Norway.
In billions of NOK
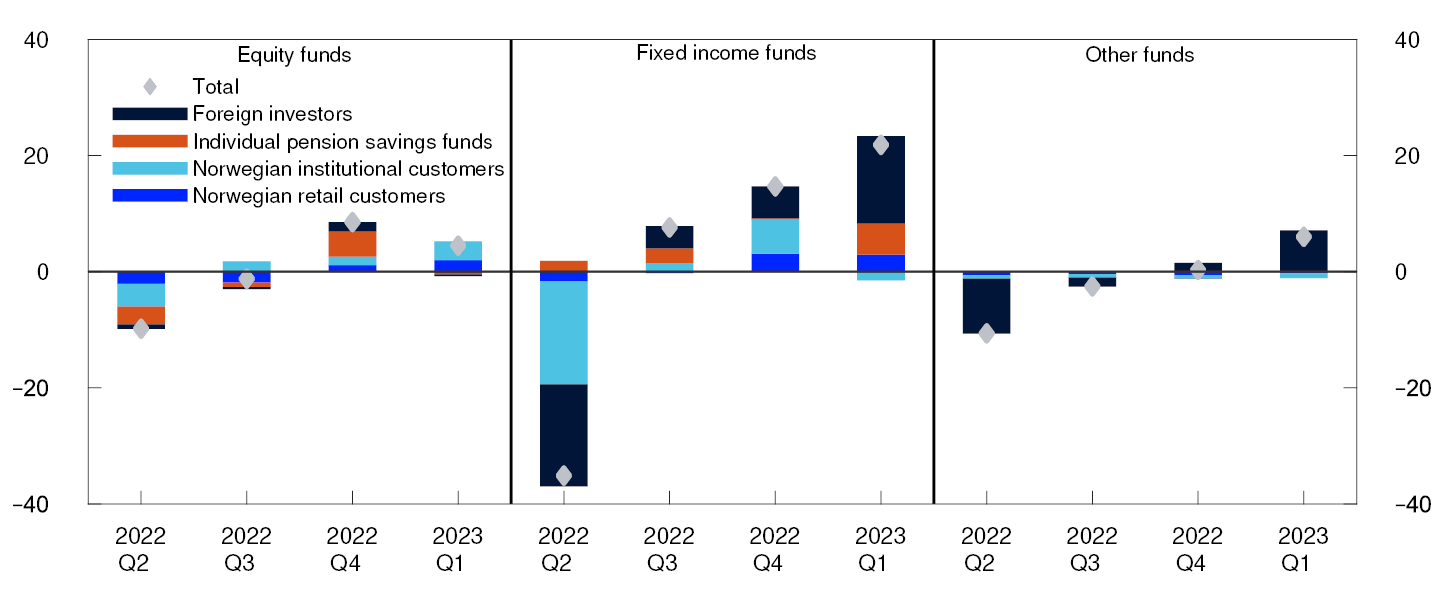
Pension companies are important investors in CRE
Pension companies (life insurance companies and pension funds) are the largest investors in equity and fixed-income mutual funds. A large share of life insurance companies’ investments in their group and corporate insurance portfolios are in real estate (Chart 3.15).19
Share of group and corporate portfolios. Percent
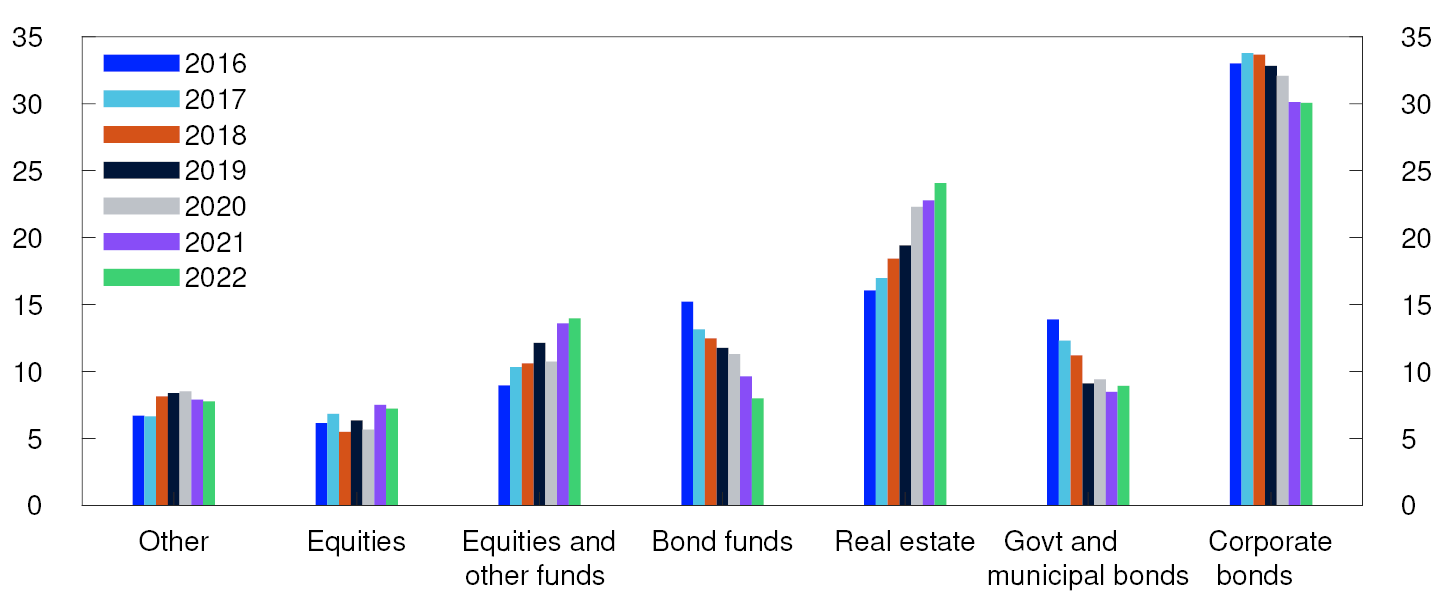
Investments in long-dated bonds and in real estate have traditionally provided a steady income stream. This reduces the risk of not meeting return guarantees for defined-benefit pension schemes. In a period of very low interest rates, real estate investments have appeared to be attractive compared with long-dated bonds. This may explain the increased exposure to CRE in recent years.
Pension companies are subject to capital requirements intended to ensure sufficient capacity to absorb losses associated with negative market developments (see "Solvency II"). For life insurance companies as a whole, the capital requirement is highest for equity risk, interest rate risk and risk associated with risk premiums on fixed-income securities (Chart 3.16). The capital requirement for real estate risk at year-end 2021 was around NOK 10bn.
Data for 2021. In billions of NOK
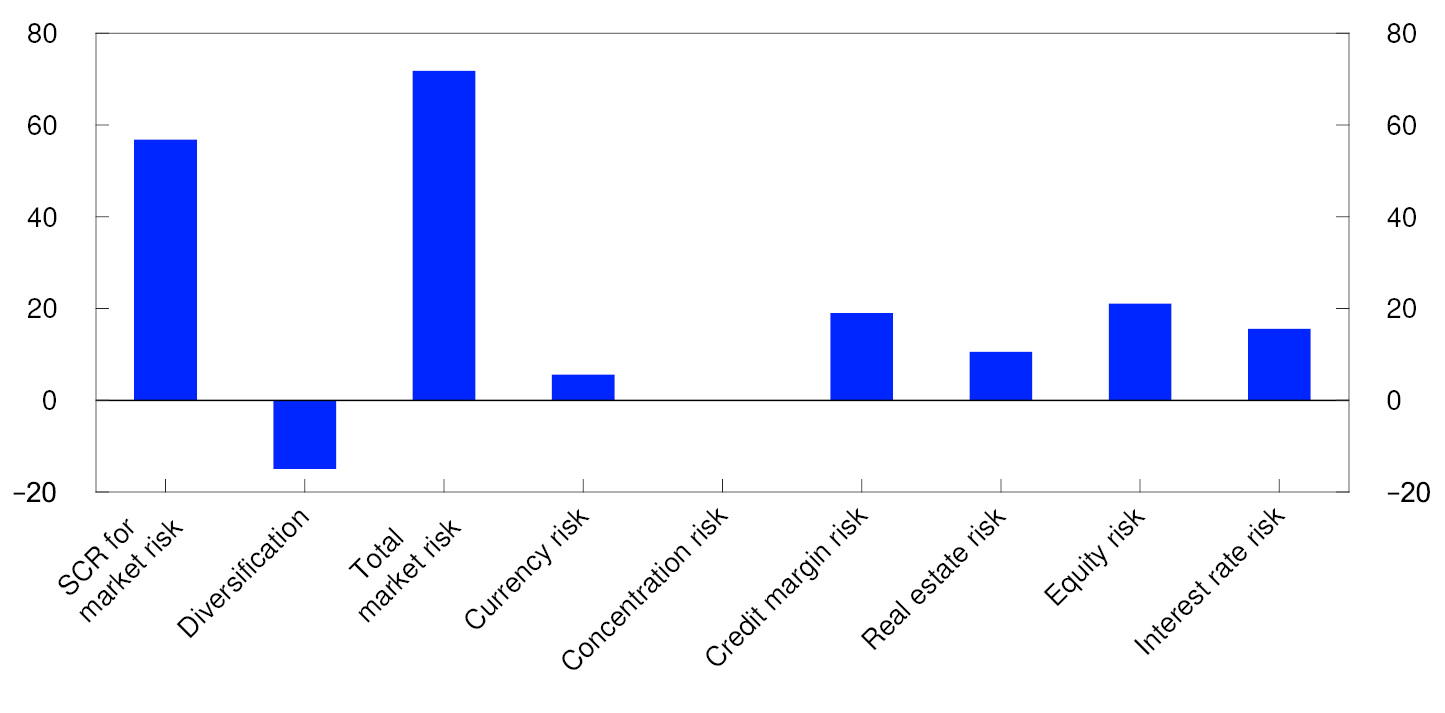
Prospects for a fall in commercial property prices may prompt pension companies to downsize their real estate portfolios. In addition, real estate may have become a less attractive long-term investment as the returns on the safest securities have risen considerably since the beginning of 2022. At the same time, pension companies are stable and long-term investors. This may help to dampen selling pressure in times of market stress in both real estate and securities markets, thereby countering sharp price falls.
Non-banks’ refinancing risk is lower
Solvency requirements for pension companies are meant to safeguard their ability to meet their long-term obligations to customers. Even though there may be high demand for redemptions of mutual fund shares, neither pension companies nor mutual funds are financed by deposits or market-based debt.
Impaired solvency therefore does not result in funding shortfalls, as is the case for banks. Nor are pension companies and mutual funds participants in the payment system. Solvency problems at such financial institutions will therefore not lead in the short run to increased systemic risk in the same way as solvency problems at banks. In the longer run, solvency and profitability problems for these financial intermediaries will adversely impact the financial system by reducing opportunities for saving and redistributing risk. Moreover, solvency and profitability problems at pension companies may result in lower future pension benefits.
Solvency II
Life insurance companies are subject to capital requirements set out in the Solvency II framework. Under the framework’s eligible own funds requirement, a life insurance company’s assets and liabilities shall be measured at fair value. Eligible own funds shall be sufficient to meet a potential loss estimated by stress tests. This potential loss is called the Solvency Capital Requirement, which must be covered in its entirety by eligible own funds. The assumptions underlying the Solvency II framework are based on a value-at-risk estimate with a 99.5% confidence level.
The stress test for real estate is an immediate 25% fall in property prices. The stress test for equity investments varies somewhat but corresponds to a price reduction of around 30%. To calculate the Solvency Capital Requirement for credit premiums, an increase in credit premiums is assumed, where the lowest-rated fixed-income securities show the largest increase. The stress test for interest rate risk consists of a rise or fall in the yield curve. An increase in interest rates results in a fall in the value of fixed-rate bonds. Losses on bonds are countered by a fall in the value of liabilities because the value of guaranteed pension benefits falls when interest rates rise.
17 NBFIs are discussed in detail in Section 2.4 of the Financial Stability Report 2022 and Norway’s financial system 2022.
18 Period: 2022 Q2 – 2023 Q1
19 Plan assets for defined-benefit pensions are managed in life insurance companies’ group insurance portfolios. Defined-contribution pensions are managed in investment choice portfolios.
20 Period: 2016 –2022. Data up to 30 September 2022.
Real estate includes real estate, real estate-related bonds, real estate-related equities, REITs, real estate exposure related to secured securities and real estate-related lending.
21 SCR is the Solvency Capital Requirement.
4. Measures in the financial system in Norway
The debt-servicing capacity requirement in the Lending Regulation has been changed. The countercyclical capital buffer was increased to 2.5% on 31 March 2023. Other capital requirements remain unchanged.
Measures in the financial system
Since the financial crisis, the Norwegian authorities have introduced a range of measures. The measures introduced strengthen financial system resilience and may help to mitigate vulnerabilities. A number of regulatory changes have been made since November 2022.
From 1 January 2023, the Lending Regulation was largely retained. The most important change was the debt-servicing capacity requirement. Borrowers must now be able to tolerate a 7% interest rate or a 3 percentage point interest rate increase, whichever is higher, compared with the previous requirement of a 5 percentage point rise in interest rates.
A decision was made to maintain the systemic risk buffer at 4.5% from 1 January 2023. For banks using the standardised approach, the requirement has been deferred by one year, so that it applies from the end of 2023. The floors for IRB banks’ average risk weights for loans secured on residential and commercial real estate are 20% and 25%, respectively, and have also been retained.
From 31 March 2023, the countercyclical capital buffer requirement is 2.5%, in line with Norges Bank’s decision in March 2022. On 3 May, Norges Bank’s Monetary Policy and Financial Stability Committee decided to maintain the countercyclical capital buffer requirement at 2.5%.
An overview of important measures to mitigate financial system vulnerabilities in Norway can be found in Table 4.1.
Table 4.1 Important measures to mitigate financial system vulnerabilities in Norway
|
Category |
Instrument |
First introduced |
Current level |
|
Deposit guarantee scheme |
Guarantee of retail and commercial deposits in Norwegian banks1 |
1996 |
NOK 2m per depositor per bank2 |
|
Credit standards requirements for mortgages and other secured loans3 |
Tolerate higher interest rate (stress test)4 |
20155 |
A 7% interest rate or a 3 percentage point interest rate increase, whichever is higher |
|
Loan-to-value (LTV) ratio |
20155 |
85%.6 Additional collateral is permitted |
|
|
Principal repayment requirement |
20155 |
2.5% a year with LTV above 60% or as a 30-year amortising loan |
|
|
Debt-to-income (DTI) ratio4 |
2017 |
5 times gross income |
|
|
Flexibility quota7 |
2015 |
10% (8% or up to NOK 10m for loans secured on dwellings in Oslo) |
|
|
Credit standards requirements for consumer credit8 |
Tolerate higher interest rate (stress test) |
20195 |
A 7% interest rate or a 3 percentage point interest rate increase, whichever is higher |
|
Principal repayment requirement |
20195 |
Monthly principal repayment, maximum term 5 years |
|
|
Debt-to-income (DTI) ratio4 |
20195 |
5 times gross income |
|
|
Flexibility quota7 |
2019 |
5% |
|
|
Risk-based capital requirements9 (share of risk-weighted assets10) |
Pillar 1 Minimum CET1 requirement |
201311 |
4.5% |
|
Pillar 1 Minimum Tier 1 requirement |
199112 |
6% |
|
|
Pillar 1 Minimum regulatory capital |
1991 |
8% |
|
|
Pillar 1 Combined buffer requirements: |
|||
|
Capital conservation buffer |
2013 |
2.5% |
|
|
Systemic risk buffer |
2013 |
4.5%13 |
|
|
Buffer for systemically important financial institutions (SIFIs) |
2015 |
1% for Kommunalbanken AS and Nordea Eiendomskreditt AS and 2% for DNB ASA |
|
|
Countercyclical capital buffer |
2015 |
2.5% |
|
|
Pillar 2 requirements |
2007 |
Vary across banks |
|
|
Risk weighting for risk-based capital requirements |
Minimum requirement for loss given default (LGD) in IRB banks’ mortgage models |
2014 |
20% |
|
Calibration requirement for IRB banks’ mortgage models for PD and LGD |
2015 |
||
|
Floor for average risk weights for residential mortgages |
2020 |
20% |
|
|
Floor for average risk weights for CRE mortgages |
2020 |
35% |
|
|
Leverage-based capital requirements9 (share of exposure measure) |
Leverage ratio |
2017 |
3% minimum requirement |
|
Liquidity requirements |
Liquidity Coverage Ratio (LCR) |
2015 |
100% |
|
LCR in individual currencies |
2017 |
100% |
|
|
LCR in NOK |
2017 |
50% (for banks with EUR/USD as significant currencies) |
|
|
Net Stable Funding Ratio (NSFR) |
2022 |
100% |
|
|
Minimum requirement for own funds and eligible liabilities (MREL)14 |
Loss absorption amount |
2019 |
Minimum requirement for regulatory capital + Pillar 2 requirements + combined buffer requirements15 |
|
Amount necessary for recapitalisation16 |
2019 |
Minimum requirement for regulatory capital + Pillar 2 requirements + combined buffer requirements excluding countercyclical capital buffer requirement |
|
|
Total MREL |
2022 |
Total MREL is described on page 39 of Financial Stability Report 2021 |
|
|
Subordinated MREL |
2022 |
Subordinated MREL is described on page 38 of Financial Stability Report 2021 |
|
|
Testing of financial sector cyber resilience |
TIBER-NO17 |
2021 |
Guidance for threat-based testing of financial sector cyber resilience. |
1 For deposits in Norwegian banks’ foreign branches, a limit of EUR 100 000 applies.
2 Additional amounts deposited in the course of the previous 12 months following a particular life event, such as a home sale or insurance payout, are also covered. The guarantee does not cover deposits from credit or financial institutions or from public authorities.
3 From 1 July 2023, loans secured on collateral other than a dwelling, such as car and boat loans, will be covered by the regulation’s general DTI and debt-servicing capacity requirements.
4 The requirement pertains to the customer’s total debt.
5 Prior to being laid down in a regulation, the requirements were issued as guidelines, for residential mortgage loans in 2010 and for consumer credit in 2017.
6 From 1 January 2023, the specific maximum LTV requirement of 60% for amortising loans secured on secondary dwellings in Oslo has been rescinded.
7 Up to a certain percentage of the total value of new mortgage loans/consumer credit granted each quarter may be loans in breach of one or more of the requirements. A separate flexibility quota for Oslo was introduced in 2017.
8 Exemption for credit cards with credit limits below NOK 25 000 and exemption for loan refinancing as long as the value of the refinanced loan (and associated costs) does not exceed the value of the existing loan (and associated costs).
9 See explanation of capital requirements in Norway’s financial system 2022, pp 101–108.
10 Risk-weighted assets. A number of regulations have been introduced for banks’ calculation of risk weights, especially for residential mortgage loans.
11 From 2002, hybrid capital could account for up to 15% of Tier 1 capital.
12 In 2013, the minimum requirement increased from 4% to 6% when CRR/CRD IV were implemented in the Norwegian rules.
13 Applicable to banks using the advanced IRB approach from end-2020, while the 3% requirement applies to other banks until end-2022.
14 Liabilities eligible for MREL must be lower in priority than senior debt. However, before 1 January 2024, ordinary senior bonds issued before 1 January 2020 may also be used to satisfy MREL.
15 The loss absorption amount requirement is the larger of the leverage-based Tier 1 capital requirements and total risk-based capital requirement (minimum requirement, Pillar 2 requirements and buffer requirements). In Norway, the risk-based requirement is the more binding.
16 Applies only to banks subject to resolution and not liquidation under public administration.
17 TIBER-NO is the Norwegian implementation of TIBER-EU, which applies in the EU.
Sources: Ministry of Finance, Finanstilsynet and the Norwegian Banks’ Guarantee Fund.