Financial stability outlook
There are considerable spillovers in both Europe and globally from the ongoing war in Ukraine and the after-effects of the Covid-19 pandemic. There is substantial uncertainty about the economic outlook and about how economic agents will respond to higher interest rates and increased costs. The risk of a downturn has increased, and the financial stability outlook has weakened. Financial system vulnerabilities, such as the considerable rise in property prices in recent years and high debt levels among households, may amplify an economic downturn.
The Norwegian financial system has so far weathered the substantial volatility in financial markets. Solid profitability, capital adequacy and liquidity ensure that banks are resilient, with ample capacity to absorb losses and deal with market stress. It is now especially important that the financial system remains resilient so that it can perform its tasks effectively also in the event of severe economic downturns and crises.
Weaker financial stability outlook
The global growth and inflation outlook is highly uncertain. Russia’s invasion of Ukraine and the decline in Russian gas supplies to Europe have resulted in high energy prices. Along with strong demand for goods and services and supply-side constraints owing in part to the pandemic, this has led to a surge in consumer prices globally and in Norway. Central banks have raised policy rates to dampen inflation. Activity in the Norwegian economy is high, and unemployment is at a historically low level. At the same time, there are signs that some areas of the economy are cooling down, in the housing market, for example, where prices fell in autumn. Meanwhile, high energy prices are generating record revenues in the oil and gas sector.
The geopolitical situation and uncertainty about the economic outlook have resulted in substantial financial market volatility. Impaired liquidity on many trading venues, also in markets regarded to be the most liquid, has added to the volatility. Over the past year, long-term interest rates and credit premiums on corporate bonds have risen and global equity indexes have fallen. Price volatility in some derivatives markets, which has led to very large margin calls, has created liquidity challenges for many participants globally. Robust trading venues and market participants are the first lines of defence against market stress, and participants must have adequate systems and contingency arrangements for managing liquidity and counterparty risks.
Against the background of a heightened risk over the past year of an economic downturn or other adverse events, it is Committee’s assessment that financial stability outlook has weakened.
Vulnerabilities can amplify a downturn
Owing to vulnerabilities in the Norwegian financial system, a downturn or market stress may have more serious consequences for financial stability. Vulnerabilities are broadly at the same level as at the time of Financial Stability Report 2021, but an increased risk of a downturn implies a greater risk that vulnerabilities materialise. Many households are highly indebted and the vast majority have floating-rate loans. Household leverage is close to a historically high level, and it is high compared with other countries. Higher interest rates and living costs imply tighter finances for many, but the Bank’s analyses show that most households are able to service their debt. High indebtedness makes households vulnerable to loss of income, higher interest rates or a fall in house prices. If many households reduce consumption sharply, firms’ earnings are impaired and banks may face higher losses on corporate exposures. This constitutes a risk to the financial system. A sharp fall in house prices may also lead to substantial bank losses on non-performing residential mortgages of households with a high debt-to-value ratio.
Norges Bank is of the opinion that the Lending Regulation has limited the build-up of household sector vulnerabilities and that the Regulation should continue to apply largely unrevised at present. A broad review of the Regulation should be conducted before it expires in 2024, based on the experience of higher interest rates ahead, among other things.
Banks’ exposures to commercial real estate (CRE) are substantial, and in autumn, property prices have edged down. An economic downturn with a fall in selling prices and rental income may have a substantial impact on this sector and result in large bank losses. Owing to low yields on commercial property, selling prices are vulnerable to higher interest rates and lower risk appetite.
House prices have risen faster than household income over a long period. Prices have fallen this autumn, and the same tendency has been observed in other countries. The projections in the September 2022 Monetary Policy Report point to a moderate fall in house prices in Norway in 2023. Owing to uncertainty about macroeconomic developments and households’ response to higher interest rates, the forecast for house prices is more uncertain than normal. Sharp and sudden declines in house prices may trigger a tightening of household consumption and increase losses on banks’ loan portfolios.
Covered bonds issued by other Norwegian banks account for a substantial portion of banks’ liquidity reserves. This implies that problems at one bank can more easily spread to other banks. If markets are stressed, sales of liquidity reserves to meet liquidity needs may result in greater spillovers than if banks did not have cross-holdings of covered bonds.
The financial infrastructure is secure and efficient. The threat landscape in recent years has become more aggressive and more difficult to gauge. The number of cyber attacks has risen, and they are used as weapon of war and armed conflict. Cyber attacks on critical functions may be a threat to financial stability. There is broad international agreement on the need to strengthen resilience to cyber attacks on the financial sector. This requires an intensive effort to identify risks, regulation and extensive cooperation between various authorities and financial system participants. In collaboration with Finanstilsynet (Financial Supervisory Authority of Norway), Norges Bank has introduced the TIBER framework for testing cyber resilience in the financial system.
Climate change is one of society’s greatest challenges. Financial institutions must ensure that they are well equipped to assess and mitigate climate risk. Banks’ exposures to the sectors with the highest greenhouse gas emissions are modest, but other firms will also be affected by the climate transition. Well-functioning financial markets are vital for financing investment that can mitigate climate change. Adequate information about climate risk is also important. Energy labelling of buildings makes it easier for banks to assess the climate risk associated with real estate loans. Analyses in this Report show that the share of energy-labelled commercial buildings is low and should be increased. In addition, higher electricity prices make energy efficiency more important in the real estate sector, and the willingness to pay for energy-intensive buildings may fall.
It is important for the financial system to remain resilient
Overall, the financial system is judged to be well equipped to address the risks we are facing. Tightened capital and liquidity requirements over many years have better equipped banks in Norway and many other countries to deal with crises. Norwegian banks’ solid earnings are the first line of defence for absorbing losses and give banks the flexibility to lend to creditworthy firms and households. Banks’ profitability is expected to remain solid, but the risk of losses has risen.
The stress test in this Report shows that the largest Norwegian banks as a whole are capable of absorbing losses in the face of a sharp downturn in an environment where inflation is significantly higher than it is today. In the stress scenario, high living costs and interest rates hit households hard, and banks incur losses. On the other hand, some firms will benefit from high commodity and energy prices. This cushions losses on commercial loans somewhat, but banks still incur significant losses owing to a sharp fall in property prices and belt-tightening by a large number of households. The stress test shows some of the many possible adverse events that the financial system may face and outlines a possible outcome of how the financial system copes with a sharp, but not inconceivable, downturn. The current situation makes it especially important for the financial system to maintain a high level of resilience, so that it can perform its tasks effectively even in the event of severe downturns and economic crises.
Capital buffers help facilitate bank lending during crises too
Increased bank capital promotes financial stability because it reduces the risk that banks contribute to amplifying a downturn. Sharp economic downturns may result in such large credit losses that banks dip into their capital buffers. Stress tests and sensitivity analyses show that Norwegian banks’ current capital levels are high enough for them to cope with scenarios where losses are considerable. Capital levels are also in line with what analyses show to be the level of capital banks should hold in the long term. Bank capital levels that are too low are more economically costly than if bank capital should prove to be too high.
In 2021, Norges Bank was given responsibility for advising on systemic risk buffer (SyRB) requirement. In June, the Bank published a framework for that advice. The SyRB helps to ensure that banks hold sufficient capital to weather future downturns. Structural vulnerabilities in the Norwegian financial system are broadly at the same level as in 2020, when the SyRB was set at 4.5%. The current level of the SyRB should therefore be maintained.
The countercyclical capital buffer (CCyb) will be set at 2.5% from 31 March 2023. In the aggregate, the buffer requirements help to ensure that Norwegian banks hold sufficient capital.
Ida Wolden Bache
Pål Longva
Øystein Børsum
Ingvild Almås
Jeanette Fjære-Lindkjenn
2 November 2022
1 Vulnerabilities and risks in the financial system
The outlook for financial stability has weakened over the past year. The ongoing war in Ukraine and the after-effects of the Covid-19 pandemic are having substantial economic consequences both in Europe and globally. There is an increased risk of new negative events occurring. A number of the key vulnerabilities in the Norwegian financial system, such as the high indebtedness of many households and banks’ high commercial real estate (CRE) exposures, may amplify a downturn. Many securities prices have fallen so far in 2022 and, after having risen substantially through the pandemic, property prices have fallen this autumn. A digitalised financial system increases vulnerability to cyber attacks, and the threat landscape has become more aggressive over the past year.
Negative events can occur abruptly and come from unexpected sources. Solid profitability, capital adequacy and liquidity ensure that banks are resilient, with ample capacity to absorb loss and deal with market stress. Norges Bank’s Monetary Policy and Financial Stability Committee has decided to advise the Ministry of Finance to maintain the systemic risk buffer (SyRB) rate at 4.5%.
1.1 Heightened geopolitical and economic uncertainty is affecting the financial system
Recent years have been marked by a number of major shocks and negative events, such as the war in Ukraine, the energy crisis, the pandemic, increased inflation and the subsequent global financial volatility with reduced market liquidity. In the current environment of uncertainty regarding the Norwegian and global economy, it is particularly important to maintain the resilience of the financial system. The European Systemic Risk Board (ESRB) issued a formal warning to member countries at the end of September, highlighting a number of severe risks to financial stability and stressed the importance of the private sector, market participants and relevant authorities preserving and strengthening resilience (see “European Systemic Risk Board (ESRB) warning on vulnerabilities in the financial system”). In its Global Financial Stability Report from October, the International Monetary Fund (IMF) urges policy makers to contain a further build-up of financial vulnerabilities and use macroprudential tools as needed.
High inflation and monetary tightening globally
In the years after the financial crisis, global inflation was low in an environment of historically low interest rates in most countries, which contributed to high risk-taking and elevated asset and property prices. Pandemic-related supply and demand conditions and the war in Ukraine have led to a surge in inflation among Norway’s main trading partners since autumn 2021. Reduced Russian gas exports have pushed up energy prices. Energy transitions, such as the phasing out of nuclear power in some countries, have also pushed up energy prices. Faced with higher inflation, central banks have raised policy rates substantially over the past year, and market policy rate expectations indicate further increases in the coming year, both in Europe and the US. Long-term interest rates have also risen considerably over the past year (Chart 1.1).
Chart 1.1 Long-term interest rates have risen considerably over the past year1 Yields on 10-year government bonds in selected countries. Percent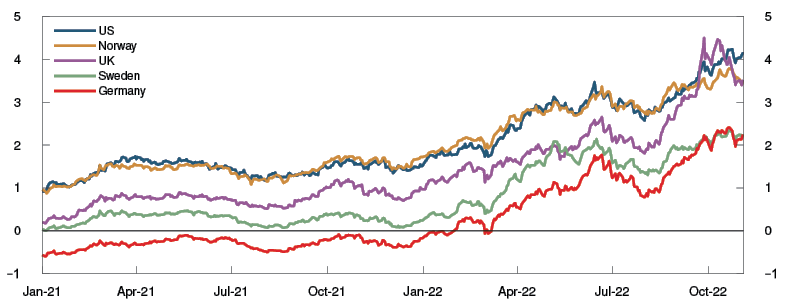
There is a high degree of uncertainty surrounding the outlook for global growth and inflation ahead. The war in Ukraine is impacting both the European and global economy and adding to the uncertainty. For the Norwegian economy, the European market is particularly important. A sharp reduction of Russia’s gas exports to Europe and the risk of energy rationing heightens the risk of a pronounced downturn in the euro area and the UK. In the US, inflation has been high over the past year. In China, pandemic-related restrictions and lower activity in the real estate sector have contributed to weaker growth. If inflation picks up further in advanced economies and monetary policy becomes more contractionary than expected, global economic growth may weaken further and result in further volatility in international financial markets.
High debt increases the risk that an abrupt and strong tightening of financial conditions will have negative consequences for financial stability. During the period of low interest rates, global debt relative to activity increased, rising further at the beginning of the pandemic owing to both faster debt growth and a sharp fall in GDP (Chart 1.2). In line with higher economic activity, this trend was partially reversed through 2021 and global debt levels were just over 260% at the end of 2021. The increase in global debt was most pronounced in the government sector, reflecting the extensive support measures implemented by many countries during the pandemic. Higher public debt may reduce fiscal space ahead. In addition, higher interest rates will increase interest burdens for many firms, households and governments.
Chart 1.2 General government has increased its share of global debt2 Global non-financial sector debt as share of GDP. Percent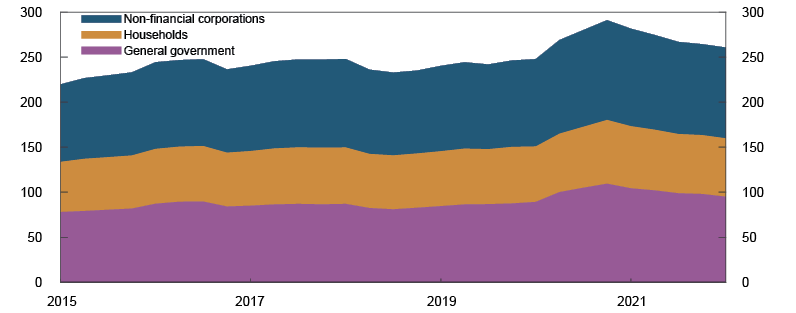
High volatility and lower liquidity in financial markets
The years following the financial crisis were marked by low financial volatility. Low interest rates pushed up property and securities prices. Monetary tightening so far in 2022 has contributed to partially reversing these price increases. Long-term interest rates have risen considerably (Chart 1.1) and bond market risk premiums have also increased.
Investors’ required rate of return on financial assets depends on developments in long-term interest rates and risk premiums. In line with the rise in long-term interest rates, yields have increased and equity prices have fallen globally (Chart 1.3). Equities with a high current price-to-earnings ratios, such as technology equities, have fallen substantially. However, there are signs that global equity risk premiums are little changed. Equity prices may therefore be vulnerable to a sudden reductions in investors’ risk-taking. However, bond risk premiums have risen somewhat, particularly in the corporate bond market.
Chart 1.3 International stock indices have fallen considerably this year3 MSCI global stock market index. Week 1 2022 = 100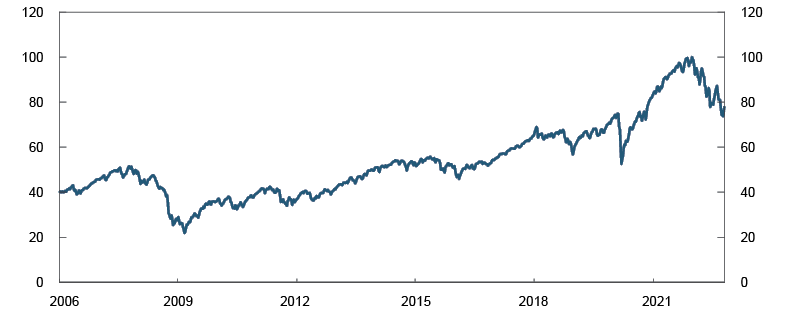
Uncertainty about the outlook for global growth and inflation has resulted in periods of high financial volatility over the past year, which has contributed to reduced market liquidity. Treasury bond market liquidity in particular has deteriorated, which may also reflect structural conditions4 and balance sheet reductions by some central banks. Prolonged low market liquidity may amplify price movements in periods of market turmoil, which may also reduce access to wholesale funding for governments, banks and firms.
Price volatility has been high in a number of markets. Derivatives contracts often include collateral requirements (margin calls) to reduce counterparty risk. High price volatility has led to a considerable increase in margin calls in a number of markets. During the pandemic, increased margin calls led to periods of liquidity challenges for market participants with large derivatives positions, and in Norway the sharp depreciation of the krone led to liquidity stress for Norwegian asset managers who were forced to fire-sell securities. In 2022, a pronounced rise in energy prices has resulted in liquidity difficulties from time to time for Nordic power producers related to financial derivatives for hedging against energy price changes. High price volatility increased the risk of instability in the Nordic financial system, but government measures to strengthen the liquidity of market participants have improved market functioning. Higher energy prices have not posed any significant problems for Norwegian market participants (see “Challenges in the energy derivatives market”). This autumn, highly volatile UK government bond yields have led to increased margin calls and liquidity problems for a number of UK pension funds (see “Asset managers' behaviour can amplify negative price movements”).
Financial markets are interconnected, and one market participant’s problems can spill over to other participants. The margin call system, which mitigates counterparty risk through collateral agreements, is important for financial stability. At the same time, counterparty margining requirements involve a liquidity risk, and it is important that parties to derivatives contracts take account of this risk.
European Systemic Risk Board (ESRB) warning on vulnerabilities in the financial system
On 22 September 2022, the ESRB adopted a warning on vulnerabilities in the EU/EEA to relevant authorities. This is the first time such a joint warning has been issued to all member countries. The role of the ESRB is to monitor the financial system in the EU/EEA and to prevent and mitigate systemic risk. In addition, the ESRB can issue warnings and recommendations. Warnings can be issued when the ESRB identifies financial stability risk.
In its warning, the ESRB notes that a deterioration in economic activity could lead to a further increase in credit risk in financial institutions with weak debt-servicing capacity related to the pandemic. There is still a substantial risk of a sharp fall in asset prices. Weaker household debt-servicing capacity owing to higher borrowing costs and lower real income may trigger a fall in house prices and cyclical risks in real estate markets. The risk of large-scale cyber incidents has also increased. Geopolitical developments since the beginning of 2022 have increased the probability that many of these risks will materialise simultaneously and become mutually reinforcing.
Market participants and authorities need to prepare for the eventuality of a sharp downturn. A resilient financial system is essential for supporting the real economy. Effective collaboration between authorities and prudent risk management practices among market participants are critical for dealing with shocks.
Systemic risks in the Norwegian financial system
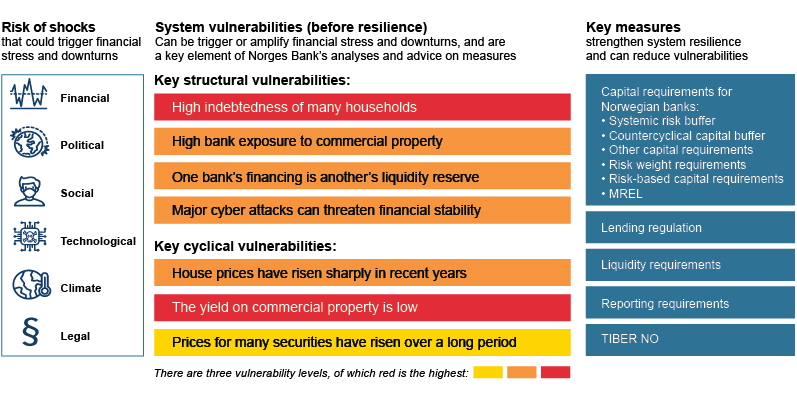
Shocks can come from different parts of the economy and financial markets. Negative events related to, for example, technology, climate change and geopolitical and social conditions may also trigger financial crises. Shocks to financial stability are difficult to foresee.
The vulnerability assessment is based on historical experience regarding what causes or amplifies downturns and financial turbulence and on assessments of new features of the financial system. We distinguish between cyclical vulnerabilities, which fluctuate more over time, and structural vulnerabilities, which are longer-lasting. It is difficult to clearly distinguish among vulnerabilities, and vulnerabilities can be mutually reinforcing.
Since the financial crisis in 2008, the Norwegian authorities have introduced a number of rules to mitigate vulnerabilities and increase financial system resilience (see diagram). For more detailed information about these measures, see “Important measures in the financial system in Norway”. The measures primarily help to increase financial system resilience but can also mitigate vulnerabilities. High profitability, sound capital adequacy and sound risk management by financial institutions also strengthen resilience.
1 Period: 1 January 2021 – 3 November 2022
2 Period: 2015 Q1 – 2022 Q1
Debt in 44 reporting countries, including the euro area.
3 Period: Week 1 2006 – week 44 2022. The index cover equity prices in 2023 advanced economies.
4 See Section 4 in Financial Stability Report 2021 for a discussion of structural conditions that can affect financial market liquidity.
Challenges in the energy derivatives market
Substantial energy price volatility has given rise to liquidity stress for power producers in the Nordic energy market. Challenges are related to financial derivatives that producers enter into to hedge against changes in energy prices during a specified period.
Financial energy derivatives in Nordic countries are largely settled by the Swedish central counterparty (CCP) Nasdaq Clearing AB (Nasdaq). CCPs guarantee settlement even if one of the parties defaults but also require clearing members to pay initial margin when derivatives contracts are entered into and variation margin when prices change.
When electricity prices rise, the value of derivatives, such as a futures contract with a delivery price lower than the current price of the contract, becomes negative for parties with a short position in the futures market. When normal price changes occur, this does not entail any particular challenges but at one point, electricity prices in August doubled (Chart 1.A). This resulted in increased margin calls from CCPs. Between June and August, margin calls on Nasdaq increased from SEK 25bn to SEK 180bn.
Chart 1.A Margin calls on energy derivatives have increased significantly System Year-23 contract (ENOFUTBLYR-23) where the variation margin is the future price less the future price at 1. november 2021. Øre/kWh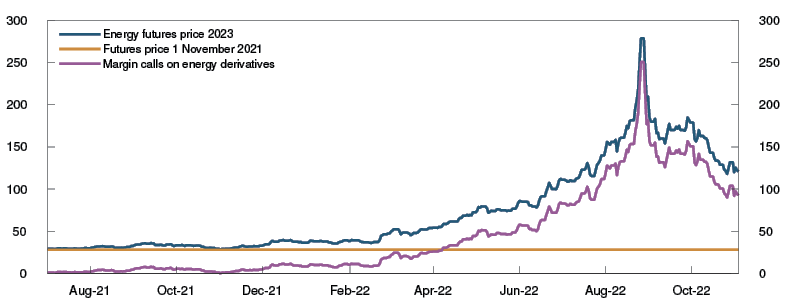
When margin calls are very high, producers may need loans in an amount exceeding banks’ internal guidelines. Large loans may also bring banks into conflict with rules governing large exposures. In extreme situations, power producers may thus be unable to meet margin calls with liquidity provided by their bank. In Norway, a large number of power producers are publicly owned, with hydropower generation providing a steady revenue stream at low cost. It therefore appears unlikely that Norwegian power producers would not be able to borrow from financial institutions or markets to cover a temporary liquidity shortfall.
At the beginning of September, the Swedish authorities guaranteed SEK 250bn for Nasdaq clearing members. The guarantee was intended to counter the risk of financial instability in the Nordic countries and enables banks to lend to power producers without risk. Nor are government-guaranteed loans subject to the rules governing large exposures. The European Securities and Markets Authority (ESMA) has proposed allowing a wider range of securities to be used to meet margin calls on energy derivatives. This expansion permits the use of bank guarantees and public guarantees as collateral and is intended to ease liquidity pressures on non-financial market participants.
The CCP Nasdaq is used by power producers across the Nordic countries. Norwegian producers also enter into a substantial number of contracts outside of Nasdaq in what are called bilateral trades. Requirements for margins in bilateral contracts are typically less stringent than for centrally cleared contracts. These contracts are settled between parties that agree any collateral requirements themselves. Higher energy prices have therefore not led to any appreciable liquidity problems for Norwegian power producers. Under bilateral settlement, parties to a contract must bear their own losses if the counterparty defaults. However, creditworthy parties may judge that the potential credit risk is smaller than the costs involved in posting margin to a CCP.
Concepts in derivatives markets
Derivatives
Contracts where the value is related to or derived from an underlying asset (electricity, gas, equity, bond, foreign exchange, interest rate etc). Derivatives can be used to reduce or increase exposure to an underlying asset and are therefore useful in managing risk. A derivatives contract may entail a physical delivery, which means that counterparties must deliver and settle at an agreed price or agree on cash settlement at maturity. The latter are known as financial derivatives.
Variation margin
Amounts that reflect the size of exposure given the most recent prices (value of the contract). Over the tenor of the derivative, the counterparty with a derivatives position with a negative market value must post variation margin while the counterparty with a positive position receives the variation margin. If the trade is centrally cleared, the margin call will be made by the central counterparty, which normally forwards the payment to the counterparty that is owed money. If the contract is settled bilaterally, variation margin is settled between the counterparties directly.
Initial margin
Amounts (cash and securities) that are collected and are intended to cover potential changes in the value of a counterparty’s position from the time the counterparty is in default until the position can be closed. Initial margin is typically posted when contracts are entered into, but in the event of large price movements, increased initial margin may be called over the tenor of the derivative. Initial margin is posted for centrally cleared derivatives but are less common in bilateral derivatives contracts. In contrast to variation margin, initial margin is paid by both counterparties to a derivatives contract and is held by the central counterparty until the contract matures.
1.2 Financial system vulnerabilities
Vulnerabilities in the Norwegian financial system can amplify the impact of shocks on financial stability. High household debt levels, banks’ large exposure to commercial real estate (CRE) and the fact that one bank’s funding is another bank’s liquidity reserves are key structural vulnerabilities, as are major cyber attacks. In Norges Bank’s assessment, structural vulnerabilities are at approximately the same level as in 2021.
Debt growth and asset price inflation have often been high prior to financial crises and are indicators of cyclical vulnerabilities. Many securities prices have fallen so far in 2022 and, after having risen substantially through the pandemic, property prices have fallen this autumn. In Norges Bank’s overall assessment, cyclical vulnerabilities are approximately unchanged over the past year.
Many households are highly indebted
The high debt of many households is the main structural vulnerability in the Norwegian financial system. Household leverage is close to a historically high level (Chart 1.4) and is high compared with other countries. High income growth, especially in the form of increased equity dividends5, contributed to the decline in household leverage towards the end of 2021. High household debt in Norway largely reflects elevated house prices and a large proportion of home ownership. In addition, residential mortgage rates have been very low over several years, which has pushed up debt levels and house prices. Household debt is unevenly distributed, and household leverage is particularly high among younger age groups, as many first-time home buyers and households trade up in the housing market (Chart 1.5). During the period between 2010 and 2020, household leverage increased across all age groups. Data from Finanstilsynet’s (Financial Supervisory Authority of Norway) residential mortgage lending survey for 2022 shows that almost half of all new loan amounts have been granted to borrowers with debt over four times annual income. This share was unchanged from 2021 and slightly higher than in 2020.
Chart 1.4 Household leverage is high and interest burden is increasing6 Percent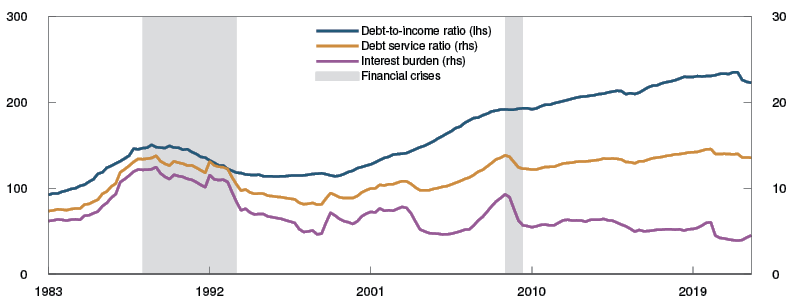
Chart 1.5 The debt burden has increased across all age groups7 Percent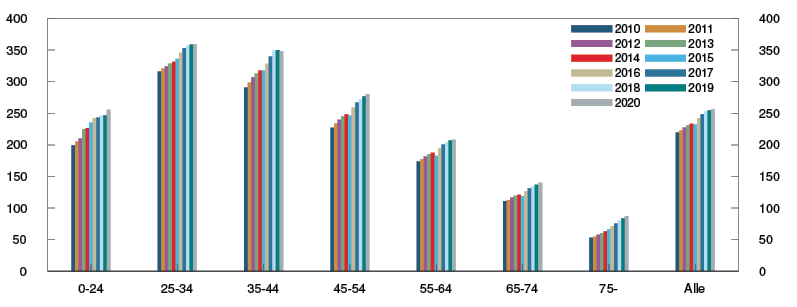
Households’ interest burden, ie the ratio of income to interest payments, fell to a historically low level during the pandemic. More than 90% of households have floating-rate loans, and the interest burden will rise ahead in pace with higher lending rates. Household debt service ratios, which also include estimated principal payments, are expected to rise owing to higher interest rates and a high level of household debt. In Norges Bank’s Survey of Bank Lending 3/2022, banks report slightly lower household credit demand in 2022 Q3, and several banks reported an increase in demand for interest-only loans. Lending standards were overall unchanged in 2022 Q3, and the banks expect a slight tightening of lending conditions in 2022 Q4. Over the next few years, with debt growth expected to be somewhat lower than income growth, household leverage will decline (see Monetary Policy Report 3/22 and Chart 3.1 in the stress test in Section 3). This may, over the longer run, help reduce the vulnerabilities associated with high household debt. However, there is considerable uncertainty surrounding economic developments ahead.
High debt makes households vulnerable to income loss, higher interest rates or a decline in house prices. In addition to increased interest expenses, households are facing higher expenses related to, for example, food and electricity. However, a sensitivity analysis shows that most households are able to service their debt. Only between 2% and 3% of homeowner debt is held by households who may have difficulties covering normal expenses and expected higher interest rates with disposable income and assets, compared with about 1% at 2020 price- and interest rate level (see “Households are resilient to moderate increases in interest rates and other expenses”). Low-income households account for a large share of households with payment problems, but a larger share will have to tighten consumption, which may amplify an economic slowdown.8 Analyses9 also show that much of the highly vulnerable consumer debt is held by low-income and non-homeowners. At the same time, this accounts for a small share of total debt. Bank losses are expected to remain low ahead (see Section 2), but losses on loans to customers with weak debt-servicing capacity will likely edge up.
Considerable uncertainty about the macroeconomic outlook ahead entails heightened risk of new negative events, and highly indebted households may be particularly vulnerable. A sensitivity analysis (see “Households are resilient to moderate increases in interest rates and other expenses”) shows that in a scenario with, for example, high interest rates and a sharp fall in house prices, many households may have difficulties covering normal expenses and interest. Banks’ losses may then rise owing to households defaulting on their debt. The analysis illustrates that many households in such a situation may have to reduce consumption to a relatively moderate level. This may pose a threat to financial stability because a tightening of consumption may reduce firms’ earnings and thus their debt-servicing capacity. The stress test in Section 3 illustrates this scenario.
Commercial property prices could fall sharply and lead to substantial bank losses
Banks’ high CRE exposures are a key structural vulnerability, at the same time as low yields are a cyclical vulnerability that increases the risk of a sharp fall in commercial property prices. Banks’ CRE lending is substantial and accounts for around half of total corporate lending (Annex Chart 4). A large share of banks’ exposures is concentrated in a few banks. Four banks account for about two thirds of total commercial real estate loans. Experiences of banking crises in Norway and abroad have shown that losses on CRE exposures have been an important factor behind solvency problems in the banking sector.
Developments in rental income are important for CRE firms’ debt-servicing capacity. Rental income in the period ahead is secured by existing leases, provided tenants are able to pay rent. Existing leases are normally linked to consumer price inflation, which in isolation helps strengthen CRE firms’ debt-servicing capacity in periods of high inflation. A sharp fall in commercial property prices may strongly impair CRE firms’ solvency. If a fall in prices leads to the properties’ mortgage value becoming lower than the value of the loans, banks may incur losses upon default of the debt. However, the rise in CRE prices since the financial crisis has not been matched by corresponding borrowing. This has boosted CRE firms’ equity ratios, strengthening resilience to price falls.
Commercial property prices in Norway and in other countries have risen substantially in recent years and prices in Oslo rose markedly through the pandemic (Chart 1.6). Selling prices are calculated as rents divided by yield. The rise in selling prices reflects both higher rents and a lower yield. Over the past year, selling prices have been driven up by a substantial rise in rents.
Chart 1.6 Commercial property prices have edged down this autumn10 Estimated selling prices for prime office space in Oslo. In thousands of NOK per square metre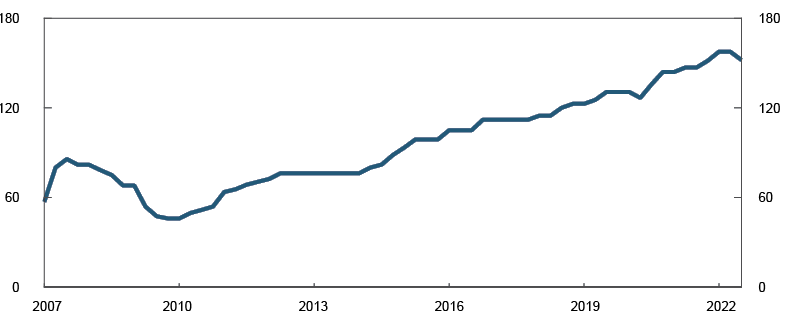
In 2022 Q3, the yield rose sharply, and rents increased markedly according to Norges Bank’s price statistics. Overall, selling prices fell somewhat. Because recent transactions have been at a low ebb, there is considerable uncertainty surrounding actual market prices. Over the past half year, real estate portfolio writedowns of major market participants and surveys11 of property investors show that the yield in most CRE segments have risen recently in Norwegian cities.
The yield depends on developments in long-term interest rates and risk premiums. The spread between the yield and the five-year swap rate, which is a simple measure of the risk premium, is at a low level (Chart 1.7). This applies both in Oslo and other European cities. In the years ahead, a gradual rise in the yield for Oslo and a moderate rise in rents are expected. Overall, the projections for rents and the yield indicate that selling prices will fall in the years ahead (see Monetary Policy Report 3/22).
Chart 1.7 The difference between yield and long-term interest rates is at a low level12 Yield less five-year swap rate. Percentage points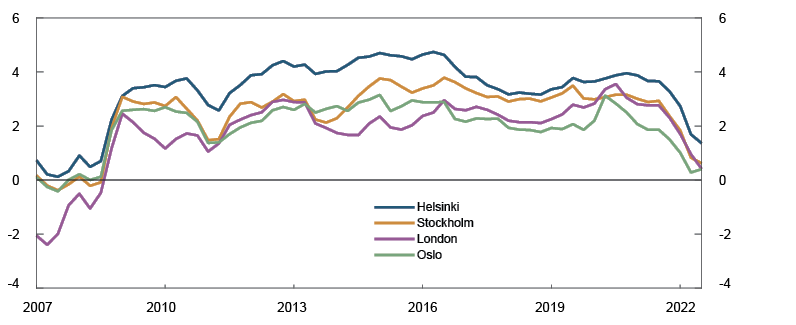
Low yields increase the risk of a sharp fall in commercial property prices. New periods of substantial market volatility may lead to a higher risk premium and higher yields than previously assumed. Higher long-term interest rates will also pull up the yield. In the event of a more pronounced slowdown than currently envisaged, developments in rents may be weak. A sudden increase in the yield and a fall in rents will entail a sharp fall in selling prices. If commercial property prices fall in line with the projections, banks’ CRE loan losses are expected to remain low. However, in a downturn where commercial property prices fall sharply, banks’ CRE loan losses may be substantial (see the stress test in Section 3).
Over the past year, CRE firms’ financing costs have increased owing to the higher interest rates and credit premiums. The debt-to-revenue ratios of CRE firms is higher than that of other firms and their profitability is more vulnerable to higher interest expenses compared with firms in other sectors. Bank debt accounts for the largest share of CRE firms’ debt, but bond debt is an increasingly important source of financing. Bond market and bank lending premiums have increased substantially (Chart 1.8). A majority of the banks in Norges Bank’s lending survey in October report that, owing to developments over the past year, they require stricter debt-servicing capacity and equity ratio requirements for new CRE loans. A large amount of bond debt issued by CRE firms will mature in the years ahead. A marked fall in commercial property prices may lead to some CRE firms finding it difficult to issue new bonds at the same time as obtaining bank loans may be more challenging.
Chart 1.8 Higher premiums increase refinancing costs13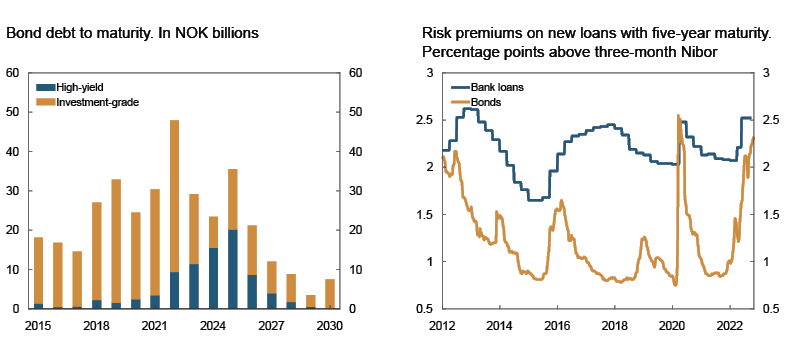
The CRE market is heterogenous, where office buildings are by far the largest segment. An analysis14 by Norges Bank indicates that banks are broadly exposed to various categories of commercial property. Office premises in the largest cities account for the largest share of commercial property value in Norway, and banks have considerable exposures to this segment (Chart 1.9). Banks also have large exposures to retail and industrial buildings and exposure to warehouse/logistics properties is also substantial, while banks are markedly less exposed to hotels and restaurants. Banks’ diversification across various segments in isolation reduces the risk of losses on banks’ CRE exposures.
Commercial buildings by segment. Percent Chart 1.9 Banks’ exposures reflect market composition15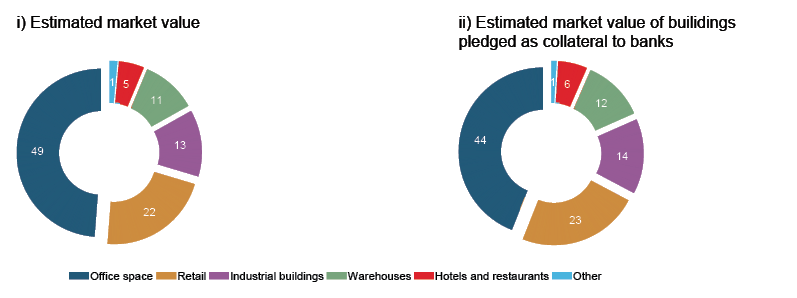
The climate transition may result in structural changes in the CRE market. Norges Bank’s analyses show that the usage costs of buildings with low energy-efficiency may increase considerably in the event of high electricity prices over time, which in turn could weaken the rents of such buildings (see “Growing importance of energy-efficient buildings in the years ahead”). The effect on rents in such a situation is very uncertain, and the impact on rents can be mitigated by energy efficiency measures. The analysis also shows that less than 25% of commercial buildings in Norway have a registered energy label, and among these fewer than half have a high energy label rating. Office buildings have the highest share of buildings with an energy label rating, and bank exposure to this segment is particularly high. Norway does not yet have a system in place to classify Norwegian buildings according to the EU green taxonomy, which will enter into force in Norwegian law in 2023. Inadequate reporting according to the taxonomy can have consequences for the ability of Norwegian banks to issue “green loans”, and thus the possibility to raise “green funding” with lower credit premiums.
One bank’s funding is another bank’s liquidity reserves
Banks are interconnected through interbank exposures and common or similar securities portfolios, often traded in the same markets. Close interconnectedness means that problems in one bank can easily spill over to other banks. At the same time, a high level of interbank cooperation in the money market is important for promoting the efficient distribution of liquidity and the transmission of monetary policy. Banks also have an important role to play as intermediaries in financial markets, where they contribute to maintaining liquidity (see also Section 2).
Norwegian interbank exposure has accounted for about 6% of bank balance sheets in recent years. More than half of this exposure is through the covered bond market, and in total banks hold approximately 60% of other Norwegian banks’ covered bonds issued in NOK (Chart 1.10). Banks’ share of covered bond holdings, both as a share of balance sheets and the volume outstanding in the market, has risen since the Liquidity Coverage Ratio (LCR) requirement was introduced at the end of 2015. The high ownership share is likely attributable to the fact that covered bonds are the largest type of securities in the Norwegian market that can be used to both satisfy liquidity requirements and as collateral for loans from Norges Bank.
Chart 1.10 Banks hold the majority of covered bonds16 Ownership composition for bonds issued by Norwegian mortgage companies in NOK. Percent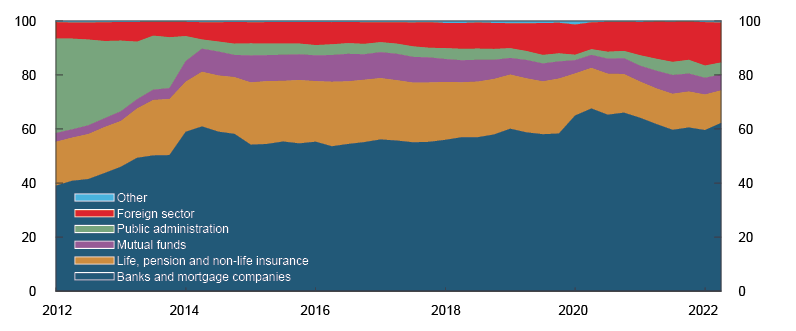
Covered bonds are also an important source of funding and account for two thirds of banks’ and mortgage companies’ bond funding. About half of covered bond funding is issued in NOK. Banks therefore act both as issuer and investor in this market.
The purpose of owning liquid securities is to enable banks to sell or pledge these securities if they have difficulty in obtaining new funding. If there are simultaneous fire sales of covered bonds by a number of banks, prices may fall sharply. This will reduce the value of banks’ liquidity portfolios, making them less able to withstand liquidity problems. Since a number of banks hold the same or similar securities, the fall in value owing to fire sales can be a source of losses across the financial system.17 The cover pool for covered bonds largely comprises collateralised residential mortgage loans and a concurrent pronounced fall in house prices can further exacerbate funding problems and amplify the sell-off of covered bonds (see Section 2).
In recent years, the composition of Norwegian banks’ liquidity reserves in NOK has changed somewhat. The share of covered bonds in the liquidity reserves has fallen from about 55% to slightly less than 50% (Chart 1.11). The fall in the share of covered bonds has been matched by a higher share of securities issued in NOK by multilateral development banks and foreign public companies and local governments.
Chart 1.11 Covered bonds as a share of banks’ liquidity portfolios has fallen somewhat18 Liquidity portfolio in NOK by asset type. Norwegian banks and mortgage companies. Values after haircut. Percent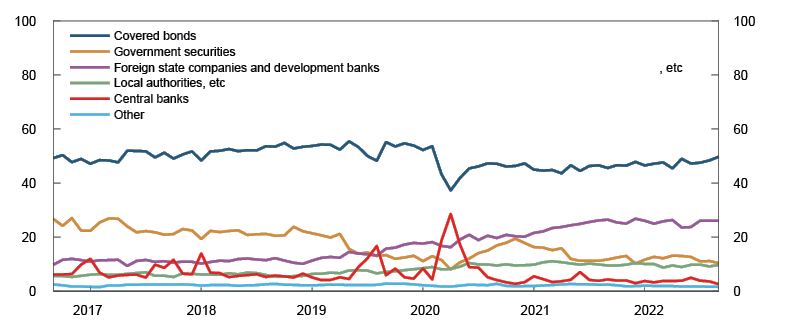
A diversified liquidity portfolio helps banks to spread divestments over several types of securities, which contributes to reducing vulnerabilities associated with interbank exposures. At the same time, banks’ share of covered bond holdings are little changed in recent years.
House prices have risen substantially in recent years, but have now started to fall
House prices have long risen faster than income. Through the pandemic, house prices rose substantially owing to low interest rates and limited consumption opportunities (Chart 1.12).
Chart 1.12 House prices have risen substantially in recent years, but have now begun to fall19 Percent
House prices fell in autumn, after rising rapidly at the beginning of 2022. The fall has been somewhat more pronounced than projected. Many existing dwellings put on the market and lower sales have led to a strong rise in the number of unsold dwellings. House prices are expected to continue to decline in the period to autumn 2023, primarily owing to higher lending rates (see Monetary Policy Report 3/22). After a period of very low lending rates and high household debt ratios, it is uncertain how households will react to substantial increases in prices and interest rates. For example, household demand for housing may be more sensitive to interest rate increases than assumed in our projections. Changes in house price expectations may also result in a sharper fall in house prices than projected, for example if many households bring forward home sales and postpone home purchases. Large declines in house prices may contribute to a sharp tightening of household consumption and substantial bank losses (see Section 3.1). There have, however, been very few periods of sharply falling house prices in Norway since the mid-1900s (see “Few periods of a steep fall in house prices in Norway”).
House prices in many countries rose considerably faster than in Norway during the pandemic (Chart 1.13). Recently, house prices have declined in a number of countries. The decline has been particularly pronounced in New Zealand and Sweden, where prices have fallen by around 10% since the price peak. Since the beginning of 2020, house prices overall have nevertheless risen by more than 30% in the US, New Zealand, the Netherlands, Canada and Germany. In the same period, house prices in Norway have risen by around 15%.
Chart 1.13 House prices have recently fallen in many countries20 Index. January 2020 = 100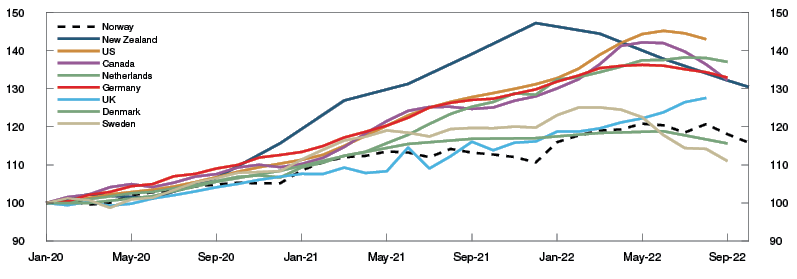
Few periods of a steep fall in house prices in Norway
House prices in Norway have risen sharply in recent decades (Chart 1.B). Historically, real house prices, ie house prices relative to inflation, have rarely fallen. Prior to the Second World War, there were four periods of a substantial fall in real house prices. Three of these periods occurred in the first half of the 1900s, and as a result, real house prices through almost all of the 1900s were lower than at the end of the 1800s.
Chart 1.B Few periods of a steep fall in house prices over the past 200 years1 Real house prices. Index. 2000 = 100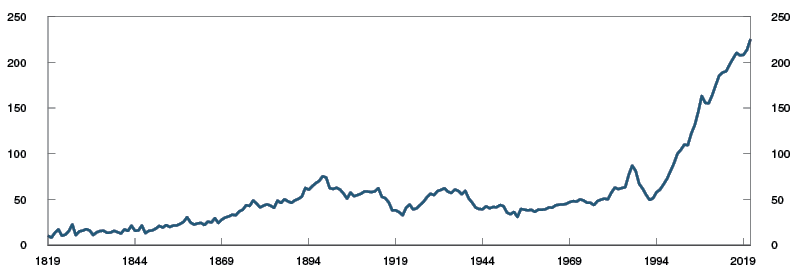
Since the Second World War, the only steep fall in real house prices occurred during the banking crisis. Between 1988 and 1992, real house prices fell by just over 40% from peak to trough, and it took more than five years for real house prices to return to their pre-1988 levels (Chart 1.C). The second steepest fall in house prices in Norway over the past 50 years took place during the financial crisis, when real house prices fell by 12% from peak to trough. However, it took less than two years before prices returned to their pre-crisis peak. Many other countries experienced a steeper fall in house prices during the financial crisis. In the US, the fall in house prices overall was approximately the same as during the banking crisis in Norway, but house prices also fell sharply in Denmark, the Netherlands and the UK, for example (Chart 1.D).
Chart 1.C Few house price falls in Norway in the last decades2 Real house prices. Seasonally adjusted. Quarter before price fall = 100. Quarters since start of price fall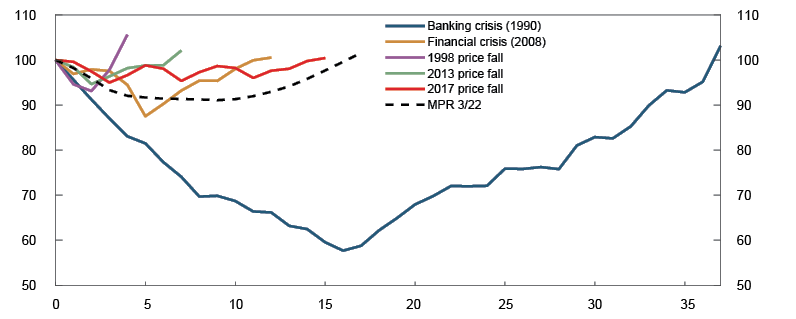
Chart 1.D Steeper falls in other countries during the financial crisis3 Real house prices. Unadjusted. Quarter before price fall = 100. Quarters since start of price fall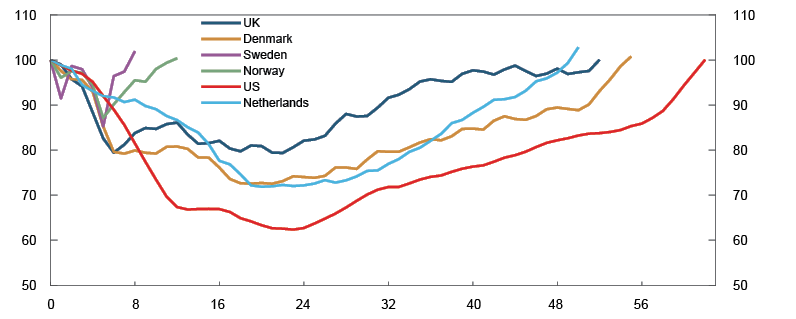
Since the financial crisis, Norway has experienced two minor house price declines, in 2013 and 2017, respectively. The projections in Monetary Policy Report 3/22 suggest that real house prices will fall by 9% over the coming year. This is slightly less pronounced than the fall observed during the financial crisis in Norway, but it is expected that it will take somewhat longer for house prices to recover. The projections are uncertain, however.
1 Period: 1819 - 2021.
House prices adjusted for Consumer Price Index (CPI).
2 Nominal house prices adjusted by consumer price index adjusted for tax changes and excluding energy products (CPI-ATE).
3 Indexed to 2007 Q3 for Norway, Sweden, Denmark and the UK, 2006 Q1 for the US and 2008 Q3 for the Netherlands. Nominal house prices adjusted for CPI excluding food and energy prices.
The prices of many securities have risen over a long period but have reversed course
During the pandemic, securities prices have risen sharply. The rapid rise has largely been driven by lower returns, which in turn reflect the very low long-term interest rates in many countries. Over the past year, long-term interest rates have moved up, and securities prices globally and in Norway have fallen. At the same time, there is considerable geopolitical uncertainty, and the outlook for growth and inflation is uncertain. This increases the risk of negative events that can lead to further financial market volatility and higher required rates of return.
Price volatility has been high in the equity and bond market in Norway in 2022 (Chart 1.14). In terms of the Oslo Børs Benchmark Index, the value of Norwegian equities overall has remained broadly unchanged this year. However, there are considerable differences in price performance across sectors. In some sectors, such as oil and gas, earnings growth has been strong and prices have risen considerably. In many other sectors, such as real estate, prices have fallen sharply in 2022. Compounded indexes for Norwegian bonds show a price fall of around 6%. The fall in prices has been driven by both higher interest rates and higher credit premiums. The increase in premiums coincides with low issue activity in the corporate bond market and a rapid rise in bank lending.
Chart 1.14 Securities prices have been volatile and have fallen somewhat this year21 Compound indexes for different kinds of securities. Index. Week 1 2022 = 100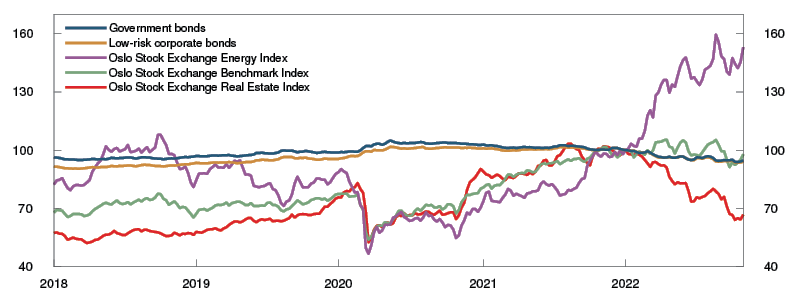
Sharp falls in securities prices can weaken financial stability through a number of channels. Sharp falls in securities prices may impair banks’ access to wholesale funding and reduce the value of their securities holdings. Liquidity and capital regulation strengthen banks’ resilience to periods of market stress, but banks are nonetheless vulnerable to a prolonged dry-up of wholesale funding. Reduced access to wholesale funding will also affect firms that obtain financing directly in the bond market. A steep and abrupt fall in securities prices may increase the risk of fire sales of securities by financial institutions (see Section 2.4), which may amplify market stress. Many households hold equities and bonds, even though housing and other real estate account for most of household wealth. Many households have increased their financial assets through the pandemic and have increased their exposure to equity markets when transitioning from a defined-benefit to defined-contribution pension scheme (see Section 2.4). This increases the risk that a fall in securities prices will contribute to tightening consumption and reducing corporate earnings.
5 Dividend tax was increased from 31.7% in 2021 to 35.2% in 2022, which explains the jump in dividend income in 2021.
6 Period: 1983 Q1 – 2022 Q2. Debt-to-income ratio is loan debt as a percentage of disposable income. Disposable income is income after taxes and interest payments. Debt service ratio is interest and estimated principal payments as a percentage of after-tax income. Interest burden is interest payments as a percentage of after-tax income.
7 Period: 2010–2020.
Debt as a share of disposible income. By age of the household’s main income earner.
8 See discussion in Monetary Policy Report 3/22 for estimated consumption and box on page 38 in Monetary Policy Report 2/22 on the estimated effect of higher interest rates and consumer prices facing households.
9 See Lindquist, K.-G., H. Solheim and B.H. Vatne (2022) “Personer med lav inntekt og uten bolig holder mest av særlig utsatt forbruksgjeld” [Low income, non-homeowners hold the largest share of the most vulnerable consumer loans]. Blog post published on the Bankplassen blog on 17 August 2022. Norges Bank (in Norwegian only).
10 Period: 2007 Q1 – 2022 Q3
11 See Malling og Co (2022) “Yield- og sentimentundersøkelse Q3 2022” [Yield and sentiment survey 2022 Q3] (in Norwegian only).
12 Period: 2007 Q1 – 2022 Q3. Prime office space.
13 Period: 2015–2030
Period: Bank loans: 2012 Q1 – 2022 Q3. Bonds: Week 1 2012 – Week 44 2022
The margin for bank loans is for a loan on centrally located office space in Oslo as colleteral, an LTV of 65% and average remaining lease term of 7 years. Bond premiums are for investment grade firms.
14 See Bjørland, C., I.N. Hjelseth, J.H. Mulelid, H. Solheim and B.H. Vatne: “Næringseiendomsmarkedet – ikke lenger en ‘svart boks’”, [The CRE market – no longer a “black box”] (in Norwegian only, forthcoming in English). Staff Memo 6/2022. Norges Bank.
15 At 30 June 2022
16 Period: 2012 Q1 – 2022 Q2
17 See box on page 45 of Financial Stability Report 2019.
18 Period: September 2016 – September 2022
19 Period: January 2016 – October 2022.
20 Period: January 2020 – October 2022.
Linear interpolation of quarterly data for Denmark and New Zealand. Data including August 2022 for the UK and the US and data including September 2022 for Sweden, the Netherlands, Germany, Canada and Denmark. For Denmark, the data only cover detached houses. The Canada index is a weighted average of eleven metropolitan areas.
21 Period: Week 1 2018 – week 44 2022.
1.3 Cyber attacks are a potential threat to financial stability
The number of cyber attacks on the financial sector has increased in recent years. So far, cyber attacks have not given rise to financial crises in Norway or globally, but the increased number of serious incidents, such as the Colonial Pipeline attack, illustrates the potential for attacks to have systemic consequences if they impact critical parts of the financial system. In serious cases, attacks against individual institutions can also have consequences for the system as a whole. This suggests a need for strengthened resilience to cyber attacks at both individual entity level and systemic level.
A digitalised financial system increases vulnerability to cyber attacks
The Norwegian financial system is highly digitalised, which makes it cost-efficient, highly flexible and user-friendly but also vulnerable to cyber attacks. Interconnectedness and concentration in the financial system can further amplify and propagate the consequences of a cyber attack, particularly if attacks impact critical infrastructure, key ICT providers or widely used software. If an attack disables critical functions or if institutions not directly impacted experience liquidity problems, financial stability may be threatened. This applies especially if confidence in the financial system weakens.
System vulnerabilities depend on how well individual institutions are able to reduce their own operational risk. Greater specialisation and a high degree of outsourcing of ICT services result in longer and more complex supply chains. This makes it more difficult to monitor and manage cyber risk, which is also compounded by the recruitment difficulties in this field. According to Finanstilsynet’s assessment, the risk associated with firms’ cyber defences and contractor management has increased somewhat since 2021.22
Norges Bank has previously pointed out that critical functions in the financial infrastructure are dependent on a handful of key ICT providers. Greater use of cloud services increases concentration. Large ICT providers have more resources and expertise for strengthening the cyber resilience of their solutions than smaller providers. At the same time, increased concentration and more dependencies will amplify the impact of a successful attack. The forthcoming European Digital Operational Resilience Act (DORA) will likely enter into force in the EU in 2023 and authorise the supervision of systemically important financial sector service providers.
The threat landscape has become more difficult to gauge
The financial sector manages substantial assets, making it a particularly attractive target for organised crime. It also manages a considerable amount of sensitive information, and participants in the system operate critical infrastructure. This makes the financial system a potential target for state actors, both in peacetime for intelligence gathering and in times of armed conflict. For example, in its threat assessment for 2022, DNB notes that state actors have attempted to gain access to the bank’s computer systems, although these attempts occur far less frequently than attempts made by criminal actors.23 At the same time, it is difficult to draw a clear distinction between criminal and state threat actors, because, among other things, organised crime sells their services to state actors and state actors are also profit-seeking.
With increasing professionalisation and specialisation among threat actors, cybercrime is becoming increasingly complex and difficult to defend against. The Norwegian National Security Authority (NSM) points out that vulnerable supply chains are increasingly being targeted. Cyber criminals search for security gaps in widely used software, which in many instances they are able to exploit before the gap is identified. This gives financial system participants very little time to defend at-risk systems. Supply chain attacks are still expected to pose an important threat. The same applies to ransomware attacks, which DNB sees as its primary threat.
Cyber attacks are being extensively used in the war in Ukraine. So far, the war has not led to an increased number of attacks against the Norwegian financial system, but the threat landscape has become more unpredictable and difficult to gauge. Hacktivist and cyber crime groups have actively taken sides in the conflict and executed cyber attacks against targets that they perceive to be serving Ukrainian or Russian interests. At the end of June, a pro-Russian group carried out a denial-of-service attack against a number of Norwegian websites that provide important services to the population.24 The attacks had limited consequences but showed that Norway is considered a target. Norwegian entities can also be impacted indirectly by spillovers from cyber attacks aimed at the warring parties. The risk of attack against the Norwegian financial system may increase if the conflict escalates.
Cyber resilience must be strengthened further
Cyber resilience means being able to prevent attacks, but being able to detect and deal with attacks and to restore operations if an attack is successful is equally important. The individual entity’s efforts constitute the most important part of defence against cyber attacks. In Risk and Vulnerability Analysis 2022, Finanstilsynet points out that firms are working continuously to strengthen defences. Attacks are usually averted before they have an impact. In Finanstilsynet’s assessment, the key institutions in the financial infrastructure generally also have sound contingency plans. In Financial Infrastructure Report 2022, Norges Bank considers the Norwegian financial infrastructure to be secure and efficient but at the same time it also points out an increase in cyber threats.
Since the consequences of a cyber attack can propagate through the financial system, it is essential that different authorities and entities cooperate to keep the system secure. The Norwegian financial sector has a long tradition of cooperation between key participants. In the field of cyber resilience, cooperation is coordinated by the Nordic Financial CERT (NFCERT).25 Norges Bank is working with Finanstilsynet to introduce cyber resilience testing based on the Threat Intelligence-based Ethical Red Teaming framework in Norway (TIBER-NO) and is promoting knowledge-sharing between private entities through the TIBER-NO Forum.26
22 See Finanstilsynet (2022) “Risk and Vulnerability Analysis 2022”.
23 See DNB (2022) “DNBs trusselvurdering for 2022” [Threat assessment 2022] (in Norwegian only).
24 See Norwegian National Security Authority’s webpage (in Norwegian only).
25 Nordic Financial CERT is a non-profit organisation. Its purpose includes sharing threat intelligence and information about vulnerabilities and assisting financial institutions in dealing with cyber attacks, see NFCERT’s website.
26 See Financial Infrastructure Report 2022, page 14.
1.4 Wider use of crypto-assets can be a source of systemic risk
Concepts in crypto-assets
Crypto-assets encompass a number of asset types based on distributed ledger technology (DLT). A number of cryptocurrencies, such as Bitcoin and Ether, function as infrastructures for different tokens and applications in decentralised finance.
Stablecoins are tokens, which through different mechanisms aim for a stable value against a reference, normally USD. See box on page 17 in Financial Infrastructure Report 2022 for a glossary of terms.
The increased exposure of institutional investors and financial institutions to crypto-assets can become a source of systemic risk. Abrupt and steep falls in crypto-asset values can inflict large losses, and if the crypto-asset is widely adopted, fire sales of other assets to cover leveraged positions can lead to financial instability.
There is currently limited information on Norwegian banks’ direct or indirect crypto-asset exposure. The capital framework for banks indicates that this exposure is small. In a consultation from the Basel Committee on Banking Supervision, rules are being proposed to clarify that as a main rule, banks’ exposure to unsecured crypto-assets must be fully financed by equity. Rules are also being proposed to improve banks’ reporting of crypto-asset exposures.27 The value of crypto-assets has been highly volatile and has fallen markedly so far in 2022 (Chart 1.15).
Chart 1.15 The market value of crypto-assets has fallen markedly the past year28 Market value of crypto-assets. In trillions of USD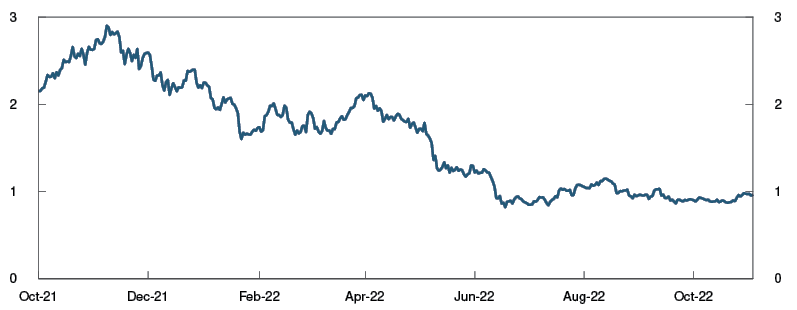
According to the tax authorities, more than 40 000 individuals owned crypto-assets in 2021 with an assessed value for 2021 totalling NOK 20m.29 In a March 2022 survey conducted by Arcane Research and EY, over 400 000 Norwegians are estimated to have owned cryptocurrencies in 2022, an increase from the 2021 estimate of 300 000.30 Both Norwegian and global institutional investors have crypto-asset exposures. One example is the Norwegian company Seetee, in which the Aker Group has a large stake. A number of international financial institutions have also entered the market.31 Closer linkages between crypto-assets and traditional finance can be a source of systemic risk, particularly in countries with substantial crypto-asset exposure.32 Surveys have shown a positive correlation between prices for crypto-assets and equities,33 which may indicate systemic risk owing to contagion between markets for crypto-assets and equities.
Stablecoins and their stabilisation mechanisms are another source of systemic risk. Stablecoins are stabilised in different ways. Market leaders, such as USD Circle, are stabilised using traditional assets. Selected market participants can exchange such stablecoins for a national currency at a fixed exchange rate. Other stablecoins are backed by crypto-assets and automatic liquidity mechanisms. Loss of confidence in asset-backed stablecoins can lead to fire sales of the underlying assets and potential losses for all owners of these or similar assets. Algorithm-based stablecoins34 are based on confidence in the stabilisation mechanisms. The collapse of USD Terra (UST) in the beginning of May 2022 is an example of how a loss of confidence can result in abrupt and steep price declines. Prior to the collapse, UST was the third largest stablecoin by market value.
If stablecoins or other crypto-assets come to play a substantial role in the payment system, loss of confidence can lead to a situation where payments cannot be executed. CPMI-IOSCO, an international body for payment and securities market authorities, has prepared guidelines for requirements for stablecoins used in systemically important payments, such as securities settlement. The guidelines are in accordance with general financial infrastructure requirements.35
Crypto-assets are relevant in a number of policy areas. Key regulatory themes are strengthening financial stability, preventing criminal applications, consumer protection and market integrity. Many authorities and international government bodies36 have pointed out the increased importance of crypto-assets to systemic risk even though crypto-assets are not currently deemed to constitute a significant risk to financial stability in Norway or globally. A statement issued by the Financial Stability Board (FSB) in July underlined the need for an internationally coordinated framework grounded in the principle of “same activity, same risk, same regulation”.37 In a report from October, the FSB elaborated on regulatory approaches.38 The European Commission’s proposed Markets in Crypto-Assets Regulation (MiCA) has been debated by the Council and the Parliament.39
New rules will reduce the destabilising effects of crypto-assets, although many challenges remain. Access to data and relevant indicators are one challenge; regulatory gateways for holding decentralised system participants liable are another. Norges Bank will contribute to decision bases and help to draft rules for promoting responsible innovation.
27 See The Basel Committee of Banking Surpervision (2022) “Prudential treatment of cryptoasset exposures – second consultation”. Consultative Document. BIS, June 2022.
28 Period: 1 October 2021 – 3 November 2022
29 See the Norwegian Tax Administration’s website (in Norwegian only).
30 See Arcane Research and EY (2022) “Norwegian Crypto Adoption Survey 2022”.
31 See Auer, R., M. Farag, U. Lewrick, L. Orazem and M. Zoss (2022) “Banking in the shadow of Bitcoin? The institutional adoption of cryptocurrencies”. BIS Working Papers no 1013. BIS. See also OECD (2022) “Institutionalisation of crypto-assets and DeFi–TradFi interconnectedness”. OECD Business and Finance Policy papers. OECD, May 2022.
32 See European Securities and Markets Authority (2022) “Crypto-assets and their risks for financial stability”. ESMA Newsletter. ESMA, October 2022 and Drakopoulos, D., F. Natalucci og E. Papageorgiou (2021) “Crypto Boom Poses New Challenges to Financial Stability”. Blog post published on IMF Blog 1. September 2021. IMF.
33 See Adrian, T., T. Iyer og M.S. Qureshi (2022) “Crypto prices move more in sync with stocks, posing new risks”. Innlegg publisert på IMF Blog 11. januar 2022. IMF.
34 See Financial Infrastructure Report 2022 for a more detailed description of algorithmic stablecoins.
35 See CPMI-IOSCO (2022), ”Application of the Principles for Financial Market Infrastructures to stablecoin arrangements”. Consultative Report. BIS, July 2022.
36 See International Monetary Fund (2022) «Global financial stability report – April 2022», Bank for International Settlements (2022) «Annual Economic Report 2022», European Central Bank (2022) “Mining the environment – is climate risk priced into crypto-assets?” Macroeconomic Bulletin 18. ECB, July 2022 and The White House (2022) “Executive Order on Ensuring Responsible Development of Digital Assets” – March 2022.
37 See FSB (2022) “FSB issues statement on the international regulation and supervision of crypto-asset activities”. FSB, 11 July 2022.
38 FSB (2022), “Regulation, Supervision and Oversight of Crypto-Asset Activities and Markets”. Consultative Document. FSB, 11 October 2022.
39 For progress, see European Parliament (2022), “Proposal for a regulation of the European Parliament and of the council on markets in crypto-assets”. European Parliament, February 2022.
1.5 The financial system is resilient, thanks to its robustness and the measures implemented
Since the financial crisis in 2008, Norwegian authorities have introduced a number of regulations (see “Important measures in the financial system in Norway”). The measures that have been introduced help improve financial system resilience and can mitigate vulnerabilities.
Several of the measures addressing structural vulnerabilities affect banks’ total capital requirements, such as requirements for the systemic risk buffer (SyRB), risk-weighting requirements, and a minimum requirement for own funds and eligible liabilities (MREL). There are also requirements for banks’ liquidity and credit standards. Cyber resilience of financial institutions will be tested according to the TIBER framework.
The Lending Regulation’s requirements for loan-to-value ratios, debt servicing capacity and debt-to-income ratios have a dampening effect on borrowing by many households, which reduces their vulnerability to a fall in house prices, income loss and higher interest expenses. Norges Bank is of the opinion that the Regulation’s debt-to-income ratio requirements and the flexibility quotas can continue to apply unrevised at present.40 The current Regulation strikes a good balance between curbing the build-up of household vulnerabilities and providing access to credit. In June, the Bank pointed that a broad review of the Regulation should be conducted before it expires in 2024, and that changes to the interest rate stress test should be considered based on the experience of higher interest rates ahead.
In autumn 2021, Norges Bank was given formal advisory responsibility for the SyRB, and in June, the Bank published a framework for providing advice on the SyRB rate (see “Norges Bank’s advice on the systemic risk buffer”). Norges Bank’s Monetary Policy and Financial Stability Committee has decided to advise the Ministry of Finance to retain the 4.5% SyRB rate for all exposures in Norway, applicable to all banks.41 In Norges Bank’s assessment, key structural vulnerabilities in the Norwegian financial system are broadly at the same level as when the decision was made to raise the SyRB rate to 4.5%. It is further assessed that an SyRB rate of 4.5% contributes to banks holding sufficient capital to withstand future downturns (see Section 3).
The countercyclical capital buffer (CCyB) should reflect the assessment of cyclical vulnerabilities in the financial system. The CCyB is intended to strengthen banks’ solvency and mitigate the risk that banks amplify an economic downturn. In March 2022, Norges Bank decided to increase the CCyB rate to 2.5%, effective from 31 March 2023. According to the capital framework, the CCyB rate should, in principle, be set between 0% and 2.5%. Norges Bank is of the view that the CCyB rate should normally be in the higher part of this range. Analyses of the need for time-varying capital buffers, such as stress tests, lend support to this view. If a downturn will or could cause a markedly reduction in credit supply, the CCyB rate should be lowered.
The floor for average risk weights is also intended to ensure sufficient bank capital levels. If IRB risk weights are below the floor, banks must hold more capital. The Ministry of Finance has requested Finanstilsynet’s assessment of the need to retain or change the floors from end-2022. Finanstilsynet has exchanged assessments and information with Norges Bank. Norges Bank recommends retaining the floors for IRB banks’ risk weights for residential mortgages and CRE loans at the current levels.42 Financial system vulnerabilities are at broadly the same level as at the time the risk-weight floors were introduced. The Bank’s calculations, based on data going back to the banking crisis in the early 1990s, indicate that the current risk-weight floors are at a level that will prevent bank capital from becoming too low. Furthermore, banks incentives for maintaining sound risk management should be retained, which suggests that the risk-weight floors should not be the binding requirement.
The capital requirements contribute to the solvency of Norwegian banks. Analyses show that Norwegian banks’ current capital levels are in line with updated studies of how much equity capital banks should hold in the long term (see Section 3). In the analysis, weight is given to the economic costs and benefits of capital requirements. Norwegian banks are also profitable, and their funding structure is resilient. This strengthens banks’ loss-absorbing capacity, lending capacity and ability to withstand market turbulence, which increases financial system resilience. Stress tests show that in a pronounced downturn, where large shocks to the Norwegian economy are amplified by financial system vulnerabilities, the current capital buffers of the largest Norwegian banks are sufficient to absorb losses (see Section 3). Downturns can occur abruptly and come from unexpected sources. The current situation in the Norwegian and global economy illustrates the importance of maintaining financial system resilience. In Norges Bank’s overall assessment, the Norwegian financial system is well equipped to meet the risks we are facing in the current situation. Norges Bank’s advice that the SyRB rate should be maintained contributes to maintaining a resilient banking sector.
40 See Norges Bank’s letter to the Ministry of Finance on 9 November 2022 (in Norwegian only).
41 See Norges Bank’s letter to The Ministry of Finance on 9 November 2022.
42 See Norges Bank’s letter to Finanstilsynet on 26 October 2022 (in Norwegian only).
Norges Bank’s advice on the systemic risk buffer
The systemic risk buffer (SyRB) is a part of banks’ total capital requirement and one of the macroprudential instruments used in Norway. The SyRB is intended to increase banking system resilience by ensuring that the banks hold a capital buffer based on the level of structural vulnerabilities in the financial system. The Ministry of Finance sets the SyRB rate. Norges Bank is responsible for preparing a decision basis and providing advice on the SyRB rate to the Ministry of Finance at least every other year. The decision basis is to contain analyses based on relevant indicators, recommendations and guidance from the European Systemic Risk Board (ESRB) as well as Norges Bank’s assessment of structural vulnerabilities and other systemic risks of a long-term nature. When formulating the decision basis, information and assessments are exchanged with Finanstilsynet.
Purpose of the SyRB
Experience shows that the financial system can trigger and amplify economic downturns. Financial system vulnerabilities can amplify shocks, leading to more serious consequences for the economy. The SyRB is intended to strengthen banks’ solvency during a downturn.
No specific criteria have been laid down in the EU capital framework for deciding on the SyRB rate, but the rate must be justified on the basis that risks are not sufficiently addressed by the other capital requirements. There is no upper limit for the SyRB rate, although for SyRB rates between 3% and 5%, the EFTA Standing Commitee must provide its opinion, and the macroprudential authority in that member state must comply with that opinion or give reasons for not doing so (“comply or explain”). SyRB rates above 5% require the authorisation of the EFTA Standing Commitee. A country with an SyRB rate can request that the ESRB recommend reciprocation of this SyRB rate.
Norges Bank’s assessment of the SyRB rate
Norges Bank has developed three main principles for their advice on the SyRB (see Norges Bank Papers 5/2022 “A framework for advice on the systemic risk buffer requirement”):
- The SyRB rate should reflect the assessment of structural vulnerabilities in the financial system.
- The SyRB is intended to contribute to ensuring that banks hold sufficient capital to weather future downturns.
- The SyRB should as a main rule apply to all exposures in Norway.
Advice on the level of the SyRB is based on assessments of four different elements: Structural vulnerabilities in the financial system, other macroprudential measures, banks’ overall capital needs and banks’ responses to a change in the SyRB rate. The assessment of structural vulnerabilities is based on a set of indicators that reflect these elements (see Norges Bank’s website).
Households are resilient to moderate increases in interest rates and other expenses
In 2022, Norwegian households have faced increased expenses for electricity and food and rising interest expenses. Households that cannot cover current expenses are at risk of defaulting on their debt. The analysis shows that households without enough income and available wealth to cover normal expenses and interest payments during the 2020 reference year accounted for close to 1% of total debt. In a sensitivity test with expected 2023 residential mortgage lending rates, the share increases to just over 2%. However, in a stress test with higher food and electricity prices and where interest rates approach 10%, the share rises to over 15%. In such a stress situation, higher losses on bank lending to households can be expected.
Over the past year, prices for essentials such as food and electricity have increased. Interest rates have risen and are expected to rise further. Close to 70% of Norwegian households are homeowners, and nearly all household debt is in the form of residential mortgages. The vast majority of these mortgages are floating-rate mortgages. The analysis sheds light on how higher expenses affect the number of homeowners that may experience difficulty servicing their debt.1 The exercise is static, ie it does not take into account that households can make a number of adjustments in response to higher expenses, such as reducing electricity consumption.
The calculations use actual figures for the individual household’s after-tax income, gross financial wealth, debt and housing, and estimated figures for normal living expenses and interest expenses. Normal living expenses are based on the National Institute for Consumer Research (SIFO) Reference Budget for Consumer Expenditure and reflects a level of consumption that households need in order to maintain a modest standard of living. Normal living expenses include costs related to owner-occupied housing, including electricity expenses. Many households have liquid funds to draw on in periods when expenses exceed income. This is particularly the case for older persons. It is therefore also assumed that a share of gross financial wealth can be used to cover expenses.2 It is further assumed that homeowners with low debt-to-value ratios can cover expenses by borrowing.3 This analysis focuses on the ability to cover the most essential current expenses. Principal repayments and provisions for necessary residential maintenance are excluded.
It was found that in 2020, an average homeowner would have expected to spend close to 10% of income on food and over 20% on other consumption excluding housing and electricity (Chart 1.E). Expenses for estimated electricity consumption accounts for just above 2% of income in 2020, while interest expenses account for around 7%. The share of income spent on both food an electricity is broadly in line with the findings of Statistics Norway’s 2012 survey of consumer expenditure. Households are divided into income quintiles. Expenses for food and other consumption vary according to the size of the household, but other expenses depend on the households’ housing situation and debt, which often correlates with income. Low-income households devoted a larger share of income to normal living expenses, while the share for interest expenses was approximately the same across income quintiles. For the average household, normal living expenses and interest expenses account for close to 45% of after-tax income in 2020. This means that over half of income could be spent on consumption beyond normal living expenses, principal payments or other saving.
Chart 1.E Low income earners spend a large share of their income on food and other consumption Share of after-tax income by consumption groups and income quintile. 2020. Percent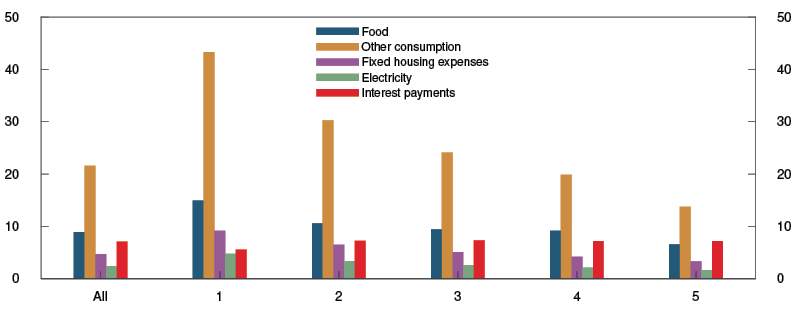
Household debt-servicing capacity is measured by whether a household has sufficient income to cover normal living expenses and interest payments or the ability to cover such expenses by drawing on some of their financial wealth or borrowing against home equity. Sensitivity analyses based on data from 2020 show that ½% of households were unable to cover normal living expenses and interest expenses given the average lending rate for that year, 2.3%, (Chart 1.F). They accounted for just under 1% of total homeowner debt. Over 90% of the households assumed to have payment problems are in the lowest income quintile. The small share of households and debt held by households with payment problems is consistent with low reported bank losses.
Share with debt servicing problems at different lending rates. By income quintile. Percent Chart 1.F The growth in the share of households with debt servicing problems increases with higher interest rates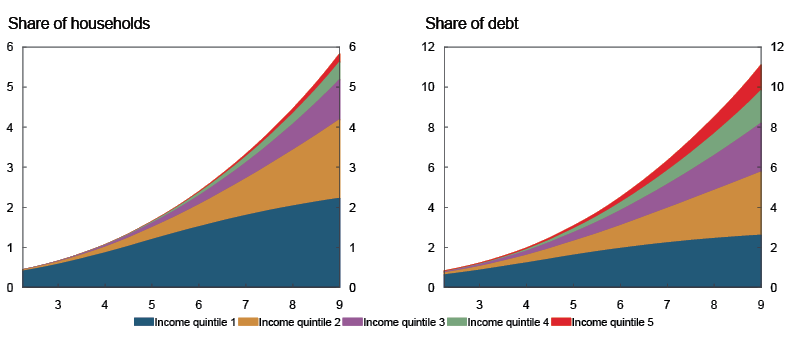
With a residential mortgage lending rate of 4.3%, which is the peak in 2023 according to projections in Monetary Policy Report 3/22, the share of households with payment problems is just over 1%. These households account for slightly more than 2% of debt.
The increase in the share of debt held by households with payment problems rises in pace with interest rates. Given a 9% residential mortgage rate as assumed in the stress test in Section 3, the share is found to rise markedly to close to 11%. As interest rates move up, the number of high-income households with payment problems increases. These households hold more debt than the lowest income quintile. Income quintiles 2–4 hold less than 20% of total household debt held by households with payment problems when lending rates are 2.3%, while at a lending rate of 9% this share rises to 65%.
Households are also impacted by the increase in electricity prices, but the Bank’s sensitivity analysis shows that the impact is cushioned substantially by the electricity cost support package. Even given an electricity price before cost support of NOK 4–5 per kWh, the impact on the share of households that cannot cover normal living expenses and interest expenses is small.
The sensitivity analyses have also been performed of debt-servicing capacity in the event of combinations of higher food and electricity prices, and higher lending rates in line with the projection in Monetary Policy Report 3/22. In the event of an electricity price of NOK 2.6 per kWh, a 10% increase in food prices and a residential mortgage rate of 4.3%, the share of debt that becomes at risk of default will be just above 2.5% (Chart 1.G).
Chart 1.G A sharp increase in households’ expenses could lead to debt servicing problems for many households4 Share of households with debt servicing problems and their share of debt in the event of higher interest rates, energy prices and food prices and a house price fall. The electricity cost support package is retained. Percent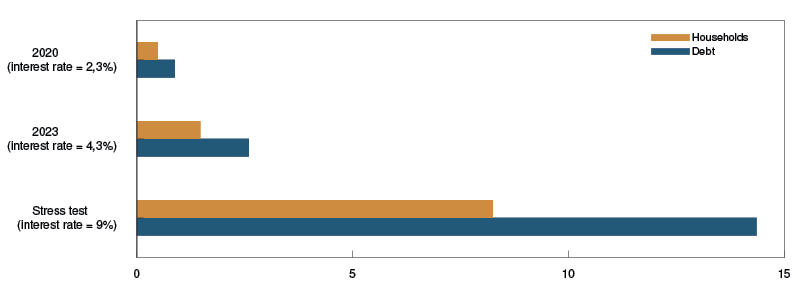
These numbers are still low and in line with the baseline scenario where banks’ losses remain at a low level. The estimate assumes fixed incomes, among other things. Wage income is projected to rise over time, which, if taken into account, would reduce the share of households with payment problems.
An estimate has also been made that illustrates the situation in the stress test in Section 3. This estimate is based on a 9% interest rate, a 20% decline in house prices, an electricity price close to NOK 4.5 per kWh before electricity cost support and a 10% increase in food prices. It is assumed that the current electricity cost support package will continue. Given the decline in house prices, fewer will borrow against home equity. The estimate finds that close to 15% of the debt is then held by households with payment problems.
The analysis sheds light on how many households may face debt repayment problems, how much debt they hold and their breakdown by income. Households face a substantial cost if they default. For temporary stresses, a larger share of financial wealth can likely be spent, although in a stress situation, asset values may decline and limit this possibility. High debt may reflect household ownership of a holiday home, for example, or other assets than can be borrowed against or sold. On the other hand, borrowing against other residential property or assets is limited by requirements for maximum DTI ratios and debt-servicing capacity. If faced with a liquidity squeeze, some homeowners could find support from family.
Banks’ potential losses on household loans depend on many factors other than the risk of default. In the event of default, banks do not incur a loss unless the loan cannot be repaid in other ways, such as by selling the collateral or other assets. If the debt exceeds the value of the collateral and other assets that can be sold, the bank can incur a loss given default.
1 The analysis uses a sample from the age group 20–90 from Statistics Norway’s latest available income and wealth statistics, which is for 2020. The data are linked to housing statistics from the Norwegian Mapping Authority, the costs for owner-occupied housing from the Norwegian Home Owners Association and consumption expenditure from SIFO. The analysis is documented in detail in Lindquist, K.-G., H. Solheim and B.H. Vatne (2022) “Norske boligeiere har god gjeldsbetjeningsevne” [Norwegian homeowners’ debt-servicing capacity is adequate]. Staff Memo 8/22. Norges Bank. (in Norwegian only, forthcoming in English).
2 Some financial wealth is tied to covering normal living expenses until next wage payment, and not all financial wealth is liquid. The calculation therefore excludes financial wealth equivalent to two months’ income and includes one fifth of the remainder.
3 Given an LTV ratio of 60%, which is the limit for lines of credit and is subject to principal repayment requirements, debt may increase by 1/5 of the unencumbered collateral value up to the 60% limit. Total debt is used for the calculation of the DTI ratio.
4 2023: Food prices rise by 10% and electricity prices increase by NOK 2.2 per kWh before cost support. The electricity cost support package is retained.
Stress test: Food prices are 10% higher, electricity prices rise by NOK 4 per kWh before cost support and house prices decline by 20%, in line with the stress test (See Section 3). The electricity cost support package is retained.
Growing importance of energy-efficient buildings in the years ahead1
In Norway, heating commercial buildings accounts for a significant amount of energy use. Less than 25% of commercial buildings in Norway have a registered energy label rating, and among these there remains a large share with poor energy performance or with a less environmentally friendly type of heating. Persistently high electricity prices can markedly increase usage costs for commercial buildings with poor energy performance. This may reduce the rents for such buildings. Energy saving measures will likely be an important source of cost reductions in the period ahead. A growing number of energy-efficient buildings and wider use of energy labelling will enable banks to issue a greater volume of “green loans”.
Approximately 20% of electricity consumption in Norway is related to usage in the service sector. The heating of commercial buildings accounts for a large part of this percentage. More energy-efficient buildings can help reduce emissions, and higher electricity prices provide financial incentives for reducing energy consumption.
In 2009, Norway introduced a regulation that requires energy labelling. All buildings over 1 000 square metres must have energy label ratings. The Norwegian scheme for energy labelling has two dimensions. The energy class (A to F) specifies energy consumption while the heating class (a scale with five categories from green to red) specifies the environmental friendliness of the type of energy used for heating.
High electricity prices amplify the impact of energy efficiency on costs. With electricity costs at less than NOK 1 per kWh, which has long been the case in Norway, the variable energy costs for an office building in Oslo with the lowest energy label rating account for under 20% of rental costs (Chart 1.H). With electricity costs at NOK 8 per kWh, the electricity bill could be as high as the rent. For Class A rated buildings, the costs in such a scenario would increase from 10% to around 35% of the rent.
Chart 1.H Electricity cost relative to rent could rise substantially when electricity prices are high Electricity cost relative to rent for a typical office building in Oslo for buildings with different energy ratings. Electricity price in NOK/kWh (horizontal scale)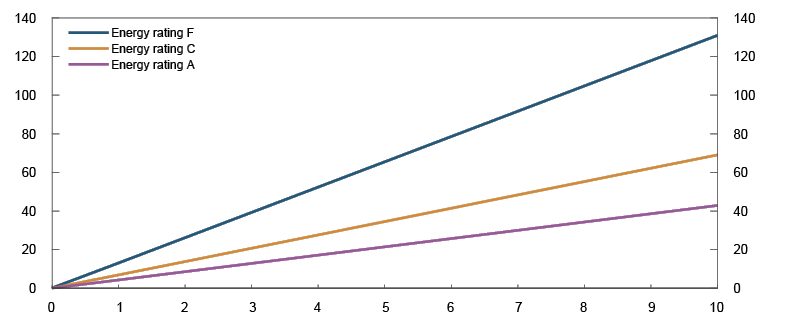
A simple static analysis shows the impact of higher electricity prices on rents. In most rental contracts, tenants cover electricity costs. In the exercise, it is assumed that renting offices with a particular energy rating is a matter of indifference to the tenant, if the sum of rents and electricity costs are equal. If electricity prices were to remain at levels observed over the past year, the willingness to pay for buildings with a low energy rating would fall substantially, and rents may have to be reduced substantially (Chart 1.I). In such a scenario, vacant space in buildings with a low energy rating could rise.
Chart 1.I Willingness to pay to rent office space with a low energy rating may fall if energy prices are high Possible market rent for office buildings with different energy ratings relative to a building with energy rating A for different electricity prices. Electricity price in NOK/kWh (horizontal scale)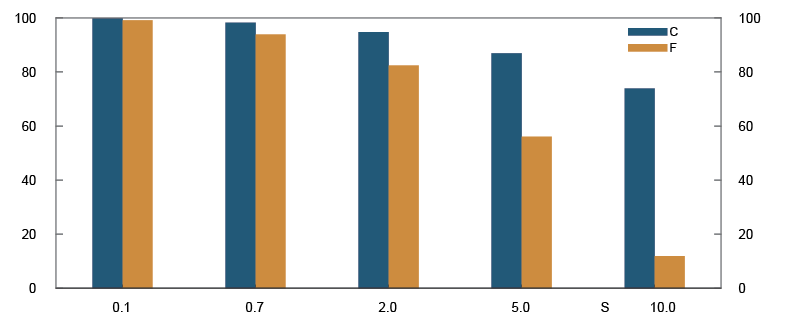
Rental market participants could make adjustments if electricity prices become entrenched at higher levels. This can dampen the impact on rents. Energy efficiency improvement opportunities can be found in many Norwegian commercial buildings, for example by replacing current heating sources with district heating or heat pumps. The overall effect of very high electricity prices on the CRE market over time is uncertain.
A small share of commercial buildings have high energy label ratings
22% of the buildings had a registered energy label in March 2022.2 The small share might reflect the fact that electricity prices have been historically low. However, registered buildings accounted for almost 40% of total commercial building space and almost 45% of the estimated value of the commercial building stock. The share was highest in the office and retail segments.
Since energy labelling has not been strictly enforced, higher quality buildings are more likely to be labelled. The share of buildings with high energy label ratings, ie energy Class C or better and heating classes of yellow or better, is nevertheless below 15% (Chart 1.J). The share increases when measured in square metres or value, as almost 30% of total office space has high energy label ratings. In buildings pledged as collateral to banks, high energy label ratings are somewhat more common.
Chart 1.J Among energy-rated buildings, very few have good ratings3 Share of energy-rated commercial properties with a good energy rating. Percent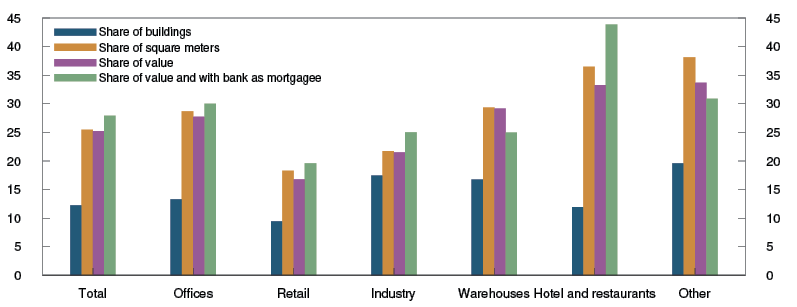
A higher share of buildings with energy labels will make it easier for banks to assess climate risk and obtain competitive financing. The EU green taxonomy for sustainable activities, which will enter into force in Norway in 2023, sets new requirements that will allow properties to be classified as “green”. Norway does not yet have a system in place to classify Norwegian buildings according to the taxonomy.4 The taxonomy will likely become an important reference for securing green financing with lower risk premiums.
1 For a more detailed description of the analysis, see Bjørland, C. H. Solheim and B.H. Vatne (2022) “Norge mangler energieffektive bygg” [Shortage of energy-efficient buildings in Norway]. Blog post published on the Bankplassen blog, 9 November 2022. Norges Bank (in Norwegian only).
2 The energy label of commercial buildings, which appears in the Land Register, has been sourced from the Create Solutions database.
3 A building has a good energy rating if the energy class is C or better
and heating classes of yellow or better.
2 Financial institutions
Norwegian banks are robust. Liquidity and funding requirements increase banks’ resilience to market stress. Higher interest rates are improving bank profitability, and the banks satisfy the capital requirements by a good margin. Non-bank financial institutions are also an important part of the financial system. They are major investors in securities markets, and in the event of market turbulence, liquidity challenges may result in fire sales from securities funds and pension companies, which in turn amplify a price fall.
Financial institutions perform important tasks in the economy. They provide saving, financing and payment services and products, and they redistribute risk (see Norway’s Financial System 2022). They must be resilient to be able to perform these economically important tasks in periods of market stress and increased losses.
2.1 Bank funding and liquidity
Profitable operations and solid capital adequacy provide Norwegian banks with easy access to market funding
The risk premiums banks pay for bond funding have increased over the past year and are higher than before the Covid-19 pandemic (Chart 2.1). The increase in risk premiums has largely followed international developments, where higher risk premiums are associated with uncertainty regarding global growth and inflation prospects. Respondents in Norges Bank’s market liquidity survey also assess liquidity in the bond and short-term paper markets to have worsened since last year and to be somewhat lower than the level prevailing in recent years. According to the respondents, market liquidity for covered bonds, which is a key source of bank funding, has not worsened to the same extent as for other types of debt instruments and remains favourable.
Chart 2.1 Risk premiums on banks’ long-term wholesale funding have risen1 Risk premiums in the Norwegian bond market. Five-year maturity. Percentage points above three-month Nibor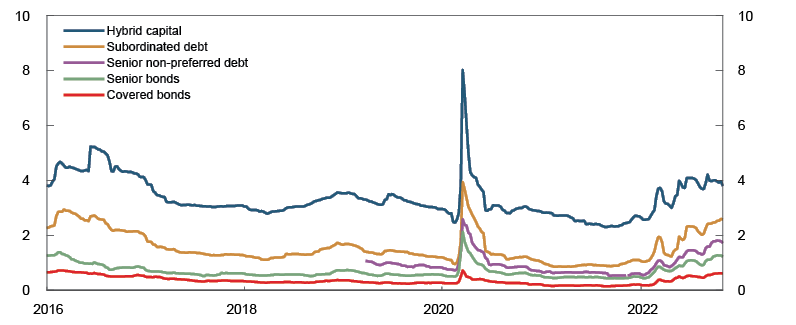
Considerable financial market volatility has led to increased margin requirements in several markets (see “Challenges in the energy derivatives market” and “Asset managers' behaviour can amplify negative price movements”. Norwegian banks have substantial exposures to interest rate and currency derivatives and can therefore also be subject to payments of large margins in the event of sharp market movements. Since banks have both larger liquidity reserves and a larger range of funding sources than other participants in the derivatives market, margin call on derivatives contracts will not likely give rise to severe liquidity challenges.
Customer deposits are the most important funding source for Norwegian banks. The deposit-to-loan ratio, which is the share of banks’ lending covered by deposits, has increased. At the end of September 2022, the deposit-to-loan ratio was around 70% for Norwegian banks and mortgage companies (Chart 2.2).
Chart 2.2 The deposit-to-loan ratio has increased2 All Norwegian-owned banks and mortgage companies. Percent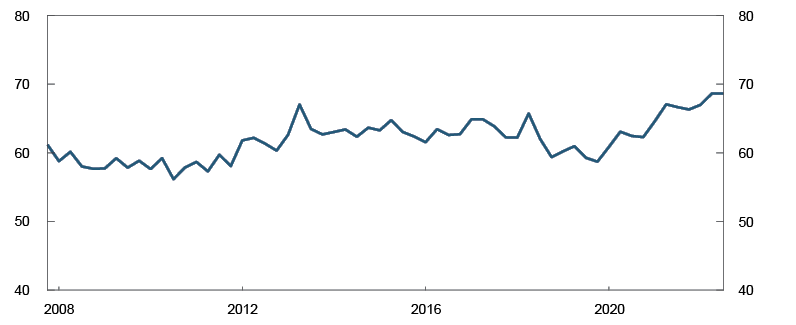
Deposits covered by the deposit guarantee scheme are considered as very stable funding and around 30% of Norwegian banks’ total funding consists of such deposits. This reduces the risk of banks having to roll over a large part of their funding at the same time and render banks less vulnerable to financial market stress.
Liquidity and funding requirements strengthen banks’ resilience to market stress
Liquidity requirements are designed to help banks meet their obligations even in the event of funding shortages. All Norwegian banks satisfy the Liquidity Coverage Ratio (LCR) requirements both in NOK and foreign currency, and overall banks have an ample margin above the minimum requirement. This places them in a solid position to cope with a period of limited access to funding.
Changes to the EU banking package entered into force in Norway this summer and introduce a minimum requirement for long-term and stable funding (Net Stable Funding Ratio – NSFR).3 Norwegian banks have reported and satisfied this requirement for several years. NFSR requires that illiquid assets, such as loans, be funded with stable, long-term funding. This reduces banks’ dependence on frequent refinancing. Banks satisfy the NSFR requirement by a healthy margin, and this has been stable in recent quarters.
Covered bonds are an important source of funding for banks’ residential mortgage lending
A covered bond is primarily secured by a pool of collateralised residential mortgage loans, and investors consider them as safe and liquid assets. Covered bonds therefore provide banks with relatively inexpensive funding. Banks are, however, issuers, investors and market makers in covered bonds. This creates interlinkages between banks and problems in one bank can more easily spill over to another bank. This is a key vulnerability in the Norwegian financial system (see Section 1).
Owing to high collateralisation, covered bonds represent a robust funding source. The value of the cover pool shall, according to the Financial Institutions Act, always exceed the value of the covered bonds outstanding (overcollateralisation requirement). When the EU banking package was introduced in Norway in July 2022, the minimum overcollateralisation requirement was raised from 2% to 5%.
With the introduction of the banking package in Norway, banks can now include residential mortgages with a loans-to-value ratio (LTV) of 80% in the cover pool, compared with the previous requirement of 75%. A higher maximum LTV ratio means that mortgage companies can issue more covered bonds for a given amount of mortgage loans, but it also means that portions of the cover pool are more vulnerable to a fall in house prices. A fall in house prices will, in isolation, increase the LTV ratio for residential mortgages. If the LTV exceeds the maximum requirement, the share above the requirement can no longer be included in the cover pool.
A house price fall could therefore reduce the share of residential mortgage loans that can be financed by covered bonds. Since the majority of residential mortgage loans in mortgage companies’ cover pool have a low LTV ratio, house prices would have to fall markedly before the eligible cover pool falls substantially in value (Chart 2.3).
Chart 2.3 Mortgage companies can weather a large fall in house prices4 Norwegian mortgage companies’ eligible cover pool (vertical scale) and over collateralisation in the event of a fall in house prices (horizontal scale) at the end of 2022 Q2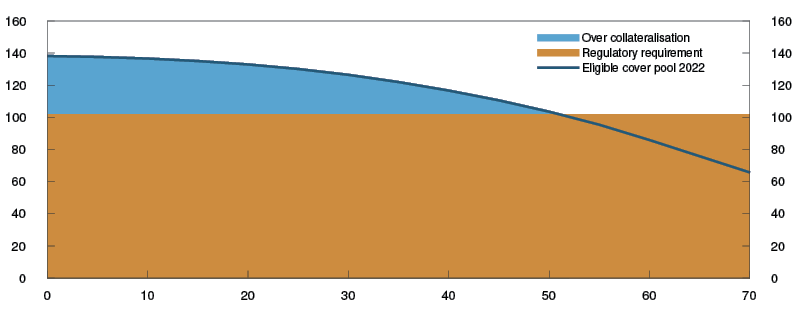
An overall high level of overcollateralisation and a relatively low average LTV ratio of the cover pool mean that house prices can fall by about 50% before mortgage companies as a whole are in danger of breaching the overacollateralisation requirement (Chart 2.3).5 In such a situation, the parent banks can transfer a range of residential mortgage loans to the mortgage company to increase the cover pool. That would, however, weaken the quality of the parent bank’s remaining assets.
However, a far smaller house price fall than 50% could reduce investor demand for covered bonds. There has not been any steep house price declines since covered bonds were introduced, and there is therefore limited experience with how well covered bonds’ value will hold up or how easily they can be issued and traded in such a situation. In addition, there are large differences in the overcollateralisation ratio across mortgage companies in the sample. This can make it more expensive and difficult to use covered bonds as a funding source in the case of a less pronounced house price fall too.
New reference rates are being adopted
Reference rates play a critical role in the global financial system. Large values are linked to these rates through different financial products and loan agreements. Money market rates are widely used as reference rates. New reference rates are being adopted abroad. In June 2023, USD Libor will be phased out. Three-month USD Libor has historically been the main reference rate internationally. The use of three-month USD Libor is already significantly reduced, and in most new contracts in USD market participants use the recommended alternative US reference rate, SOFR.6
In Norway a market for interest rate derivatives linked to the alternative Norwegian reference rate, the Norwegian Overnight Weighted Average (Nowa) has been established. In April, the central counterparty London Clearing House (LCH) began the clearing of interest rate derivatives linked to Nowa. This simplifies the trading of interest rate derivatives linked to Nowa. Recommended market conventions have also been designed for Nowa financial contracts, and Norges Bank has constructed a calculator for estimating interest rate payments based on Nowa. The Norwegian fixed income market is therefore well prepared should Nibor cease to be published. Banks and other users of reference rates should ensure that their systems are prepared to handle contracts with Nowa as a reference rate.
1 Period: Week 1 2016 – week 44 2022. Premium on bonds issued by large banks and mortgage companies in the Norwegian market.
2 Period: 2007 Q4 – 2022 Q3
3 The banking package introduces a number of changes to the EU’s capital and liquidity requirements and bank recovery and resolution regulations.
4 These calculations assume that 3% of mortgages with an LTV ratio up to 60% and 5% of all other mortgages default.
5 The calculations are based on the reporting figures at the end of 2022 Q2 where higher maximum LTV ratio and overcollateralisation were not included in the new statutory rules on covered bonds.
6 See Financial Stability Report 2020 pages 31–33.
2.2 Profitability
Current earnings are banks' first line of defence against losses. Banks' profitability has normalised after a deterioration during the coronavirus pandemic. Over the past year, the return on equity of the largest Norwegian banking groups has been near average for the past decade (Chart 2.4). In the period ahead, banks are expected to maintain profitability at around the same level, but how banks will be affected by high inflation, higher interest rates and weaker growth prospects remains uncertain.
Chart 2.4 Bank profitability has normalised7 Return on equity after tax for the largest Norwegian banking groups. Percent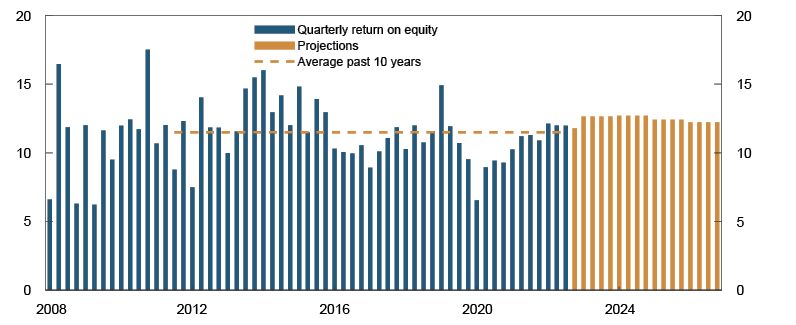
Higher interest rates improve profitability
During the past year increased net interest income8, which is the main source of revenue for Norwegian banks, has contributed to improving profitability (Chart 2.5). A historically low interest rate level during the pandemic reduced the margin between deposit rates and money market rates (deposit margin) because banks were cautious about setting deposit rates lower than zero (Chart 2.6). This contributed to a fall in the margin between lending rates and deposit rates (deposit margin). The fall in the interest margin reduced banks´ net interest income.9 After the pandemic, banks responded to the policy rate hikes by raising lending rates more than deposit rates. This has resulted in both higher deposit margins and interest margins. The rise in the interest margin has lifted net interest income.
Chart 2.5 Higher net interest income holds up banks’ profitability10 Contribution to change in return on equity. Four-quarter moving weighted average. Percentage points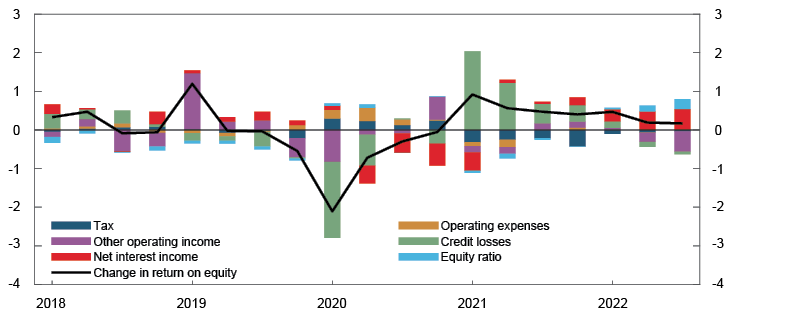
Chart 2.6 Higher interest rate level is raising deposit margin and interest margin11 Interest margin, lending margin and deposit margin for a sample of banks and mortgage companies in Norway. Policy rate. Percent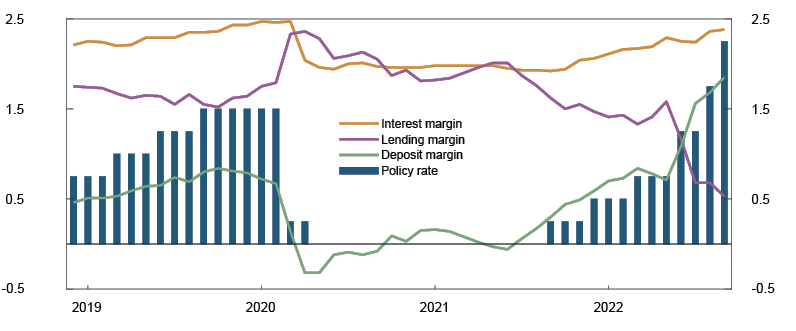
The strong developments in net interest income also reflect robust growth in banks’ corporate exposures (Chart 2.7), which is likely due to higher risk premiums on corporate bonds (Chart 1.14). This has led more firms to finance their activities with bank loans rather than bonds.
Chart 2.7 Norwegian banks report high corporate lending growth12 Twelve-month growth in banks’ corporate and retail market lending. Percentage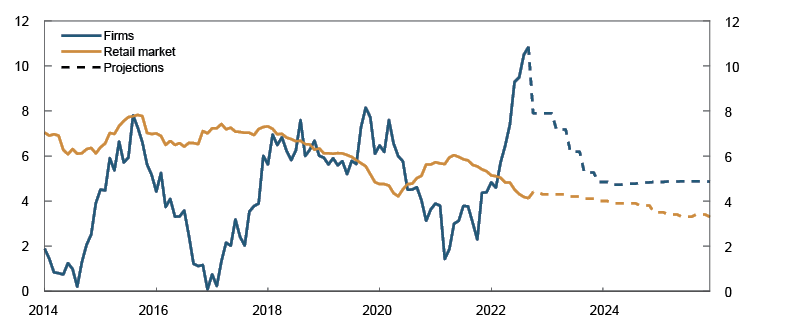
Structural changes have probably contributed to a more level playing field among banks in Norway. The introduction of the EU´s Capital Requirements Regulation (CRR) in 2019 made the Norwegian rules more similar to the rules of other countries, and the establishment of minimum requirements for risk weights for real estate loans in Norway increased capital requirements for foreign banks from the end of 2020. This has probably dampened competition from foreign banks. Over the past year, lending growth for Norwegian banks has been higher than for foreign bank branches in Norway. The European Systemic Risk Board (ESRB) has also recommended that the Norwegian systemic risk buffer of 4.5%, set in 2020, be acknowledged by other countries that have banks with exposures of a certain size in Norway (reciprocity), but so far the Norwegian systemic risk buffer has only been reciprocated by the Swedish authorities. The introduction of customer dividends at several Norwegian savings banks may have contributed to weakening competition in the banking sector these past years (see “Increasing number of savings banks are introducing customer dividends”) because customer dividends make prices on loans and deposits less transparent.
Banks’ net interest income is projected to rise ahead in line with the rise in policy rate, as forecast in Monetary Policy Report 3/22. This will in isolation improve banks´ profitability. In August, DNB Markets conducted a survey among the 50 largest Norwegian banks, and 80% expect the interest margin to rise next year, mainly owing to higher deposit margins.
Credit losses are expected to edge up somewhat
Low credit losses have contributed to solid profitability for Norwegian banks from 2021 (Charts 2.5 and 2.8). Credit losses so far this year have been lower than expected in 2021. The war in Ukraine is having little direct effect on bank customers. But the war has contributed to higher freight rates and high oil and gas prices and has affected a number of bank customers indirectly. At the same time, this has reduced banks' risk of losses on loans to shipping and oil-related industries and led to reversals of previous impairment losses (Chart 2.8).
Chart 2.8 Credit losses are expected to increase from a low level13 Loan loss ratio. Annualised. All banks and mortgage companies. Percent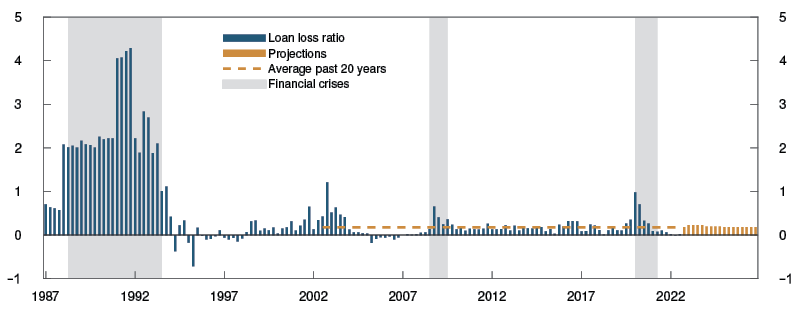
In the period ahead, credit losses are expected to remain close to the average for the past 20 years (Chart 2.9). Financial reporting figures for 2021 and financial reporting figures for listed companies for and 2022 Q2 and Q3 indicate that firms as a whole have good debt-servicing capacity. In addition, future prices indicate that oil and gas prices will remain at a high level in the coming years. This will limit losses on oil-related loans. Nor do we expect high losses on loans to other industries. However, higher interest rates and a sharp rise in prices will probably increase losses somewhat on loans to customers with weak debt-servicing capacity. There is considerable uncertainty surrounding developments ahead. The rise in interest rates and high inflation may result in a more rapid slowdown in the housing market and weaken household consumption more than assumed (see Section 1). In addition, a sharper slowdown may increase corporate losses. In particular, the risk of a sharp fall in commercial property prices and higher losses on commercial property loans has increased this year (see Section 1.2). The stress test illustrates one of many possible negative scenarios for the Norwegian economy and the effect it may have on banks (see Section 3.1).
Chart 2.9 Reversals of earlier impairment losses on loans to oil and shipping14 Loan-loss ratio. Annualised. Percentage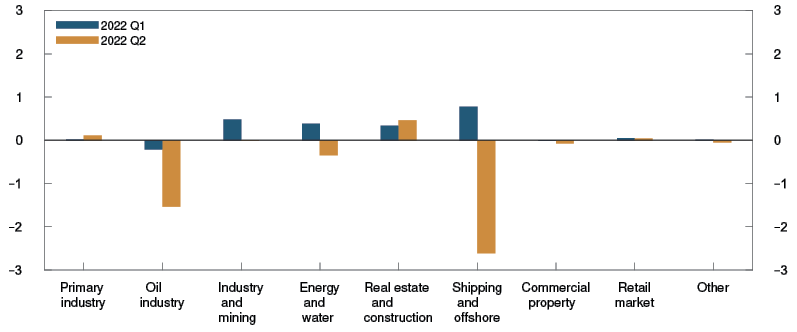
Norwegian banks have low operating costs
Norwegian banks have reduced operating costs markedly in recent decades (Chart 2.10), by automating and digitalising operations, for example.15 In 2021, however, operating expenses increased somewhat in relation to both assets and income. More than half of the cost increase is due to increased wage and personnel costs. According to several Norwegian banks, the cost increase is due to higher activity. In addition, several of the banks incurred restructuring costs last year, partly from investments in new technology.
Chart 2.10 Norwegian banks’ operating expenses are low16 Banks’ operating expenses as a share of operating income and assets. Percent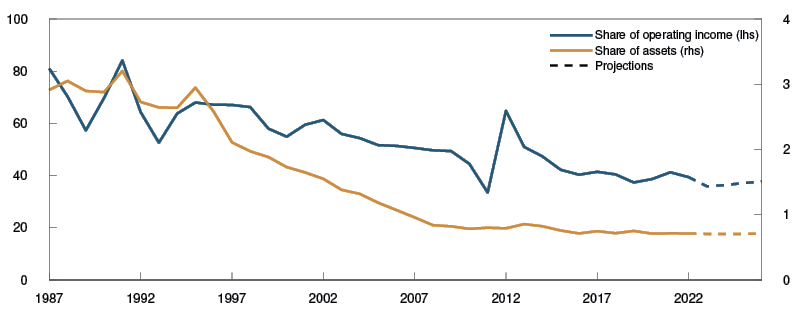
Looking ahead, banks’ operating expenses, both as a share of income and of assets, are projected to fall somewhat as banks reap the benefits of increased digitalisation and restructuring costs decline. However, the results of DNB Markets' survey suggest that digitalisation will have limited effects on costs over the next year. Most of the banks in the survey will not downsize in the next year, and none of the banks expect to close branches. On the other hand, they all expect to maintain or increase investments in digital solutions.
7 Period: 2008 Q1 – 2026 Q4
Largest Norwegian-owned banking groups. Projections from 2022 Q4.
8 Net interest income primarily means interest income from lending less interest expense from deposits and wholesale funding.
9 See Financial Stability Report 2021, pages 40–41.
10 Periode: 2018 Q1 – 2022 Q3
Weighted average of DNB, SpareBank 1 SR-Bank, Sparebanken Vest, SpareBank 1 SMN Sparebanken Sør, SpareBank 1 Østlandet and SpareBank 1 Nord-Norge.
Commission from partly owned mortgage companies in the SpareBank 1 Alliance has been reclassified from other operating income to net interest income.
11 Period: December 2018 – September 2022
12 Periode: January 2014 – December 2025
Projections from 2022.
13 Period: 1987 Q1 – 2026 Q4
Projections from 2022 Q4 for the macro bank, which is a weighted average of DNB Bank, SpareBank 1 SR-Bank, Sparebanken Vest, SpareBank 1 SMN, Sparebanken Sør, SpareBank 1 Østlandet, SpareBank 1 Nord-Norge, Sbanken and Sparebanken Møre.
14 Period: 2022 Q1 – 2022 Q2
15 See Andersen, H. (2020) “Cost efficiency measures for Norwegian banks are explained by automation and digitalisation”. Staff Memo 9/2020. Norges Bank.
16 Period: 1987 – 2026
Projections for 2022 – 2026.
2.3 Solvency
Norwegian banks are solid and meet the capital requirements by a good margin. This makes banks resilient to higher losses and gives banks the flexibility to extend loans to creditworthy firms and households.
Banks are required to meet both risk-weighted requirements and an unweighted capital adequacy requirement. The risk-weighted requirements are intended to ensure that banks' capital is sufficient in relation to the risk of loss, so that banks with riskier assets must hold more capital than banks with safer assets. This can contribute to better risk management in banks. If the risk weights underlying the weighted requirement do not reflect all risk of losses, the weighted capital adequacy ratio may give the impression that banks' loss-absorbing capacity is better than it actually is.
The leverage ratio requirement is independent of the assets' risk of loss and therefore serves as a backstop for the risk-based requirement. The leverage-based requirement will normally not be binding on banks. The requirement was reduced when changes to the EU's capital adequacy rules (CRR II) were introduced in Norway this summer. Prior to the introduction of CRR II, in addition to the minimum buffer requirement of 3%, all Norwegian banks were to meet a leverage buffer requirement of at least 2%, and systemically important banks were to have an additional buffer of at least 1%. The leverage buffer requirements could not be continued with CRR II, but Finanstilsynet will set the minimum Pillar 2 leverage ratio requirement.
Banks meet capital requirements by a good margin
Banks' targets for the CET1 ratio (risk-weighted) are based on regulatory requirements, Finanstilsynet's assessments and banks' own assessments. The largest banks meet both capital requirements and their own capital targets by a wide margin (Chart 2.11). The large Norwegian banks have a Tier 1 capital ratio on a par with the large Nordic banks, however, they have a higher leverage ratio. The leverage ratio is also well above the leverage requirement of 3%.
Chart 2.11 Banks satisfy their capital targets and capital requirements by an ample margin17 CET1 ratio, leverage ratio and capital targets. Largest Norwegian-owned banking groups. At 2022 Q3. Percent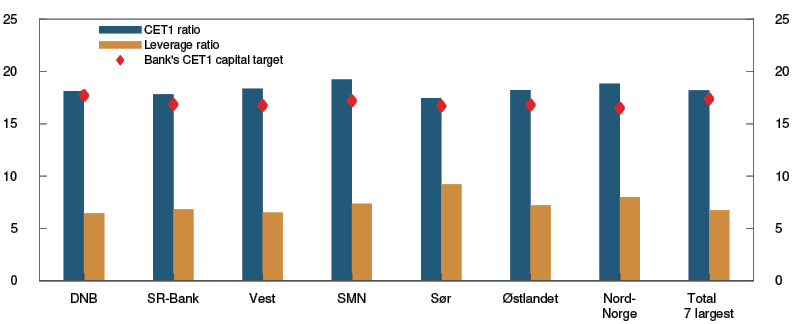
Norwegian banks' capital ratios have risen sharply since the financial crisis (Chart 2.12). This has increased loss capacity, but not as much as implied by the increase in risk-weighted capital adequacy. The CET1 ratio increased particularly in 2019 when the Ministry of Finance introduced the EU's capital adequacy rules (CRR) in Norway, i.e. the Basel I floor18 was removed and a reduction in the basis for calculating loans to small and medium-sized enterprises, the so-called SME discount, was introduced. This reduced the basis for calculation, i.e. the denominator in the capital adequacy ratio, and contributed to increasing the CET1 ratio by 1.5 percentage points without reflecting an improvement in solvency. This summer, the Ministry of Finance introduced CRR II, which included an extension of the SME discount. According to Finanstilsynet's calculations, this contributed to an increase in Norwegian banks' capital adequacy by a further 0.3–0.5 percentage point.19 The rule changes did not affect loss-absorbing capacity, and the leverage ratio has fallen slightly since 2018.
Chart 2.12 Banks are expected to maintain their capital ratios20 CET1 ratio, leverage ratio and the ratio of CET1 capital to Norwegian banks’ total assets. Percent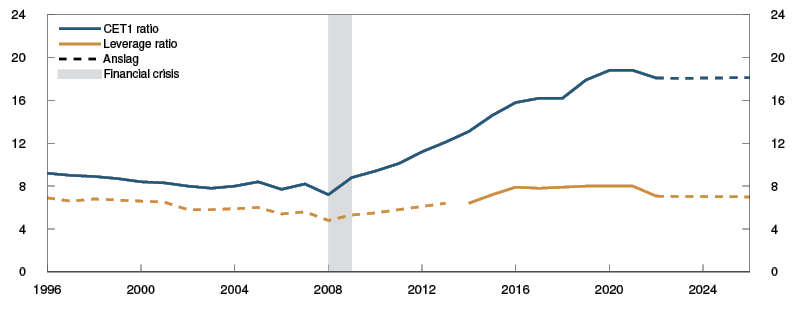
In the period ahead, solid profitability is expected to help banks maintain both risk-weighted and leverage ratios (Chart 2.12).
Moderate bank exposures to industries facing high emission costs, but exposures have not been reduced
Norway's climate target for 2030, as set out in the Climate Change Act, is to reduce greenhouse gas emissions in Norway by 55% from the emission level prevailing in 1990. In 2021, emissions in Norway were 4.5% lower than in 1990. In recent years, emissions have fallen as a share of total production, but in order to reach the emission reduction target, the speed of emission reductions must accelerate.
Higher emission taxes are an instrument for reducing emissions. This could lead to substantial cost increases in high-emission industries. An analysis by Norges Bank identifies industries where emission costs will account for a large share of the production value given a carbon tax of NOK 2 000 by 20301. We consider a firm to be particularly vulnerable if such a tax increase means that the cost of emissions, given the current level of emissions, exceeds 5% of the current production value. Particularly exposed industries are shipping, agriculture, other transport, process industry and oil and gas extraction. However, the shipping industry as a whole has good opportunities to meet new climate requirements.2
Information on banks’ lending exposures shows that about 15% of corporate loans in the 11 largest Norwegian banks are to industries that are particularly vulnerable (Chart 2.A). Loans to the shipping industry account for more than half of this. Industries where emission costs range between 1% and 5% of production account for about 5% of bank lending. Banks do not appear to have significantly reduced their exposure to vulnerable industries since 2019.
Chart 2.A Banks have moderate exposure to the sectors with the largest climate risk Exposure as a share of the 11 largest banks’ corporate lending. Percent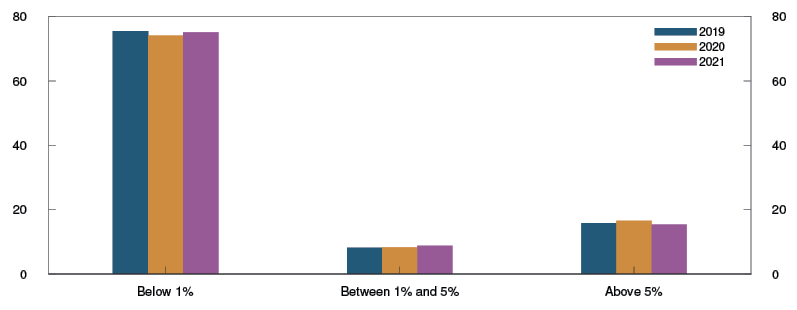
2 See box on page 29 of Financial Stability Report 2021.
Increasing number of savings banks are introducing customer dividends
In recent years, an increasing number of savings banks have introduced customer dividends. Banks provide customers with dividends that depend on the size of their loans and/or deposits in the previous year. Large savings banks such as Sparebanken Vest and SpareBank 1 Østlandet have already introduced customer dividends, while Sparebanken Sør is introducing customer dividends from 2023. In recent years, customer dividends in several savings banks have come to about 0.2% of loans of up to NOK 4m and deposits of up to NOK 2m. This means that banks without customer dividends must offer correspondingly lower lending rates and higher deposit rates in order to be price competitive, if customers fully calculate the expected customer dividend as part of deposit and lending rates.
Savings banks differ from commercial banks in that they have both equity owned by the bank and equity owned by private owners, ie equity certificates. Self-owning equity is unique to savings banks and is often referred to as "ownerless capital".
The equity certificates' share of total equity (ownership fraction) determines how much of the profit accrues to private owners and ownerless capital, respectively. Savings banks have a long tradition of giving a share of profits from ownerless capital to socially beneficial causes, for example as gifts to local sports clubs, music associations and other leisure activities. At the same time, most savings banks pay a larger share of the privately owned capital’s profits as dividends to equity certificate holders than the share of the ownerless capital’s profits that are given as gifts. As a result, privately owned capital has grown at a slower pace than ownerless capital, ie a decline in the ownership fraction. If the ownership fraction falls, the owners of equity certificates have less influence over the bank and a relatively smaller share of the bank's equity can be traded. This may make it more challenging to sell equity certificates because many investors do not want to invest in securities with little influence over the firm and/or low market liquidity. This may result in a lower valuation of equity certificates, and it may also make it more difficult for savings banks to raise more equity.
Savings banks that have introduced customer dividends distribute ownerless capital directly to customers. This contributes to maintaining the ownership fraction. Customer dividends also reduce banks' taxable profits, which is not the case for equity dividends.
Customer dividends may weaken competition in the banking sector because lending and deposit rates become less transparent. In addition, customer dividends in isolation contribute to reducing banks' equity capital, which makes banks less solid.
On the other hand, customer dividends can also contribute to more robust banks. Dividends contribute to maintaining the ownership fraction in savings banks, making it more attractive to invest in savings banks. This can increase savings banks' access to equity capital and make it easier to recapitalise savings banks during difficult times. Several savings banks that have introduced customer dividends have also simultaneously established savings bank foundations and invested all or part of the ownerless capital in the foundation. Often, the foundation will sell part of the equity certificates because a larger proportion of tradable equity can increase investor interest in equity certificates.
17 Capital targets are defined here as regulatory requirements at 31 March 2022 with a margin above the capital requirements. Total 7 largest banks is a weighted average of the seven banks shown in the chart.
18 See description of the Basel I floor in Borchgrevink, H. (2012) “The Basel I floor – transitional arrangement and backstop to the capital adequacy framework”. Economic Commentaries 8/2012. Norges Bank.
19 See Finanstilsynet (2022) ”Risk Outlook – June 2022”, page 20–21.
20 Period: 1996–2026
Projections for the macrobank from 2022 Q4. Banks did not report leverage ratios prior to 2014. The chart therefore shows CET1 ratio as a share of total assets up to and including 2014, and leverage ratio from 2014. Both are non risk-weighted solvency measures and were virtually equal in 2014. Highest level of consolidation.
2.4 Non-bank financial institutions
Financial institutions other than banks and mortgage companies are important in the financial system
In bank-based financial systems, such as the Norwegian one, banks and mortgage companies are the largest providers of credit to households and firms. Banks are also particularly important because of their role in the payment system. In more market-based financial systems, as in the US, securities markets play a greater role, where firms finance themselves to a greater extent by issuing tradable bonds, and households hold a larger share of the wealth in securities. Financial corporations in the sector referred to as non-bank financial intermediation (NBFI) contributed to the financial crisis in 2008 by facilitating and investing in complex securitisations of debt.
Insurance companies, pension funds and mutual funds are the largest and most important non-banks in Norway and are important funding sources for banks, mortgage companies and firms. They own more than 30% of bonds in the Norwegian bond market (Chart 2.13). They are also big investors in the stock market. Direct lending from non-banks to firms only accounts for about a 5% share of domestic corporate financing (Chart 2.14). If firms’ securities funding is also included, the share is around 20%.
Chart 2.13 Non-banks are major participants in the bond market21 Percent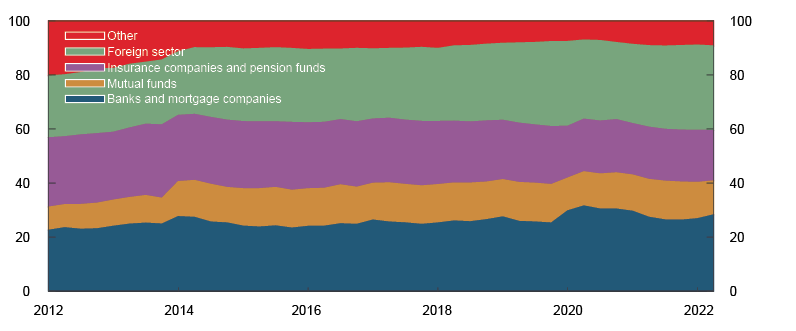
Chart 2.14 Non-banks and bonds account for 20 percent of domestic corporate financing22 Sources of corporate financing. Percent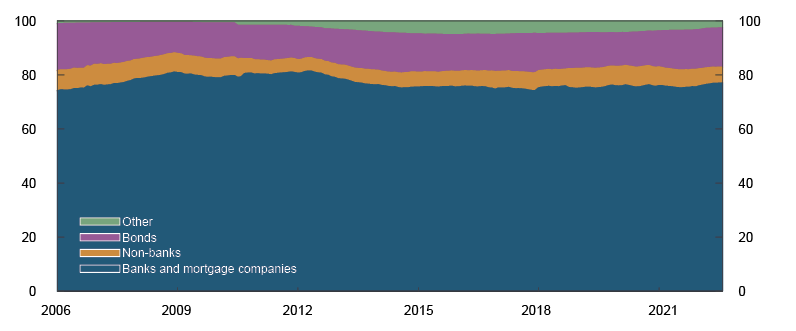
Mutual funds receive financing from financial undertakings, households, firms and foreign investors, which are then invested in securities issued by Norwegian and foreign firms (Chart 2.15). Households and firms finance banks and mortgage companies with deposits and purchases of securities. In turn, banks and mortgage companies are important credit providers to households and firms. Foreign investors are large owners of both covered bonds and bank bonds, and banks lend to foreign countries and invest in securities denominated in foreign currency.
Pension companies (life insurance companies and pension funds) receive premium payments for pension insurance with a savings element and therefore have substantial debt to households (Chart 2.15). Pension funds are invested in securities, fund units and real estate. Life insurance companies can also provide loans to households and firms.
Chart 2.15 Financial institutions’ claims and liabilities23 In trillions of NOK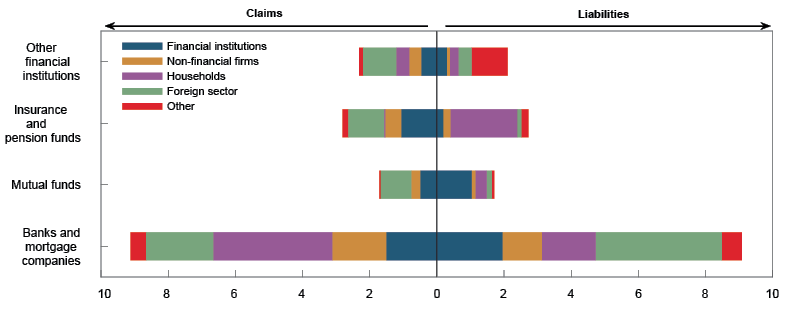
Mutual funds are major investors in securities markets
Equity funds account for more than half of the capital managed by mutual funds (Chart 2.16). Fixed income fund is a common designation for funds that invest in interest-bearing securities. Bond funds account for the largest share of fixed income funds. Money market funds invest in fixed-income securities with a short maturity and low risk. Firms and households can use them in liquidity management as an alternative to bank deposits. Money market funds are of limited scale in Norway, but in certain countries they are an important source of banks' short-term funding. Balanced funds invest in both equities and interest-bearing securities. Other funds include alternative investment funds (AIFs), also called special funds and hedge funds which manage modest sums in Norway. Pension companies are the largest group of investors in both equity and bond funds. Private individuals own a large proportion of equity funds and balanced funds.
Chart 2.16 Insurance companies and pension funds hold the most mutual funds24 In billions of NOK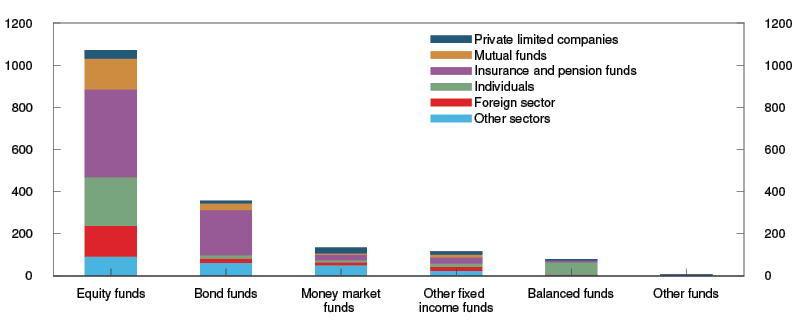
From the financial crisis in 2008 and to the end of 2021, the total assets of mutual funds, particularly equity funds, increased (Chart 2.17). So far in 2022, total assets have fallen (Chart 2.17). Changes in total assets depend on changes in the value of securities and net subscriptions in the funds. The outbreak of the war in Ukraine in February and heightened uncertainty about economic developments contributed to a negative net subscription in 2022 Q2 (Chart 2.18). The reduction was somewhat greater than after the onset of the Covid-19 pandemic in 2020 Q1. In 2022 Q3, total net subscriptions were slightly positive.25
Chart 2.17 Mutual funds’ assets have declined in 202226 In billions of NOK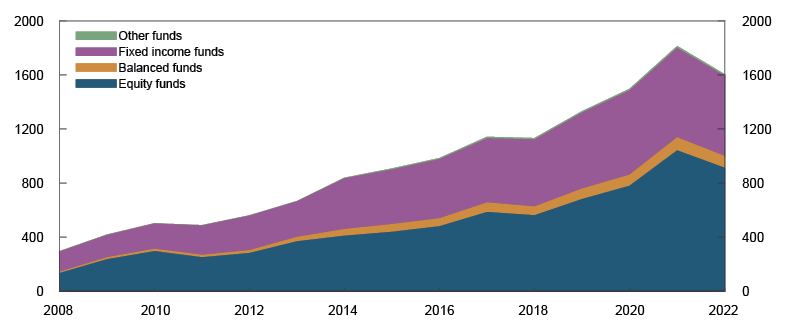
Chart 2.18 Negative net mutual fund subscriptions so far in 202227 In billions of NOK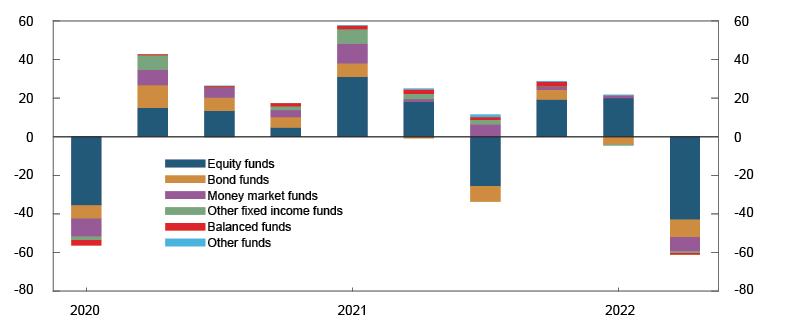
Pension companies manage collective pension savings
In recent years, a transition from a defined-benefit pension to a defined-contribution pension has taken place. This development has been accelerated by the low interest rate level, which led to an increase in pension premiums in order to maintain the same level of defined-benefit pensions. Defined-benefit pension savings are based on a guaranteed minimum return (interest rate guarantee) and the employer and life insurance company bear the return risk until pension payments are distributed. In the case of defined-contribution pension savings, future pensioners bear the return risk.
Premiums for defined-contribution pensions in private collective pension schemes accounted for more than 80%28 of total premiums in 2021, nonetheless a large proportion of the assets under management are still linked to defined-benefit pensions with a return guarantee. The pension funds for defined-benefit pensions are managed in the life insurance companies' collective portfolio and the funds for defined-contribution pensions are managed in the investment choice portfolio. In the first quarter of this year, the investment choice portfolio accounted for just under 30% of total investments.
In order to reduce the risk of not fulfilling the return guarantee, pension companies wish to invest a large share of their pension funds in safe bonds with an interest rate that is at least equal to the guaranteed interest rate. In 2022 Q1, just under 50% of the collective portfolio was invested in bonds. Defined-contribution pensions allow customers to decide to a greater extent how their assets are managed. The investment choice portfolio contains more risk, with more than 60% invested in equities and just under 30% invested in bonds.
In 2021, a separate pension account was introduced for those with a defined-contribution pension in the private sector. The employer's pension provider offers a selection of investment portfolios with varying degrees of risk. Employees can also choose a pension provider other than the one offered by the employer. Those who have a supplier of their choice can have a greater impact on the composition of the portfolio than they can with the employer's provider. At the end of August 2022, NOK 345bn was registered in separate pension accounts. Only NOK 18bn was invested with a supplier of their choice.29
Insurance companies and pension funds are stable and long-term investors in the bond market. An increase in the use of defined-contribution pension schemes may result in a shift in the portfolio composition of pension funds towards a lower bond allocation. An increase in defined-contribution pension schemes may also entail greater variation in portfolio composition, particularly if pension savers make greater use of the option to select their own supplier. These changes will probably take place over several years and will not create challenges to financial stability.
Behaviour in the securities market can influence systemic risk
Solvency requirements for pension companies are designed to ensure that they are in a position to fulfil their long-term obligations to their customers. Unlike banks, pension companies and mutual funds do not rely on either deposits or market-based debt for funding. Weakened solvency does not therefore lead to funding shortages as in the case of banks. Nor are pension companies and mutual funds participants in the payment system. When they face solvency problems, it does not give rise to an increase in systemic risk in the short term in the same way as solvency problems at banks do. In the longer term, solvency and profitability problems at those financial institutions will have negative impact on the financial system through reduced opportunities for saving and risk redistribution.
For mutual funds, liquidity risk primarily materialises when many unit owners seek to redeem their units simultaneously. For pension companies, premium payments and pension payments are more predictable. Both mutual funds and pension companies can be exposed to liquidity risk in connection with margin calls on derivatives contracts.
In the short term, insurance companies, pension funds and mutual funds can influence systemic risk through their behaviour in securities markets. As they are large asset managers, they can influence market prices when they simultaneously want to buy or sell the same type of securities. Simultaneously selling may be necessary sell-offs of securities in order to meet mandate requirements for portfolio composition, to raise funds for unit holders requesting redemption or to raise cash for margin calls on derivatives contracts. Such selling may amplify a fall in prices in the event of market turbulence (see “Asset managers' behaviour can amplify negative price movements”.
Following the turbulence in spring 2020, a number of Norwegian asset managers made changes to their risk management, including increasing the use of repurchase agreements and expanding opportunities to provide bonds as collateral. Information from some large asset managers indicates that they continue to put weight on sound liquidity management in order to meet margin calls in the event of market turbulence. In an environment with high uncertainty about economic developments, asset managers must expect periods of wide fluctuations in securities markets and plan for sound management of liquidity and counterparty risk.
21 Period: 2012 Q1 – 2022 Q2
Based on market value of bonds registered in Euronext Oslo.
22 Period: January 2006 – August 2022
Non-financial firms’ domestic debt. Non-banks includes insurance companies, pension funds and finance companies.
23 Data from financial sector reporting, 2022 Q1. Other includes public administration and non-profit organisations.
24 At 31 December 2021.
25 According to statistics from the Norwegian Fund and Asset Management Association.
26 Capital under management at year-end for 2008–2021 and at end-September 2022.
27 Period: 2020 Q1 – 2022 Q2
28 See Finanstilsynet (2022) Risk Outlook – June 2022.
29 According to data from Finance Norway.
Asset managers' behaviour can amplify negative price movements
There are several examples of asset managers (mutual funds, life insurance companies and pension funds) amplifying a fall in prices in the event of market turbulence. They own large amounts of equities and bonds, and they can have substantial exposures in derivatives markets. When asset managers make adjustments to investments that result in large sales of equities or bonds, prices can decline sharply when market liquidity is low.
There may be several reasons behind asset managers’ need to sell securities. This may reflect the need to adapt the asset side of the balance sheet to the funding side. Mutual funds' financing is determined by the unit capital, and the funds must therefore sell assets if the unit holders wish to redeem their assets.
Pension companies (life insurance companies and pension funds) have debts that are due for payment (pension payments) in the distant future. The market value of these payment obligations will fall (increase) considerably if long-term interest rates increase (fall). To avoid excessive variation of the market value of pension companies’ equity with interest rates, they must adjust their investments so that the interest rate sensitivity of the assets is approximately the same as for the payment obligations. This can trigger large transactions in financial markets.
The solvency capital regulations for insurance companies, Solvency II1, are determined by a stress test, which ensures that the insurance company will be able to withstand a very negative development in, for example, interest rates, credit spreads, equity and exchange rates. Pension companies that satisfy the solvency capital rules will therefore be able to withstand major disturbances without selling securities in order to meet the regulatory solvency requirement (capital adequacy requirement).2 Insurance companies may nevertheless wish to rebalance their portfolios to desired portfolio weights by, for example, selling bonds and buying equities (if equities have fallen more in value than bonds).
Asset managers' sale of securities may also reflect the need to procure liquidity for collateral (margining) of derivatives contracts. In spring 2020, the krone depreciated sharply, which entailed losses for asset managers on the currency swap agreements they used to hedge foreign investments. The collateral that is to be provided is agreed when the derivatives contracts are concluded, which generally consists of deposit money and to some extent safe bonds. Deposit money can be obtained by selling securities in the market or by using repurchase agreements, ie asset managers relinquish securities and receive deposit money in exchange for a promise to buy the security back at a future date. In spring 2020, direct sales of bonds in the market contributed to a substantial rise in credit premiums.
Another example of how margining of derivatives contracts amplifies a fall in prices in the market is the sale of bonds by UK pension companies in autumn 2022 to obtain deposit money to meet margin calls on interest rate derivatives. British pension companies adjust their assets so that they correspond to future pension payments. This strategy is referred to as liability-driven investment (LDI). Interest rate derivatives are used as part of the investment strategy, and pension companies had to post margin when bond prices fell (interest rates rose). They sold bonds to obtain deposit money for margin calls, which amplified the fall in prices and contributed to increasing risk premiums in the fixed income market. The impression was that it was the pension funds, and not the life insurance companies, that contributed most to the selling pressure. In Norway, it is primarily life insurance companies that manage collective pension savings. At the end of 2021, Norwegian pension funds accounted for 16% of total pension obligations.3 This share has fallen in recent years. Life insurance companies devote considerable resources to manage assets and plan for the management of liquidity and counterparty risks.
1 Solvency II was adopted in the EU in 2009, with effect from January 2016, but with long transition arrangements. Solvency II does not apply to pension funds. In Norway, the capital requirement for pension funds is determined on the basis of a simplified version of Solvency II.
2 An example of that the regulations for insurance companies have led to selling is from Denmark in autumn 2008. There was turbulence in the market for Danish real credit bonds. The risk premium increased compared to government bonds. As a result, the value of real credit bonds fell while the value of the insurance obligations (which was calculated based on government bond yields) was unchanged. Pension companies therefore sold large amounts of real credit bonds to maintain the level of solvency.
3 According to data from Statistics Norway. The data do not include the Norwegian Public Service Pension Fund.
3 Analyses of banks’ capital needs
Analyses of banks’ total need for capital are a part of the basis for Norges Bank’s decisions on the level of the countercyclical capital (CCyB) buffer and advice on the level of the systemic risk buffer (SyRB). In the assessment of banks’ total need for capital, we assess the level of vulnerabilities and use stress tests and analyses of long-term economic costs and benefits of capital requirements. Stress tests show that Norwegian banks are resilient and that capital buffers help to enable banks to absorb loss and maintain lending during a severe downturn. Cost-benefit analyses indicate that Norwegian banks’ capital ratios are within a reasonable range for long-term capital adequacy.
Banks play a key role in the economy. They provide financing, saving and payment services and redistribute risk. These services are crucial for economic activity. In a downturn, with reduced earnings and higher losses, banks may be impaired in performing these services. This entails economic costs. An increase in bank capital improves loss-absorbing capacity and reduces the risk that banks contribute to amplifying a downturn.
In the assessment of banks’ total need for capital, we give weight to two types of analysis. We use stress tests to assess whether banks’ capital buffers are sufficient to absorb a sharp but conceivable downturn, where the magnitude of the downturn also depends on current financial system vulnerabilities. Stress tests are useful for assessing the potential impact when vulnerabilities materialise, and they provide guidance for how much capital banks should hold in order to continue to perform their economically important functions during a sharp economic contraction. Stress tests show that Norwegian banks’ current capital levels are high enough to cope with scenarios with substantial losses.
We also employ analyses of long-term economic costs and benefits of capital requirements. These do not take into account the level of financial system vulnerabilities, as stress tests do, but provide an indication of the long-term level for how much Common Equity Tier 1 (CET1) capital banks should hold. Our cost-benefit analyses of capital requirements indicate that banks’ total capital levels are within a reasonable range for what banks’ long-term capital adequacy should be. Both the stress tests and estimates of the costs and benefits of capital requirements are based on a number of assumptions, and the results are uncertain.
Norges Bank’s advice on the SyRB is based on the principle that the SyRB is intended to contribute to ensuring that banks overall hold sufficient capital to weather future downturns. The framework and advice are discussed further in Section 1.5 and in “Norges Bank’s advice on the systemic risk buffer”. Decisions on the CCyB are published each quarter in Monetary Policy Report. A number of considerations are given weight in assessments of the buffer requirements. The SyRB is intended to reflect structural vulnerabilities in particular, while the CCyB is intended to reflect cyclical vulnerabilities.
Other considerations must also be given weight in assessments of the capital requirements. Estimates of long-term costs and benefits of capital requirements do not take into account that financial system vulnerabilities vary over time, for example. Changes in both cyclical and structural vulnerabilities may provide grounds for assessing that capital ratios should diverge from the estimates.
3.1 Stress tests
Norges Bank and Finanstilsynet conduct regular stress tests of banks. Stress tests show some of the many possible negative events that the financial system can face and outline possible outcomes of how the financial system copes with sharp, but not inconceivable, downturns. Norges Bank’s stress tests are based on banks’ capital ratios, earnings and loss prospects in a cyclical downturn, given the assessment of financial system vulnerabilities. Vulnerabilities amplify economic downturns, and the depth of the crisis will therefore depend on the vulnerabilities in the economy.1 The analysis takes account of the fact that banks are both affected by and affect economic developments.2 Stress tests can shed light on whether banks hold sufficient capital to weather substantial losses without contributing to amplifying the downturn by tightening lending.
A number of stress tests3 conducted by Norges Bank and Finanstilsynet show that sharp economic downturns can result in such large bank losses that banks will draw down their capital buffers to avoid markedly tightening credit standards. How far banks draw down their capital buffers depends on the scenarios. Stress test scenarios have often included a sharp global economic downturn, a steep fall in oil and gas prices and higher credit premiums. These result in a sharp economic downturn in Norway and large bank losses.
This year’s stress test is based on a scenario of high inflation combined with a severe downturn
The stress test in this report is based on a scenario where inflation is considerably higher than it is today combined with a severe downturn in the Norwegian economy, see Table 3.1. The Norwegian and global economy is subjected to further inflationary pressures and supply constraints. Inflation therefore becomes considerably higher both at home and abroad than Norges Bank anticipates in its forecasts in Monetary Policy Report 3/2022. Unemployment rises markedly, and households tighten consumption considerably. High debt in many households amplifies the tightening of consumption. Activity in Norway is pulled down further by lower external demand from other countries. Risk premiums on corporate and bank bonds rise sharply at the same time as securities prices fall sharply. Residential and commercial property prices fall steeply, which also pulls down activity.
Table 3.1 Macroeconomic key variables. Annual change1 Percent
|
Time |
2022 |
2023 |
2024 |
2025 |
2026 |
|
GDP for mainland Norway |
2.8 |
-3.2 |
-2.3 |
2.1 |
2.9 |
|
Private consumption |
5.8 |
-5.0 |
-1.8 |
2.1 |
2.6 |
|
Registered unemployment (rate, level) |
1.8 |
4.1 |
5.9 |
5.5 |
4.6 |
|
House prices |
5.5 |
-22.4 |
-8.1 |
3.1 |
6.6 |
|
Credit (C2) to households |
4.3 |
-1.3 |
-0.6 |
1.4 |
3.2 |
|
Credit (C2) to NFEs2, mainland Norway |
7.5 |
-2.6 |
-1.4 |
1.5 |
3.6 |
|
Countercyclical capital buffer (CCyB) (level) |
2.0 |
0.0 |
0.0 |
0.0 |
0.0 |
|
Commercial property prices3 |
-35.9 |
-8.5 |
4.3 |
6.3 |
|
|
Total loan losses, percent of loans (level) |
0.1 |
1.6 |
2.2 |
1.4 |
1.1 |
|
Consumer price index (CPI-ATE) |
3.7 |
9.8 |
8.2 |
5.2 |
3.9 |
|
Mortgage rate (level) |
2.6 |
8.8 |
8.4 |
6.2 |
4.7 |
|
CET1 capital (level) |
18.1 |
16.8 |
16.8 |
16.8 |
17.1 |
1 Unless otherwise stated. Level variables are measured as annual averages. Projections for 2022 Q3 – 2022 Q4 for GDP for mainland Norway, private consumption, registered unemployment, house prices, credit (C2) to households, consumer price index and mortgage rate are taken from Monetary Policy Report 3/22.
2 Non-financial enterprises.
3 Prices for prime office space in Oslo.
Sources: Eiendomsverdi AS, Entra, Finn.no, Jones Lang LaSalle (JLL), Labour end Welfare Administration (NAV), Real Estate Norway, Statistics Norway and Norges Bank
High interest rates and risk premiums on banks' funding are passed on to lending rates and contribute to a marked increase in the household interest burden (Chart 3.1). Some firms fare well as commodity and energy prices remain at high levels, while others face high prices for intermediate goods and low demand. In addition, some firms are adversely affected when residential and commercial property prices fall. We assume that the CCyB is set at zero to help banks continue to provide loans to creditworthy customers. As a technical assumption, the policy rate is assumed to follow a simple rule that places importance on inflation as a deviation from the inflation target as well as the output gap.4
Chart 3.1 Households’ interest burden increases substantialy5 Household leverage and interest burden. Percent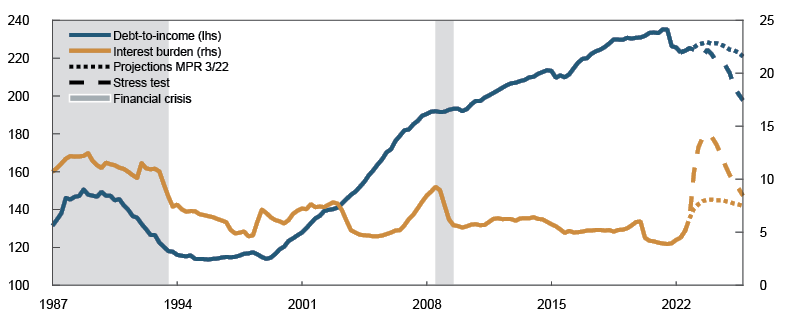
Banks must recognise substantial losses on household loans (Chart 3.2). Tighter liquidity, higher unemployment and weak real wage growth push up defaults, and the fall in house prices reduces banks' collateral values. The loss assumptions partly reflect a sharp increase in lending rates. Given sharply higher lending rates, calculations show that a substantial share of households experience difficulties in servicing their debt (see “Households are resilient to moderate increases in interest rates and other expenses” for a further description). The interest burden gradually falls, and credit losses decline. At the end of the crisis, households are left with a lower debt burden than previously, driven by low nominal credit growth and high nominal wage growth (Chart 3.1).
Chart 3.2 Banks’ credit losses will be high 6Credit losses as a share of volume outstanding. Historical and credit projections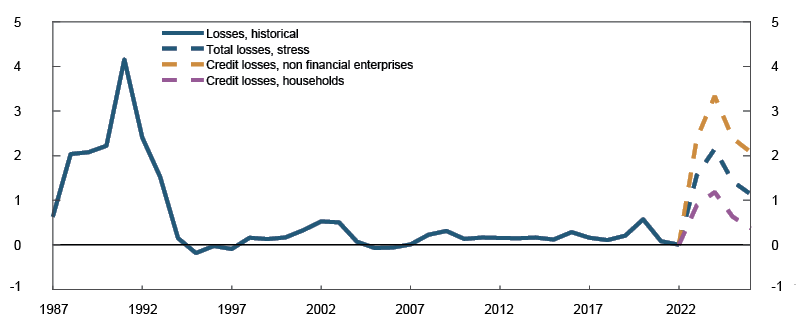
Losses on corporate loans also increase considerably (Chart 3.2), owing to slumping demand facing many firms and difficulties in passing on higher costs to prices. Banks face substantial losses on commercial real estate (CRE) exposures. Overall, losses in the scenario are fairly high compared with the losses banks typically recognise in crises, as expressed by median losses (Chart 3.3). Historically, there have also been cases of higher losses in crises of the same depth as in the scenario.
Chart 3.3 The level of banks’ credit losses in a crisis is uncertain7 Historical relationship between banks’ credit losses and the output gap. Percent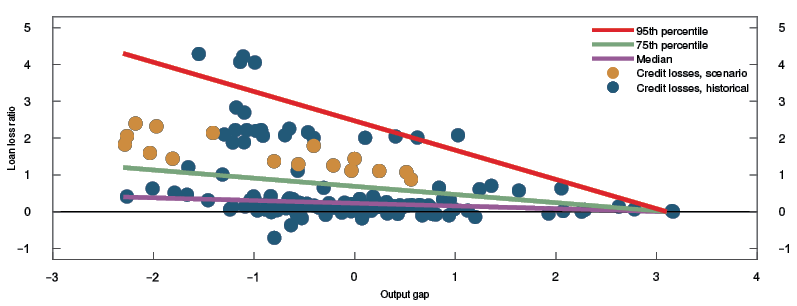
The stress test shows the benefit of capital buffers
The stress test shows that the capital buffers of the largest Norwegian banks as a whole are sufficient to absorb losses in a severe downturn (Chart 3.4). Banks will continue to have a margin above total capital requirements after the CCyB has been reduced in the scenario and therefore do not need to tighten lending to meet their capital requirements. This helps prevent an amplification of the downturn by bank behaviour. Net interest income, supported by higher interest rates, contributes to sustaining capital adequacy, while higher losses on loans and securities reduce it (Chart 3.5).
Chart 3.4 Macro bank’s capital adequacy holds up in the scenario8 Macro bank’s capital requirements and CET1 ratio, baseline and stress scenario. Percent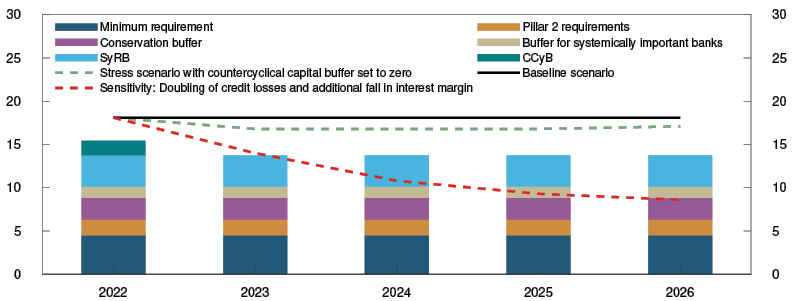
Chart 3.5 Net interest income cushions the fall in capital adequacy9 Macro bank’s change in CET1 ratio and contributions from different components. Percentage points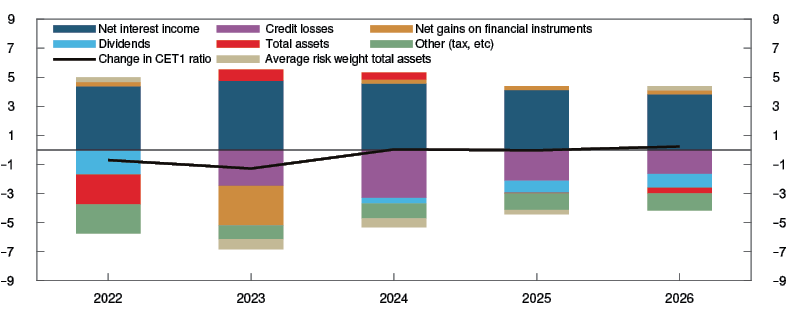
There is uncertainty as to how interest margins and losses will evolve in a stress scenario. Credit losses must be twice as large as in the stress scenario and the interest margin 25 basis points lower before earnings become so weak that the macro bank10 depletes both the SyRB and the buffer for systemically important banks and thus dips into the capital conservation buffer (Chart 3.4). Such losses can arise during other and more severe downturns than assumed in this scenario, for example, if a downturn affects a larger part of the Norwegian business sector, or on account of new and unexpected mechanisms in the financial system. A deeper downturn than assumed in the stress scenario may therefore prompt banks to reduce lending and amplify the downturn. The SyRB can also be lowered in the event of a steep downturn when reducing the CCyB is not sufficient.
1 See Arbatli-Saxegaard, E., K. Gerdrup and R.M. Johansen (2020) “Financial imbalances and medium-term growth-at-risk in Norway”, Staff Memo 5/2020. Norges Bank.
2 See Andersen, H., K. Gerdrup, R.M. Johansen and T. Krogh (2019) “A macroprudential stress testing framework”, Staff Memo 1/2019. Norges Bank.
3 Over several years, Norges Bank has published its stress test in November in Financial Stability Report, while Finanstilsynet has published its stress test in June in its Risk Outlook.
4 See an example of the simple rule in Monetary Policy Report 4/21, page 50. It does not represent an assumption of actual monetary policy in a crisis situation. Automatic fiscal stabilisers are assumed to function normally in this scenario, but no specific fiscal response to the crisis is assumed. The relationships in the model, however, are quantified using data from previous downturns, where extraordinary fiscal policy measures were implemented.
5 Period: 1987 Q1 – 2025 Q4
Debt-to-income is debt as a share of disposable income.
Disposable income is income after tax and interest payments.
The interest burden is interest payments as a share of after-tax income.
6 Period: 1987–2022 for all banks and mortgage companies. 2022–2026 for the macro bank.
Credit losses as a share of gross lending to the sector. Projections 2022–2026.
7 Period: 1987 Q1 – 2019 Q4.
Loan loss as a percentage of lending.
Output gap measured in number of standard deviations.
Quantile regression on Norwegian data.
8 Periode: Projections 2022–2026. Stress scenario starts in 2023. CET1 capital ratio and Pillar 1 and 2 requirements for individual stress test banks are weighted by the bank’s risk-weighted assets.
9 Projections for 2022 – 2026. Stress scenario. The individual bank pays a dividend if net after-tax income for the year is positive.
10 The macro bank comprises DNB Bank, SpareBank 1 SR-Bank, Sparebanken Vest, SpareBank 1 SMN, Sparebanken Sør, SpareBank 1 Østlandet and SpareBank 1 Nord-Norge.
3.2 Long-term costs and benefits
An analysis of the economic costs and benefits of bank capital seeks to estimate how much equity capital banks should hold in a long-term perspective. In the literature this is referred to as estimating the optimal level of capital. Norges Bank has estimated the optimal level of capital for Norwegian banks (see “Methods and underlying assumptions for estimating the costs and benefits of bank capital” for a further description and supplementary explanations).
The analysis estimates the benefit from increasing banks’ capital adequacy ratios (the marginal benefit) with the aid of two components. First, the analysis estimates how much the probability of a crisis falls when the capital adequacy ratio rises. Second, it estimates the economic cost of crises. The uncertainty regarding the economic cost of banking crises is particularly high. The calculations therefore apply three different estimates of the cost of crises (Chart 3.6). The marginal benefit of capital declines as the capital adequacy ratio rises. This is because when the capital adequacy ratio is low, the probability of a crisis may decline to a fair extent even from a small increase in the capital adequacy ratio. When the capital adequacy ratio is high, the probability of a crisis is low at the outset and thus shows only a slight decline from a further increase in the capital adequacy ratio.
Chart 3.6 Marginal cost and marginal benefit of a 1 percentage point increase in the CET1 ratio Percent of GDP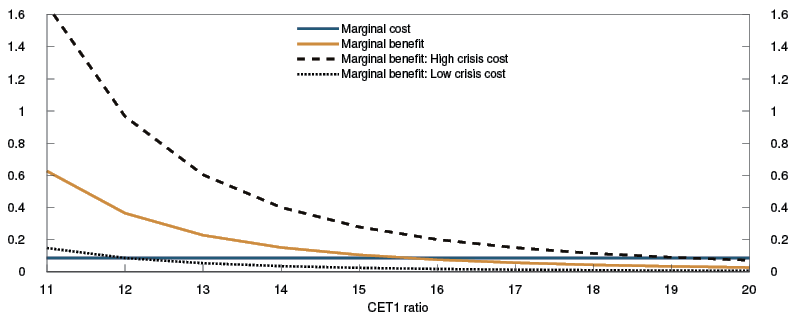
The costs of a higher capital adequacy ratio (the marginal cost) is based on the potential for banks’ funding costs to rise when bank capital increases. If banks pass on higher funding costs to loan customers, lending rates will rise. This may make it more expensive to finance investment and may dampen output growth. In the calculations, the marginal cost is assumed to be the same regardless of how high the capital adequacy ratio is.
Overall, the results of the analysis suggest that Norwegian banks’ long-term CET1 capital adequacy ratio should be between 12% and 19%, given a long-term level of vulnerabilities. The marginal benefit is then equal to the marginal cost (Chart 3.6). Under the main assumption regarding crisis costs, the estimate for the CET1 capital adequacy ratio will be 16%. Under the assumption of a low crisis cost, the estimate will be 12%. If the crisis cost is high, the estimate is 19%. The estimates are consistent with results of international studies. Norwegian banks’ current CET1 capital adequacy ratio is just above 18%.
Overall, the changes in the capital framework in recent years matter little to the estimates. The introduction of the minimum requirement for own funds and eligible liabilities (MREL) may dampen crisis costs and crisis probabilities and is estimated in isolation to reduce the need for CET1 capital adequacy by around 1 percentage point. The removal of the Basel I floor11, the introduction of the discount for loans to small and medium-sized enterprises and other regulatory changes over the past decade have also been taken into consideration. These have reduced risk-weighted assets, regardless of whether the risk associated with the loans has changed and pull up the estimates accordingly. In the assessments of the total capital need, banks’ real solvency is of importance.
The results of the analysis are uncertain but confirm that banking crises are economically costly and that it is economically profitable to ensure that banks are solvent enough to absorb significant losses. The benefits of increasing the capital requirement are considerable when, at the outset, the capital adequacy ratio is low. This suggests that the economic costs are higher if banks adjust to a capital adequacy ratio that is too low rather than too high
11 In 2019, the floor for risk-weighted assets for banks using the internal ratings-based approach (IRB banks), the Basel 1 floor, was removed in Norway.
Methods and underlying assumptions for estimating the costs and benefits of bank capital
A common method in the literature for analysing the costs and benefits of equity capital is to calculate what is called an optimal level of capital adequacy, where the economic benefits of increasing the capital ratio are weighed against the economic costs (Chart 3.A).
Chart 3.A Analytical framework. Marginal benefits and marginal costs of increasing CET1 ratio by one percentage point from different levels As a percentage of GDP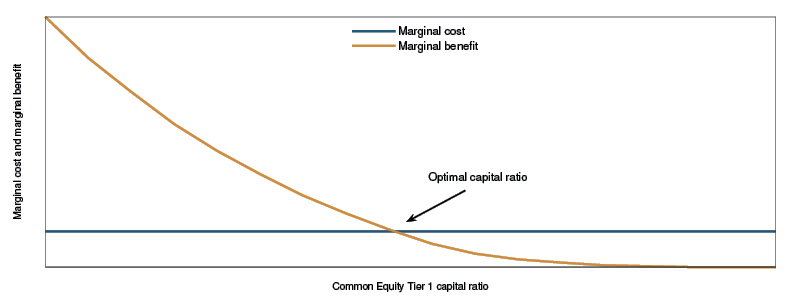
In 2010, the Basel Committee performed an extensive analysis1 of the optimal level of capital adequacy for member country banks. The study concluded that the optimal level was 9%–15%. Several subsequent studies have used the same methods and assumptions as the Basel Committee, but often conclude that the optimal capital adequacy level lies somewhat higher than in the Basel Committee study.2 In Financial Stability 2012, Norges Bank referred to an analysis of the costs and benefits of capital at Norwegian banks.3 The analysis indicated that banks’ CET1 capital ratios should be between 13% and 23%.
The analysis has now been updated with more experience with the costs of increasing bank capital and with more recent research that may help to increase the accuracy of estimates.4 This takes into account changes in the capital framework over the past decade which has affected risk-weighted assets and the introduction of a minimum requirement for own funds and eligible liabilities (MREL).
Costs of a higher capital ratio
Empirical studies normally assume that banks’ funding costs rise with a higher CET1 ratio. To prevent return on equity from falling when capital increases, banks must increase earnings, for example by raising lending rates. A higher interest rate in isolation has a dampening effect on economic activity. The marginal cost is therefore estimated applying assumptions about how changes in capital ratios affect return on bank equity and other funding costs, and how funding costs affect lending rates and GDP. In the literature it is normal to apply the assumption that the marginal cost is the same regardless of the capital level.
It is not obvious that a higher capital ratio increases banks’ funding costs. According to the Modigliani-Miller theorem, under certain assumptions, funding costs should not depend on the funding structure5. Additional equity capital reduces both the required return on equity and the interest on debt, so that, in theory, the weighted sum of funding costs is unaffected. However, results of international studies indicate that the theory does not hold in practice, so that banks’ total funding costs rise when the capital ratio increases.6 According to the analyses, a lower required return on equity and interest on debt will counteract around half of the direct cost increase as a consequence of increased equity capital.
In the updated analysis for Norwegian banks, the cost of raising the capital requirement is assumed to be an 8–12 basis point increase in lending margins, in response to a 1% increase in the capital requirement. This is consistent with the effects in Norges Bank’s macro model NEMO. The increase in lending margins reduces long-run GDP by around 0.08%, which is in line with experience from the recapitalisation of Norwegian banks after the financial crisis.
Benefits of a higher capital ratio
The benefit from increasing the capital ratio is that the risk of banking crises falls. The marginal benefit is estimated by multiplying the estimated cost of crises by the estimate of how much the probability of a crisis probability falls when the capital ratio is increased. Most studies find that the marginal benefit is greatest when the capital ratio is increased from a low level. When capital ratios are high, the probability of a bank crisis declines, and with a high capital ratio the crisis probability is so low that a further increase does not have any particular effect.
Estimating the probability of a crisis
In order to estimate the probability of a crisis, the capital adequacy level that corresponds to a banking crisis must first be defined. The updated analysis assumes that in most estimates, a banking crisis occurs if the banking sector as a whole breaches the Pillar 2 CET1 capital requirement, ie that the sector falls below 6.5%.7 This implies that the banks can breach the buffer requirements without triggering a banking crisis. This crisis definition does not take into account that a banking crisis can occur before banks breach the Pillar 2 requirement.
This crisis definition is used along with data on historical losses to estimate the probability of a crisis. First, losses are simulated using an exponential probability distribution that is calibrated based on Norwegian banks’ historical loan losses back to 1987. Then the probability of a crisis is calculated as the share of cases where the CET1 ratio ends up below 6.5%. The marginal probability of a crisis is found by assessing how the probability of crises changes with changes in the initial capital adequacy level.
Finally, the estimated probability of a crisis is revised down, in line with the assumption that MREL improves market discipline and reduces banks’ risk-taking. The Financial Stability Board (FSB) estimates that MREL can reduce the probability of a crisis by around 30%.8 Other studies assume similar effects of MREL on the probability of a crisis. Our downward revision is half (15%) of the Financial Stability Board’s estimate. This is because we have no experience with how MREL will function in a crisis and because there are few signs that MREL has contributed to reducing the risk that Norwegian banks assume.
Costs of banking crises
A number of studies estimate the cost of crises in the form of output forgone, ie GDP. The studies do not as a rule include the cost of government measures. There is considerable variation in the estimates. For example, the estimated total costs of the Norwegian banking crisis from the beginning of the 1990s varied between 7% and 314% of annual GDP. The most important explanation of the variation in the estimates is that it is difficult to estimate what GDP developments would have been if a crisis had not occurred. In the absence of an alternative GDP path, the studies estimate hypothetical GDP paths and compare these with the GDP outturns during and after crises. The estimated cost of banking crises depends especially on whether or not it is assumed that banking crises will weaken economic activity permanently. In Chart 3.B, left panel, the banking crisis does not have any permanent effect, because GDP returns to its pre-crisis trend and remains close to this line. In the right panel, the effects of the banking crisis on GDP are permanent, ie, GDP never reaches the long-term pre-crisis trend line. The crisis costs will therefore be substantial. At the same time, crises may also have effects that pull up the trend, such as if crises force the adoption of efficiency improvements.
Chart 3.B Illustration of crisis costs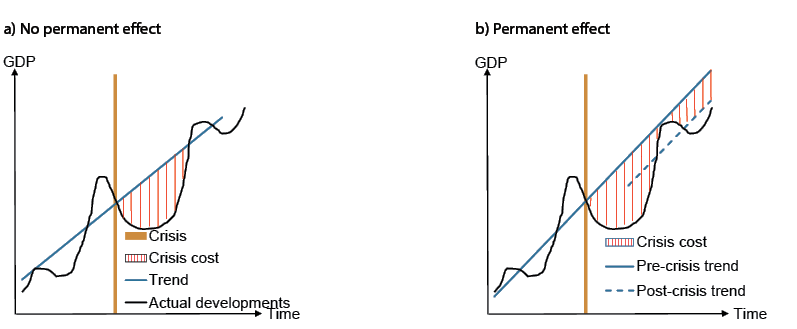
The updated estimates for Norwegian banks assume that MREL contributes to more efficient resolution and recovery, so that the cost of crises are reduced in line with FSB estimates, ie by around 5 percentage points. Since the economic cost of banking crises is highly uncertain, the calculations use different estimates of the costs of crises. One calculation is based on a crisis cost of 60% of GDP before being adjusted for MREL. This is in line with the median of a number of international studies and the average of the estimates for the Norwegian banking crisis. The calculations also use median estimates of crisis costs from international studies of temporary and permanent effects, respectively. In addition, an alternative calculation is performed where the crisis cost depends on the banking sector’s CET1 ratio.
1 See Basel Committee (2010) “An assessment of the long-term economic impact of the new regulatory framework”. Basel Committee, August 2010.
2 See, eg, Birn, M., O. de Bandt, S. Firestone, M. Gutiérrez Girault, D. Hancock, T. Krogh, H. Mio, D. P. Morgan, A. Palvia, V. Scalone, M. Straughan, A. Uluc, A.H. von Hafften and M. Warusawitharana (2020) “The Costs and Benefits of Bank Capital—A Review of the Literature”, Journal of Risk and Financial Management 13 (4):74, April, pages 1–25.
3 For a further description of the analysis, see Kragh-Sørensen, K. (2012) “Optimal capital adequacy ratios for Norwegian banks”, Staff Memo, 29/2012, Norges Bank.
4 For a complete description of the analysis, see Andersen,.H. and R. Juelsrud (2022) “Optimal kapitaldekning for norske banker” [Optimal capital adequacy ratios for Norwegian banks]. Staff Memo 9/2022, Norges Bank (in Norwegian only, forthcoming in English).
5 See Modigliani, F. and M. H. Miller (1958) “The cost of capital, corporation finance and the theory of investment”, American Economic Review, Vol. 48, No. 3, pages 261–297.
6 See, eg, European Central Bank (2011) “Common Equity Capital, Banks' Riskiness and Required Return on Equity”, Financial Stability Review, ECB, December 2011.
7 The average Pilar 2 requirement for the largest Norwegian banks is close to 2%. In September 2022, Finanstilsynet changed the requirements for the kind of capital banks may use to satisfy the Pillar 2 requirement. Previously, the entire Pillar 2 requirement needed to be satisfied using CET1 capital. Following the change, Finanstilsynet requires that banks use at least 56.25% CET1 capital to satisfy the requirement. However, Finanstilsynet intends to update the Pillar 2 requirements later this year.
8 For a further description, see Financial Stability Board (2015) “Assessing the economic costs and benefits of TLAC implementation”, FSB, November 2015.
Annex
Important measures in the financial system in Norway
The Norwegian banking sector
Important measures in the financial system in Norway
|
Category |
Instrument |
First introduced |
Current level |
|
Credit standards requirements for mortgages |
Tolerate higher interest rate (stress test)1 |
20152 |
5 percentage points |
|
Loan-to-value (LTV) ratio |
20152 |
85% (60% for loans secured on secondary homes in Oslo) |
|
|
Principal repayment requirement |
20152 |
2.5% a year with LTV above 60% |
|
|
Debt-to-income (DTI) ratio1 |
2017 |
5 times gross income |
|
|
Flexibility quota3 |
2015 |
10% (8% for loans secured on dwellings in Oslo) |
|
|
Credit standards requirements for consumer credit4 |
Tolerate higher interest rate (stress test) |
20192 |
5 percentage points |
|
Principal repayment requirement |
20192 |
Monthly principal repayment, maximum term 5 years |
|
|
Debt-to-income (DTI) ratio1 |
20192 |
5 times gross income |
|
|
Flexibility quota3 |
2019 |
5% |
|
|
Risk-based capital requirements5 (share of risk-weighted assets6) |
Pillar 1 Minimum CET1 requirement |
20137 |
4.5% |
|
Pillar 1 Minimum Tier 1 requirement |
19918 |
6% |
|
|
Pillar 1 Minimum regulatory capital |
1991 |
8% |
|
|
Pillar 1 Combined buffer requirements: |
|||
|
Capital conservation buffer |
2013 |
2.5% |
|
|
Systemic risk buffer |
2013 |
4.5%9 |
|
|
Buffer for systemically important financial institutions (SIFIs) |
2015 |
1% for Kommunalbanken AS and Nordea Eiendomskreditt AS and 2% for DNB ASA |
|
|
Countercyclical capital buffer |
2015 |
1.5%10 |
|
|
Pillar 2 requirements |
2007 |
Varies across banks |
|
|
Risk weighting for risk-based capital requirements |
Minimum requirement for loss given default (LGD) in IRB banks’ mortgage models |
2014 |
20% |
|
Calibration requirement for IRB banks’ mortgage models for PD and LGD |
2015 |
||
|
Floor for average risk weights for mortgages |
2020 |
20% |
|
|
Floor for average risk weights for commercial property mortgages |
2020 |
35% |
|
|
Leverage-based capital requirements5 (share of exposure measure) |
Leverage ratio |
2017 |
3% minimum requirement |
|
Liquidity requirements |
Liquidity Coverage Ratio (LCR) |
2015 |
100% |
|
LCR in individual currencies |
2017 |
100% |
|
|
LCR in NOK |
2017 |
50% (for banks with EUR/USD as significant currencies) |
|
|
Net Stable Funding Ratio (NSFR) |
2022 |
100% |
|
|
Minimum requirement for own funds and eligible liabilities (MREL) |
Loss absorption amount |
2019 |
Minimum requirement for regulatory capital + Pillar 2 requirements + combined buffer requirements11 |
|
Amount necessary for recapitalisation12 |
2019 |
Minimum requirement for regulatory capital + Pillar 2 requirements + combined buffer requirements excluding countercyclical capital buffer requirement |
|
|
Total MREL |
2022 |
Total MREL is described on page 39 of Financial Stability Report 2021 |
|
|
Subordinated MREL |
2022 |
Subordinated MREL is described on page 38 of Financial Stability Report 2021 |
Footnotes
1 The requirement pertains to the customer’s total debt.
2 Prior to being laid down in a regulation, the requirements were issued as guidelines, for residential mortgage loans in 2010 and for consumer credit in 2017.
3 Up to a certain percentage of the total value of new mortgage loans/consumer credit granted each quarter may be loans in breach of one or more of the requirements. A spesific flexibility quota for Oslo was introduced in 2017.
4 Exemption for credit cards with credit limits below NOK 25 000 and exemption for loan refinancing as long as the value of the refinanced loan (and associated costs) does not exceed the value of the existing loan (and associated costs).
5 See explanation of capital requirements in Norway’s financial system 2022, pages 101–107.
6 Risk-weighted assets. A number of regulations have been introduced for banks’ calculation of risk weights, especially for residential mortgage loans.
7 From 2002, hybrid capital could account for up to 15% of Tier 1 capital.
8 In 2013, the minimum requirement increased from 4% to 6% when CRR/CRD IV were implemented in the Norwegian rules.
9 Applicable to banks using the advanced IRB approach from end-2020, while the 3% requirement applies to other banks until end-2022.
10 The requirement increases to 2% on 31 December 2022 and to 2.5% on 31 March 2023.
11 The loss absorption amount requirement is the larger of the leverage-based Tier 1 capital requirements and total risk-based capital requirement (minimum requirement, Pillar 2 requirements and buffer requirements). In Norway, the risk-based requirement is the more binding.
12 Applies only to banks subject to resolution and not liquidation under public administration.
Sources: Ministry of Finance, Finanstilsynet and Norges Bank
The Norwegian banking sector
See Norway´s financial system 2022 for a further description.
Chart 1 Lending market shares1 Percent. At 30 June 2022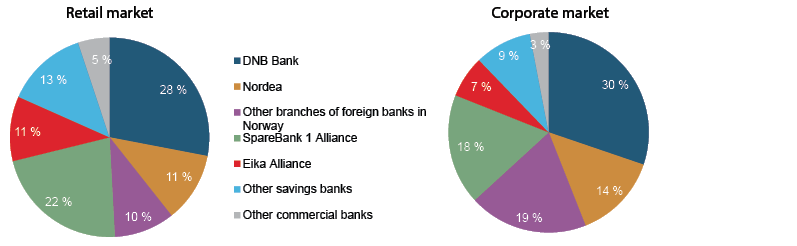
Chart 2 Credit to households and businesses by credit source2 Gross domestic credit. In billions of NOK. At 30 June 2022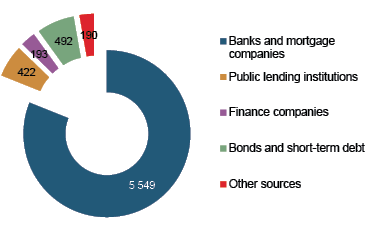
Chart 3 Lending breakdown3 Banks and covered bond mortgage companies in Norway. Percent. At 30 June 2022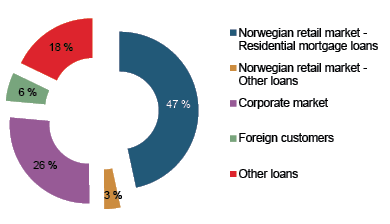
Chart 4 Lending to the corporate sector4 Banks and covered bond mortgage companies in Norway. Percent. At 30 June 2022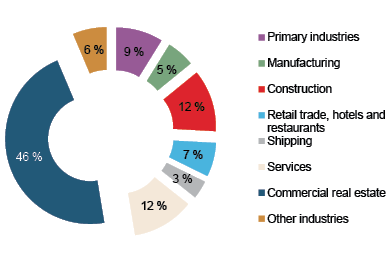
Chart 5 Assets and funding5 Norwegian-owned banks and covered bond mortgage companies. Percent. At 30 June 2022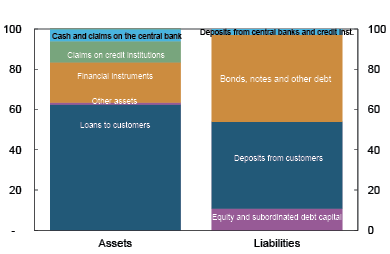
1 All banks and mortgage companies in Norway. See Table 2.
2 All banks and mortgage companies including Eksportfinans.
3 Total lending of NOK 6 746bn.
4 Other industries comprises “Extraction of natural resources”, “Oil services”, “Other transport activities” and “Power”. Loans to foreign customers are not included.
5 Total of all banks and mortgage companies excluding branches and subsidiaries of foreign banks in Norway.
Regulatory capital comprises equity, subordinated debt capital etc.
Other colour codes:
Red: Cash and claims on central banks
Orange: Other assets
Grey: Deposits
Table 1 Structure of the Norwegian financial industry at 30 June 2022
|
Number |
Lending1(NOK bn) |
Total assets (NOK bn) |
|
|
Banks (excluding branches of foreign banks) |
116 |
3 086 |
4 921 |
|
Branches of foreign banks |
16 |
1 319 |
1 932 |
|
Mortgage companies (including branches of foreign companies) |
31 |
2 340 |
2 664 |
|
Finance companies (including branches of foreign companies) |
41 |
208 |
214 |
|
State lending institutions |
3 |
426 |
437 |
|
Life insurance companies (excluding branches of foreign companies) |
11 |
127 |
1 989 |
|
Non-life insurance companies (excluding branches of foreign companies) |
50 |
1 |
213 |
|
NOK bn |
|||
|
Market value of equities and equity certificates, Oslo Børs |
3 920 |
||
|
Outstanding domestic bond and short-term paper debt |
2 804 |
||
|
Issued by public sector and state-owned companies |
942 |
||
|
Issued by banks |
366 |
||
|
Issued by other financial institutions |
736 |
||
|
Issued by other private enterprises |
327 |
||
|
Issued by non-residents |
433 |
||
|
GDP Norway (2021) |
4 142 |
||
|
GDP mainland Norway (2021) |
3 267 |
1 Lending to the public only, ie lending to credit institutions and foreign customers is excluded.
Sources: Bloomberg, Finanstilsynet (Financial Supervisory Authority of Norway), Statistics Norway, VPS and Norges Bank
Table 2 Market shares1 of banks and covered bond mortgage companies in Norway at 30 June 2022. Percent
|
Gross lending to |
Deposits from |
|||
|
Retail market9 |
Croporate market10 |
Retail market9 |
Croporate market10 |
|
|
DNB Bank2 |
28 |
30 |
33 |
36 |
|
Nordea3 |
11 |
14 |
7 |
12 |
|
Branches of foreign banks in Norway4 (excluding Nordea) |
10 |
19 |
6 |
20 |
|
SpareBank 1 Alliance5 |
22 |
18 |
21 |
15 |
|
Eika Alliance6 |
11 |
7 |
13 |
7 |
|
Other savings banks7 |
13 |
9 |
12 |
8 |
|
Other commercial banks8 |
5 |
3 |
7 |
2 |
|
Total |
100 |
100 |
100 |
100 |
|
Total (NOK bn) |
3 363 |
1 793 |
1 565 |
1 057 |
1 The market shares are calculated by summing the balance sheet items for the institutions in the different groups.
2 DNB Bank and DNB Boligkreditt, Sbanken and Sbanken Boligkreditt
3. Nordea Bank AB (Publ), branch in Norway, Nordea Direct Bank, Nordea Direct Boligkreditt and Nordea Eiendomskreditt.
4. Danske Bank, Handelsbanken, Handelsbanken Eiendomskreditt and nine other branches.
5. SpareBank 1 SR-Bank, SpareBank 1 SMN, SpareBank 1 Østlandet, SpareBank 1 Nord-Norge, the other nine savings banks in the Sparebank 1 Alliance, BN Bank, SP1 Boligkreditt, SP1 næringskreditt and two other residential mortgage lenders.
6. Eika Boligkreditt, Eika Kredittbank, 64 savings and commercial banks that are owners of Eika Gruppen AS and three other residential mortgage lenders. The sample includes the ten banks that have left the Eika Alliance and established their own alliance (LOKALBANK Alliance).
7. Sparebanken Vest, Sparebanken Vest Boligkreditt, Sparebanken Sør, Sparebanken Møre, Sparebanken Sogn og Fjordane, 13 other savings banks, six residential mortgage lenders, one mortgage lender and one hybrid mortgage company.
8. Santander Consumer Bank AS, Eksportfinans, Storebrand Bank, Landkreditt Bank, 21 other commercial banks, three residential mortgage lenders, Kommunalbanken and one municipal mortgage lender.
9. The retail market comprises wage earners, pensioners, benefit recipients and students.
10 The corporate market primarily comprises non-financial private enterprises and the self-employed.
Source: Norges Bank
Table 3 Rating by Moody’s1, total assets, leverage ratio, capital adequacy and return on equity for Nordic and Norwegian banks at 2022 Q2. Consolidated figures
|
Credit rating |
Total assets(NOK bn) |
Leverage ratio (%) |
Common Equity Tier 1 (CET1) capital ratio (%) |
Return on equity |
||||
|
Short-term |
Long-term |
|||||||
|
2020 |
2021 |
2022Q1–Q2 |
||||||
|
Nordea Bank |
P-1 |
Aa3 |
6 310 |
4.9 |
16.6 |
7.1 |
10.9 |
8.4 |
|
Danske Bank |
P-2 |
A3 |
5 662 |
4.7 |
17.1 |
2.8 |
7.5 |
5.2 |
|
SEB |
P-1 |
Aa2 |
3 557 |
4.8 |
18.7 |
9.5 |
11.0 |
10.8 |
|
Handelsbanken |
P-1 |
Aa3 |
3 965 |
4.3 |
18.6 |
9.7 |
13.9 |
12.9 |
|
DNB |
P-1 |
Aa2 |
3 308 |
6.5 |
18.0 |
8.2 |
10.3 |
12.6 |
|
Swedbank |
P-1 |
Aa3 |
2 807 |
5.2 |
18.3 |
8.9 |
13.1 |
11.8 |
|
SpareBank 1 SR-Bank |
P-1 |
A1 |
319 |
7.1 |
17.9 |
6.3 |
12.0 |
11.2 |
|
Sparebanken Vest |
P-1 |
Aa3 |
254 |
6.7 |
18.5 |
11.7 |
13.2 |
13.6 |
|
SpareBank 1 SMN |
P-1 |
A1 |
217 |
6.9 |
18.8 |
9.7 |
13.0 |
12.3 |
|
SpareBank 1 Østlandet |
P-1 |
A1 |
152 |
9.0 |
17.4 |
8.1 |
8.6 |
7.3 |
|
Sparebanken Sør |
P-1 |
Aa3 |
169 |
7.1 |
18.0 |
9.9 |
11.3 |
9.5 |
|
SpareBank 1 Nord-Norge |
P-1 |
Aa3 |
126 |
8.1 |
19.3 |
12.2 |
14.5 |
9.9 |
1 Rating at 7 November 2022. Moody’s scale of rating: Short-term: P-1, P-2,… Long-term: Aaa, Aa1, Aa2, Aa3, A1, A2,…
Sources: S&P Capital IQ, Moody's and Norges Bank
Table 4 Banks’¹ and covered bond mortgage companies’ losses on loans² to various industries and sectors as a percentage of lending to the respective industries and sectors
|
Lending in NOK bn |
|||||||
|
Industry/sector |
2018 |
2019 |
2020 |
2021 |
As at Q1 2022 |
As at Q2 2022 |
As at Q2 2022 |
|
Agriculture, forestry and fishing |
0.1 |
0.1 |
0.2 |
0.0 |
0.0 |
0.1 |
154.8 |
|
of which: Fish farming, hatcheries |
0.2 |
0.0 |
0.4 |
-0.1 |
-0.2 |
0.3 |
43.6 |
|
Extraction of crude oil and natural gas |
2.6 |
0.9 |
5.7 |
1.3 |
-1.4 |
-1.3 |
7.8 |
|
Manufacturing, mining and quarrying |
0.7 |
0.0 |
1.6 |
-0.6 |
0.5 |
-0.2 |
99.2 |
|
of which: Manufacturing |
0.3 |
0.6 |
1.5 |
0.0 |
0.5 |
0.0 |
92.1 |
|
of which: Ship and boat building |
3.1 |
0.0 |
3.0 |
-1.8 |
1.1 |
-4.5 |
4.0 |
|
of which: Other services related to extraction of crude oil and natural gas |
2.8 |
0.2 |
20.3 |
0.6 |
1.9 |
-1.9 |
4.4 |
|
Electricity and water supply, construction |
0.3 |
-0.1 |
0.4 |
0.0 |
0.3 |
0.3 |
278.8 |
|
of which: Construction |
0.5 |
-0.3 |
0.8 |
0.0 |
0.0 |
1.9 |
54.2 |
|
Retail trade and auto repair, hotels and restaurants |
0.9 |
0.2 |
1.0 |
-0.1 |
0.3 |
-0.5 |
116.7 |
|
of which: Retail trade and auto repair |
1.0 |
0.2 |
0.9 |
-0.2 |
0.4 |
-0.6 |
93.8 |
|
of which: Hotels and restaurants |
0.4 |
0.3 |
1.3 |
0.1 |
0.0 |
-0.1 |
22.9 |
|
Shipping and pipeline transport |
1.1 |
-0.1 |
4.8 |
0.2 |
-0.1 |
-0.9 |
61.4 |
|
Other transport and communications |
0.2 |
1.0 |
0.9 |
0.0 |
-0.2 |
0.4 |
73.7 |
|
of which: Supply and other sea transport services for offshore |
8.7 |
5.5 |
18.9 |
1.8 |
3.0 |
-7.5 |
21.1 |
|
Business services and real estate activities |
0.4 |
0.1 |
0.4 |
0.0 |
0.0 |
-0.1 |
972.1 |
|
of which: Real estate activities |
0.2 |
0.0 |
0.3 |
0.0 |
0.0 |
-0.1 |
817.3 |
|
of which: Professional, financial business services |
1.2 |
0.2 |
1.1 |
0.0 |
-0.1 |
0.0 |
154.8 |
|
Other service industries |
0.1 |
0.4 |
0.4 |
0.0 |
-0.2 |
0.1 |
52.1 |
|
Total for all industries |
0.6 |
0.2 |
1.1 |
0.0 |
0.1 |
-0.1 |
1 842 |
|
Retail market |
0.2 |
0.1 |
0.1 |
0.1 |
0.0 |
0.0 |
2 753 |
|
Other3 |
0.2 |
0.3 |
1.3 |
0.2 |
0.0 |
0.0 |
1 525 |
|
Total |
0.3 |
0.2 |
0.7 |
0.1 |
0.1 |
0.0 |
6 120 |
1 All banks in Norway including foreign branches. Nordea is a branch of a foreign bank from 2017. The figures include mortgage companies.
2 Recognised losses, excluding changes in unspecified loss provisions/collective impairment losses (in 2018 for Norwegian GAAP companies, up to 2017 for all companies).
3 Financial institutions, central government and social security administration, municipal sector and foreign sector.
Source: Norges Bank
Tabell 5 Loan defaults. All banks and covered bond mortgage companies.1 At year–end
|
Year |
Loan defaults. Percentage of lending to sector |
Loan defaults. Percentage of lending to private sector |
||||||
|
Households |
Enterprises |
Other |
Households |
Enterprises |
Other |
Total |
||
|
1990 |
4.9 |
7.6 |
3.1 |
3.1 |
2.6 |
0.1 |
5.7 |
|
|
1991 |
6.3 |
10.2 |
3.1 |
4.1 |
3.4 |
0.1 |
7.5 |
|
|
1992 |
8.2 |
11.5 |
1.9 |
5.2 |
3.9 |
0.1 |
9.2 |
|
|
1993 |
6.5 |
10.6 |
0.4 |
4.3 |
3.5 |
0.0 |
7.7 |
|
|
1994 |
4.8 |
6.9 |
0.7 |
3.2 |
2.2 |
0.0 |
5.4 |
|
|
1995 |
3.7 |
4.6 |
0.3 |
2.4 |
1.5 |
0.0 |
3.9 |
|
|
1996 |
2.8 |
3.3 |
0.4 |
1.9 |
1.0 |
0.0 |
2.9 |
|
|
1997 |
2.1 |
2.1 |
0.2 |
1.4 |
0.7 |
0.0 |
2.1 |
|
|
1998 |
1.5 |
1.3 |
0.1 |
0.9 |
0.4 |
0.0 |
1.4 |
|
|
1999 |
1.3 |
1.5 |
0.1 |
0.9 |
0.5 |
0.0 |
1.4 |
|
|
2000 |
1.3 |
1.4 |
0.1 |
0.8 |
0.5 |
0.0 |
1.3 |
|
|
2001 |
1.3 |
1.7 |
0.0 |
0.8 |
0.6 |
0.0 |
1.4 |
|
|
2002 |
1.3 |
3.5 |
0.1 |
0.8 |
1.1 |
0.0 |
2.0 |
|
|
2003 |
1.1 |
3.2 |
0.1 |
0.7 |
1.0 |
0.0 |
1.7 |
|
|
2004 |
0.8 |
1.8 |
0.1 |
0.6 |
0.5 |
0.0 |
1.1 |
|
|
2005 |
0.7 |
1.0 |
0.0 |
0.5 |
0.3 |
0.0 |
0.8 |
|
|
2006 |
0.6 |
0.7 |
0.1 |
0.4 |
0.2 |
0.0 |
0.6 |
|
|
2007 |
0.5 |
0.5 |
0.0 |
0.4 |
0.2 |
0.0 |
0.5 |
|
|
2008 |
0.8 |
0.9 |
0.0 |
0.5 |
0.3 |
0.0 |
0.8 |
|
|
2009 |
1.1 |
1.6 |
0.1 |
0.7 |
0.5 |
0.0 |
1.3 |
|
|
2010 |
1.2 |
1.8 |
0.1 |
0.8 |
0.6 |
0.0 |
1.4 |
|
|
2011 |
1.0 |
1.9 |
0.2 |
0.7 |
0.6 |
0.0 |
1.3 |
|
|
2012 |
1.0 |
1.8 |
0.7 |
0.7 |
0.6 |
0.0 |
1.2 |
|
|
2013 |
0.9 |
1.8 |
0.3 |
0.6 |
0.5 |
0.0 |
1.2 |
|
|
2014 |
0.8 |
1.5 |
0.1 |
0.6 |
0.4 |
0.0 |
1.0 |
|
|
2015 |
0.7 |
1.3 |
0.2 |
0.5 |
0.4 |
0.0 |
0.9 |
|
|
2016 |
0.7 |
1.5 |
0.1 |
0.5 |
0.4 |
0.0 |
0.9 |
|
|
2017 |
0.7 |
1.4 |
0.1 |
0.5 |
0.4 |
0.0 |
0.9 |
|
|
2018 |
0.5 |
0.7 |
0.0 |
0.3 |
0.2 |
0.0 |
0.5 |
|
|
2019 |
0.6 |
0.6 |
0.0 |
0.4 |
0.2 |
0.0 |
0.6 |
|
|
2020 |
0.5 |
0.6 |
0.0 |
0.4 |
0.2 |
0.0 |
0.5 |
|
|
2021 |
0.3 |
0.5 |
0.0 |
0.2 |
0.1 |
0.0 |
0.4 |
|
|
20222 |
0.4 |
0.5 |
0.0 |
0.3 |
0.1 |
0.0 |
0.4 |
|
1 Covered bond mortgage companies included from 2005.
2 At 30 Jun 2022.
Source: Norges Bank