The way that we make payments has changed considerably in recent years. A growing share of payments is made using mobile phones, both at physical points of sale and online.
Most payments are made at physical points of sale. Points of sale include shops, restaurants and public transport. Physical payment cards are used in most of these payments but the number of card payments made through mobile apps is increasing rapidly. Our latest survey shows that 30 percent of payments at physical points of sale were made via various mobile payment platforms.
The scale of online purchases has increased significantly over many years. Most online purchases are settled using a payment card, either directly using a physical card or via various mobile payment platforms. One in three online purchases are now settled using mobile phones, and the use is on the rise. One in four online purchases were settled using an invoice.
Different card systems have different areas of use. BankAxept cannot be used to make regular online purchases and could not be used for mobile payments until Spring 2024. The strong growth in online purchases and mobile payments has led to BankAxept payments accounting for an increasingly smaller share of card payments. In 2024, BankAxept accounted for 49 percent of card payments. BankAxept is now able to be used in a range of different mobile payment platforms, which is likely to affect developments ahead.
Norway is one of the countries in the world with the highest annual use of payment cards per inhabitant. On average, each Norwegian used a card 572 times in 2024. In Germany and multiple Mediterranean countries, the use of payment cards is much lower than this, but the use is increasing rapidly.
Cash use has been declining for a long time but has remained stable in recent years. Our latest survey shows that 2 percent of survey participants used cash the last time they paid at a physical point of sale.
Cash withdrawals continue to fall. At the same time, an increasing share of total cash withdrawals is made in shops. The number of ATMs is declining and fewer are owned by banks. In 2024, there were 1129 ATMs in Norway in total, compared with 1168 in 2023.
1. Use of payment instruments
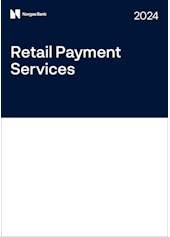
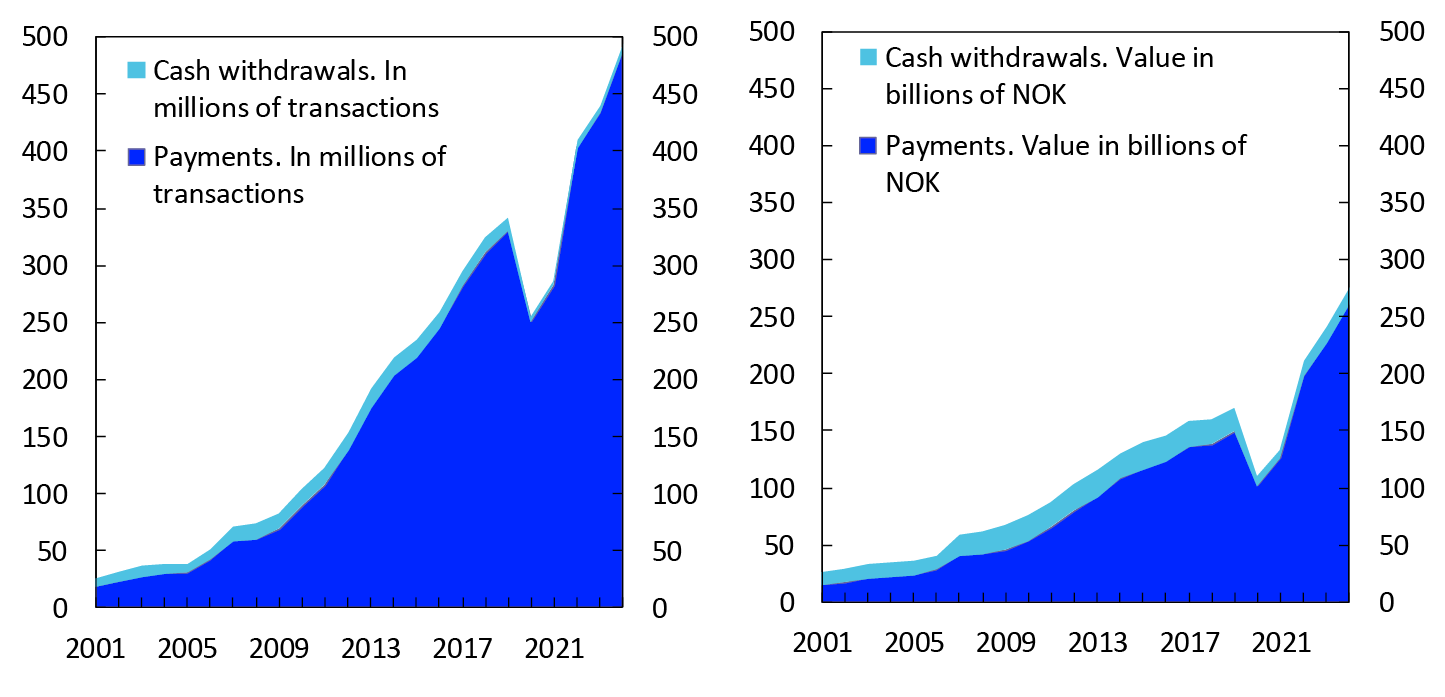
A total of 4157 million card payments and bank transfers1 were made in 2024. The number of card payments was far higher than the number of bank transfers (Chart 1).
Chart 1 Use of payment instruments
In millions of payments. 2001–2024
Source: Norges Bank
Bank transfers are direct transfers between bank accounts. They can be initiated by the payer or the payee. Transfers that are initiated by the payer are called credit transfers. An ordinary online banking payment is a credit transfer. Avtalegiro is a form of direct debit initiated by the payee whereby funds are automatically paid from the payer’s bank account.
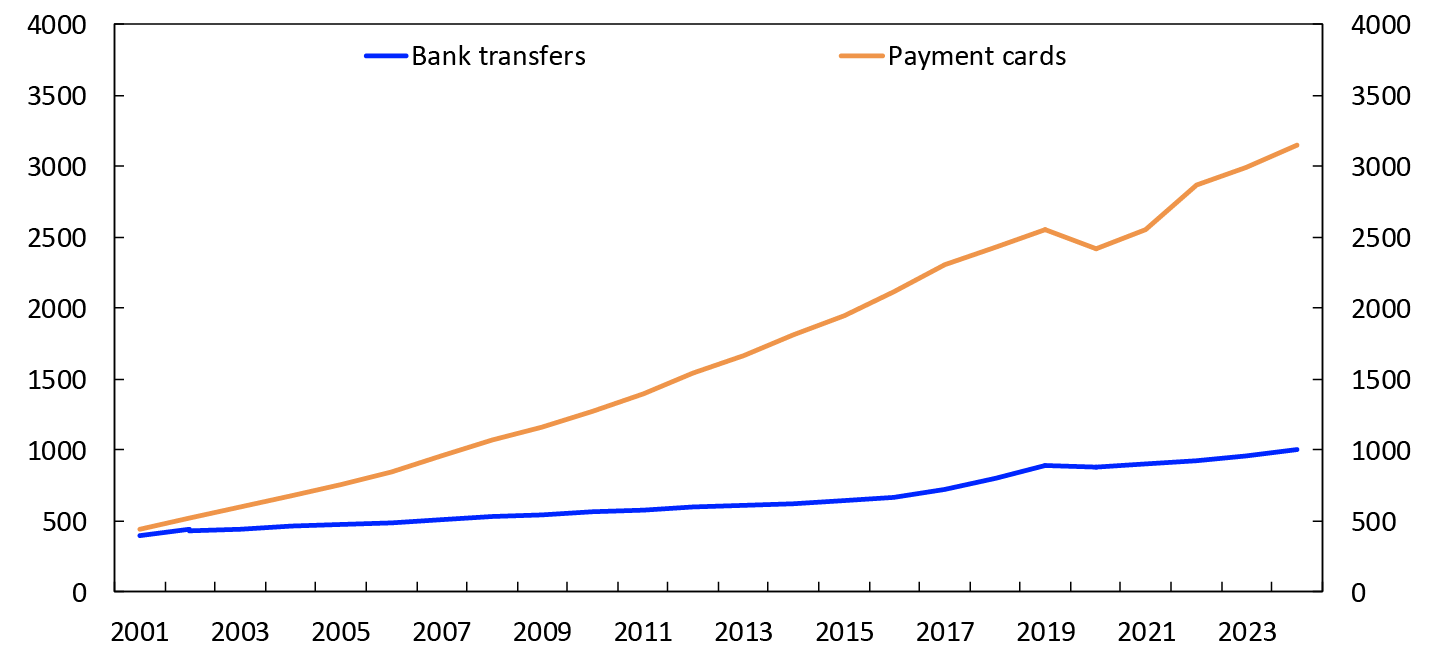
Even though bank transfers were far fewer in number than card payments, their value was far higher than the value of card payments (Chart 2). A typical bank transfer is thus much larger than a typical card payment, and bank transfers made by businesses are especially large.
Chart 2 Use of payment instruments
In billions of NOK, 2001–2024
Source: Norges Bank
Bank transfers are used for paying large bills and for paying wages and salaries, but are increasingly also being used for smaller payments, such as P2P instant payments using the Vipps mobile payment platform. Payment cards are primarily used for the purchase of goods and services at physical and online points of sale.
Bank transfers in more detail
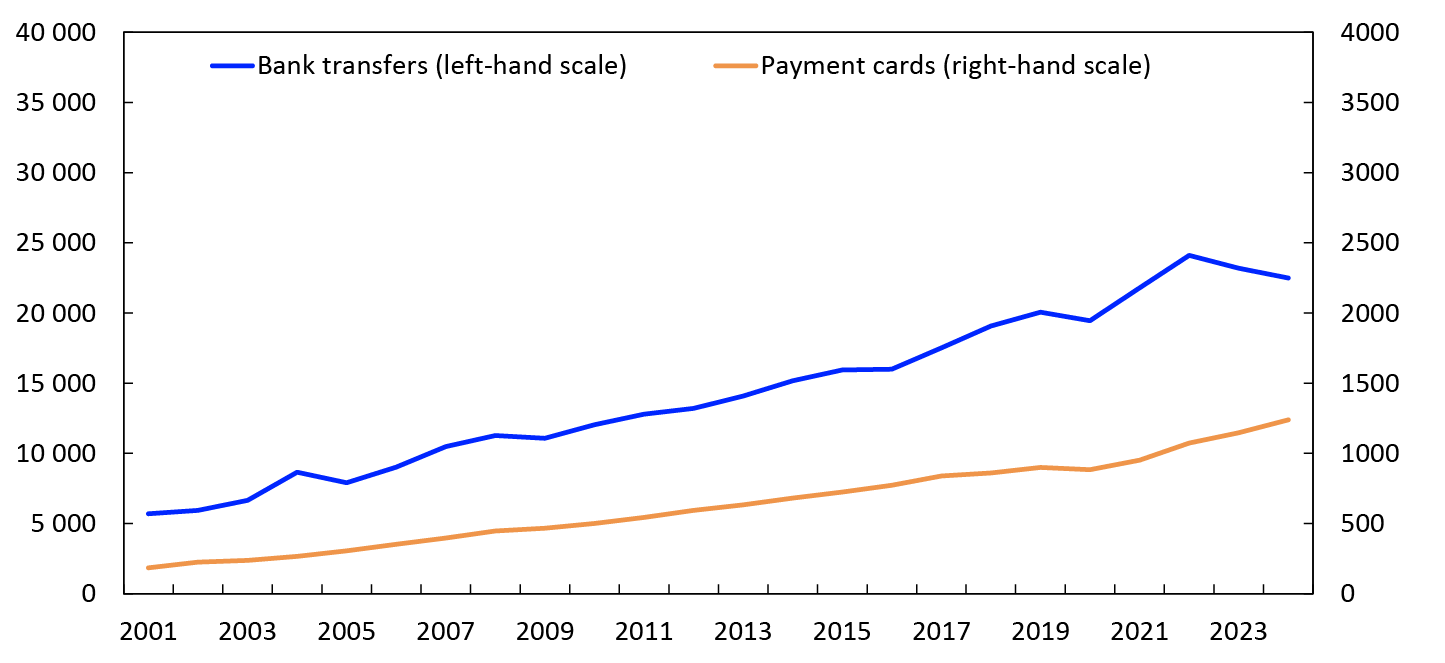
Chart 3 shows developments in some of the most used bank transfer services.
Chart 3 Different types of bank transfers
In millions of payments. 2001–2024
Source: Norges Bank
Retail and corporate customers make around the same number of online banking payments. Retail and corporate customers’ average online banking payments amount to just over NOK 6000 and just under NOK 67 000 respectively.
The use of instant payments increased rapidly over many years but has changed little, or even fallen slightly, since 2022. Instant payments are payments between bank accounts through a dedicated payment infrastructure called NICS Real. The funds are available to the payee within a few seconds of the payer initiating the payment. 2
In 2024, 205 million instant payments were made. The largest share of instant payments was initiated from the Vipps mobile payment platform and were P2P payments. Instant payments can also be initiated via online or mobile banking services.
Avtalegiro is a form of direct debit initiated by the payee whereby funds are automatically drawn from the payer’s bank account. Autogiro is the corresponding service for the corporate market. In 2024, 112 million avtalegiros and 4 million autogiros were paid.3
For many credit transfers made via online or mobile banking services, the payee and payer are customers of the same bank. In many of these cases, transfers are settled using local payment solutions, rather than using central payment solutions, such as NICS4. Local payment solutions are sometimes also used in Vipps for transfers between customers of the same bank. Local payment solutions used for the settlement of payments such as recurring transactions and loan repayments are also included in the item “Miscellaneous other electronic credit transfers”. In 2024, 111 million such payments were reported, compared with 75 million in 2023. The figures for this item are somewhat uncertain.
Bank transfer services involving more manual labour, such as telegiros and postal giros, are now seldom used by the vast majority. In 2024, telegiros were used 3.6 million times, and postal giros were used 1.3 million times. Giros were paid at the counter 0.7 million times in 2024, either by debiting an account or depositing cash.5
Use of electronic invoices
Bills can be sent in different ways: on paper, as e-mail attachments or as electronic invoices (e-invoices). Chart 4 shows developments in the number of different e-invoices sent.
In millions. 2013–2024
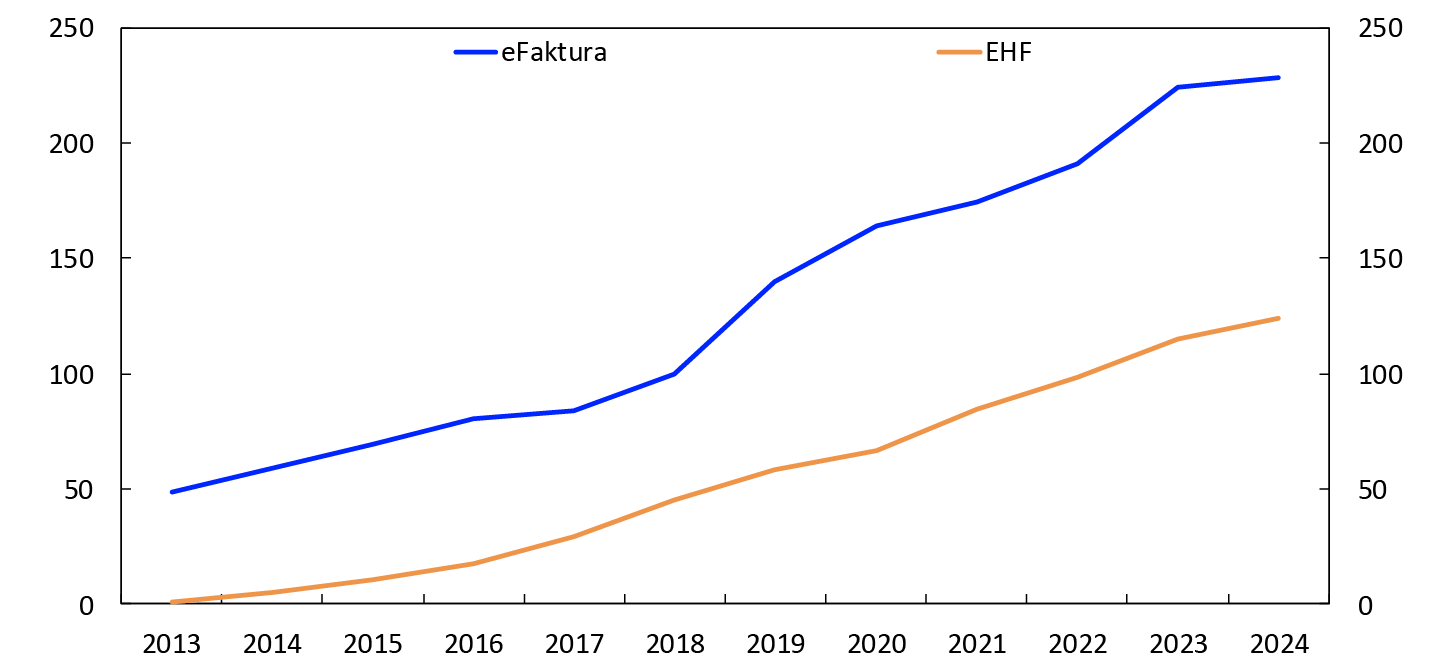
In 2024, 228 million eFaktura e-invoices were sent from businesses to retail customers. Growth has levelled off after being strong for several years. From 2023 to 2024, the rise was 2 percent. The strong growth in previous years was due to, among other things, eFaktura e-invoices being made available for distribution through Vipps from March 2019.
A total of 124 million EHF invoices were sent in 2024. EHF is the government’s e-invoicing format and covers both business-to-government (B2G/G2B) and business-to-business (B2B) invoicing. Growth in the use of these invoices from 2023 and 2024 was 8 percent.
1 A bank transfer is a direct transfer of funds from one bank account to another, without using a card system. We have previously used the term “giro payments” for such payments. They are also called “account-to-account payments” or “A2A payments”.
2 Real-time payments are a slightly broader concept than “instant payments” and include all payments settled immediately. Another example of real-time payments is online banking payments between accounts at the same bank.
3 The figures for direct debit payments have not changed greatly in recent years, however, the number of direct debits sent out to customers is much higher. The reason for the difference between the number of direct debits sent out and the number of direct debits paid is that a direct debit becomes an online banking payment if the customer amends the direct debit, for example by changing the amount, the due date, or the debited account. In 2024, 149.6 million direct debits (Avtalegiro) were sent out. The corresponding figure for 2023 was 148.3 million.
4 Norwegian Interbank Clearing System.
5 Cash deposit payments are not bank transfers according to our definition of this payment instrument.
2. Card transactions
In 2024, 3156 million payments were made with Norwegian payment cards. In addition, 21 million pure cash withdrawals were made.
Of total card payments, 2254 million, or 71 percent, were made at physical payment terminals (EFTPOS terminals)6. The rest of the card payments are mostly regular online payments. There are also card payments made at physical points of sale that do not involve physical payment terminals. These payments are registered in the statistics as regular online payments. Examples of such payments include card payments made through the Coopay and Trumf Pay apps for making grocery payments.
A vast majority of payments at physical payment terminals were contactless payments. Only 8 percent of card payments in 2024 were made by inserting the payment card into the card terminal. Contactless payments at payment terminals can be made either with a physical card or in some other manner, for example with a mobile phone, watch or wristband.7 The average value of contactless payments was NOK 356.
Payments with physical cards account for most payments at payment terminals. Payments using mobile phones, watches or wristbands accounted for 12 percent of payments at payment terminals in 2024, up from 8 percent in 2023. There were 279 million such payments in 2024. See the box “Making mobile payments in shops” for more information on how such payments are made.
During the pandemic, it became more common to make large purchases less frequently, instead of making many small purchases. This resulted in fewer card transactions in 2020 and 2021 than in 2019. The number of card transactions per inhabitant is now increasing at the same pace as before (Chart 5). The average number of card transactions per inhabitant (payments and cash withdrawals) was 572 in 2024, compared with 550 in 2023. The average value of card transactions rose from NOK 398 in 2023 to NOK 406 in 2024. One possible reason why the value of card transactions has begun to rise again is that the use of cash seems to have stabilised. The previous fall in the value of card transactions was likely partly due to card transactions replacing cash transactions that are generally lower in value than card transactions. The increase in the value of card transactions is also partly related to inflation.
Chart 5 Card transactions per inhabitant per year and value per card transaction in NOK
2001–2024
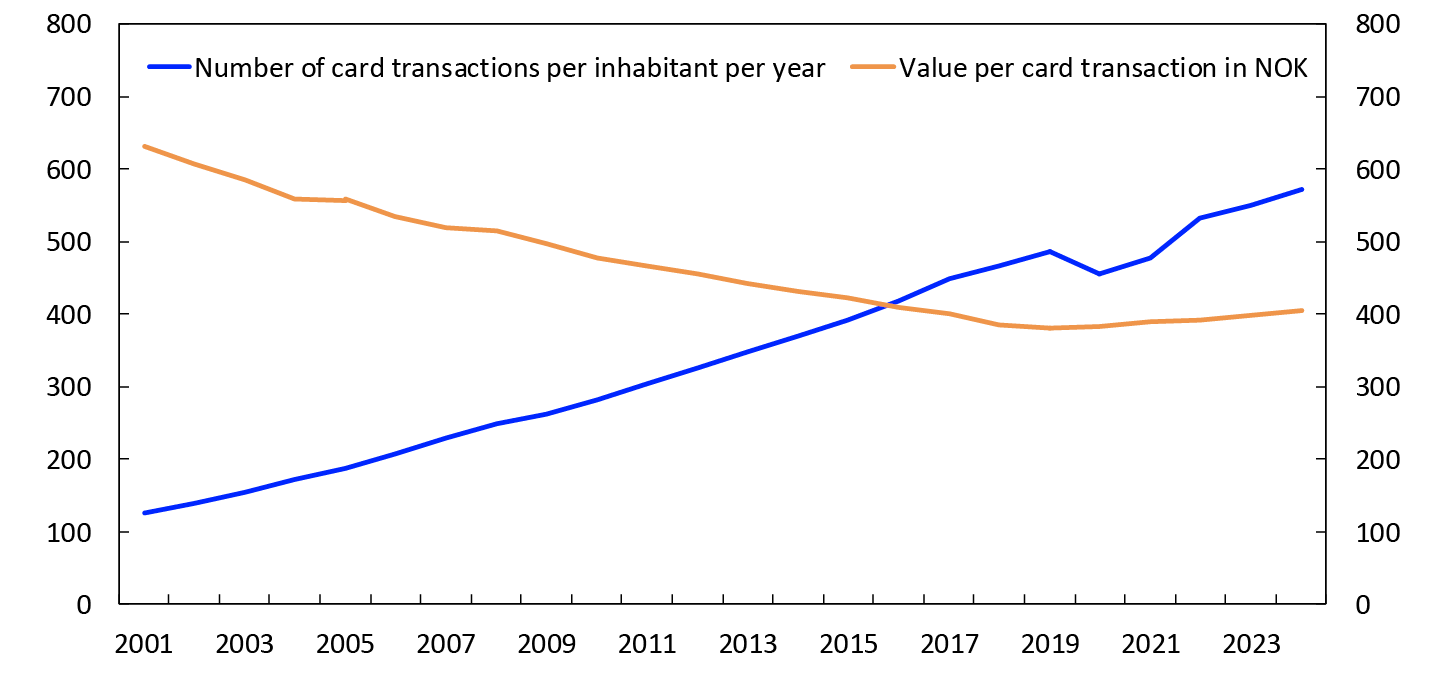
Source: Norges Bank
Making mobile payments in shops
In general, there are two different types of solution for using a mobile phone to pay in a shop – terminal-based and web-based. Both mainly use a payment card as the underlying payment instrument. The most common terminal-based solutions are Apple Pay, Google Pay and Vipps NFC, while Coopay and Trumf Pay are examples of web-based solutions. See Retail Payment Services 2023 for details on how different mobile payments work.
The use of mobile payments in shops is increasing rapidly. Mobile payments using terminal-based solutions (including payments with watches, wristbands and so on) accounted for 12 percent of payments at physical payment terminals in 2024. We do not have figures for payments using web-based solutions, as these are part of the data for regular online purchases in the annual payment statistics. Figures from Norges Bank’s annual survey indicate that web-based and terminal-based solutions together accounted for 30 percent of payments at physical points of sale in March 2025.
Much has happened in this payment segment over the past year. In August 2024, Trumf Pay was launched. Trumf Pay is a web-based solution for payments in shops affiliated to Norgesgruppen. On 9 December 2024, Vipps launched Vipps NFC, its own solution for terminal-based mobile payments. The following day, DNB and Eika Alliance banks began offering Apple Pay to their customers. Due to the two latter of these developments, the vast majority of Norwegian bank customers now have access to terminal-based mobile payments.
From May 2024, banks started making BankAxept available for mobile payments through Apple Pay. Before this, mobile payments were mainly done using international cards. Since December 2024, customers of DNB and Eika Alliance banks have been able to use BankAxept for Vipps NFC and Apple Pay. BankAxept eBetaling1 is one of two possible underlying payment instruments in the Trumf Pay merchant app. In Trumf Pay, it is also possible for customers of some banks to use bank transfers. From February 2025, BankAxept eBetaling has been available for use in Coopay. Previously, only international cards was used in Coopay.
1 Payment using digital BankAxept cards in web-based mobile payment platforms
Number of payment cards
At end-2024, the total number of Norwegian payment cards stood at 12.6 million (Overview 1).
Overview 1 Number of Norwegian payment cards.8 In thousands
|
Card type |
2021 |
2022 |
2023 |
2024 |
|---|---|---|---|---|
|
Combined BankAxept/international debit cards |
7295 |
7374 |
7635 |
7732 |
|
International credit cards |
5043 |
4861 |
4666 |
4605 |
|
Other debit and credit cards |
85 |
85 |
80 |
76 |
|
International charge cards |
367 |
364 |
199 |
201 |
|
E-money cards |
74 |
96 |
35 |
33 |
|
Total |
12 864 |
12 780 |
12 616 |
12 647 |
Source: Norges Bank
The most widely used card type is a card combining BankAxept with an international debit card.9 Around 60 percent of cards are of this type. When a combined card is used abroad or for general online purchases, the international card network in the card is used. When paying at physical card terminals in Norway, both the BankAxept system and the international card system can be used. The choice of payment network can be preset in the terminal, and the payee will normally choose the cheapest payment network. However, the terminal must give the cardholder the option of overriding the payee’s choice.
The next most widely used card type is international credit cards, which account for 36 percent of cards.
Card transactions by issuer
The number of transactions using the national debit card system BankAxept decreased further, from 1612 million in 2023 to 1542 million in 2024 (Chart 6). Transactions using BankAxept cards accounted for 49 percent of transactions using Norwegian cards in 2024, down from 53 percent in 2023. If we only look at transactions made in Norway, BankAxept’s market share in 2024 was 57 percent, down from 63 percent in 2023.
In millions of transactions. 2001–2024
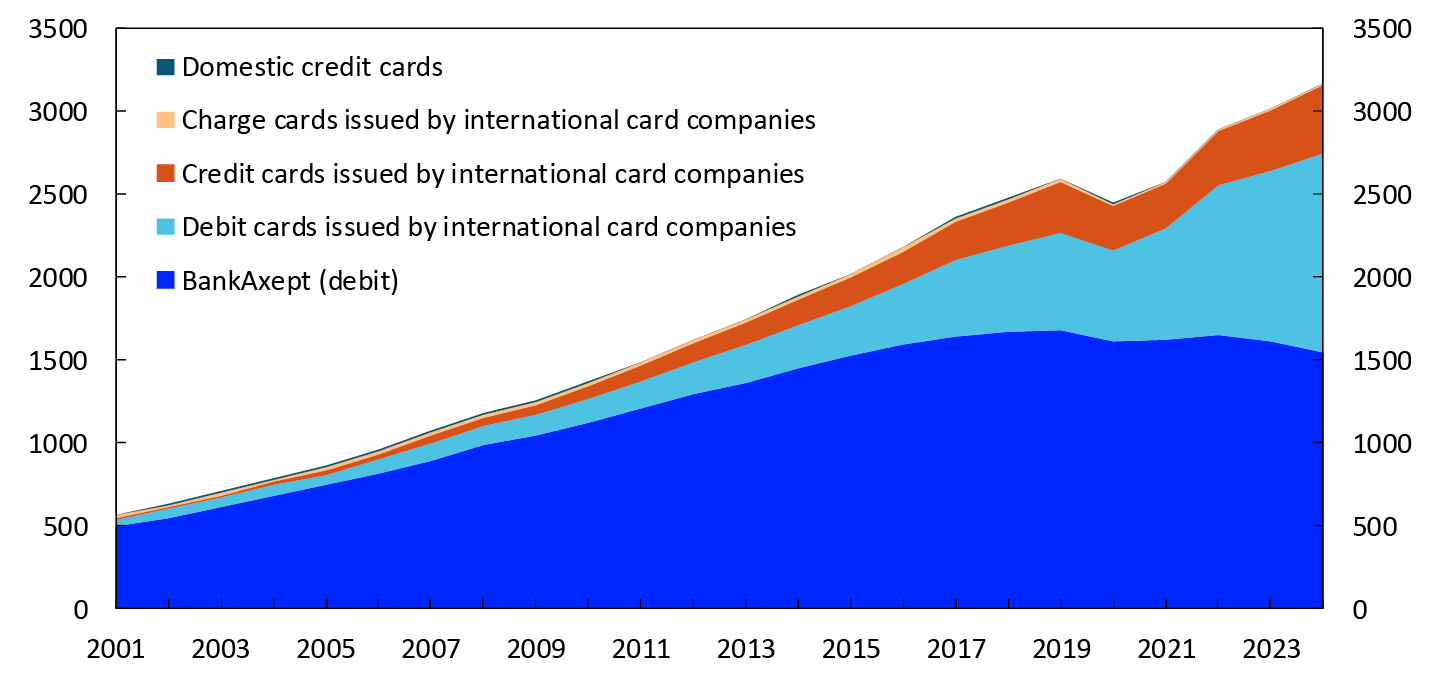
In 2024, 1632 million transactions were made using cards issued by international card companies, an increase of 16 percent on 2023.
BankAxept cards have primarily been used for payments at physical points of sale in Norway. International cards are used for such payments but have also been the only cards used for online purchases, for payments using various apps and for payments abroad. From 2024, BankAxept cards can also be used in various apps (See box: “Making mobile payments in shops”).
International cards have greatly increased their market share in the past decade. This is due to the strong growth in online purchases during the period. Their market share has grown particularly rapidly in the most recent years, owing to a sharp rise in the use of various apps for purchases of goods and services. International cards’ market share increased from 34 percent in 2020 to 47 percent in 2023 and to 51 percent in 2024.
The total value of transactions using Norwegian cards in 2024 was NOK 1289 billion (Chart 7). The value of BankAxept transactions was NOK 561 billion, down 3 percent on 2023. BankAxept transactions accounted for 44 percent of the total value of card transactions in 2024, down from 48 percent in 2023. The value of transactions using international cards was NOK 722 billion in 2024, up 17 percent on 2023
The average transaction value was NOK 364 for BankAxept cards, NOK 372 for international debit cards and NOK 629 for international credit cards.
Chart 7 Use of Norwegian payment cards by issuer and function
In billions of NOK. 2001–2024
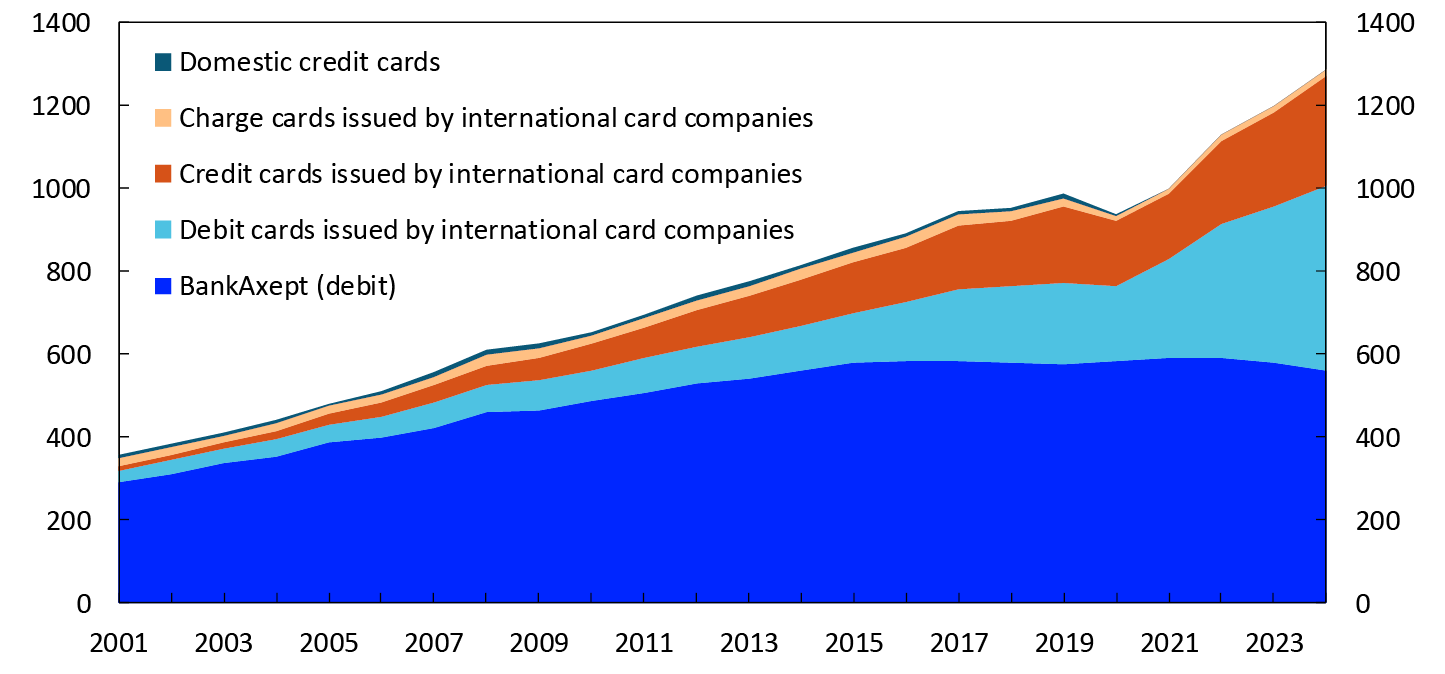
Source: Norges Bank
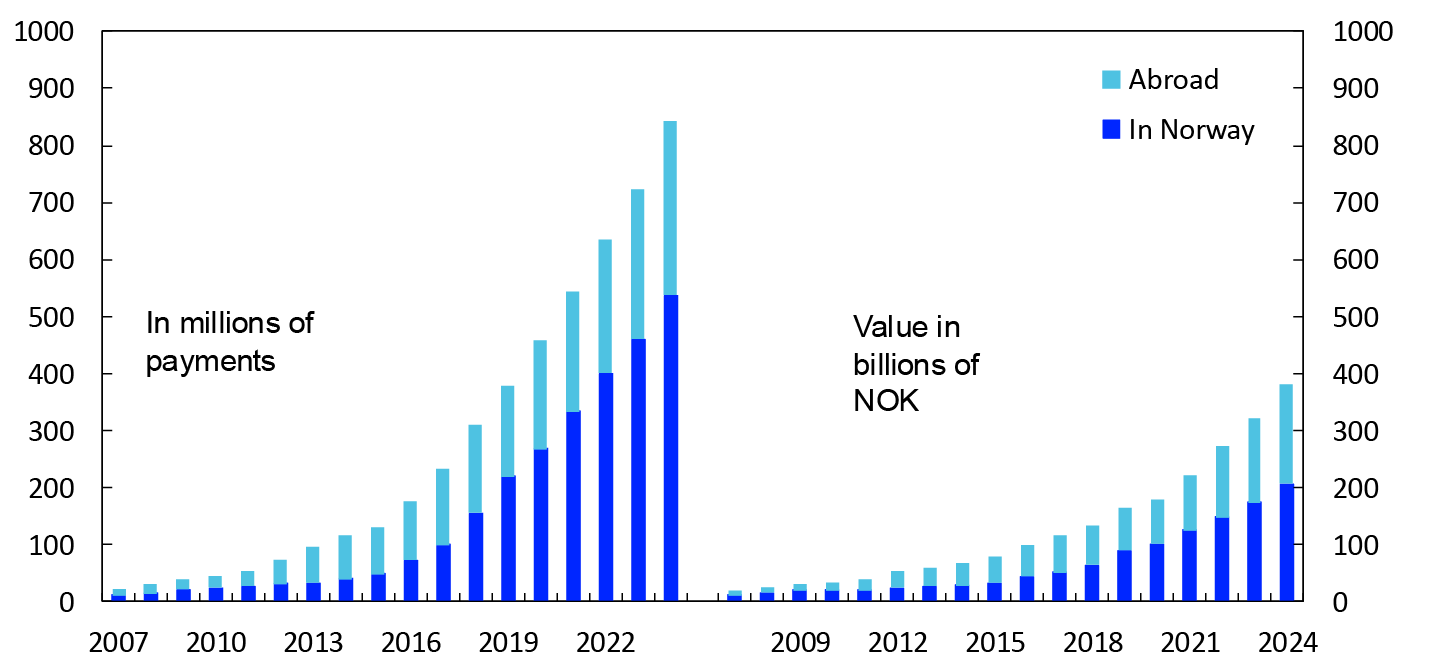
Internet payments (online purchases)
The rapid growth in card payments for online purchases has continued (Chart 8). There were 843 million online payments with Norwegian cards in 2024, up 16 percent on 2023. The figures include both payments in connection with traditional online purchases and payments with various web-based mobile payment solutions at physical points of sale. Growth in payments to Norwegian and international online retailers was approximately the same. Payments to Norwegian online retailers accounted for 64 percent of total card payments for online purchases.
The total value of online payments in 2024 was NOK 381 billion. The value of payments rose by 18 percent from 2023 to 2024. The average value of online payments increased from NOK 444 in 2023 to NOK 453 in 2024.
Chart 8 Online payments with Norwegian payment cards
2007–2024
Source: Norges Bank
As part of Norges Bank’s annual survey on the use of cash and other means of payment, participants were asked how they paid for their most recent online purchase. Chart 9 shows that 36 percent of purchases in the survey were made directly with a payment card. This share has decreased in recent years. A mobile payment platform was used for 35 percent of these purchases. An increasing number of survey participants report using mobile payments for online purchases. 26 percent of online purchases were invoiced. However, there is often also an underlying card payment even if the primary method of payment is invoice, mobile payment or some other method. Payment cards are usually the funding source for online mobile payments, and payment cards are often used to pay invoices for online purchases.
Chart 9 Payment methods for online shopping
Results from surveys. 2021–2025
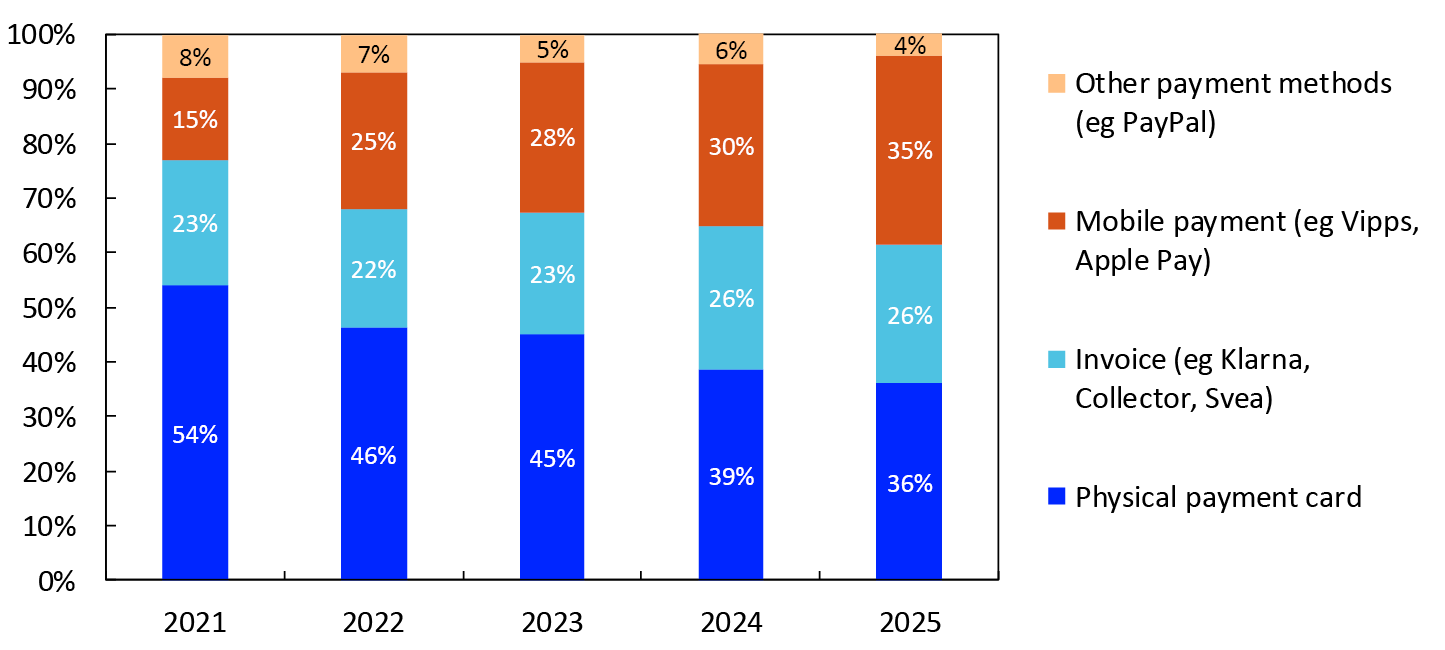
Source: Norges Bank
Online payments account for a growing share of payments made with Norwegian payment cards. Chart 10 shows that online payments accounted for 27 percent of all payments using Norwegian cards in 2024. In terms of value, online payments accounted for 31 percent of all card payments in 2023.
Chart 10 Online payments with Norwegian payment cards
Shares of total card payments. 2007–2024
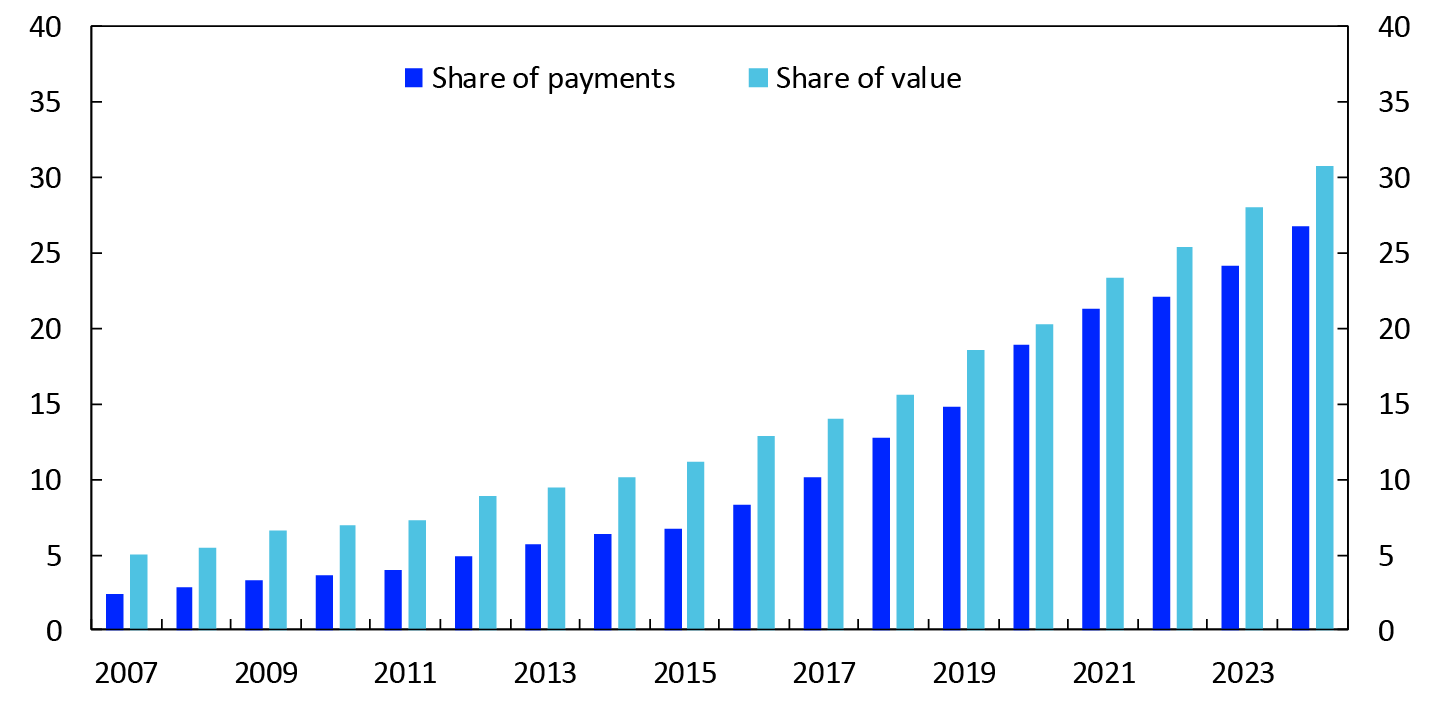
Source: Norges Bank
Card transactions abroad
Chart 12 shows the total use of Norwegian payment cards abroad, both at physical payment terminals and over the internet. A total of 494 million card transactions were made abroad or with foreign counterparties in 2024. This includes 6 million cash withdrawals.
Chart 11 Use of Norwegian payment cards abroad
2001–2024
Source: Norges Bank
The number of payments at physical payment terminals abroad increased from 170 million in 2023 to 182 million in 2024. For the first time, the number of such payments is higher than it was just before the pandemic. The number of payments to websites abroad continued to increase, rising from 264 million in 2023 to 306 million in 2024. Overall, the number of card payments made abroad or with foreign counterparties rose by 12 percent from 2023 to 2024.
The total value of card use abroad in 2024 was NOK 275 billion. The value of payments was NOK 261 billion, while the value of cash withdrawals was NOK 14 billion. The total value of payments was 14 percent higher than in 2023. The average value of card transactions abroad was NOK 557.
International cards are used for card transactions abroad. The statistics show that international debit cards were used in almost eight out of ten transactions. International credit cards were used for most of the remaining payments.
Norway is among the countries with the highest use of cards as a means of payment for goods and services (Chart 12).10 The average Norwegian made 545 card payments in 2023, or 1.5 payments per day. Germany and several Mediterranean countries are found at the other end of the scale. However, card use is also increasing rapidly in these countries. The number of card payments per inhabitant in Germany climbed from 122 in 2022 to 139 in 2023. In Italy, the number of card payments per inhabitant increased from 106 in 2022 to 123 in 2023.
Chart 12 Number of card payments per inhabitant per year in selected countries11
2022 and 2023
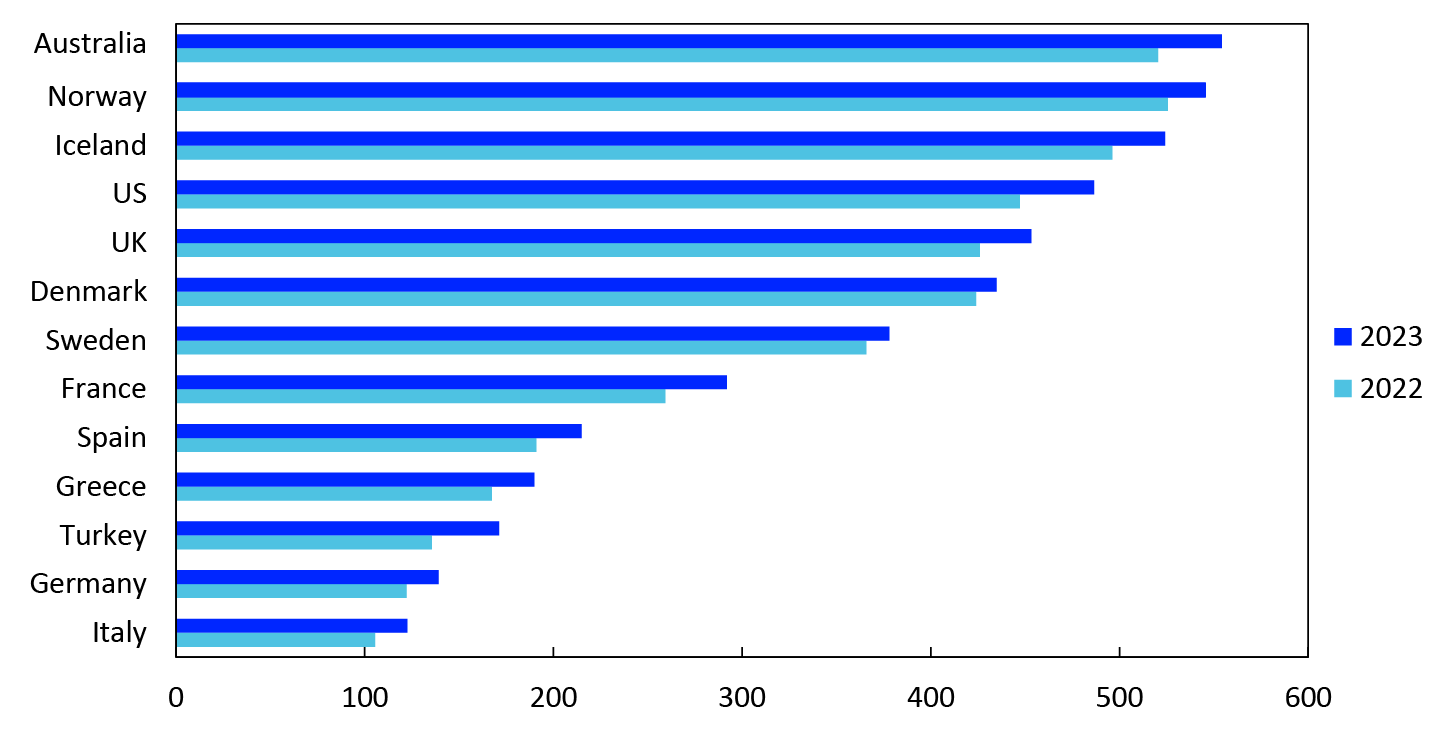
Sources: BIS, Danmarks Nationalbank, ECB, Sedlabanki Islands and Norges Bank
Vipps transfers between private individuals in the Nordic region
Most cross-border transfers between private individuals are made using bank transfers. In 2024, Vipps launched a new payment service for transfers between Vipps customers in the Nordic region (except Iceland). The service is card-based and uses the Visa Direct and Mastercard Send services.
Both the payer and payee must be Vipps customers, and the payee must register a recipient payment card in Vipps. Transfers are made in the payee’s currency. Fees are paid by the payer and consist of a fee paid to Vipps of 4 percent of the payment amount and a currency surcharge paid to the payer’s card issuer. The currency surcharge can vary across banks but is usually around 2 percent of the payment amount. The surcharge is intended to cover fees that the card issuer must pay to the international card network and compensate the card issuer for risk in connection with fluctuating exchange rates.
The payee will usually be able to access the funds immediately, depending on the bank that has issued the card to the payee.
Vipps’ card acquirer carries out the transfer on Vipps’ behalf. The transfer fees charged by Vipps are intended to compensate the acquirer for the labour and the fees paid by the acquirer to the international card networks.
The acquirer initiates two separate card transactions. First, the acquirer sends a reservation request for the payment amount (in the payee’s currency) to the payer’s card issuer. Then the acquirer sends a request to the payee’s card issuer to credit the amount to the payee. The messages between the acquirer and the two card issuers are sent through the international card network’s messaging systems and take place almost instantaneously.
Next, the acquirer and the card issuers settle the payment between themselves. The payer’s card issuer sends the funds to the acquirer. And the acquirer sends the funds to the payee’s card issuer.
6 EFTPOS (Electronic Funds Transfer at Point of Sale) is a system for card payments at terminals at physical points of sale.
7 Contactless payments with a physical card are made by briefly holding the card close to the terminal. A PIN is required for payments above NOK 500 or if the total value or number of transactions exceeds a set limit. A payment counts as contactless even if a PIN is required. Examples of payments using a mobile phone are those using Apple Pay or Google Pay. Examples of payments using a watch are those using Fitbit Pay or Garmin Pay.
8 Debit card: Payment card enabling the card user to access deposits and credit from the bank account to which the card is linked. The user’s account is debited each time the card is used.
Credit card: Payment card with a line of credit that may be repaid on terms set out in the cardholder agreement, regardless of when the card is used.
Charge card: The user of the card receives a periodic invoice for all use of the card.
9 The term international card is used for Norwegian payment cards issued by international card companies or under license from them. These include Visa, Mastercard and American Express.
10 Figures are for payments only and do not include cash withdrawals.
11 The figures do not include card payments with e-money as the means of payment.
3. Use of cash services
Cash can be withdrawn at bank branches, from ATMs and at many shops, either as POS terminal withdrawals (cashback) or through in-store cash services. See the box “The cash infrastructure” for more information on various cash services.
In 2024, there were 12.9 million withdrawals from ATMs in Norway, and 11.4 million cash withdrawals from POS terminals (cashback and in-store cash services).12 Chart 13 shows the number of cash withdrawals from ATMs and POS terminals and their values. The number of ATM withdrawals fell by 18 percent, while the number of withdrawals from POS terminals increased by 1 percent.
The value of ATM withdrawals was NOK 24.9 billion in 2024, and the value of withdrawals from POS terminals was NOK 12.6 billion. The value of ATM withdrawals fell by 17 percent last year, while the value of withdrawals from POS-terminals increased by 10 percent in the same period. An increasing share of total cash withdrawals takes place in shops.
Some ATM withdrawals are foreign currency withdrawals. In 2024, there were 1.1 million ATM withdrawals of foreign currency with a total value equivalent to NOK 3.6 billion. The value of foreign currency withdrawals thus constituted 14 percent of the total value of ATM withdrawals.
The cash infrastructure
Cash services for retail customers are primarily accessible through three channels: bank branches, cash machines and shops.
The number of bank branches where it is possible to withdraw and deposit cash over the counter has been falling for many years. At the end of 2024, there were 39 such branches in total, down from 74 at the end of 2023.
There are machines both for cash withdrawals (ATMs) and for cash deposits. Cash recycling machines allow both withdrawals and deposits. At end-2024, there were 793 ATMs, 60 cash deposit machines and 336 recycling machines
Banks own just over half of all ATMs, while the cash handling companies Nokas and Loomis and other companies own the remainder. Nokas and Loomis operate both their own ATMs and most of the ATMs owned by the banks and other companies.
Cash services are also offered in shops. Cashback is a voluntary arrangement provided by shops, where customers can withdraw cash in connection with the purchase of goods. Through the “in-store cash services” solution, customers can withdraw and deposit cash at grocery shops. Operated by Vipps AS, this service is available at shops affiliated to Norgesgruppen and some Bunnpris shops, and requires the use of a BankAxept card and PIN code. Shops that take part in the scheme are obliged to have sufficient cash available. At end-2024, there were 1466 participating shops
Chart 13 Cash withdrawals from ATMs and POS terminals
2001–2024
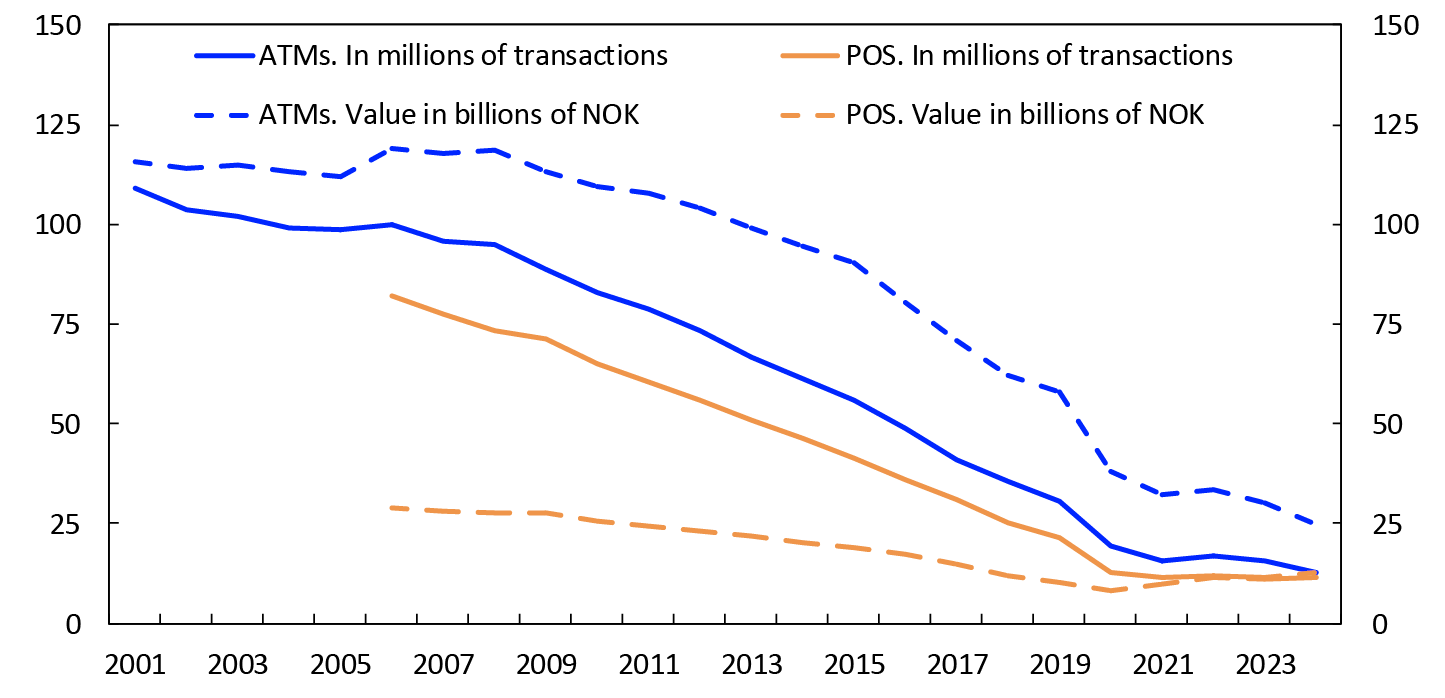
Source: Norges Bank
The average withdrawal in 2024 was NOK 2287 for in-store cash services and NOK 796 for cashback. The average withdrawal from Norwegian ATMs was NOK 1939.
The number of ATMs in Norway fell from 1168 at end-2023 to 1129 at end-2024 (Chart 14). Each of these machines was used for an average of 11 383 cash withdrawals during the year, or 31 per day. The average amount withdrawn from each ATM was NOK 22.1 million in 2024, or just over NOK 60 000 per day
Chart 14 Number of ATMs and withdrawals per ATM per year
2001–2024
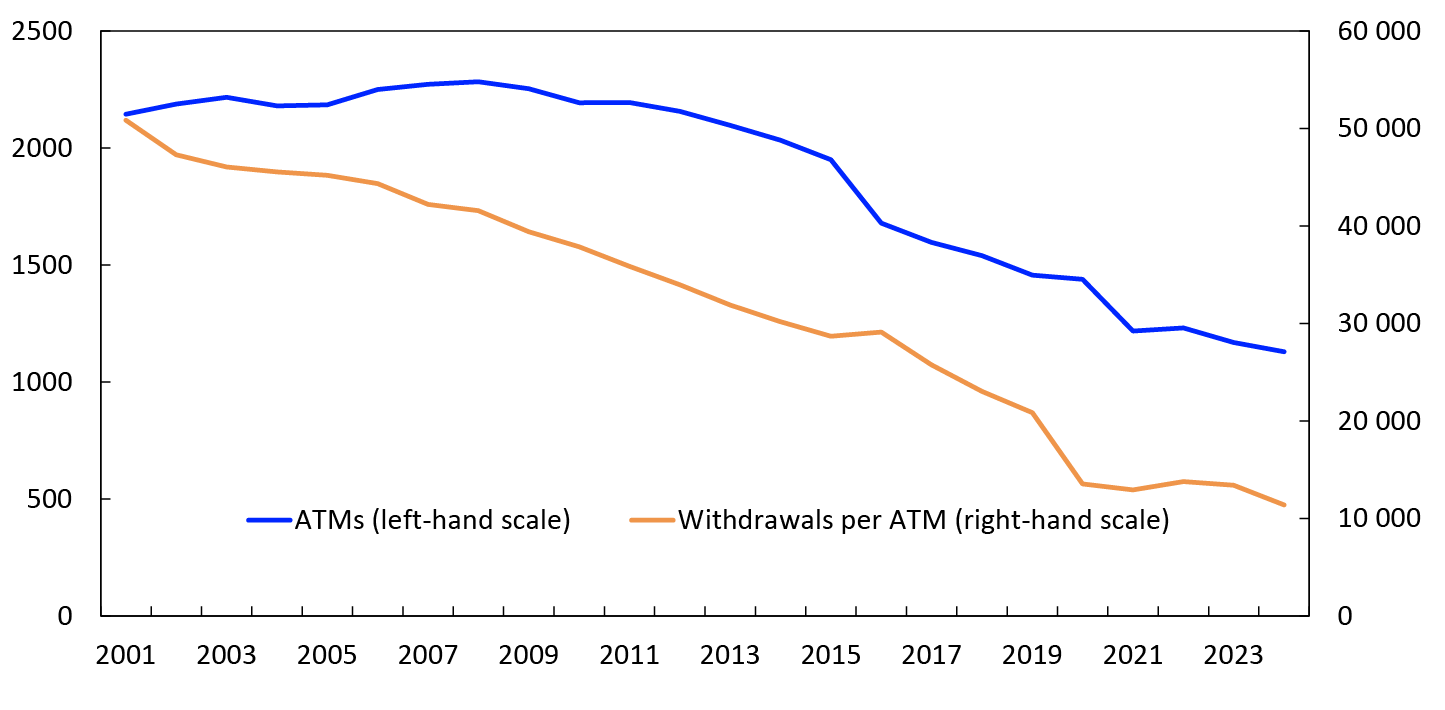
Source: Norges Bank
12 We do not have statistics for over-the-counter cash withdrawals at bank branches.
4. Cash in circulation
The amount of cash in circulation does not necessarily provide any indication of the volume of cash payments. Cash is both a means of payment and a store of value. Banknotes or coins may often be used solely as a store of value. On the other hand, a banknote or coin could very well be used in multiple payments over the course of a year. See the box “Use of cash and other payment methods in Norway” for more information on the use of cash.
The amount of cash in circulation shows seasonal variation, with increased demand from the public in connection with the summer holidays, Christmas and Easter. Following the outbreak of the pandemic in spring 2020, the amount of cash in circulation temporarily increased. The value of cash in circulation was somewhat lower in 2024 than in 2023 (Chart 15). At end-2024, the total amount of cash in general circulation was NOK 36.4 billion.13
Chart 15 Cash in circulation among the public
In billions of NOK. January 2019 – December 2024
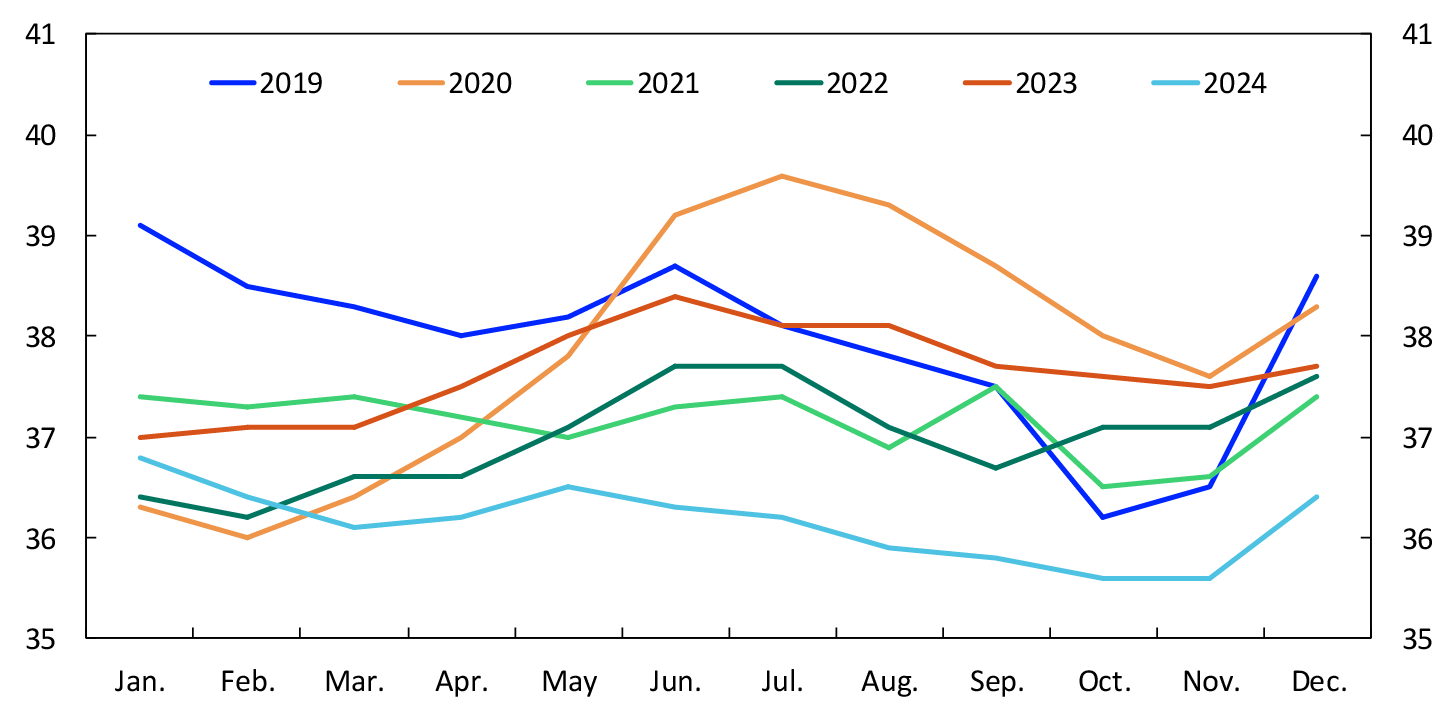
Source: Statistics Norway
Cash as a share of the narrow monetary aggregate M114 fell from 1.4 percent at end-2023 to 1.3 percent at end-2024 (Chart 16). Cash as a share of GDP for mainland Norway amounted to 0.9 percent in 2024.
Chart 16 Cash in circulation as a share of means of payment (M1) and mainland GDP
2001–2024
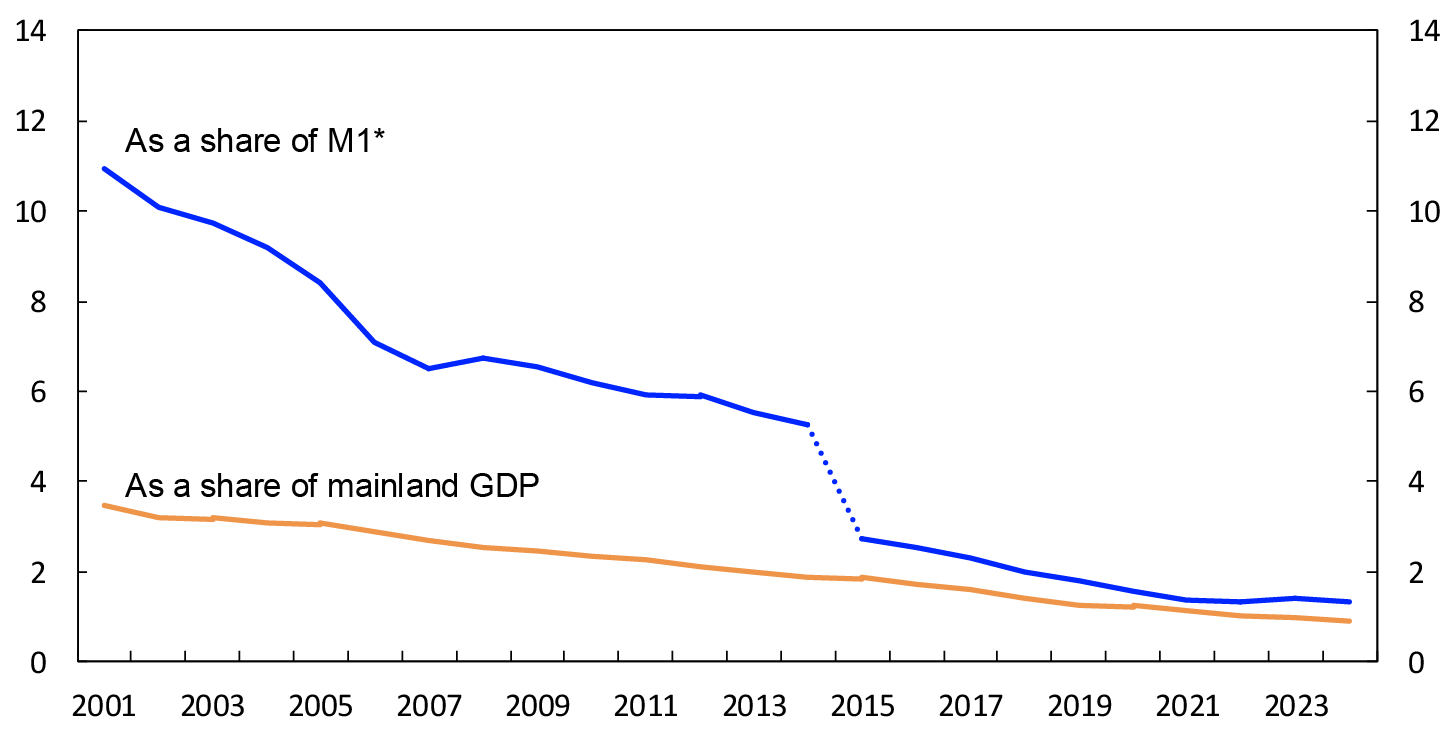
Sources: Statistics Norway and Norges Bank
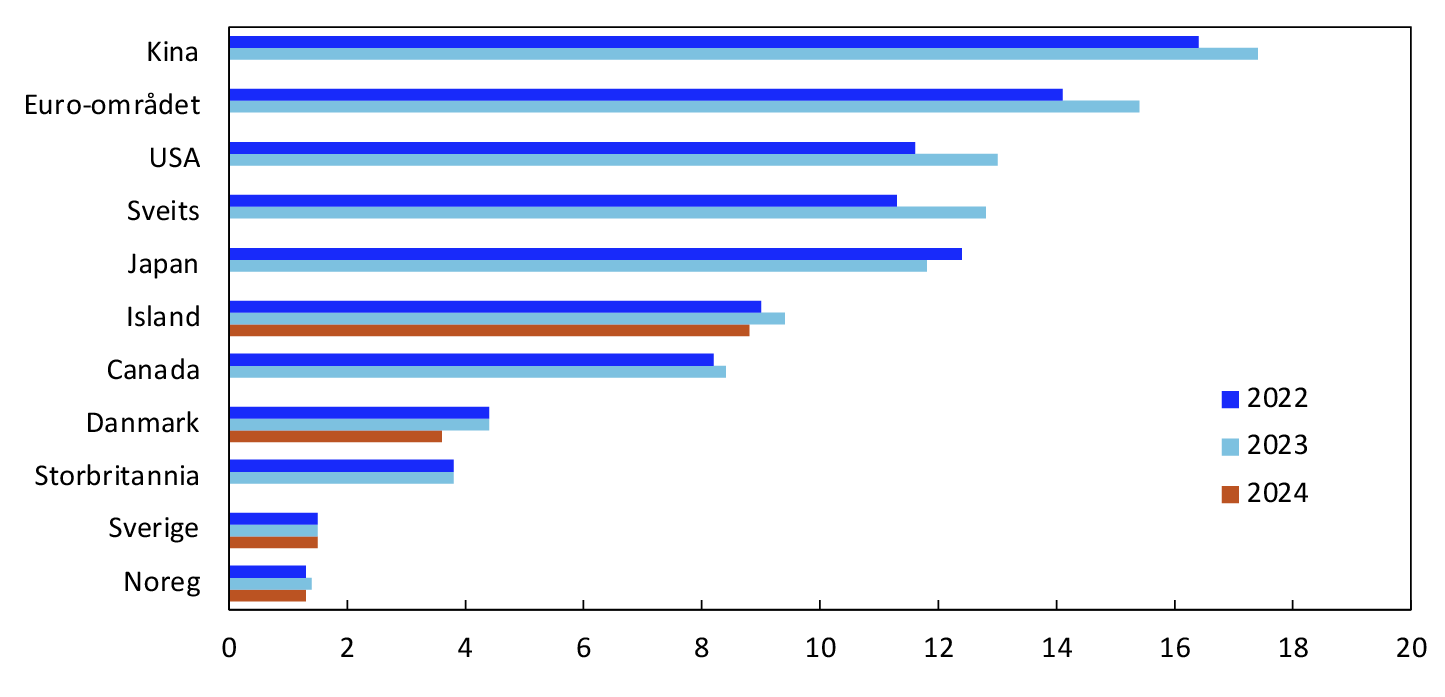
The figures for Norway are low by international standards (Chart 17). The share of cash payments is also very low in Sweden.
2022, 2023 and 2024 (Nordic countries)
Use of cash and other payment methods in Norway
Norges Bank conducts annual household surveys which, among other things, cover the use of cash.1 The surveys examine payment situations in which cash can actually be used. These are mainly person-to-person (P2P) payments and payments for the purchase of goods and services at a point of sale (POS). Points of sale include shops, restaurants, vending machines, hairdressing salons, public transport and so on. Survey participants are asked to provide information about their most recent payment. They are asked to specify if the payment was at a POS or P2P and the payment method used.
Main results from the surveys
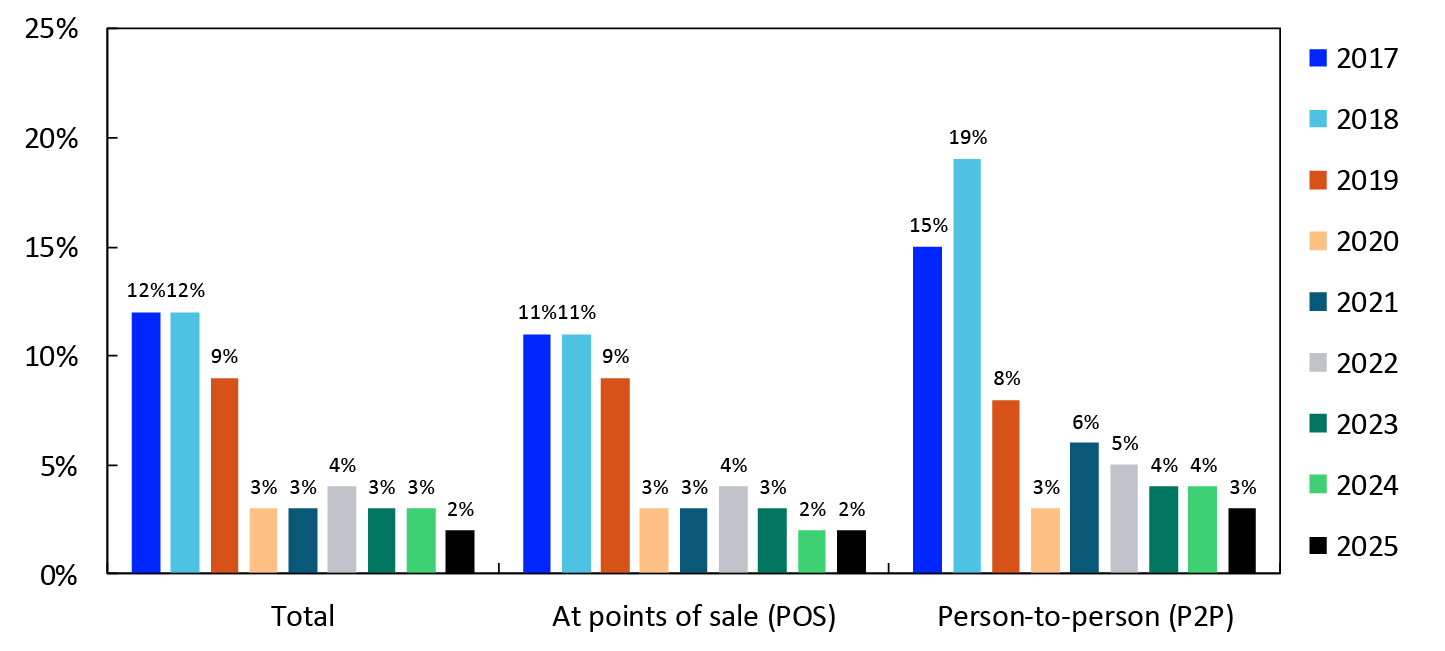
In the survey in spring 2025, cash accounted for 2 percent of total payments, 2 percent of POS payments and 3 percent of P2P payments (Chart 18). The cash share declined in connection with the pandemic and has since remained low. In 2019, the cash share was 8–9 percent.
2017–2025
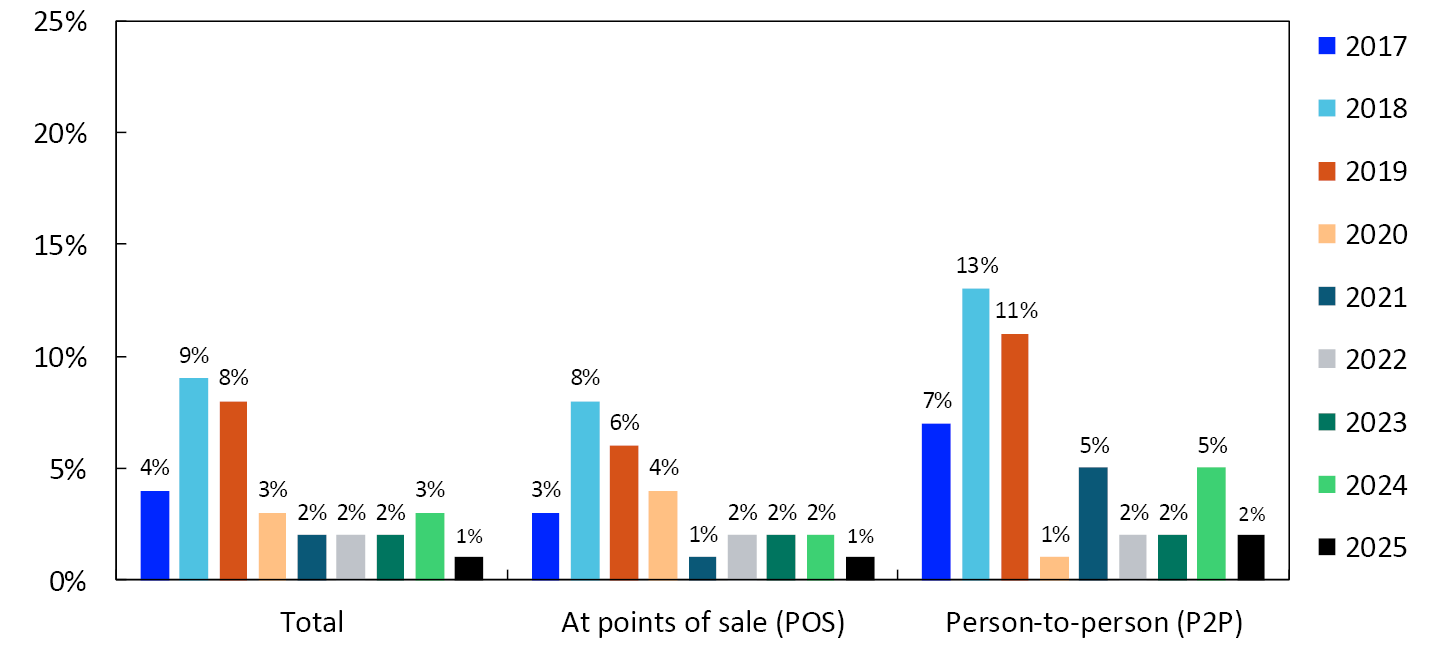
The value of cash payments as a share of the total value of payments varies more than the number of cash payments as a share of the total number of payments. In the 2025 survey, the value of cash payments accounted for 1 percent of the total value of payments (Chart 19). The value of cash payments accounted for 1 percent of the value of POS payments and 2 percent of the value of P2P payments. The value of cash payments has also fallen since the pandemic.
2017–2025
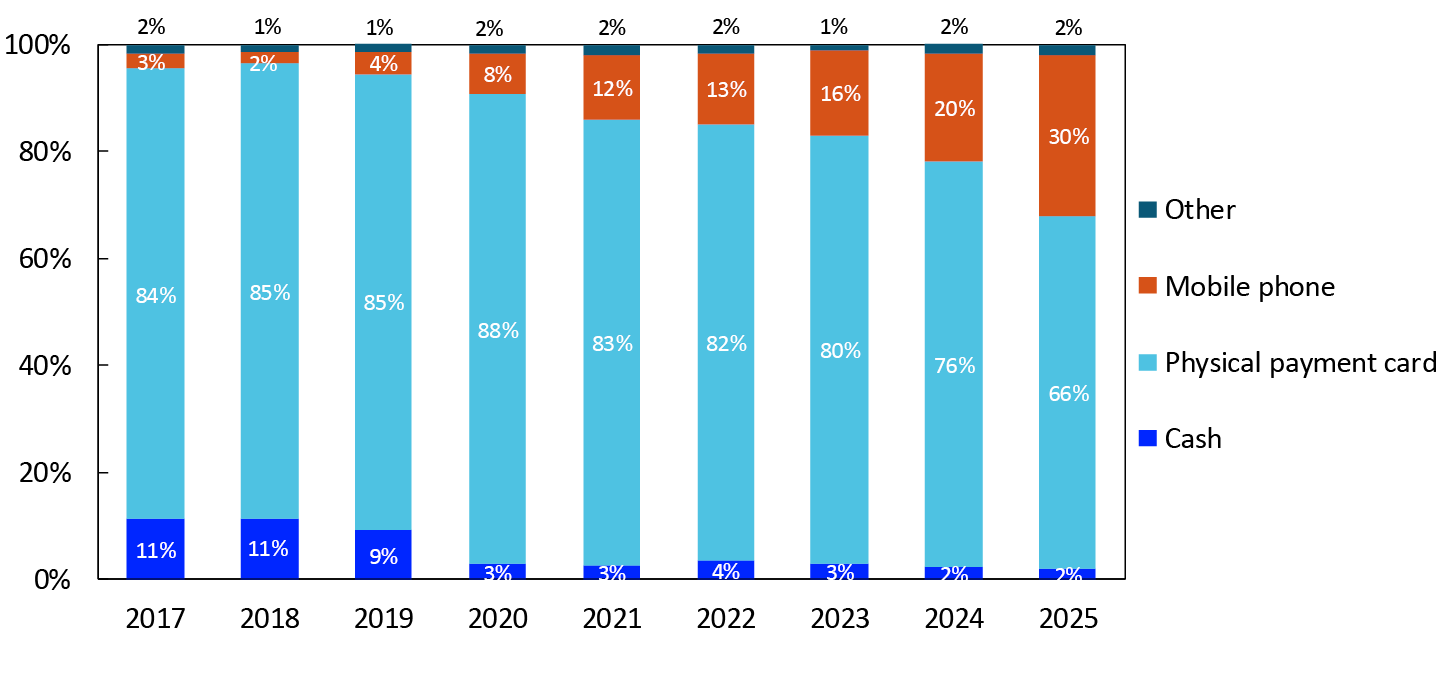
Other payment methods
POS payments can be made:
- in cash
- with physical payment cards
- using a mobile phone (such as Vipps, Apple Pay, Trumf Pay or Coopay)
- in some other way (such as invoicing)
Although their use has decreased slightly, payment cards are still the most used payment method by far at points of sale (Chart 20). Payment cards accounted for 66 percent of POS payments in the 2025 survey. Mobile phone payments continued to increase and accounted for 30 percent of payments.2
2017–2025
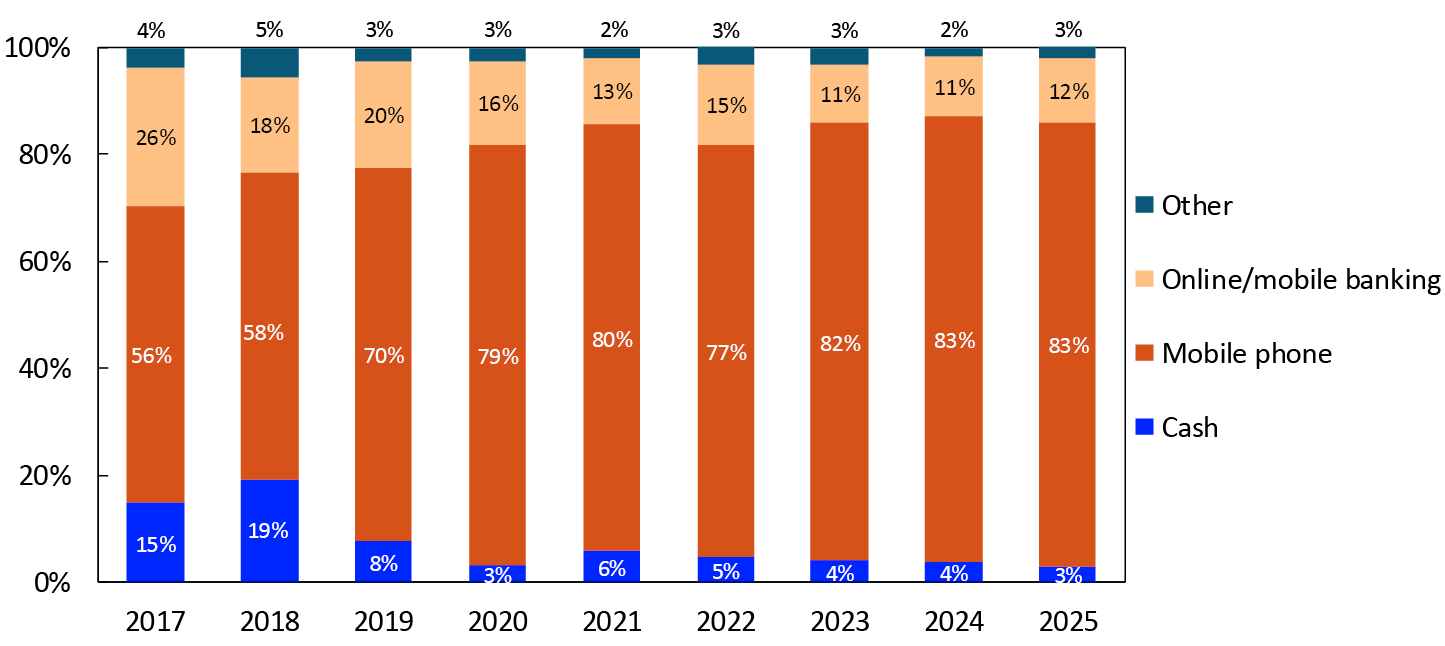
P2P payments can be made:
- in cash
- using a mobile phone (mainly Vipps)
- using online/mobile banking
- in some other way
Mobile phone payments accounted for 83 percent of P2P payments in the 2025 survey (Chart 21). Transfers using online and mobile banking platforms were the next most used payment method, accounting for 12 percent of P2P payments.
2017–2025
1 Data were collected by an external market research firm. In each survey, 2000 individuals were queried using both phone- and web-based interviews. The minimum age limit was 15 years for the phone-based interviews and 18 years for the web-based interviews. The survey sample is representative of the wider population, meaning that its composition is virtually identical to that of the population in terms of key variables such as sex, age and residence. Representativity allows survey results to be generalised to the whole population. At the same time, the limited sample size makes the results somewhat uncertain, particularly for subgroups.
2 In the survey, both terminal-based and web-based mobile payments at physical points of sale are included. In the regular payment statistics, web-based mobile payments at physical points of sale are included in the figures for online purchases.
13 In addition to cash held by the public, banks also hold cash. At end-2024, banks’ stock of cash was NOK 1.8 billion. This includes cash stored in banks’ ATMs, branches and depots. Banks’ cash holdings were NOK 0.2 billion lower at end-2024 than at end-2023
14 M1 is the narrow monetary aggregate. This is money that is available for immediate use, which means current accounts and cash in circulation. The definition of M1 was changed in 2015, leading to a break in the statistics.
5. Prices for payment services
Overview 2 provides information on prices for various banking and card services. The overview shows average prices and may conceal substantial differences between banks. For many of the services, only a few banks charge fees, while the majority of services offer no-fee services. Fees include annual fees for online banking, fees for payments at points of sale and fees for ATM cash withdrawals. Prices are generally lower for customers belonging to a bank’s loyalty scheme than for those not belonging to such a scheme.
Prices for paying bills vary widely among forms of payment. Prices for paper-based and manual payment services continue to rise, while prices for electronic account payments continue to fall. Prices for credit transfers made via cash payment over the counter are now NOK 131, while Avtalegiro direct debits cost NOK 0.60 for non-loyalty scheme customers and no charge for loyalty scheme customers.
At the beginning of 2025, the average annual fee for a debit card with BankAxept and an international card system (Visa or Mastercard) was NOK 232 for loyalty scheme customers and NOK 294 for other customers. The average price of purchase with BankAxept was NOK 0.50 for non-loyalty scheme customers, with no charge for loyalty scheme customers
In February 2024, the rules for ATM fees were changed. This was discussed in last year’s report. The data for the prices of ATM withdrawals using debit cards are insufficient. ATM cash withdrawals using international credit cards cost NOK 37.90. There is also a fee of just over 1 percent of the withdrawn amount.
Overview 2 Prices for domestic payment services, retail customers. Weighted average price in NOK. At 1 January each year
|
Customers who do not belong to loyalty schemes |
Customers who belong to loyalty schemes |
|||||
|---|---|---|---|---|---|---|
|
2023 |
2024 |
2025 |
2023 |
2024 |
2025 |
|
|
Payments |
||||||
|
Online banking (with CID), per payment |
0.70 |
0.60 |
0.50 |
0.20 |
0.00 |
0.00 |
|
Online banking – annual fee |
13.10 |
12.70 |
8.20 |
1.10 |
1.10 |
1.20 |
|
Direct debit (Avtalegiro), per payment |
0.80 |
0.60 |
0.60 |
0.30 |
0.10 |
0.00 |
|
Mobile banking (with CID), per payment |
0.70 |
0.60 |
0.50 |
0.20 |
0.00 |
0.00 |
|
Mobile banking – info by SMS |
2.00 |
2.10 |
2.20 |
1.80 |
1.60 |
2.10 |
|
Credit transfer via postal giro, per payment |
13.10 |
13.20 |
13.40 |
13.10 |
13.10 |
13.30 |
|
Giro over the counter – account debit, per payment |
102.50 |
103.20 |
131.00 |
102.50 |
103.20 |
131.00 |
|
Giro over the counter – cash payment, per payment |
115.20 |
116.80 |
118.00 |
115.20 |
116.80 |
118.00 |
|
BankAxept cards at payment terminals (EFTPOS), per payment |
0.80 |
0.50 |
0.50 |
0.00 |
0.00 |
0.00 |
|
Credit card from international credit card company, annual fee |
28.20 |
18.20 |
22.20 |
31.90 |
4.00 |
3.10 |
|
BankAxept cards (combined with debet card from int. card comp.), annual fee |
295.70 |
296.90 |
294.40 |
227.90 |
236.30 |
231.60 |
|
Cash withdrawals in-store |
7.20 |
8.80 |
9.00 |
6.90 |
7.10 |
6.20 |
|
ATM withdrawals, debit cards |
||||||
|
Own bank’s ATMs during opening hours, per withdrawal |
7.90 |
8.70 |
- |
6.00 |
4.30 |
- |
|
Other bank’s ATMs during opening hours, per withdrawal |
8.70 |
9.50 |
- |
7.30 |
5.50 |
- |
|
ATM withdrawals, international credit cards |
||||||
|
Price per withdrawal |
34.40 |
38.10 |
37.90 |
36.40 |
38.50 |
37.90 |
|
Fee as a percentage of withdrawal amount |
1.2 |
1.3 |
1.3 |
1.2 |
1.2 |
1.2 |
Sources: Finansportalen and Norges Bank
Overview 3 shows a comparison of prices for remittances to other countries. Finansportalen has price data for remittance transactions to 32 countries and regions.15 Banks, non-bank financial institutions (NBFIs) and payment institutions provide remittance services to these countries. Prices for remittances are determined by various factors. A remittance transaction in person is much more expensive than an online payment order. As a percentage of the transfer amount, the price falls as the amount rises. This pertains especially to banks, but also when the payment passes through an NBFI or payment institution. The fee comprises the exchange rate cost and other fees, where “other fees” comprise both a fixed portion and a portion that depends on the amount transferred. Transfer prices have changed little over the past year.
Overview 3 Prices for remittances to selected countries and regions. Banks and other providers. In percent of amount transferred. At 1 January 2024 and 2025
|
Transaction in person |
Online payment order |
|||||||
|---|---|---|---|---|---|---|---|---|
|
NOK 1 000 |
NOK 5000 |
NOK 1000 |
NOK 5000 |
|||||
|
2024 |
2025 |
2024 |
2025 |
2024 |
2025 |
2024 |
2025 |
|
|
Banks |
29.2 |
29.7 |
6.2 |
6.7 |
5.6 |
5.9 |
1.5 |
1.9 |
|
Exchange rate cost |
0.4 |
1.0 |
0.4 |
1.0 |
0.5 |
0.9 |
0.5 |
0.9 |
|
Other fees |
28.8 |
28.8 |
5.8 |
5.8 |
5.1 |
5.0 |
1.0 |
1.0 |
|
Non-bank financial institutions and payment institutions |
- |
- |
- |
- |
4.6 |
4.6 |
3.4 |
3.0 |
|
Exchange rate cost |
- |
- |
- |
- |
2.6 |
2.0 |
2.6 |
2.0 |
|
Other fees |
- |
- |
- |
- |
2.0 |
2.6 |
0.8 |
1.0 |
|
All providers |
29.2 |
29.7 |
6.2 |
6.7 |
5.1 |
5.4 |
2.5 |
2.3 |
|
Exchange rate cost |
0.4 |
1.0 |
0.4 |
1.0 |
1.6 |
1.3 |
1.6 |
1.3 |
|
Other fees |
28.8 |
28.8 |
5.8 |
5.8 |
3.5 |
4.1 |
0.9 |
1.0 |
Sources: Finansportalen and Norges Bank
15 Afghanistan, Bosnia-Herzegovina, Brazil, Bulgaria, Chile, China, Colombia, Eritrea, Ethiopia, EU/EEA, Gambia, Ghana, Hungary, India, Iraq, Kosovo, Latvia, Lithuania, Morocco, Nigeria, North Macedonia, Pakistan, Palestine, Philippines, Poland, Romania, Serbia, Somalia, Sri Lanka, Thailand, Turkey and Vietnam
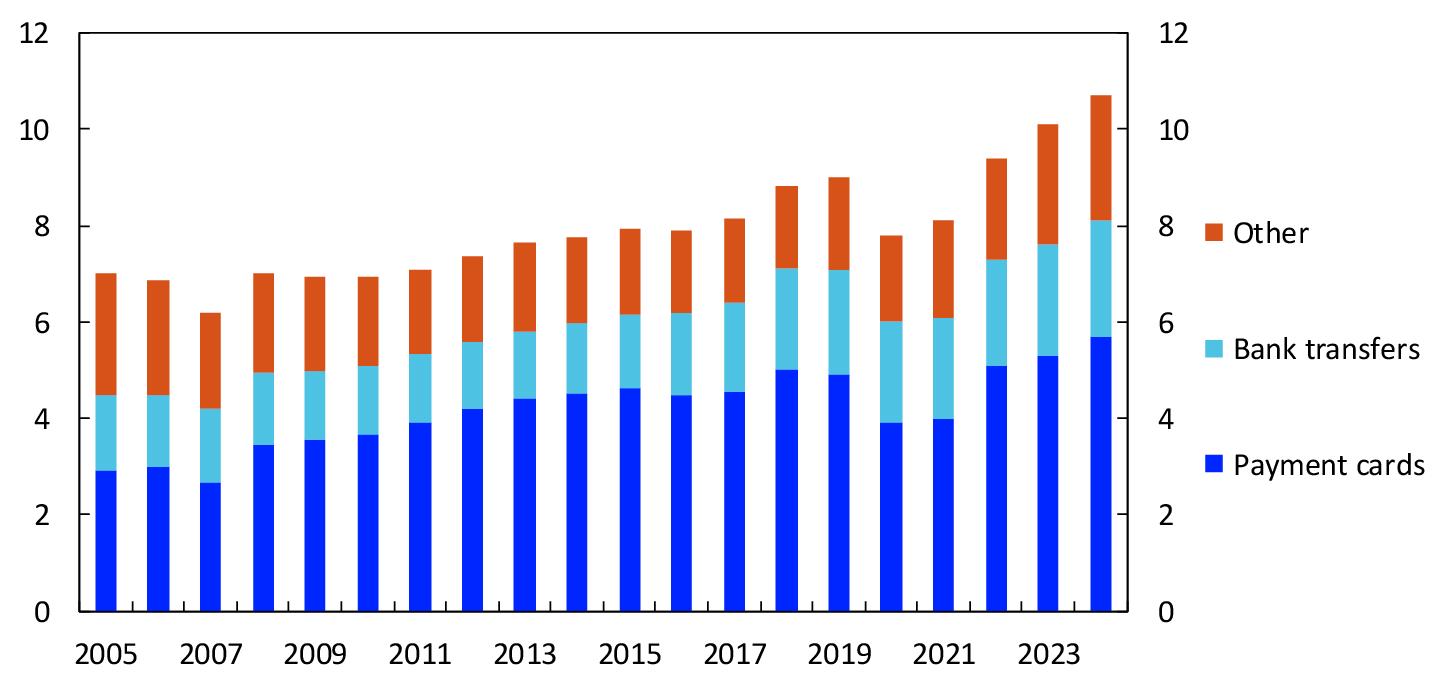
6. Banks’ income from payment services
Banks’ income from payment services came to NOK 10.7 billion in 2024 (Chart 22), with an increase of 5.9 percent from 2023 to 2024. Income from all main groups increased over the past year. Income from card business accounts for just over half of total income from payment services
In billions of NOK. 2005–2024
Tables
General data
Table 1 General statistical data for Norway
|
2014 |
2015 |
2016 |
2017 |
2018 |
2019 |
2020 |
2021 |
2022 |
2023 |
2024 |
|
|---|---|---|---|---|---|---|---|---|---|---|---|
|
Population (as at 1 Jan., in millions) |
5.11 |
5.17 |
5.21 |
5.26 |
5.30 |
5.33 |
5.37 |
5.39 |
5.43 |
5.49 |
5.55 |
|
Mainland GDP, market value (in billions of NOK) |
2 534 |
2 614 |
2 692 |
2 798 |
2 931 |
3 067 |
3 067 |
3 315 |
3 679 |
3 879 |
4 050 |
|
EUR 1 in NOK (annual average) |
8.35 |
8.95 |
9.29 |
9.33 |
9.60 |
9.85 |
10.72 |
10.16 |
10.10 |
11.42 |
11.63 |
Means of payment in Norway
Table 2 Means of payment used by the public (at year-end, in millions of NOK)
|
2014 |
2015 |
2016 |
2017 |
2018 |
2019 |
2020 |
2021 |
2022 |
2023 |
2024 |
|
|---|---|---|---|---|---|---|---|---|---|---|---|
|
Narrow money supply (M1) |
910 322 |
1 766 857 |
1 842 654 |
1 944 684 |
2 096 769 |
2 161 960 |
2 464 909 |
2 723 568 |
2 811 071 |
2 673 639 |
2 752 218 |
|
Banknotes and coins |
47 880 |
48 508 |
46 665 |
44 906 |
41 739 |
38 648 |
38 292 |
37 427 |
37 573 |
37 741 |
36 350 |
|
Deposits in current accounts |
862 442 |
1 718 349 |
1 795 989 |
1 899 778 |
2 055 030 |
2 123 312 |
2 426 617 |
2 686 141 |
2 772 498 |
2 635 898 |
2 715 868 |
Table 3 Banknotes and coins in circulation. Annual average (in millions of NOK)
|
2014 |
2015 |
2016 |
2017 |
2018 |
2019 |
2020 |
2021 |
2022 |
2023 |
2024 |
|
|---|---|---|---|---|---|---|---|---|---|---|---|
|
Total |
49 352 |
50 068 |
49 241 |
46 963 |
43 828 |
40 986 |
40 562 |
39 336 |
39 363 |
39 751 |
38 526 |
|
Total banknotes |
44 995 |
45 605 |
44 726 |
42 427 |
39 354 |
36 577 |
36 227 |
35 018 |
35 085 |
35 527 |
34 335 |
|
1000-krone |
18 712 |
17 947 |
17 029 |
15 627 |
14 013 |
12 238 |
9 552 |
7 194 |
7 269 |
7 607 |
7 457 |
|
500-krone |
17 101 |
18 355 |
18 445 |
17 689 |
16 567 |
15 129 |
17 383 |
18 871 |
18 960 |
19 304 |
18 569 |
|
200-krone |
6 033 |
6 056 |
5 963 |
5 830 |
5 612 |
6 010 |
6 154 |
5 870 |
5 707 |
5 547 |
5 287 |
|
100-krone |
2 096 |
2 154 |
2 172 |
2 161 |
2 067 |
2 145 |
2 113 |
2 062 |
2 108 |
2 018 |
1 973 |
|
50-krone |
1 054 |
1 093 |
1 116 |
1 119 |
1 095 |
1 056 |
1 024 |
1 022 |
1 041 |
1 051 |
1 048 |
|
Total coins |
4 357 |
4 463 |
4 515 |
4 536 |
4 474 |
4 409 |
4 336 |
4 318 |
4 278 |
4 224 |
4 191 |
|
20-krone |
1 715 |
1 760 |
1 775 |
1 775 |
1 746 |
1 717 |
1 688 |
1 684 |
1 664 |
1 636 |
1 621 |
|
10-krone |
1 174 |
1 194 |
1 201 |
1 205 |
1 180 |
1 157 |
1 130 |
1 122 |
1 109 |
1 095 |
1 083 |
|
5-krone |
515 |
529 |
539 |
542 |
534 |
525 |
515 |
513 |
510 |
503 |
499 |
|
1-krone |
799 |
826 |
847 |
861 |
862 |
858 |
850 |
848 |
845 |
839 |
836 |
|
0.5 krone |
155 |
154 |
154 |
153 |
153 |
152 |
152 |
152 |
152 |
152 |
152 |
Payment infrastructure
Table 4 Institutional infrastructure
|
2014 |
2015 |
2016 |
2017 |
2018 |
2019 |
2020 |
2021 |
2022 |
2023 |
2024 |
|
|---|---|---|---|---|---|---|---|---|---|---|---|
|
Number of banks |
137 |
134 |
137 |
136 |
141 |
136 |
134 |
134 |
128 |
123 |
115 |
|
Savings banks |
106 |
104 |
104 |
99 |
98 |
95 |
93 |
91 |
87 |
85 |
79 |
|
Commercial banks |
19 |
20 |
23 |
25 |
29 |
27 |
25 |
25 |
23 |
21 |
20 |
|
Number of foreign bank branches in Norway |
12 |
10 |
10 |
12 |
14 |
14 |
16 |
18 |
18 |
17 |
16 |
|
Electronic money institutions |
3 |
4 |
6 |
6 |
6 |
7 |
6 |
6 |
6 |
7 |
9 |
Table 5 Number of agreements
|
2014 |
2015 |
2016 |
2017 |
2018 |
2019 |
2020 |
2021 |
2022 |
2023 |
2024 |
|
|---|---|---|---|---|---|---|---|---|---|---|---|
|
Online and mobile banking agreements |
7 259 134 |
7 889 444 |
8 427 064 |
8 780 020 |
8 677 815 |
8 619 107 |
8 720 172 |
10 109 706 |
10 493 330 |
10 644 827 |
10 571 008 |
|
Retail customers |
6 768 015 |
7 271 093 |
7 786 587 |
8 111 439 |
7 901 252 |
7 617 363 |
7 383 359 |
8 462 163 |
8 616 457 |
8 552 923 |
8 472 221 |
|
Corporate customers |
491 119 |
618 351 |
640 477 |
668 581 |
776 563 |
1 001 744 |
1 336 813 |
1 647 543 |
1 876 873 |
2 091 904 |
2 098 787 |
|
Agreements to offer electronic invoicing (eFaktura) to retail customers |
1 378 |
1 490 |
1 611 |
1 577 |
8 108 |
13 462 |
24 161 |
28 505 |
33 903 |
43 882 |
49 641 |
|
Agreements on receipt of electronic invoicing (eFaktura) – retail customers |
15 304 127 |
14 547 500 |
17 447 887 |
19 581 987 |
23 489 647 |
34 467 240 |
37 440 453 |
38 875 210 |
39 088 984 |
39 139 286 |
39 139 790 |
|
Agreements on receipt of electronic invoicing – EHF-format |
31 064 |
48 927 |
65 218 |
96 158 |
129 525 |
154 589 |
181 734 |
218 136 |
255 080 |
287 988 |
317 336 |
|
Company terminal giro agreements |
16 534 |
18 362 |
22 193 |
27 822 |
33 530 |
33 962 |
25 631 |
14 669 |
12 886 |
12 023 |
9 991 |
|
Postal giro agreements |
596 126 |
508 134 |
461 177 |
343 855 |
302 542 |
276 856 |
256 381 |
228 821 |
202 595 |
186 780 |
167 706 |
|
Direct debit agreements (Avtalegiro and Autogiro) |
17 218 355 |
18 496 228 |
19 964 802 |
19 514 813 |
19 988 423 |
20 511 972 |
20 770 830 |
21 258 883 |
24 770 703 |
28 918 082 |
32 713 659 |
|
Avtalegiro – payees |
15 520 |
15 940 |
16 215 |
17 627 |
18 408 |
19 723 |
20 474 |
21 313 |
22 049 |
23 066 |
25 083 |
|
Autogiro – payees |
618 |
587 |
627 |
705 |
705 |
691 |
670 |
666 |
627 |
594 |
564 |
Table 6 Number of cards issued (in thousands) and number of functions in cards issued (in thousands)
|
2014 |
2015 |
2016 |
2017 |
2018 |
2019 |
2020 |
2021 |
2022 |
2023 |
2024 |
|
|---|---|---|---|---|---|---|---|---|---|---|---|
|
Number of cards issued (as at 31 Dec.) |
13 698 |
14 704 |
14 841 |
15 755 |
13 274 |
13 677 |
12 905 |
12 864 |
12 780 |
12 616 |
12 647 |
|
Contactless cards (NFC) |
- |
- |
- |
774 |
8 617 |
10 094 |
11 140 |
12 465 |
12 485 |
12 396 |
12 454 |
|
Chip cards |
12 764 |
13 859 |
14 390 |
14 803 |
4 570 |
3 561 |
1 697 |
375 |
245 |
152 |
112 |
|
Magnetic stripe cards |
928 |
839 |
445 |
166 |
73 |
2 |
2 |
1 |
2 |
0 |
1 |
|
Virtual cards |
6 |
6 |
6 |
13 |
14 |
20 |
23 |
23 |
48 |
68 |
80 |
|
Number of functions in cards issued |
21 988 |
23 464 |
23 791 |
25 381 |
20 988 |
21 487 |
20 189 |
20 167 |
20 156 |
20 257 |
20 386 |
|
Debit functions |
15 650 |
16 552 |
16 777 |
18 065 |
14 161 |
14 730 |
14 495 |
14 665 |
14 830 |
15 343 |
15 535 |
|
Bank cards/BankAxept |
7 931 |
8 377 |
8 487 |
9 124 |
7 229 |
7 419 |
7 294 |
7 370 |
7 456 |
7 708 |
7 802 |
|
Payment cards issued by international card companies |
7 719 |
8 175 |
8 290 |
8 941 |
6 932 |
7 311 |
7 201 |
7 295 |
7 374 |
7 635 |
7 732 |
|
Billing functions (payment cards issued by international card companies) |
557 |
450 |
431 |
357 |
394 |
328 |
340 |
367 |
364 |
199 |
201 |
|
Credit functions |
5 504 |
6 185 |
6 456 |
6 864 |
6 326 |
6 344 |
5 296 |
5 061 |
4 865 |
4 680 |
4 618 |
|
Domestic credit cards |
635 |
609 |
698 |
732 |
851 |
529 |
74 |
9 |
2 |
- |
- |
|
Payment cards issued by international card companies |
4 869 |
5 577 |
5 759 |
6 132 |
5 455 |
5 797 |
5 211 |
5 052 |
4 863 |
4 673 |
4 611 |
|
E-money |
277 |
278 |
127 |
94 |
107 |
85 |
59 |
74 |
96 |
35 |
33 |
Table 7 Cash infrastructure
|
2014 |
2015 |
2016 |
2017 |
2018 |
2019 |
2020 |
2021 |
2022 |
2023 |
2024 |
|
|---|---|---|---|---|---|---|---|---|---|---|---|
|
Bank branches with over-the-counter cash services |
- |
- |
- |
- |
- |
- |
137 |
87 |
74 |
74 |
39 |
|
Points of sale with in-store cash services |
- |
- |
- |
- |
- |
- |
1 422 |
1 462 |
1 456 |
1 459 |
1 466 |
|
ATMs |
2 033 |
1 950 |
1 679 |
1 596 |
1 550 |
1 456 |
1 447 |
1 217 |
1 231 |
1 168 |
1 129 |
|
Cash deposit machines |
- |
- |
- |
- |
- |
- |
573 |
473 |
451 |
430 |
396 |
Retail payment services
Table 8 Use of payment instruments (in millions of payments)
|
2014 |
2015 |
2016 |
2017 |
2018 |
2019 |
2020 |
2021 |
2022 |
2023 |
2024 |
|
|---|---|---|---|---|---|---|---|---|---|---|---|
|
Total |
2 443.2 |
2 602.0 |
2 791.6 |
3 037.3 |
3 226.0 |
3 446.1 |
3 308.5 |
3 455.9 |
3 795.5 |
3 957.9 |
4 157.4 |
|
Bank transfers |
625.8 |
650.3 |
670.4 |
728.1 |
797.0 |
891.7 |
885.4 |
901.1 |
930.8 |
963.5 |
1 001.9 |
|
Electronic |
608.8 |
635.3 |
658.0 |
718.5 |
789.3 |
885.2 |
880.6 |
897.3 |
927.7 |
961.4 |
999.9 |
|
Paper-based |
17.0 |
15.0 |
12.4 |
9.6 |
7.7 |
6.5 |
4.7 |
3.8 |
3.1 |
2.1 |
2.0 |
|
Payment cards (payments) |
1 817.3 |
1 951.6 |
2 121.2 |
2 309.1 |
2 429.0 |
2 554.4 |
2 423.2 |
2 554.8 |
2 864.7 |
2 994.3 |
3 155.5 |
|
Electronic |
1 815.3 |
1 949.2 |
2 120.6 |
2 308.6 |
2 428.5 |
2 553.8 |
2 422.9 |
2 554.6 |
2 864.3 |
2 994.1 |
3 155.3 |
|
Manual |
2.1 |
2.5 |
0.6 |
0.5 |
0.6 |
0.6 |
0.2 |
0.2 |
0.4 |
0.3 |
0.2 |
|
Cheques |
0.1 |
0.1 |
0.1 |
0.0 |
0.0 |
0.0 |
0.0 |
0.0 |
0.0 |
0.0 |
0.0 |
Table 9 Bank transfers (in millions of transactions)
|
2014 |
2015 |
2016 |
2017 |
2018 |
2019 |
2020 |
2021 |
2022 |
2023 |
2024 |
|
|---|---|---|---|---|---|---|---|---|---|---|---|
|
Total |
625.8 |
650.3 |
683.2 |
728.1 |
797.0 |
891.7 |
885.4 |
901.1 |
930.8 |
963.5 |
1 001.9 |
|
Credit transfers |
530.8 |
548.1 |
574.1 |
613.7 |
678.1 |
772.9 |
767.6 |
779.1 |
815.4 |
848.3 |
885.9 |
|
Electronic |
516.0 |
535.4 |
550.6 |
605.2 |
671.2 |
767.1 |
763.1 |
775.3 |
812.3 |
846.3 |
885.4 |
|
Company terminal giro |
15.7 |
15.1 |
16.7 |
18.8 |
21.2 |
23.8 |
22.7 |
16.8 |
12.0 |
13.4 |
10.0 |
|
Telegiros |
6.6 |
5.7 |
5.0 |
4.4 |
3.6 |
3.0 |
1.7 |
2.5 |
2.2 |
2.3 |
3.6 |
|
Online and mobile banking |
448.1 |
467.1 |
481.8 |
502.6 |
525.3 |
537.8 |
502.8 |
493.2 |
508.1 |
545.3 |
553.5 |
|
Retail customers |
262.4 |
274.9 |
283.4 |
291.5 |
286.3 |
267.9 |
238.4 |
253.8 |
252.1 |
269.7 |
279.0 |
|
Corporate customers |
185.7 |
192.3 |
198.4 |
211.1 |
238.9 |
269.9 |
264.4 |
239.4 |
256.1 |
275.6 |
274.5 |
|
Instant payments |
- |
- |
- |
0.9 |
58.1 |
122.3 |
153.6 |
186.2 |
213.2 |
210.2 |
204.8 |
|
Miscellaneous other electronic credit transfers |
45.7 |
47.4 |
59.9 |
78.4 |
63.1 |
80.1 |
82.3 |
76.7 |
76.8 |
75.1 |
110.9 |
|
Paper-based |
14.8 |
12.7 |
10.7 |
8.5 |
6.9 |
5.8 |
4.4 |
3.8 |
3.1 |
2.1 |
2.0 |
|
Company terminal giros and online banking as money order |
0.5 |
0.4 |
0.4 |
0.3 |
0.3 |
0.2 |
0.1 |
0.0 |
0.0 |
0.0 |
0.0 |
|
Postal giros |
12.2 |
10.5 |
8.9 |
7.1 |
5.8 |
4.8 |
3.7 |
3.0 |
2.3 |
1.3 |
1.3 |
|
Giros delivered at the counter – account debits |
2.1 |
1.7 |
1.4 |
1.1 |
0.9 |
0.8 |
0.6 |
0.7 |
0.8 |
0.7 |
0.7 |
|
Direct debits (Avtalegiro and Autogiro) |
92.8 |
99.9 |
107.4 |
113.3 |
118.0 |
118.1 |
117.5 |
121.9 |
115.4 |
115.2 |
116.0 |
|
Giros delivered at the counter – cash payments |
2.2 |
2.3 |
1.7 |
1.1 |
0.8 |
0.7 |
0.3 |
0.0 |
0.0 |
0.0 |
0.0 |
Table 10a Payment cards. Use of cards (in millions of transactions)
|
2014 |
2015 |
2016 |
2017 |
2018 |
2019 |
2020 |
2021 |
2022 |
2023 |
2024 |
|
|---|---|---|---|---|---|---|---|---|---|---|---|
|
Total use of Norwegian cards (in Norway and abroad) |
1 892.8 |
2 020.7 |
2 182.1 |
2 362.2 |
2 475.9 |
2 594.9 |
2 444.4 |
2 575.4 |
2 890.3 |
3 018.6 |
3 176.6 |
|
Use of Norwegian cards in Norway |
1 673.1 |
1 786.6 |
1 923.4 |
2 067.3 |
2 155.3 |
2 253.4 |
2 189.5 |
2 289.0 |
2 480.3 |
2 578.1 |
2 682.7 |
|
Payments |
1 613.6 |
1 732.1 |
1 875.8 |
2 027.3 |
2 121.1 |
2 224.1 |
2 170.3 |
2 272.0 |
2 461.7 |
2 560.6 |
2 668.0 |
|
Payments at EFTPOS terminals |
1 570.1 |
1 680.0 |
1 800.4 |
1 869.3 |
1 916.8 |
1 975.3 |
1 879.7 |
1 909.0 |
2 018.2 |
2 052.6 |
2 072.1 |
|
Of which: contactless payments |
- |
- |
- |
15.7 |
82.3 |
302.1 |
1 226.3 |
1 556.9 |
1 755.8 |
1 857.4 |
1 927.7 |
|
- with physical cards |
- |
- |
- |
- |
- |
- |
1 213.0 |
1 509.3 |
1 649.3 |
1 692.9 |
1 677.3 |
|
- other contactless payments |
- |
- |
- |
- |
- |
- |
13.3 |
47.5 |
106.5 |
164.5 |
250.4 |
|
Payments without cash-back |
1 523.9 |
1 638.5 |
1 764.2 |
1 838.2 |
1 891.4 |
1 953.9 |
1 867.1 |
1 899.2 |
2 008.6 |
2 043.8 |
2 062.9 |
|
Payments with cash-back |
46.2 |
41.4 |
36.2 |
31.0 |
25.3 |
21.3 |
12.6 |
9.8 |
9.6 |
8.8 |
9.1 |
|
Internet payments |
41.0 |
49.3 |
73.7 |
99.8 |
155.7 |
219.6 |
268.1 |
334.0 |
400.1 |
460.5 |
536.7 |
|
Other electronic payments and manual payments |
2.6 |
2.8 |
1.8 |
58.2 |
48.6 |
29.2 |
22.5 |
29.0 |
43.4 |
47.5 |
59.2 |
|
Cash withdrawals |
59.5 |
54.5 |
47.6 |
40.0 |
34.2 |
29.3 |
19.2 |
17.0 |
18.6 |
17.5 |
14.7 |
|
Use of Norwegian cards abroad |
219.7 |
234.1 |
258.7 |
294.9 |
320.5 |
341.5 |
254.9 |
286.4 |
410.0 |
440.5 |
493.9 |
|
Payments |
203.7 |
219.5 |
245.4 |
281.8 |
307.9 |
330.3 |
251.1 |
282.8 |
403.0 |
433.8 |
487.5 |
|
Payments at EFTPOS terminals |
128.7 |
138.1 |
141.7 |
147.2 |
158.1 |
171.5 |
61.0 |
71.7 |
168.9 |
170.2 |
181.5 |
|
Of which: contactless payments |
- |
- |
- |
7.1 |
20.5 |
41.8 |
23.8 |
40.8 |
124.2 |
138.8 |
155.1 |
|
- with physical cards |
- |
- |
- |
- |
- |
- |
23.5 |
37.5 |
112.5 |
119.8 |
126.8 |
|
- other contactless payments |
- |
- |
- |
- |
- |
- |
0.3 |
3.3 |
11.7 |
19.0 |
28.3 |
|
Payments without cash-back |
128.7 |
138.1 |
141.6 |
147.2 |
158.1 |
171.5 |
61.0 |
71.7 |
168.8 |
170.1 |
181.5 |
|
Payments with cash-back |
0.0 |
0.0 |
0.1 |
0.0 |
0.0 |
0.0 |
0.0 |
0.0 |
0.0 |
0.0 |
0.0 |
|
Internet payments |
74.3 |
80.7 |
103.5 |
134.6 |
149.7 |
158.7 |
190.1 |
211.1 |
234.1 |
263.6 |
306.0 |
|
Other electronic payments and manual payments |
0.7 |
0.8 |
0.1 |
0.1 |
0.1 |
0.1 |
0.0 |
0.0 |
0.1 |
0.1 |
0.0 |
|
Cash withdrawals |
16.0 |
14.6 |
13.3 |
13.1 |
12.6 |
11.3 |
3.8 |
3.6 |
7.0 |
6.7 |
6.3 |
|
Use of Norwegian cards by function |
1 892.8 |
2 020.7 |
2 182.1 |
2 362.1 |
2 475.9 |
2 594.9 |
2 444.3 |
2 575.4 |
2 890.2 |
3 018.6 |
3 176.6 |
|
Debit functions |
1 709.9 |
1 820.2 |
1 959.4 |
2 099.6 |
2 190.8 |
2 268.8 |
2 165.1 |
2 300.0 |
2 554.2 |
2 643.8 |
2 746.1 |
|
BankAxept |
1 452.7 |
1 526.4 |
1 594.8 |
1 638.5 |
1 667.5 |
1 682.7 |
1 609.8 |
1 620.0 |
1 647.4 |
1 612.0 |
1 542.4 |
|
Payment cards issued by international card companies |
257.2 |
293.8 |
364.6 |
461.1 |
523.3 |
586.1 |
555.3 |
680.0 |
906.7 |
1 031.8 |
1 203.7 |
|
Billing functions (payment cards issued by international card companies) |
21.6 |
20.2 |
20.3 |
20.9 |
20.4 |
17.1 |
11.5 |
11.8 |
10.9 |
10.3 |
10.7 |
|
Credit functions |
160.0 |
179.2 |
201.8 |
241.2 |
264.3 |
308.7 |
267.4 |
263.3 |
323.9 |
362.2 |
417.4 |
|
Domestic credit cards |
5.9 |
5.6 |
5.7 |
5.5 |
5.5 |
4.9 |
2.0 |
0.2 |
0.0 |
- |
- |
|
Payment cards issued by international card companies |
154.1 |
173.6 |
196.1 |
235.7 |
258.8 |
303.9 |
265.4 |
263.1 |
323.9 |
362.2 |
417.4 |
|
E-money |
1.3 |
1.1 |
0.6 |
0.4 |
0.4 |
0.3 |
0.3 |
0.3 |
1.3 |
2.3 |
2.3 |
|
Use of foreign cards in Norway |
36.6 |
40.2 |
48.3 |
54.7 |
67.2 |
71.7 |
33.0 |
34.3 |
77.8 |
91.9 |
89.7 |
|
Payments |
34.7 |
38.5 |
46.7 |
53.2 |
65.8 |
70.5 |
32.4 |
33.9 |
77.1 |
91.3 |
89.2 |
|
Cash withdrawals |
1.9 |
1.6 |
1.7 |
1.5 |
1.3 |
1.2 |
0.6 |
0.4 |
0.7 |
0.7 |
0.5 |
Table 10b Payment cards. Use of terminals (in millions of transactions)
|
2014 |
2015 |
2016 |
2017 |
2018 |
2019 |
2020 |
2021 |
2022 |
2023 |
2024 |
|
|---|---|---|---|---|---|---|---|---|---|---|---|
|
Use of Norwegian and foreign cards at Norwegian terminals |
1 739.7 |
1 855.2 |
1 998.4 |
2 149.5 |
2 248.9 |
2 352.3 |
2 248.5 |
2 347.9 |
2 583.7 |
2 700.7 |
2 802.9 |
|
Withdrawals through in-store cash services |
- |
- |
- |
- |
- |
- |
0.3 |
1.7 |
2.3 |
2.5 |
2.3 |
|
Cash withdrawals from ATMs |
61.3 |
55.9 |
48.9 |
41.1 |
35.4 |
30.4 |
19.5 |
15.7 |
17.0 |
15.7 |
12.9 |
|
Payments at EFTPOS terminals that accept BankAxept |
1 630.3 |
1 742.2 |
1 866.7 |
1 940.3 |
1 999.8 |
2 061.6 |
1 933.5 |
1 963.6 |
2 115.2 |
2 165.1 |
2 181.8 |
|
Of which: payments with cashback |
46.2 |
41.5 |
36.2 |
31.1 |
25.3 |
21.3 |
12.6 |
9.8 |
9.6 |
8.8 |
9.1 |
|
Of which: contactless payments |
- |
- |
- |
15.7 |
82.4 |
312.0 |
1 239.5 |
1 577.3 |
1 807.2 |
1 923.8 |
1 995.7 |
|
Internet payments |
46.8 |
55.9 |
81.6 |
110.3 |
165.5 |
231.7 |
271.9 |
338.2 |
407.5 |
470.1 |
546.7 |
|
Other payments at domestic terminals |
1.2 |
1.1 |
1.3 |
57.8 |
48.1 |
28.7 |
23.3 |
28.7 |
41.7 |
47.2 |
59.2 |
|
Use of Norwegian cards at Norwegian terminals |
1 703.1 |
1 815.5 |
1 952.2 |
2 095.2 |
2 182.2 |
2 281.1 |
2 215.8 |
2 313.7 |
2 506.2 |
2 609.0 |
2 713.4 |
|
Withdrawals through in-store cash services |
- |
- |
- |
- |
- |
- |
0.3 |
1.7 |
2.3 |
2.5 |
2.3 |
|
Cash withdrawals from ATMs |
59.4 |
54.3 |
47.2 |
39.6 |
34.1 |
29.1 |
18.9 |
15.3 |
16.2 |
15.0 |
12.4 |
|
BankAxept |
54.4 |
49.7 |
43.3 |
36.0 |
31.1 |
26.5 |
17.3 |
13.8 |
14.4 |
13.0 |
10.5 |
|
Other cards |
5.0 |
4.5 |
3.9 |
3.6 |
3.0 |
2.6 |
1.6 |
1.5 |
1.8 |
1.9 |
1.9 |
|
Payments at payment terminals |
1 642.5 |
1 760.0 |
1 903.7 |
1 997.8 |
2 100.0 |
2 223.4 |
2 173.3 |
2 268.0 |
2 446.0 |
2 544.3 |
2 639.6 |
|
BankAxept – payments at EFTPOS terminal and eBetaling (from 2024) |
1 398.2 |
1 476.5 |
1 551.3 |
1 602.4 |
1 636.2 |
1 656.1 |
1 592.1 |
1 604.5 |
1 630.7 |
1 596.4 |
1 529.6 |
|
BankAxess |
0.2 |
0.2 |
0.2 |
0.2 |
0.1 |
0.1 |
0.1 |
0.0 |
0.1 |
- |
- |
|
Cards issued by international card companies and Norwegian credit cards |
216.1 |
255.7 |
325.1 |
368.8 |
438.2 |
540.7 |
556.4 |
638.6 |
786.8 |
914.5 |
1076.9 |
|
Cards issued by oil companies |
23.1 |
23.3 |
22.9 |
22.5 |
21.4 |
22.5 |
21.1 |
21.5 |
22.4 |
21.0 |
20.0 |
|
Cards issued by retail chains |
4.4 |
3.8 |
3.8 |
3.7 |
3.7 |
3.7 |
3.3 |
3.1 |
4.8 |
10.1 |
10.8 |
|
E-money cards |
0.6 |
0.5 |
0.4 |
0.3 |
0.3 |
0.3 |
0.2 |
0.3 |
1.3 |
2.3 |
2.3 |
|
Other payments at Norwegian terminals |
1.2 |
1.1 |
1.3 |
57.8 |
48.1 |
28.7 |
23.3 |
28.7 |
41.7 |
47.2 |
59.1 |
|
Use of foreign cards at Norwegian terminals |
36.5 |
39.7 |
46.2 |
54.3 |
66.7 |
71.2 |
32.7 |
34.1 |
77.5 |
91.6 |
89.5 |
|
Payments |
34.6 |
38.1 |
44.5 |
52.8 |
65.3 |
69.9 |
32.1 |
33.7 |
76.8 |
90.9 |
89.0 |
|
Of which: internet payments |
5.8 |
6.6 |
7.9 |
10.5 |
9.8 |
12.1 |
3.9 |
4.1 |
7.4 |
9.3 |
9.7 |
|
Cash withdrawals |
1.9 |
1.6 |
1.6 |
1.5 |
1.3 |
1.2 |
0.6 |
0.4 |
0.7 |
0.7 |
0.5 |
Table 11 Cross-border transfers registered in the Register of Crossborder Transactions and Currency Exchange (transactions in millions)
|
2014 |
2015 |
2016 |
2017 |
2018 |
2019 |
2020 |
2021 |
2022 |
2023 |
2024 |
|
|---|---|---|---|---|---|---|---|---|---|---|---|
|
Transfers from Norway |
10.3 |
10.9 |
11.2 |
11.5 |
11.5 |
11.1 |
11.6 |
12.7 |
13.5 |
13.7 |
13.7 |
|
SWIFT |
9.3 |
9.9 |
10.1 |
10.3 |
10.4 |
10.1 |
10.7 |
11.8 |
12.7 |
13.0 |
13.1 |
|
Foreign currency cheques |
0.1 |
0.1 |
0.1 |
0.0 |
0.0 |
0.0 |
0.1 |
0.1 |
0.1 |
0.1 |
0.0 |
|
Other transfers (MoneyGram, Western Union, etc.) |
0.8 |
0.9 |
1.0 |
1.1 |
1.1 |
1.0 |
0.8 |
0.8 |
0.7 |
0.6 |
0.6 |
|
Transfers to Norway |
4.9 |
5.3 |
5.9 |
7.1 |
7.6 |
7.5 |
7.8 |
8.2 |
9.6 |
11.0 |
11.9 |
|
SWIFT |
4.7 |
5.3 |
5.9 |
7.1 |
7.6 |
7.4 |
7.8 |
8.2 |
9.6 |
11.0 |
11.9 |
|
Foreign currency cheques |
0.1 |
0.0 |
0.0 |
0.0 |
0.0 |
0.0 |
0.0 |
0.0 |
0.0 |
0.0 |
0.0 |
|
Other transfers (MoneyGram, Western Union, etc.) |
0.1 |
0.0 |
0.0 |
0.0 |
0.0 |
0.0 |
0.0 |
0.0 |
0.0 |
0.0 |
0.0 |
Table 12 Use of payment instruments (in billions of NOK)
|
2014 |
2015 |
2016 |
2017 |
2018 |
2019 |
2020 |
2021 |
2022 |
2023 |
2024 |
|
|---|---|---|---|---|---|---|---|---|---|---|---|
|
Total |
15 858.2 |
16 662.4 |
16 763.6 |
18 355.1 |
19 935.4 |
20 957.7 |
20 340.0 |
22 739.2 |
25 180.9 |
24 332.7 |
23 727.9 |
|
Bank transfers |
15 172.1 |
15 934.7 |
15 988.4 |
17 513.9 |
19 074.2 |
20 057.9 |
19 456.1 |
21 786.9 |
24 107.1 |
23 185.1 |
22 489.3 |
|
Electronic |
15 045.2 |
15 796.0 |
15 836.8 |
17 387.8 |
18 951.6 |
19 937.2 |
19 361.6 |
21 694.3 |
23 993.4 |
23 076.2 |
22 381.6 |
|
Paper-based |
126.9 |
138.7 |
151.6 |
126.1 |
122.6 |
120.7 |
94.5 |
92.6 |
113.8 |
108.9 |
107.7 |
|
Payment cards (payments) |
681.3 |
724.3 |
772.7 |
839.4 |
860.1 |
899.3 |
883.5 |
952.2 |
1 073.6 |
1 147.4 |
1 238.6 |
|
Electronic |
677.4 |
720.3 |
769.7 |
836.3 |
857.1 |
896.4 |
882.9 |
951.7 |
1 072.7 |
1 146.7 |
1 238.0 |
|
Manual |
3.9 |
4.1 |
3.0 |
3.1 |
3.0 |
2.9 |
0.6 |
0.4 |
0.9 |
0.7 |
0.6 |
|
Cheques |
4.8 |
3.4 |
2.5 |
1.8 |
1.1 |
0.5 |
0.4 |
0.2 |
0.1 |
0.1 |
0.0 |
Table 13 Bank transfers (in billions of NOK)
|
2014 |
2015 |
2016 |
2017 |
2018 |
2019 |
2020 |
2021 |
2022 |
2023 |
2024 |
|
|---|---|---|---|---|---|---|---|---|---|---|---|
|
Total |
15 172.1 |
15 934.7 |
15 988.4 |
17 513.9 |
19 074.2 |
20 057.9 |
19 456.1 |
21 786.9 |
24 107.1 |
23 185.1 |
22 489.3 |
|
Credit transfers |
14 901.0 |
15 643.7 |
15 691.6 |
17 240.1 |
18 778.6 |
19 752.4 |
19 068.7 |
21 272.4 |
23 593.0 |
22 656.7 |
21 942.7 |
|
Electronic |
14 790.9 |
15 528.8 |
15 568.9 |
17 126.4 |
18 664.6 |
19 639.7 |
18 979.6 |
21 183.6 |
23 482.0 |
22 548.9 |
21 835.5 |
|
Company terminal giro |
977.0 |
958.0 |
1 016.3 |
1 123.5 |
1 136.1 |
1 253.3 |
1 158.1 |
1 206.7 |
1 179.3 |
1 248.0 |
934.8 |
|
Telegiros |
18.0 |
16.0 |
13.7 |
12.0 |
9.6 |
8.1 |
4.1 |
6.5 |
6.2 |
6.4 |
10.1 |
|
Online banking |
13 005.2 |
13 721.9 |
13 792.6 |
15 291.0 |
16 767.2 |
17 573.2 |
16 966.9 |
19 196.4 |
21 462.4 |
20 497.2 |
20 009.8 |
|
Retail customers |
1 480.3 |
1 462.0 |
1 536.9 |
1 618.1 |
1 574.6 |
1 549.3 |
1 331.7 |
1 392.1 |
1 476.1 |
1 507.9 |
1 700.2 |
|
Corporate customers |
11 524.9 |
12 259.9 |
12 255.7 |
13 672.9 |
15 192.6 |
16 023.9 |
15 635.2 |
17 804.4 |
19 986.3 |
18 989.4 |
18 309.6 |
|
Instant payments |
- |
- |
- |
4.1 |
45.4 |
84.6 |
110.2 |
129.8 |
147.8 |
134.3 |
135.2 |
|
Miscellaneous other electronic credit transfers |
790.6 |
832.9 |
746.4 |
695.8 |
741.8 |
720.5 |
740.4 |
644.2 |
686.4 |
663.1 |
743.5 |
|
Paper-based |
110.2 |
114.9 |
122.7 |
113.7 |
114.0 |
112.8 |
89.1 |
88.8 |
110.9 |
107.7 |
107.2 |
|
Company terminal giros and online banking as money order |
6.3 |
5.7 |
5.1 |
3.6 |
2.9 |
2.6 |
1.4 |
1.1 |
0.6 |
0.3 |
0.2 |
|
Postal giros |
24.4 |
20.7 |
17.3 |
13.9 |
11.4 |
9.5 |
7.5 |
6.4 |
4.9 |
3.2 |
3.3 |
|
Giros delivered at the counter – account debits |
79.4 |
88.4 |
100.3 |
96.2 |
99.7 |
100.6 |
80.2 |
81.3 |
105.4 |
104.2 |
103.8 |
|
Direct debits (Avtalegiro and Autogiro) |
254.3 |
267.2 |
267.8 |
261.4 |
287.0 |
297.5 |
381.9 |
510.7 |
511.3 |
527.3 |
546.1 |
|
Giros delivered at the counter – cash payments |
16.7 |
23.8 |
28.9 |
12.4 |
8.6 |
8.0 |
5.5 |
3.8 |
2.8 |
1.2 |
0.5 |
Table 14a Payment cards. Use of cards (in billions of NOK)
|
2014 |
2015 |
2016 |
2017 |
2018 |
2019 |
2020 |
2021 |
2022 |
2023 |
2024 |
|
|---|---|---|---|---|---|---|---|---|---|---|---|
|
Total use of Norwegian cards (in Norway and abroad) |
814.6 |
855.3 |
890.9 |
945.7 |
954.9 |
986.8 |
936.3 |
1000.8 |
1130.6 |
1201.9 |
1289.0 |
|
Use of Norwegian cards in Norway |
685.1 |
715.0 |
744.9 |
787.6 |
795.0 |
816.8 |
826.7 |
867.5 |
919.0 |
960.2 |
1014.1 |
|
Payments |
572.7 |
608.1 |
649.2 |
703.7 |
722.3 |
749.6 |
781.2 |
826.3 |
875.5 |
919.9 |
977.5 |
|
Payments at EFTPOS terminals |
538.1 |
569.8 |
599.8 |
621.2 |
631.7 |
645.2 |
669.5 |
689.7 |
711.8 |
729.6 |
748.1 |
|
Of which: contactless payments |
- |
- |
- |
1.8 |
12.9 |
63.7 |
391.6 |
533.4 |
588.5 |
635.9 |
676.8 |
|
- with physical cards |
- |
- |
- |
- |
- |
- |
387.6 |
519.0 |
558.1 |
586.6 |
597.8 |
|
- other contactless payments |
- |
- |
- |
- |
- |
- |
4.0 |
14.3 |
30.5 |
49.4 |
79.0 |
|
Internet payments |
29.4 |
33.1 |
44.3 |
51.7 |
65.0 |
90.1 |
102.2 |
125.8 |
148.8 |
174.3 |
207.6 |
|
Other electronic payments and manual payments |
5.2 |
5.2 |
5.1 |
30.7 |
25.6 |
14.4 |
9.6 |
10.8 |
14.9 |
16.0 |
21.7 |
|
Cash-back from EFTPOS terminals |
20.3 |
18.9 |
17.4 |
15.0 |
12.1 |
10.4 |
7.0 |
5.2 |
5.0 |
4.8 |
7.3 |
|
Other cash withdrawals |
92.1 |
88.1 |
78.3 |
68.9 |
60.6 |
56.7 |
38.4 |
36.0 |
38.5 |
35.4 |
29.4 |
|
Use of Norwegian cards abroad |
129.5 |
140.2 |
145.9 |
158.2 |
159.9 |
170.0 |
109.7 |
133.3 |
211.6 |
241.7 |
274.9 |
|
Payments |
108.6 |
116.3 |
123.5 |
135.7 |
137.9 |
149.7 |
101.8 |
125.8 |
198.1 |
227.5 |
261.1 |
|
Payments at EFTPOS terminals |
68.4 |
68.1 |
67.9 |
69.9 |
68.9 |
73.1 |
25.0 |
29.7 |
74.1 |
79.9 |
87.4 |
|
Of which: contactless payments |
- |
- |
- |
1.4 |
4.0 |
9.7 |
7.1 |
14.9 |
46.3 |
55.4 |
65.4 |
|
- with physical cards |
- |
- |
- |
- |
- |
- |
7.0 |
13.9 |
42.4 |
47.9 |
53.6 |
|
- other contactless payments |
- |
- |
- |
- |
- |
- |
0.1 |
0.9 |
3.9 |
7.4 |
11.9 |
|
Internet payments |
39.4 |
47.3 |
55.4 |
65.7 |
68.7 |
76.3 |
76.7 |
96.0 |
123.9 |
147.4 |
173.5 |
|
Other electronic payments and manual payments |
0.8 |
0.9 |
0.2 |
0.1 |
0.2 |
0.2 |
0.1 |
0.1 |
0.2 |
0.2 |
0.1 |
|
Cash withdrawals |
20.9 |
24.0 |
22.4 |
22.4 |
22.0 |
20.3 |
7.9 |
7.4 |
13.5 |
14.2 |
13.8 |
|
Use of Norwegian cards by function |
814.6 |
855.3 |
890.9 |
945.7 |
954.9 |
986.8 |
936.3 |
1 000.8 |
1 130.6 |
1 201.9 |
1 289.0 |
|
Debit functions |
670.0 |
700.0 |
726.0 |
758.0 |
763.0 |
771.0 |
764.4 |
828.1 |
912.9 |
955.9 |
1 008.6 |
|
BankAxept |
561.0 |
579.0 |
585.0 |
584.0 |
581.0 |
577.0 |
584.6 |
592.8 |
590.3 |
578.9 |
560.7 |
|
Payment cards issued by international card companies |
109.2 |
121.4 |
141.2 |
174.5 |
181.5 |
194.4 |
179.8 |
235.3 |
322.7 |
377.0 |
447.9 |
|
Billing functions (payment cards issued by international card companies) |
24.9 |
24.1 |
23.8 |
24.7 |
24.1 |
20.7 |
12.4 |
13.0 |
14.8 |
15.5 |
16.3 |
|
Credit functions |
119.4 |
130.8 |
140.4 |
162.7 |
168.0 |
194.8 |
159.3 |
159.4 |
202.1 |
229.1 |
262.6 |
|
Domestic credit cards |
8.5 |
8.2 |
8.2 |
8.5 |
8.5 |
9.3 |
2.6 |
0.1 |
0.0 |
- |
- |
|
Payment cards issued by international card companies |
110.9 |
122.7 |
132.2 |
154.2 |
159.5 |
185.6 |
156.7 |
159.3 |
202.1 |
229.1 |
262.6 |
|
E-money |
0.4 |
0.4 |
0.3 |
0.3 |
0.2 |
0.2 |
0.2 |
0.3 |
0.8 |
1.4 |
1.5 |
|
Use of foreign cards in Norway |
27.9 |
33.1 |
38.7 |
44.4 |
46.8 |
54.5 |
17.9 |
16.6 |
42.1 |
53.0 |
51.2 |
|
Payments |
25.2 |
30.6 |
36.1 |
42.0 |
44.6 |
52.4 |
16.8 |
15.7 |
40.7 |
51.7 |
50.3 |
|
Cash withdrawals |
2.7 |
2.5 |
2.6 |
2.4 |
2.2 |
2.1 |
1.1 |
0.9 |
1.4 |
1.3 |
0.9 |
Table 14b Payment cards. Use of terminals (in billions of NOK)
|
2014 |
2015 |
2016 |
2017 |
2018 |
2019 |
2020 |
2021 |
2022 |
2023 |
2024 |
|
|---|---|---|---|---|---|---|---|---|---|---|---|
|
Use of Norwegian and foreign cards at Norwegian terminals |
728.0 |
761.6 |
795.2 |
843.9 |
856.3 |
886.4 |
860.0 |
902.4 |
985.9 |
1 037.4 |
1 089.0 |
|
Withdrawals through in-store cash services |
- |
- |
- |
- |
- |
- |
1.3 |
4.7 |
6.6 |
6.6 |
5.3 |
|
Cash withdrawals from ATMs |
94.7 |
90.3 |
80.5 |
70.7 |
62.3 |
58.2 |
38.1 |
32.1 |
33.3 |
30.0 |
24.9 |
|
Payments at EFTPOS terminals that accept BankAxept |
590.5 |
621.4 |
651.0 |
671.5 |
686.4 |
705.3 |
703.1 |
724.3 |
774.0 |
796.3 |
814.5 |
|
Of these: POS cash withdrawals (cash-back) |
20.3 |
18.9 |
17.4 |
15.0 |
12.1 |
10.4 |
7.0 |
5.2 |
5.0 |
4.9 |
7.3 |
|
Of which: contactless payments |
- |
- |
- |
1.8 |
12.9 |
69.7 |
397.2 |
541.6 |
607.2 |
661.0 |
705.0 |
|
Internet payments |
40.8 |
48.0 |
61.3 |
74.0 |
85.3 |
111.3 |
107.9 |
130.1 |
158.4 |
189.0 |
222.8 |
|
Other payments at Norwegian terminals |
2.0 |
1.9 |
2.3 |
27.7 |
22.2 |
11.7 |
9.5 |
11.0 |
13.7 |
15.5 |
21.4 |
|
Use of Norwegian cards at Norwegian terminals |
700.3 |
729.2 |
757.9 |
800.6 |
810.6 |
833.2 |
842.4 |
886.1 |
944.7 |
985.2 |
1 038.2 |
|
Withdrawals through in-store cash services |
- |
- |
- |
- |
- |
- |
1.3 |
4.7 |
6.6 |
6.6 |
5.3 |
|
Cash withdrawals from ATMs |
92.0 |
87.8 |
77.9 |
68.3 |
60.1 |
56.1 |
37.0 |
31.3 |
31.9 |
28.8 |
24.0 |
|
Bank cards/BankAxept |
83.3 |
79.6 |
70.8 |
61.6 |
54.6 |
51.2 |
33.9 |
28.4 |
28.7 |
25.4 |
20.7 |
|
Other cards |
8.7 |
8.3 |
7.2 |
6.7 |
5.5 |
4.9 |
3.1 |
2.9 |
3.2 |
3.4 |
3.3 |
|
Cash-back from EFTPOS terminals |
20.3 |
18.9 |
17.4 |
15.0 |
12.1 |
10.4 |
7.0 |
5.2 |
5.0 |
4.9 |
7.3 |
|
Payments at payment terminals |
586.1 |
620.5 |
660.3 |
689.6 |
716.2 |
755.0 |
787.5 |
833.9 |
887.5 |
929.5 |
980.3 |
|
BankAxept – payments at EFTPOS terminal and eBetaling (from 2024) |
456.7 |
479.7 |
496.4 |
506.4 |
513.9 |
514.6 |
542.1 |
554.3 |
549.8 |
542.1 |
527.3 |
|
BankAxess |
0.4 |
0.4 |
0.5 |
0.6 |
0.6 |
0.4 |
0.3 |
0.2 |
0.2 |
- |
- |
|
Cards issued by international card companies and Norwegian credit cards |
112.3 |
124.6 |
148.7 |
167.3 |
183.5 |
221.4 |
229.6 |
261.0 |
310.1 |
360.5 |
427.0 |
|
Cards issued by oil companies |
14.6 |
14.0 |
12.9 |
13.6 |
16.5 |
16.8 |
13.8 |
16.7 |
23.7 |
21.4 |
20.0 |
|
Cards issued by retail chains |
1.8 |
1.5 |
1.6 |
1.5 |
1.6 |
1.6 |
1.5 |
1.5 |
2.9 |
4.2 |
4.5 |
|
E-money cards |
0.3 |
0.2 |
0.2 |
0.2 |
0.2 |
0.2 |
0.2 |
0.2 |
0.8 |
1.4 |
1.5 |
|
Other payments at Norwegian terminals |
2.0 |
1.9 |
2.3 |
27.7 |
22.2 |
11.7 |
9.5 |
11.0 |
13.7 |
15.5 |
21.3 |
|
Use of foreign cards at Norwegian terminals |
27.7 |
32.4 |
37.3 |
43.3 |
45.7 |
53.2 |
17.6 |
16.3 |
41.2 |
52.1 |
50.7 |
|
Payments |
25.0 |
30.0 |
34.7 |
41.0 |
43.5 |
51.2 |
16.4 |
15.4 |
39.9 |
50.9 |
49.8 |
|
Of which: internet payments |
11.5 |
14.9 |
17.0 |
22.3 |
20.3 |
21.2 |
5.7 |
4.4 |
9.6 |
14.6 |
15.1 |
|
Cash withdrawals |
2.7 |
2.5 |
2.6 |
2.4 |
2.2 |
2.1 |
1.1 |
0.9 |
1.4 |
1.3 |
0.9 |
Table 15 Cross-border transfers registered in the Register of Crossborder Transactions and Currency Exchange (in billions of NOK)
|
2014 |
2015 |
2016 |
2017 |
2018 |
2019 |
2020 |
2021 |
2022 |
2023 |
2024 |
|
|---|---|---|---|---|---|---|---|---|---|---|---|
|
Transfers from Norway |
8 683.7 |
10 748.0 |
7 655.6 |
8 196.4 |
7 891.1 |
6 456.0 |
6 622.3 |
7 324.5 |
9 738.7 |
10 333.4 |
9 788.9 |
|
SWIFT |
6 521.4 |
8 103.7 |
6 802.8 |
7 458.5 |
7 277.4 |
6 041.3 |
6 224.4 |
6 935.5 |
9 062.9 |
9 687.9 |
9 367.1 |
|
Foreign currency cheques |
2 159.3 |
2 641.0 |
849.3 |
727.8 |
607.2 |
407.7 |
389.8 |
364.3 |
647.4 |
600.7 |
406.4 |
|
Other transfers (MoneyGram, Western Union, etc.) |
3.0 |
3.3 |
3.6 |
10.0 |
6.6 |
6.9 |
8.1 |
24.7 |
28.4 |
44.8 |
15.4 |
|
Transfers to Norway |
6 739.4 |
8 266.3 |
6 933.5 |
7 066.2 |
6 988.8 |
7 181.0 |
7 905.1 |
8 428.8 |
13 326.9 |
13 600.3 |
13 570.1 |
|
SWIFT |
6 738.8 |
8 265.8 |
6 933.0 |
7 058.2 |
6 987.2 |
7 180.7 |
7 904.7 |
8 428.5 |
13 326.8 |
13 600.0 |
13 570.0 |
|
Foreign currency cheques |
0.3 |
0.3 |
0.3 |
0.2 |
0.3 |
0.2 |
0.2 |
0.2 |
0.0 |
0.0 |
0.0 |
|
Other transfers (MoneyGram, Western Union, etc.) |
0.2 |
0.2 |
0.2 |
7.8 |
1.3 |
0.2 |
0.2 |
0.1 |
0.1 |
0.3 |
0.1 |
Table 16 Sending electronic invoices (in millions)
|
2014 |
2015 |
2016 |
2017 |
2018 |
2019 |
2020 |
2021 |
2022 |
2023 |
2024 |
|
|---|---|---|---|---|---|---|---|---|---|---|---|
|
eFaktura from businesses to retail customers |
59.0 |
69.7 |
80.8 |
83.8 |
99.6 |
139.8 |
163.9 |
174.7 |
191.3 |
224.6 |
228.4 |
|
EHF format |
5.0 |
10.6 |
17.9 |
29.1 |
45.2 |
58.1 |
66.4 |
84.7 |
98.5 |
115.2 |
123.9 |
Prices
Table 17 Prices for domestic payment services and cash withdrawals, retail customers. Weighted average (NOK). 1 January each year
|
Customers who do not belong to loyalty schemes |
Customers who belong to loyalty schemes |
|||||||||||
|---|---|---|---|---|---|---|---|---|---|---|---|---|
|
2020 |
2021 |
2022 |
2023 |
2024 |
2025 |
2020 |
2021 |
2022 |
2023 |
2024 |
2025 |
|
|
Payments |
||||||||||||
|
Online banking (with CID), per payment |
0.80 |
0.70 |
0.80 |
0.70 |
0.60 |
0.50 |
0.00 |
0.10 |
0.10 |
0.20 |
0.00 |
0.00 |
|
Online banking – annual fee |
14.70 |
13.20 |
13.30 |
13.10 |
12.70 |
8.20 |
2.40 |
0.60 |
1.10 |
1.10 |
1.10 |
1.20 |
|
Direct debit (Avtalegiro), per payment |
0.80 |
0.80 |
0.80 |
0.80 |
0.60 |
0.60 |
0.00 |
0.20 |
0.30 |
0.30 |
0.10 |
0.00 |
|
Mobile banking (with CID), per payment |
0.80 |
0.90 |
0.80 |
0.70 |
0.60 |
0.50 |
0.00 |
0.10 |
0.10 |
0.20 |
0.00 |
0.00 |
|
Mobile banking – info by SMS |
2.20 |
2.10 |
2.10 |
2.00 |
2.10 |
2.20 |
1.90 |
1.80 |
1.90 |
1.80 |
1.60 |
2.10 |
|
Credit transfer via postal giro, per payment |
12.20 |
12.20 |
12.90 |
13.10 |
13.20 |
13.40 |
12.20 |
12.20 |
12.80 |
13.10 |
13.10 |
13.30 |
|
Giro over the counter – account debit, per payment |
95.70 |
95.40 |
97.10 |
102.50 |
103.20 |
131.00 |
95.70 |
95.40 |
97.10 |
102.50 |
103.20 |
131.00 |
|
Giro over the counter – cash payment, per payment |
108.10 |
108.40 |
108.50 |
115.20 |
116.80 |
118.00 |
108.10 |
108.40 |
108.50 |
115.20 |
116.80 |
118.00 |
|
BankAxept cards at payment terminals (EFTPOS), per payment |
0.90 |
0.80 |
0.80 |
0.80 |
0.50 |
0.50 |
0.00 |
0.10 |
0.00 |
0.00 |
0.00 |
0.00 |
|
Credit card from international credit card company, annual fee |
15.30 |
21.30 |
26.80 |
28.20 |
18.20 |
22.20 |
25.00 |
23.60 |
12.50 |
31.90 |
4.00 |
3.10 |
|
BankAxept cards (combined with debet card from int. card comp.), annual fee |
290.90 |
298.00 |
299.60 |
295.70 |
296.90 |
294.40 |
238.40 |
220.50 |
227.90 |
227.90 |
236.30 |
231.60 |
|
Cash withdrawals in-store |
- |
- |
- |
7.20 |
8.80 |
9.00 |
- |
- |
- |
6.90 |
7.10 |
6.20 |
|
ATM withdrawals, debit cards |
||||||||||||
|
Own bank’s ATMs during opening hours, per withdrawal |
6.50 |
7.20 |
7.80 |
7.90 |
8.70 |
- |
6.70 |
6.70 |
6.50 |
6.00 |
4.30 |
- |
|
Other bank’s ATMs during opening hours, per withdrawal |
8.10 |
8.50 |
8.60 |
8.70 |
9.50 |
- |
7.80 |
7.20 |
7.00 |
7.30 |
5.50 |
- |
|
ATM withdrawals, international credit cards |
||||||||||||
|
Price per withdrawal |
31.60 |
31.10 |
31.40 |
34.40 |
38.10 |
37.90 |
30.80 |
32.60 |
33.80 |
36.40 |
38.50 |
37.90 |
|
Fee as a percentage of withdrawal amount |
1.2 |
1.1 |
1.1 |
1.2 |
1.3 |
1.3 |
1.2 |
0.8 |
1.1 |
1.2 |
1.2 |
1.2 |
Table 18 Prices for domestic payment services, corporate customers. Weighted average (NOK). 1 January each year
|
2014 |
2015 |
2016 |
2017 |
2018 |
2019 |
2020 |
2021 |
2022 |
2023 |
2024 |
2024 |
|
|---|---|---|---|---|---|---|---|---|---|---|---|---|
|
Payments |
||||||||||||
|
Electronic bank transfers |
||||||||||||
|
Corporate online banking monthly fee |
- |
- |
- |
- |
- |
- |
- |
- |
- |
71.20 |
102.90 |
75.30 |
|
Corporate online banking without notification |
2.60 |
2.80 |
2.60 |
3.10 |
3.30 |
3.20 |
3.30 |
3.60 |
3.80 |
4.40 |
4.70 |
4.80 |
|
Corporate online banking with notification |
4.30 |
4.40 |
4.40 |
4.50 |
4.50 |
4.50 |
4.90 |
5.10 |
5.30 |
5.00 |
5.30 |
5.30 |
|
Corporate online banking with CID |
1.20 |
1.10 |
1.30 |
1.30 |
1.40 |
1.50 |
1.50 |
1.50 |
1.50 |
1.50 |
1.50 |
1.60 |
|
Autogiro payment |
- |
- |
- |
- |
- |
- |
- |
- |
- |
2.30 |
2.40 |
2.40 |
|
Receipt of payment |
||||||||||||
|
Electronic bank transfers |
||||||||||||
|
Avtalegiro monthly fee |
- |
- |
- |
- |
- |
- |
- |
- |
- |
80.40 |
86.40 |
86.10 |
|
Direct debits (Autogiro) without notification |
1.40 |
1.40 |
1.60 |
1.60 |
1.70 |
2.00 |
2.00 |
2.00 |
2.60 |
2.60 |
2.60 |
3.00 |
|
Direct debits (Autogiro) with notification |
3.80 |
3.80 |
3.60 |
3.60 |
3.90 |
3.90 |
3.90 |
4.10 |
4.10 |
4.10 |
4.20 |
4.40 |
|
Avtalegiro monthly fee |
- |
- |
- |
- |
- |
- |
- |
- |
- |
80.30 |
86.30 |
87.00 |
|
Direct debits without notification |
2.40 |
2.70 |
2.80 |
2.80 |
3.10 |
3.80 |
3.60 |
3.70 |
3.80 |
3.50 |
3.70 |
4.20 |
|
Direct debits with notification |
7.80 |
8.00 |
7.60 |
7.60 |
8.10 |
8.40 |
8.30 |
8.40 |
8.40 |
7.80 |
8.30 |
7.90 |
|
E-giro monthly fee |
- |
- |
- |
- |
- |
- |
- |
- |
- |
84.50 |
87.00 |
85.00 |
|
E-giro with CID |
- |
- |
- |
- |
- |
- |
- |
- |
- |
2.20 |
2.40 |
2.40 |
|
E-giro with notification |
- |
- |
- |
- |
- |
- |
- |
- |
- |
2.50 |
2.60 |
2.60 |
|
Optical Character Recognition monthly fee |
- |
- |
- |
- |
- |
- |
- |
- |
- |
84.50 |
87.00 |
86.00 |
|
Optical Character Recognition with CID |
- |
- |
- |
- |
- |
- |
- |
- |
- |
2.20 |
3.00 |
2.60 |
|
Sending eFaktura |
||||||||||||
|
eFaktura B2C monthly fee |
- |
- |
- |
- |
- |
- |
- |
- |
- |
76.30 |
80.60 |
82.90 |
|
eFaktura B2C per invoice |
- |
- |
- |
- |
- |
- |
- |
- |
- |
3.40 |
3.60 |
3.60 |
|
eFaktura B2C invoice hotell per invoice |
- |
- |
- |
- |
- |
- |
- |
- |
- |
1.80 |
1.80 |
1.60 |
|
eFaktura B2B online banking monthly fee |
- |
- |
- |
- |
- |
- |
- |
- |
- |
38.30 |
45.20 |
41.10 |
|
eFaktura B2B online banking per invoice |
- |
- |
- |
- |
- |
- |
- |
- |
- |
8.40 |
8.60 |
7.10 |
|
eFaktura B2B file-based monthly fee |
- |
- |
- |
- |
- |
- |
- |
- |
- |
201.90 |
191.90 |
182.80 |
|
eFaktura B2B file-based per invoice |
- |
- |
- |
- |
- |
- |
- |
- |
- |
3.30 |
3.00 |
3.00 |
|
Receipt of eFaktura |
||||||||||||
|
eFaktura B2B online banking monthly fee |
- |
- |
- |
- |
- |
- |
- |
- |
- |
21.70 |
41.20 |
30.60 |
|
eFaktura B2B online banking per invoice |
- |
- |
- |
- |
- |
- |
- |
- |
- |
3.20 |
3.20 |
3.30 |
|
eFaktura B2B file-based monthly fee |
- |
- |
- |
- |
- |
- |
- |
- |
- |
201.80 |
191.80 |
182.80 |
|
eFaktura B2B file-based per invoice |
- |
- |
- |
- |
- |
- |
- |
- |
- |
3.40 |
3.30 |
3.30 |
Table 19 Prices for transfers from Norway to EU/EEA countries. Weighted average (NOK) for a sample of banks. 1 January each year
|
Electronic payment order/automated processing |
Manual payment order |
|||||||||||
|---|---|---|---|---|---|---|---|---|---|---|---|---|
|
2020 |
2021 |
2022 |
2023 |
2024 |
2025 |
2020 |
2021 |
2022 |
2023 |
2024 |
2025 |
|
|
SEPA (SWIFT) transfers |
||||||||||||
|
With BIC and IBAN, NOK 2 500 |
25.80 |
26.50 |
25.70 |
29.10 |
28.70 |
27.80 |
- |
- |
- |
- |
- |
- |
|
Ordinary Swift transfer in NOK |
||||||||||||
|
Without BIC and IBAN, NOK 2 500 |
98.70 |
102.40 |
122.80 |
125.30 |
129.60 |
68.40 |
294.50 |
298.80 |
306.50 |
311.70 |
307.10 |
316.40 |
|
With BIC and IBAN, NOK 2 500 |
71.50 |
72.60 |
69.30 |
72.40 |
71.40 |
70.10 |
294.10 |
298.10 |
299.00 |
305.20 |
302.10 |
315.90 |
|
Ordinary Swift transfer in EUR |
||||||||||||
|
Without BIC and IBAN, NOK 2 500 equivalent |
82.20 |
84.90 |
109.50 |
113.40 |
118.60 |
53.50 |
294.50 |
298.80 |
306.50 |
311.80 |
307.10 |
317.70 |
|
With BIC and IBAN, NOK 2 500 equivalent |
65.00 |
62.50 |
60.80 |
64.30 |
67.20 |
63.90 |
294.10 |
298.10 |
299.00 |
305.20 |
302.10 |
317.30 |
|
SWIFT express transfer in NOK |
||||||||||||
|
Without BIC and IBAN, NOK 150 000 |
355.40 |
326.40 |
292.60 |
309.00 |
340.30 |
314.80 |
488.00 |
498.70 |
494.10 |
490.50 |
489.90 |
507.80 |
|
With BIC and IBAN, NOK 150 000 |
257.30 |
241.20 |
218.60 |
231.90 |
296.30 |
338.60 |
493.60 |
487.60 |
491.60 |
489.20 |
490.30 |
506.50 |
|
SWIFT express transfer in EUR |
||||||||||||
|
Without BIC and IBAN, NOK 150 000 equivalent |
345.90 |
317.00 |
279.30 |
297.10 |
329.30 |
300.00 |
488.00 |
498.70 |
494.10 |
490.50 |
489.90 |
507.80 |
|
With BIC and IBAN, NOK 150 000 equivalent |
253.70 |
237.40 |
213.50 |
227.30 |
292.00 |
331.40 |
486.10 |
487.60 |
491.60 |
489.20 |
490.30 |
506.50 |
|
Cheques to other countries |
||||||||||||
|
Equivalent to NOK 2 500 |
- |
- |
- |
- |
- |
- |
268.90 |
271.60 |
265.70 |
267.70 |
263.20 |
136.90 |
Table 20 Prices for receipt of payments from EU/EEA countries. Weighted average (NOK) for a sample of banks. 1 January each year
|
2014 |
2015 |
2016 |
2017 |
2018 |
2019 |
2020 |
2021 |
2022 |
2023 |
2024 |
2025 |
|
|---|---|---|---|---|---|---|---|---|---|---|---|---|
|
Receipt of SEPA (SWIFT) payments |
||||||||||||
|
With BIC and IBAN, NOK 2 500 equivalent |
- |
- |
21.30 |
22.40 |
21.20 |
21.10 |
18.00 |
17.90 |
17.50 |
18.70 |
18.40 |
17.40 |
|
With BIC and IBAN, NOK 150 000 equivalent |
- |
- |
21.70 |
22.80 |
21.50 |
21.20 |
18.10 |
17.90 |
17.50 |
18.80 |
18.40 |
38.30 |
|
Receipt of payments in EUR |
||||||||||||
|
Without BIC and IBAN, NOK 2 500 equivalent |
64.30 |
54.20 |
59.40 |
62.60 |
70.50 |
72.40 |
76.10 |
79.50 |
81.50 |
86.90 |
90.10 |
90.90 |
|
Without BIC and IBAN, NOK 150 000 equivalent |
86.50 |
77.70 |
73.50 |
76.70 |
84.70 |
83.70 |
87.30 |
87.10 |
95.00 |
96.00 |
95.00 |
95.70 |
|
With BIC and IBAN, NOK 2 500 equivalent |
20.60 |
20.80 |
53.10 |
55.10 |
59.10 |
57.20 |
62.10 |
68.60 |
67.00 |
75.60 |
78.20 |
77.10 |
|
With BIC and IBAN, NOK 150 000 equivalent |
20.60 |
20.80 |
58.50 |
60.40 |
64.70 |
63.20 |
68.60 |
88.40 |
88.20 |
93.60 |
93.40 |
92.20 |
|
Receipt of payments in other currencies |
||||||||||||
|
Without BIC and IBAN, NOK 2 500 equivalent |
71.00 |
71.30 |
79.00 |
79.00 |
81.70 |
85.10 |
85.50 |
89.60 |
91.90 |
94.90 |
97.80 |
98.80 |
|
Without BIC and IBAN, NOK 150 000 equivalent |
97.00 |
97.90 |
93.90 |
93.80 |
95.90 |
95.90 |
96.70 |
96.80 |
104.40 |
104.00 |
102.70 |
104.00 |
|
With BIC and IBAN, NOK 2 500 equivalent |
71.00 |
71.30 |
72.10 |
72.70 |
73.80 |
73.50 |
75.00 |
77.00 |
74.90 |
79.00 |
81.40 |
80.30 |
|
With BIC and IBAN, NOK 150 000 equivalent |
95.80 |
96.80 |
96.00 |
96.20 |
96.80 |
96.80 |
96.90 |
96.80 |
96.10 |
97.00 |
96.60 |
95.50 |
Table 21 Prices for remittances to selected countries. Banks and other providers. In percent of amount transferred. At 1 January 2024 and 2025
|
Transaction in person |
Online payment order |
|||||||
|---|---|---|---|---|---|---|---|---|
|
NOK 1 000 |
NOK 5000 |
NOK 1000 |
NOK 5000 |
|||||
|
2024 |
2025 |
2024 |
2025 |
2024 |
2025 |
2024 |
2025 |
|
|
Banks |
29.2 |
29.7 |
6.2 |
6.7 |
5.6 |
5.9 |
1.5 |
1.9 |
|
Exchange rate cost |
0.4 |
1.0 |
0.4 |
1.0 |
0.5 |
0.9 |
0.5 |
0.9 |
|
Other fees |
28.8 |
28.8 |
5.8 |
5.8 |
5.1 |
5.0 |
1.0 |
1.0 |
|
Non-bank financial institutions and payment institutions |
- |
- |
- |
- |
4.6 |
4.6 |
3.4 |
3.0 |
|
Exchange rate cost |
- |
- |
- |
- |
2.6 |
2.0 |
2.6 |
2.0 |
|
Other fees |
- |
- |
- |
- |
2.0 |
2.6 |
0.8 |
1.0 |
|
All providers |
29.2 |
29.7 |
6.2 |
6.7 |
5.1 |
5.4 |
2.5 |
2.3 |
|
Exchange rate cost |
0.4 |
1.0 |
0.4 |
1.0 |
1.6 |
1.3 |
1.6 |
1.3 |
|
Other fees |
28.8 |
28.8 |
5.8 |
5.8 |
3.5 |
4.1 |
0.9 |
1.0 |
Table 22 Prices for remittances to selected countries. In percent of amount transferred. At 1 January 2024 and 2025
|
Transaction in person |
Online payment order |
|||||||
|---|---|---|---|---|---|---|---|---|
|
NOK 1 000 |
NOK 5 000 |
NOK 1 000 |
NOK 5 000 |
|||||
|
2024 |
2025 |
2024 |
2025 |
2024 |
2025 |
2024 |
2025 |
|
|
Europe (EU) |
28.4 |
29.0 |
5.8 |
6.4 |
3.3 |
3.7 |
1.4 |
1.5 |
|
EU/EEA |
28.8 |
29.3 |
5.8 |
6.3 |
2.4 |
2.9 |
0.6 |
1.1 |
|
Bulgaria |
31.7 |
32.0 |
7.7 |
8.1 |
5.1 |
6.6 |
2.5 |
2.7 |
|
Latvia |
28.8 |
29.3 |
5.8 |
6.3 |
2.8 |
2.9 |
1.2 |
1.1 |
|
Lithuania |
28.8 |
29.3 |
5.8 |
6.3 |
2.7 |
2.9 |
1.1 |
1.1 |
|
Poland |
29.0 |
29.6 |
6.0 |
6.6 |
3.5 |
3.9 |
1.5 |
1.5 |
|
Romania |
28.9 |
29.5 |
5.9 |
6.5 |
3.1 |
3.6 |
1.3 |
1.5 |
|
Hungary |
25.1 |
26.1 |
5.1 |
6.1 |
4.8 |
6.0 |
1.9 |
2.1 |
|
Other Europe |
30.3 |
30.9 |
6.3 |
6.8 |
5.9 |
6.3 |
2.3 |
1.9 |
|
Bosnia-Herzegovina |
31.7 |
32.3 |
6.4 |
6.9 |
5.7 |
6.0 |
1.3 |
1.6 |
|
Kosovo |
28.8 |
29.3 |
5.8 |
6.3 |
6.1 |
6.6 |
1.8 |
1.8 |
|
North Macedonia |
28.8 |
29.3 |
5.8 |
6.3 |
4.4 |
6.0 |
0.6 |
1.6 |
|
Serbia |
32.0 |
32.6 |
6.7 |
7.3 |
5.6 |
6.3 |
1.8 |
1.9 |
|
Turkey |
32.6 |
33.2 |
7.2 |
7.9 |
6.5 |
6.2 |
3.3 |
2.1 |
|
Asia |
31.6 |
32.4 |
7.2 |
7.7 |
6.0 |
6.6 |
2.5 |
2.5 |
|
Afghanistan |
31.8 |
32.4 |
6.5 |
7.1 |
6.8 |
6.9 |
2.5 |
1.9 |
|
Philippines |
29.2 |
32.9 |
6.2 |
7.5 |
4.8 |
5.8 |
1.7 |
2.2 |
|
India |
33.0 |
33.5 |
7.7 |
8.2 |
5.7 |
6.3 |
2.5 |
2.8 |
|
Iraq |
34.4 |
34.6 |
9.1 |
9.2 |
8.2 |
8.5 |
4.0 |
3.5 |
|
China |
29.5 |
30.0 |
6.5 |
7.0 |
5.6 |
7.1 |
2.2 |
2.4 |
|
Pakistan |
35.3 |
35.7 |
10.0 |
10.4 |
6.3 |
7.2 |
3.1 |
3.4 |
|
Palestine |
32.3 |
32.6 |
6.9 |
7.2 |
6.9 |
7.0 |
2.6 |
2.0 |
|
Sri Lanka |
32.5 |
32.7 |
7.2 |
7.3 |
8.3 |
6.6 |
4.0 |
2.3 |
|
Thailand |
29.5 |
30.3 |
6.5 |
7.3 |
5.3 |
5.9 |
2.2 |
2.5 |
|
Vietnam |
31.8 |
32.4 |
6.5 |
7.1 |
5.2 |
6.9 |
1.5 |
1.9 |
|
Americas |
29.9 |
30.5 |
6.2 |
6.7 |
6.7 |
6.3 |
3.1 |
2.2 |
|
Brazil |
32.3 |
33.0 |
6.9 |
7.7 |
7.3 |
6.4 |
3.7 |
2.3 |
|
Chile |
28.8 |
29.2 |
5.8 |
6.2 |
7.0 |
6.5 |
2.6 |
1.6 |
|
Colombia |
- |
- |
- |
- |
4.4 |
5.5 |
3.1 |
3.9 |
|
Africa |
31.9 |
32.5 |
6.5 |
7.1 |
7.0 |
7.0 |
3.3 |
2.6 |
|
Eritrea |
31.8 |
32.4 |
6.5 |
7.1 |
6.4 |
6.9 |
1.4 |
1.9 |
|
Ethiopia |
31.8 |
32.4 |
6.5 |
7.1 |
6.8 |
7.0 |
3.4 |
3.0 |
|
Gambia |
31.8 |
32.4 |
6.5 |
7.1 |
7.5 |
6.9 |
3.5 |
1.9 |
|
Ghana |
31.8 |
32.4 |
6.5 |
7.1 |
7.7 |
6.9 |
3.9 |
1.9 |
|
Morocco |
32.4 |
32.7 |
7.0 |
7.4 |
7.7 |
8.4 |
3.8 |
3.4 |
|
Nigeria |
31.8 |
32.4 |
6.5 |
7.1 |
6.0 |
5.4 |
2.3 |
1.4 |
|
Somalia |
- |
- |
- |
- |
6.8 |
6.7 |
4.4 |
4.4 |
Sources and table notes
Source material for the data, an overview of data quality and averaging methods are presented briefly below. Further details on table contents are also provided. Statistics on general data and means of payment in Norway have been compiled by Norges Bank, while other statistical data have been compiled by Statistics Norway.
Sources:
- General data: Statistics Norway and Norges Bank
- Information on means of payment in Norway: Statistics Norway and Norges Bank
- Information on bank transfers, cheques, payment cards, ATMs and mobile payments: Finans Norge; DNB Bank ASA; Nordea Bank ABP, Norway Branch; Danske Bank; Handelsbanken; Cultura Sparebank; Skandinaviska Enskilda Banken AB; BNP Paribas S.A. Norway Branch; Eika Gruppen AS; Nets Branch Norway; Mastercard Payment Services Infrastructure (Norway) AS; Tietoevry Norge AS; Skandinavisk Data Center; EVRY Card Services AS; SEB Kort Bank AB Oslo Branch, Ikano Bank AB (publ) Norway Branch; U.S. Bank Europe Designated Activity Company NUF; American Express S.A. (Norway Branch); Swedbank AB NUF; Morrow Bank ASA; Entercard Norge, branch of Entercard Group AB; Bambora Norge NUF; Euronet 360 Finance Limited; Vipps AS; Circle K Norge AS; Wex Europe Services AS; ST1 Norge AS; Blue Energy AS; Uno X Mobility Norge AS; YX Norge AS; Norgesgruppen Finans AS; Coop Norge SA
- Information on locations where the public can deposit and withdraw cash has been obtained from banks in Norway.
- Information on electronic invoices has been collected from Mastercard Payment Services Infrastructure (Norway) AS and the Norwegian Agency for Public and Financial Management (DFØ).
- Information on cross-border payments other than by card has been collected from the Register of Crossborder Currency Transactions and Currency Exchange (Norwegian Tax Administration).
- Information on fees for fund transfers to selected countries/regions and fees for retail customer services have been collected from Finansportalen.
Notes on the tables:
Table 5 – Number of agreements
- The number of agreements to offer or receive eFaktura e-invoicing refers to agreements on sending e-invoices in the banking network using online banking to retail customers. The number of agreements for e-invoicing in EHF format refers to businesses registered as recipients of e-invoices in EHF format sent via the access point in the PEPPOL infrastructure. PEPPOL is a Norwegian version of an international format, PEPPOL BIS.
Table 6 – Number of cards issued and number of functions in cards issued
- The table shows the number of cards issued in Norway by banks and other card issuers. Figures include e-money cards (prepaid cards) from Visa and Mastercard.
- Physically, cards are broken down by contact technology. They may be contactless cards or have a chip and/or magnetic stripe. They may also be virtual, such as card accounts in watches, wristbands and so on, or travel accounts in card systems not linked to physical cards.
- The functions in the card are broken down by settlement method, namely whether card use entails immediate debit of a bank account (debit function), whether the user receives an invoice that is paid in full a few weeks later (billing function), whether the user has a line of credit that is repaid in instalments (credit function) or whether the user pays with a prepaid card (e-money)1.
Table 7 – Cash infrastructure
- The table shows the number of locations where the public can deposit and withdraw cash.
- The number of locations with “in-store cash services” was obtained from the following webpage: Kontanttjenester i butikk – BankAxept [in-store cash services – BankAxept] (in Norwegian only).
Tables 9 og 13 – Bank transfers
- “Instant payments” include instant payments made on mobile payment platforms, such as Vipps, and instant payments using online or mobile banking platforms settled through NICS Real. In the papers for 2021 and 2022, payments between accounts at the same bank with immediate settlement, but not settled through NICS Real, were also included in the figures. In the papers from 2023 and forwards, such payments are included under “Miscellaneous other electronic credit transfers”.
- “Miscellaneous other electronic credit transfers” include payments made on mobile payment platforms that are not instant payments, payments between accounts at the same bank with immediate settlement, and local payment solutions used for recurring transactions, loan repayments and so on.
- The figures for payments with “online banking for corporate customers” for 2021 and 2022 are probably too low.
Tables 10a and 14a – Payment cards. Card use
- The tables show all use of payment cards issued in Norway (from Table 6). It also shows the use of foreign payment cards in Norway.
- The figures for “POS cash withdrawals” are for cashback at EFTPOS terminals, while the figures for “other cash withdrawals” refer to in-store cash services and withdrawals over the counter at banks and at ATMs.
- “Other contactless payments” include payments at EFTPOS terminals using Vipps and other mobile payment platforms such as Apple Pay and Google Pay, and payments using watches and wristbands such as Fitbit Pay and Garmin Pay.
- “Online payments” include both payments with physical cards and payments via different mobile payment platforms such as Vipps, Apple Pay and Google Pay.
- The figures for “Other electronic payments and manual payments” include payments made using mobile payment platforms other than payments at websites, and payments from accounts without the use of physical cards, such as payments from travel accounts in offline card systems.
- The figures for prepayments/e-money include registered use of Nav (Norwegian Labour and Welfare Administration) cash cards, prepaid Visa and Mastercard cards issued by banks in Norway, and universal gift cards.
- The figures for use of Norwegian cards abroad and foreign cards in Norway primarily refer to cards issued by international card companies, including Visa, Eurocard, Mastercard, Diners, American Express, JCB and China Union Pay.
- The use of BankAxept cards in Norwegian-owned EFTPOS terminals abroad has been included in the figures for use of Norwegian cards abroad.
Tables 10b and 14b – Payment cards. Use of payment terminals
- The tables refer to use of Norwegian and foreign payment cards at all ATMs and Norwegian-owned EFTPOS terminals installed in Norway and abroad. Note that this applies even if payments using Norwegian cards at terminals abroad are included as use of Norwegian cards abroad in Tables 10a and 14a.
- In order to show how the terminals are used, the use of cards issued by retail chains are included, even though such cards are not defined as payment cards and are not therefore included in Tables 10a and 14a. The figures for cards issued by retail chains also include the use of such cards online that are registered in the banks’ data centres.
- The tables also show the online use of Norwegian and foreign cards on Norwegian websites. The figures include both payments made with physical cards and payments using different mobile payment platforms such as Vipps, Apple Pay and Google Pay.
- The figures for “Other payments at Norwegian terminals” include payments made using offline mobile payment platforms, and payments from accounts without the use of physical cards, such as payments from travel accounts in offline card systems.
- The figures for cash withdrawals from ATMs with e-money include prepaid Visa and Mastercard payment cards (until 2021) and use of Nav cash cards (until 2023). The figures for payments with e-money include the registered use of universal gift cards in Norway and prepaid Visa and Mastercard payment cards in Norway and abroad.
Table 16 – Sending electronic invoices
- The table shows the number of eFaktura e-invoices, which is the banks’ electronic invoicing solution, and e-invoices in EHF format, which is the government’s format for electronic invoicing.
Tables 17 to 20 – Prices for domestic payment transactions, cash withdrawals and payment receipt, and prices for cross-border transactions
- Information on prices for retail customer services (Table 17) is from 69 banks with prices published by Finansportalen. These banks accounted for 90 percent of the market measured by deposits in current accounts. There are two average prices for each service, one for customers who belong to a loyalty scheme and one for those who do not. Average prices are calculated by weighing the price at each bank based on the bank’s share of deposits in current accounts. In cases where a bank has multiple loyalty schemes, the median price for these schemes is used to calculate the average price for all banks for services in loyalty schemes
- The prices for corporate services and for cross-border payments are reported in a form from 18 and 17 banks respectively, that had a market share of 81 percent in terms of deposits in transaction accounts. The prices only include customers that do not belong to loyalty schemes or receive other types of discount. Average prices are calculated by compiling average prices for commercial and savings banks by weighting the price at each bank based on its share of deposits in transaction accounts. The average prices for all banks are then calculated by weighting the prices for banking groups by market share measured by the number of transactions during the statistical year.
- The annual fee for BankAxept cards (combined with international debit cards) applies to “ordinary” cards. These cards can be used for payments at physical outlets and for online purchases. There is no cardholder identification on these cards.
- The price of postal giros is for each form posted. Postage for each form posted comes in addition.
- The price of direct debit (Avtalegiro) receipt refers to receipt without notification.
- From 2017, Finansportalen has had information on prices for multiple credit cards for non-loyalty scheme customers rather than just one card as before. From 2017, the median of prices at each bank for the different credit cards has therefore been used to calculate average prices for non-loyalty scheme customers.
- Cross-border fees refer to fixed sum transfers in the EEA with or without BIC and IBAN information and excluding exchange rate cost. Fees do not include additional costs for cash payments, third country currency, or costs that the payer must cover for the payee.
Tables 21 and 22 – Prices for remittances to selected countries/regions
- Prices for 2025 are based on information from eight service providers that had information in Finansportalen. Five of them are banks and three are foreign service providers. The prices for 2024 are calculated using information from two Norwegian payment institutions in addition to the eight service providers. The sample of service providers is small, the figures are therefore uncertain.
- Average prices are calculated by first calculating an arithmetic average for each of the reporting institutions that charge more than one price per service/service variable. Then an arithmetic average is calculated of the prices from all providers of the service/service variable.
- Banks’ prices refer to prices for SWIFT transfers, while the prices reported by the other institutions refer to transfers over proprietary networks.
Standard symbols in the tables:
- Incomplete information or zero
0.0 Less than 0.05 of the unit used
1 According to Finanstilsynet (Financial Supervisory Authority of Norway), e-money is: “an electronically stored monetary value represented by a claim on the issuer that is issued upon receipt of funds to carry out payment transactions and is recognised as a means of payment by entities other than the issuer”.