Key findings
Ownership and awareness of crypto-assets:
- 97% of the population in Norway aged 16 and over are aware of crypto-assets.
- 12% of the population own crypto-assets, up from 11% in 2024.
- 17% of the population have owned or currently own crypto-assets.
- Bitcoin is the crypto-asset that most people are aware of, followed by Dogecoin and Ether.
- 70% of those familiar with crypto-assets rate their own knowledge of crypto-assets as very little or quite little.
- The most common reasons for not having owned crypto-assets are lack of knowledge, lack of interest and high risk.
- The market value of Norwegian private individuals’ holdings of crypto-assets is estimated at at least NOK 37 billion, up from NOK 35 billion in 2024. The actual value is likely higher.
Former and current crypto-asset owners:
- The crypto-assets most commonly owned are Bitcoin, Ether, Ripple, Solana and Cardano.
- 77% of current crypto-asset owners have holdings with a market value of NOK 50,000 or less.
- Four out of five current crypto-asset owners have less than 5% of their financial savings in crypto-assets.
- The most common way to finance the purchase of crypto-assets is by using one’s own disposable income.
- 38% of current crypto-asset owners plan to hold the same level of crypto-assets in the next few years, whilst 21% plan to increase their holdings. 13% plan to reduce their holdings, whilst 28% are unsure/do not know.
- The most popular trading platforms for crypto-assets are centralised crypto exchanges in Norway and abroad (49% and 30% of respondents in this group, respectively).1 Only 3% reported using DeFi (decentralised finance) to trade crypto-assets.
- 29% of former and current crypto-asset owners are very satisfied or fairly satisfied with their investment in crypto-assets, whilst 23% are fairly dissatisfied or very dissatisfied.
- 35% of past and current owners have had negative experiences. Of these, 66% cite a fall in value, 19% cite theft/fraud and 17% cite a lack of use cases.2
- Only 17% of crypto-asset owners are aware of the Crypto-Asset Act, which was introduced in 2025.
DeFi, stablecoins and NFTs (non-fungible tokens):
- 17% of the population have heard of DeFi, and 19% have heard of stablecoins.
- Of those familiar with DeFi, a high proportion (74%) have never used DeFi.
- Of those familiar with stablecoins, a high proportion (72%) have never used stablecoins.
- The three main reasons for buying stablecoins are to trade other cryptocurrencies (55%), to store value (30%) and to learn more about and/or test the technology (22%).
- 1% of the population has purchased NFT.
1. Introduction
This memo presents the results of a new round of Norges Bank’s survey on the Norwegian population’s awareness, ownership and use of crypto-assets. The survey was conducted by Norges Bank with the assistance of Ipsos between January and March 2026. This is the second time Norges Bank has conducted such a survey; the previous one was in 2024 (see Norges Bank, 2024).
The survey provides insights into the development and significance of crypto-assets in Norway. Norges Bank uses this knowledge, among other things, in analyses of the potential implications of crypto-assets for an efficient and secure payment system and for financial stability. The survey design is largely similar to the previous survey, but with a few new questions.3 See Norges Bank (2024) for definitions of key terms related to crypto-assets.
3 Appendix A shows the questions in the survey, with new questions marked.
2. Method
2.1 Study design
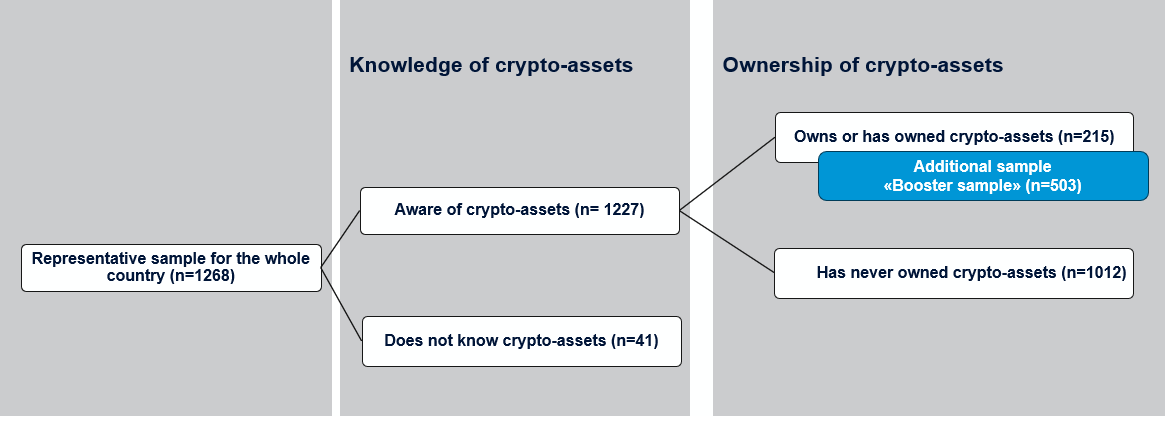
Figure 1 shows the structure of the survey. The survey aims to provide more knowledge about those who are familiar with crypto-assets – both those who own or have owned crypto-assets and those who have not. A significant proportion of the questions in the survey relate to the group “former and current crypto-asset owners”.
The survey was conducted in two stages using two different samples, where “n” corresponds to the number of respondents in the sample where the question was asked. The same methodology as in 2024 was used; see Norges Bank (2024) for further information.
Source: Norges Bank
Main sample: The main sample is a nationally representative sample (n=1268). In this sample respondents were asked questions about their knowledge of crypto-assets. Those who replied that they were familiar with crypto-assets were asked follow-up questions regarding their experiences.
Booster sample: This part of the survey was conducted after the first round with the main sample. The booster sample consists of respondents recruited from the same panel, but here the questions are directed solely at current and former owners of crypto-assets.4 In the analysis, the supplementary sample (n=503) is combined with those who responded that they have owned or own crypto-assets in the main sample (n=215). The total sample then amounts to 718.5 Figure 2 shows the distribution of respondents by group of interest in the study.6
Figure 2 Number of respondents per group of interest
|
Those unfamiliar with crypto-assets |
Those who are familiar with crypto-assets but have not owned them |
Those who have owned or currently own crypto-assets |
Total |
|
|---|---|---|---|---|
|
Several samples used as the basis for the survey |
||||
|
Main sample |
41 |
1012 |
215 |
1268 |
|
Booster sample |
- |
- |
503 |
503 |
|
Total |
41 |
1012 |
718 |
1771 |
Source: Norges Bank
The questionnaire consisted of 29 questions relating to crypto-assets. In addition, there were six questions relating to sample description (gender, age, respondent’s place of residence, highest level of education attained, household gross income and IT skills).
It took a maximum of 5 minutes to complete the survey. For some questions, it was possible to select multiple answer options.
4 The supplementary sample is a pragmatic choice: by not increasing the size of the main sample, requirements for representative findings are also met for subgroups comprising current and former owners of crypto-assets.
5 The survey with the main sample was conducted between 29 January and 5 February 2026, whilst the survey with the supplementary sample was conducted between 25 February and 10 March 2026.
6 14,050 participants in the panel were asked and 1,268 responded (main sample). This corresponds to a response rate of 9%.
2.2 Data collection method
The survey was conducted by Ipsos in accordance with an agreement with Norges Bank following a tender competition. Respondents were contacted via e-mail or SMS, and responses to the survey were web-based. Box 1 below describes the data collection method.
2.3 Basis for generalising findings and limitations
The main sample (in weighted form) is representative of the Norwegian population aged 16 and over.7 The supplementary sample provides a basis for generalising findings for those who own or have owned crypto-assets in Norway.
The main sample is further analysed based on the weighting of responses to ensure representativeness.
Where the memo refers to significant findings, this means statistical significance of at least 95%.
Standard market practice has been followed in the conduct of this survey. In general, there are several potential weaknesses in such surveys.8 Errors cannot therefore be ruled out.
3. Findings
3.1 General awareness of crypto-assets
Figure 3 summarises the findings on general awareness and ownership of crypto-assets.
According to the survey, 97% of the population is aware of crypto-assets. 17% of the population have owned crypto-assets at some point, whilst 12% owned crypto-assets at the time of the survey. At the time of the survey, 80% of the population were aware of crypto-assets but had never owned any.
The proportion of crypto-asset owners has increased slightly since the previous survey in 2024. At that time, 11% owned crypto-assets and 15% had owned crypto-assets at some point.

Figure 4 shows that more men than women both own and have owned crypto-assets.9 When it comes to general awareness of crypto-assets, the proportion is high for both women and men (97%).
Base: Main sample (n=853) for 2024 and (n=1268) for 202610

Figure 5 shows that the 60+ age group is under-represented as crypto-asset owners, whilst the 16–29 and 30–39 age groups are over-represented (compared with the proportion of the same age group in the population).11 Other studies, both for Norway and other countries12, have highlighted an over-representation of young men among crypto-asset owners.
Basis: Those who own or have owned crypto-assets in 2024 (n=130) vs. those who own or have owned crypto-assets in 2026 (n=215), compared with the distribution of age groups in the population for 2024 and 2026

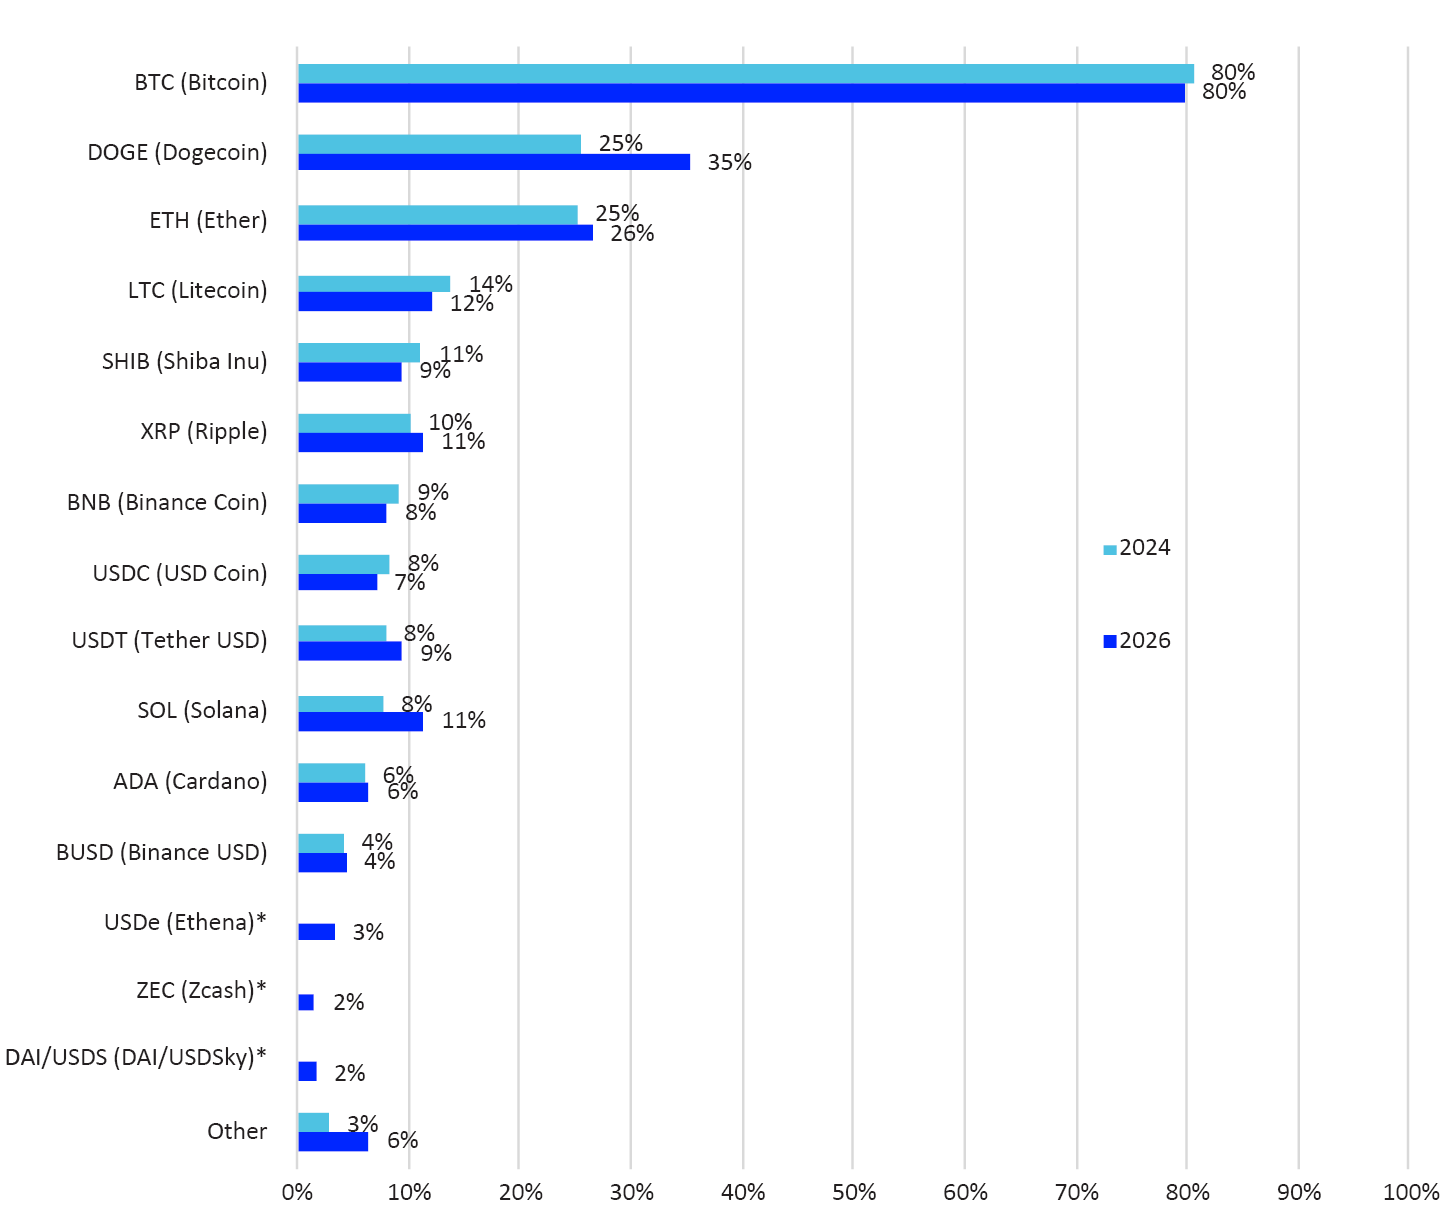
In addition to being asked about their awareness of crypto-assets in general, respondents were also asked about their awareness of specific crypto-assets using examples. The examples were a mix of crypto-assets with their own unit of account (such as Bitcoin, Dogecoin and Ether) and crypto-assets denominated in/pegged to a specific currency (such as Tether, USD Coin, Ethena and Binance USD). The latter category is known as stablecoins.
Base: Main sample (n=853) in 2024 vs. 2026 (n=1268)
* New response options for 2026
Source: Norges Bank
Figure 6 shows the proportion of the sample that recognises various crypto-assets. Bitcoin is by far the best-known crypto-asset, followed by Dogecoin, Ether and Litecoin.13 Although there have been several changes since 2024, the order remains the same for the five best-known crypto-assets. The survey shows that awareness of several stablecoins remains generally low. Tether is the best known, followed by USD Coin, Binance USD, Ethena and DAI/USD Sky.
Geographically, those living in Oslo have the highest awareness of specific crypto-assets. Those living in Northern Norway have the lowest awareness (not shown in the figure).14 The pattern was the same in 2024.
Base: Main sample in 2024 (n=853) vs. 2026 (n=1268)

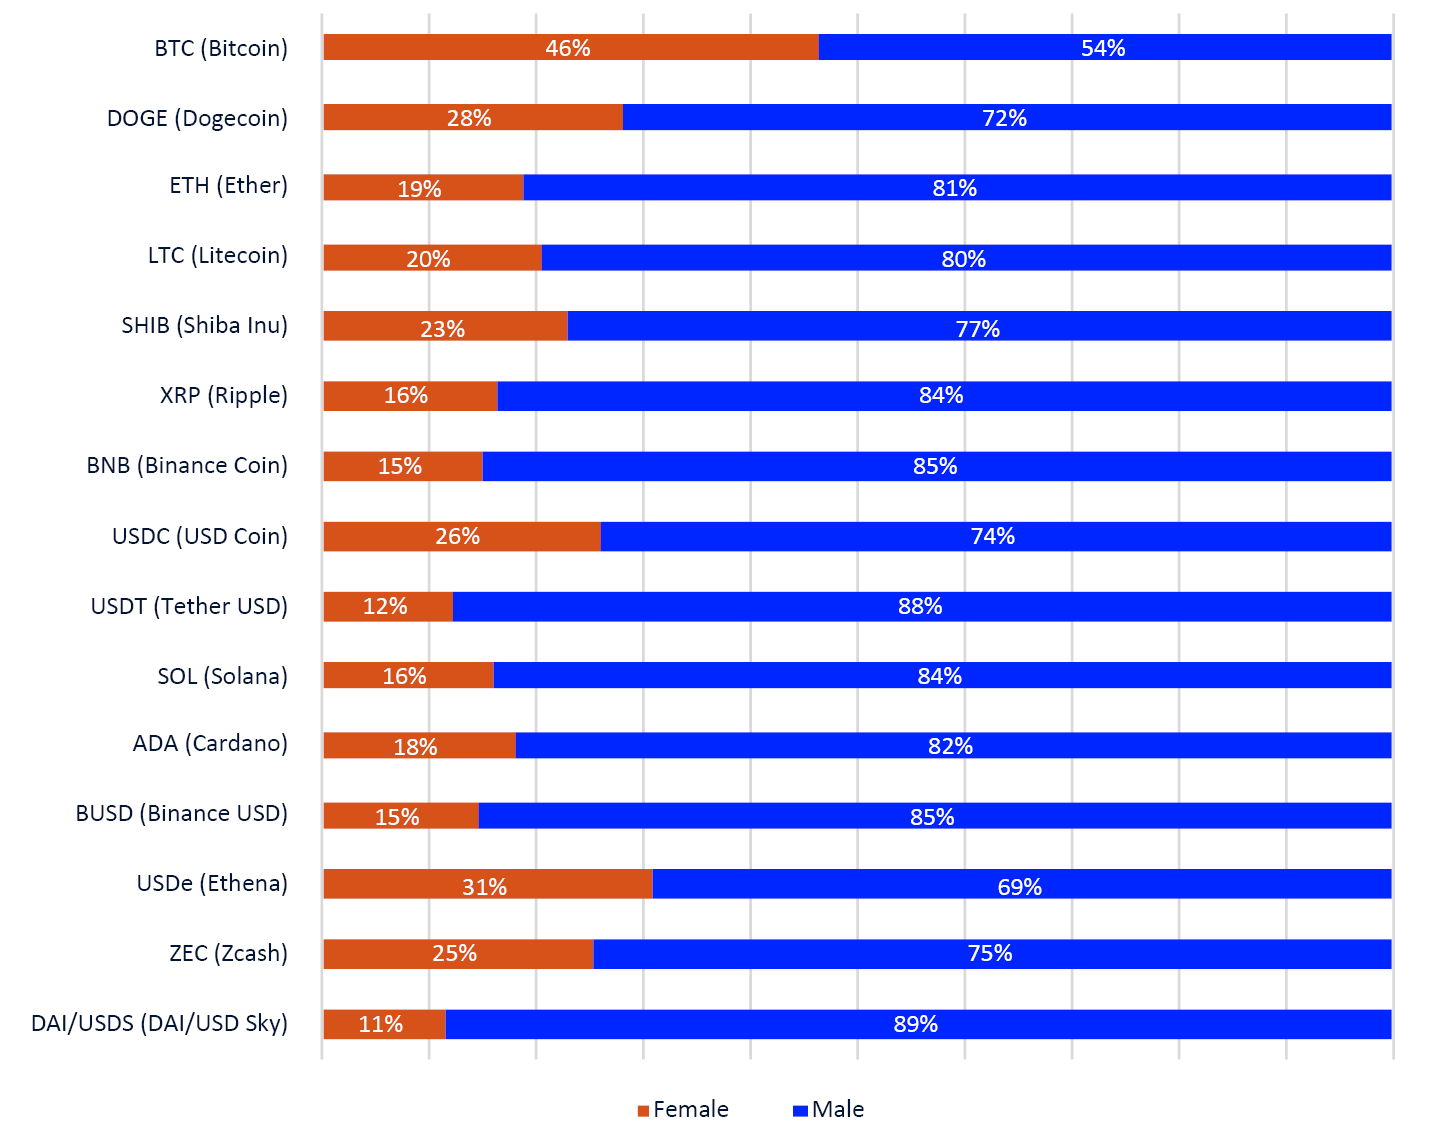
Figure 7 shows awareness of specific crypto-assets by gender, whilst Figure 8 shows the proportion of men and women in each group who are aware of specific crypto-assets. The findings indicate that there are consistently more men than women who are aware of specific crypto-assets.15 This is unchanged from 2024.
Base: Main sample (n=1268, subgroups based on all those who are familiar with a specific crypto-asset)
Respondents were also asked about their familiarity with specific crypto-asset terms such as “DeFi” and “stablecoins”. Figure 9 shows that although a total of 97% of respondents have heard of crypto-assets, significantly fewer have heard of stablecoins (19%) and DeFi (17%). More men than women have heard of the latter two categories.16
For all categories17, there has been an increase in awareness since 2024.
Figure 9 Awareness of certain crypto-asset terms in total and by gender
|
Female |
Male |
Other18 |
Total |
|
|---|---|---|---|---|
|
Base: Main sample (n=1268) |
||||
|
Have heard of crypto-assets |
97% of women |
97% of men |
100% of others |
97% of respondents |
|
Have heard of DeFi |
7% of women |
28% of men |
58% of others |
17% of respondents |
|
Have heard of stablecoins |
8% of women |
30% of men |
58% of others |
19% of respondents |
Source: Norges Bank
Figure 10 shows an assessment of respondents’ own knowledge of crypto-assets. 70% of those in the sample who are familiar with crypto-assets rate their own knowledge as “very limited” or “fairly limited”. This proportion has fallen from 76% in 2024.
Only 8%19 of those familiar with crypto-assets consider that they have “very much” or “quite a lot” of knowledge about them. This proportion was 7% in 2024.
Base: Those familiar with crypto-assets (n=1227)

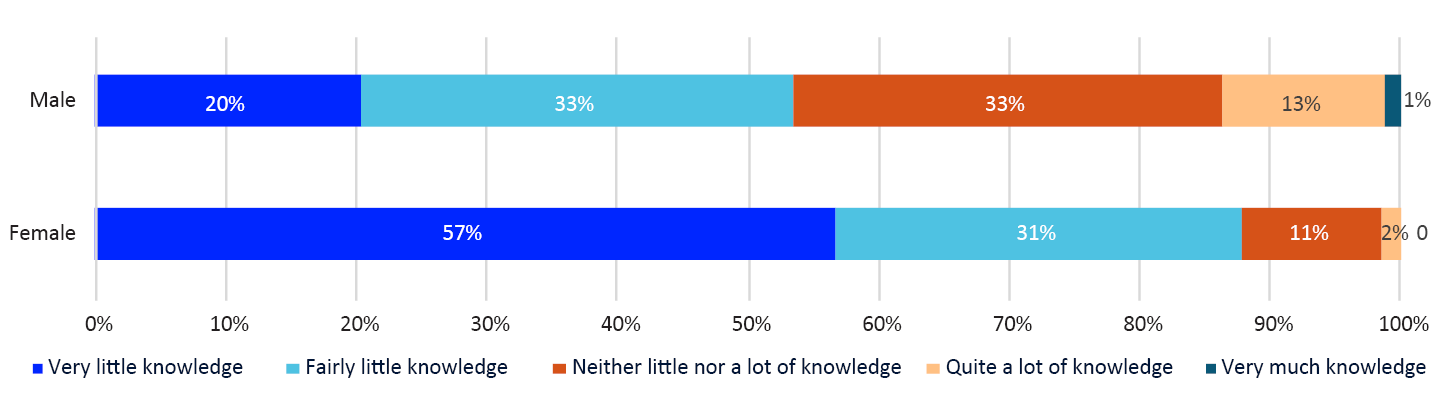
Figure 11 shows the results broken down by gender. Significantly more women than men rate their own knowledge of crypto-assets as very limited or fairly limited – 88% of women and 53% of men, respectively.20 In 2024, the corresponding figures were 90% and 61%, respectively.
Base: Those familiar with crypto-assets (n=1227). The percentages are shown as rounded figures.
Those who replied that they were familiar with specific crypto-assets were asked whether they planned to buy, and if so, which crypto-assets they planned to buy. It was possible to select multiple response options. Figure 12 shows the results for 2026 compared with 2024.21
83% of respondents do not plan to acquire crypto-assets. This proportion has remained unchanged since 2024. The crypto-assets most likely to be purchased were Bitcoin (14% of this group said they believe they will buy Bitcoin), followed by Ether (5%), Ripple (3%) and Cardano (2%).
Base: Those familiar with specific crypto-assets in 2024 (n=706) vs. 2026 (n=1051)

Everyone who knew about crypto-assets (n=1227) was asked what would make it more likely for them to buy crypto-assets. It was possible to select multiple answers. The results are shown in Figure 13.
Figure 13 What would make it more likely to buy crypto-assets?
|
Share of basis 2024 |
Share of basis 2026 |
|
|---|---|---|
|
Base: Aware of crypto-assets in 2024 (n=819) vs. 2026 (n=1227) |
||
|
Information from the authorities about cryptocurrency, including risks and benefits |
37% |
42% |
|
More regulation of cryptocurrency trading platforms |
18% |
23% |
|
More regulation of organisations offering information about cryptocurrencies |
17% |
24% |
|
More regulation of cryptocurrency issuers and developers |
16% |
21% |
|
None of the above |
42% |
35% |
|
Other |
3% |
9% |
Source: Norges Bank
35% of respondents indicated that none of the options mentioned would make it more likely for them to buy crypto-assets. 42% cited “information from the authorities about cryptocurrency, including risks and benefits”, up from 37% in 2024.
9 There are a few respondents who do not identify as female or male, and they have not been included in this figure. Data has been included in all relevant analyses, but given the limited size of this respondent group, it is only highlighted in few instances (such as in Figure 9).
10 The category “have owned crypto-assets” refers to those who answer “yes” to having owned crypto-assets at some point. This group therefore also includes those who own crypto-assets today.
11 The findings are significant.
12 See K33 Research (2025, 2026). See also Financial Conduct Authority (2025).
13 It is not surprising that Bitcoin and Ether are among the best-known crypto-assets, given their market value and media coverage. For some other crypto-assets, awareness may also be due to international and local marketing activities, among other factors.
14 The findings are significant.
15 The findings are significant.
16 The findings are significant.
17 The “other” category was not included in the 2024 survey.
18 There were several respondents who answered that they don’t identify themselves as a woman or a man. They are shown in a dedicated column.
19 The total is 8% due to rounding of figures.
20 Furthermore, men are over-represented in three response options (“quite a lot of knowledge”, “neither a lot nor a little knowledge” and “quite a little knowledge”), whilst they are under-represented for “very little knowledge”. The findings are significant for both genders (with the exception of the response option “very much knowledge”).
21 Crypto-assets where the figure was 0 are not shown in the graph.
3.2 Those who have never owned crypto-assets
Those who replied that they are aware of crypto-assets but have never owned any (n=1012, i.e. 80% of the main sample) were asked to explain their reasons for not purchasing them; see Figure 14. It was possible to select multiple response options.
Figure 14 Reasons why respondents have never owned crypto-assets
|
Proportion of the 2024 base |
Proportion of the base 2026 |
|
|---|---|---|
|
Base: Main sample, those who have never owned crypto-assets in 2024 (n=689) vs. 2026 (n=1012) |
||
|
I have no interest in it |
47% |
41% |
|
I don’t know enough knowledge about it |
45% |
45% |
|
I think it’s too risky |
25% |
30% |
|
I can’t afford it |
12% |
11% |
|
I’m waiting for more regulation |
5% |
5% |
|
I am waiting to see what happens next before I make a decision |
4% |
4% |
|
Other |
3% |
6% |
Source: Norges Bank
The three main reasons why respondents had never bought crypto-assets were lack of knowledge, lack of interest and the perception that crypto-assets were too risky (45%, 41% and 30% of respondents respectively). In 2024, the most common response was “I have no interest in it”.
3.3 Former and current crypto-asset owners
Figure 15 shows when respondents purchased crypto-assets for the first time (left axis, proportion of respondents) and the total market value of crypto-assets (right axis).
Base: Current and former crypto-asset holders (n=718)
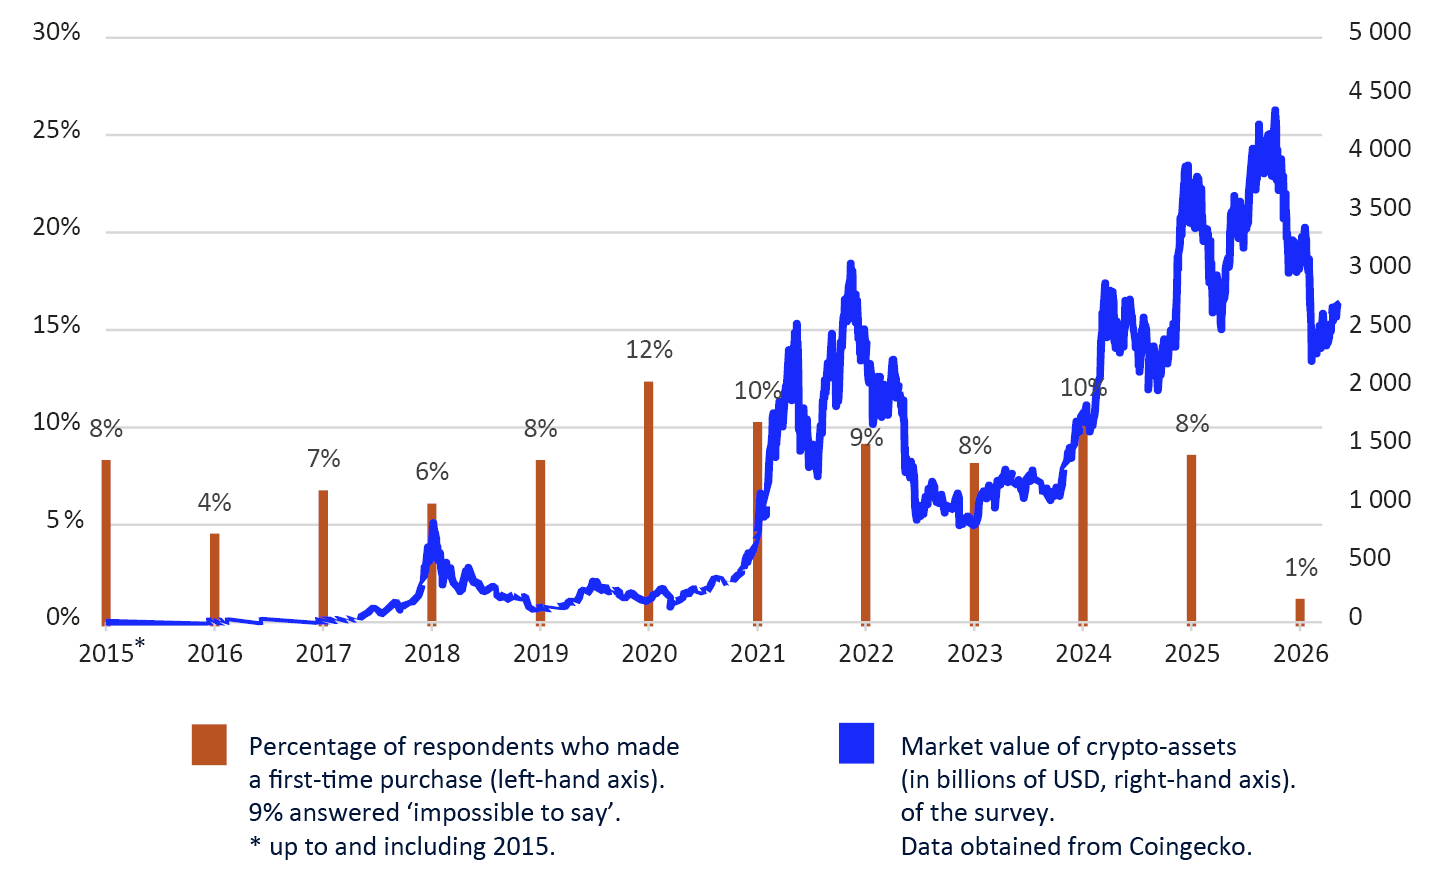
58% of this group purchased crypto-assets for the first time between 2020 and 2026. 8% of the group report that they purchased crypto-assets in 2015 or earlier.
Figure 16 shows the extent to which respondents are satisfied or dissatisfied with their own investment in crypto-assets.
29% say they are quite satisfied or very satisfied with their own investment in crypto-assets (a decrease from 41% in 2024). 23% say they are quite dissatisfied or very dissatisfied, up from 19% in 2024. 48% are neither satisfied nor dissatisfied.
Base: Former and current crypto-asset owners (n=718)

Current and former crypto-asset holders were asked what influences their holdings; see Figure 17. 21% cited the global political landscape, whilst 13% cited acquaintances who own cryptocurrency, followed by inflation (10%), interest rates (10%) and media coverage (9%). 22% of respondents chose “none of the above”.
Figure 17 Factors affecting own holdings of crypto-assets
|
Number of respondents |
Share of basis |
|
|---|---|---|
|
Base: Current and former crypto-asset holders (n=718) |
||
|
Interest rate level |
74 |
10 % |
|
Inflation |
70 |
10 % |
|
Acquaintances who own cryptocurrency |
91 |
13 % |
|
Media coverage |
64 |
9 % |
|
The global political landscape22 |
153 |
21% |
|
None of the above |
227 |
22 % |
|
Other |
24 |
6 % |
Source: Norges Bank
All current or former crypto-asset holders were also asked whether they had experienced anything negative in connection with crypto-assets. Figure 18 presents information on the distribution of responses in an infographic.
35% of those surveyed have experienced something negative in connection with crypto-assets. This group (n=254) was followed up with questions about the specifics of the negative experience. It was possible to select multiple response options.
The bars show the extent of various negative experiences with crypto-assets. Two out of three (66%) in this group cite a loss of value. 19% report having experienced theft/fraud, and 17% cite a lack of use cases as a means of payment in the traditional economy.
Base: Current or former crypto-asset owners (n=718)

Compared with 2024, there has been an increase in the number of respondents who selected “loss of value” (from 52% in 2024, not shown in the figure).
Respondents were asked which crypto-assets they own. Figure 19 shows that 73% of current crypto-asset owners own Bitcoin, whilst 39% own Ether. Ripple, Solana and Cardano follow. Ownership correlates with market value. Bitcoin is the largest crypto-asset by market value, followed by Ether.23 Compared to last year, the order of ownership for the top three choices remains the same, with minor variations for the other choices.
Among those who still own crypto-assets, there is an over-representation of those with the highest level of completed education (“University/college, lower degree”), those with a total gross household income of over 1,500,000, and those living in Oslo (not shown in the figure).24
Base: Current crypto-asset holders (n=466 for 2024 and n=467 for 2026). It was possible to select multiple response options

Most owners of crypto-assets have relatively small holdings, see Figure 20. Around 77% of current crypto-asset owners holdings worth NOK 50,000 or less. 3% had holdings over NOK 1,000,000 at the time of the survey. The corresponding figures in 2024 were 66% and 5% respectively. 6% of respondents did not wish to disclose the value of their holdings.
Base: Current crypto-asset holders (n=467)
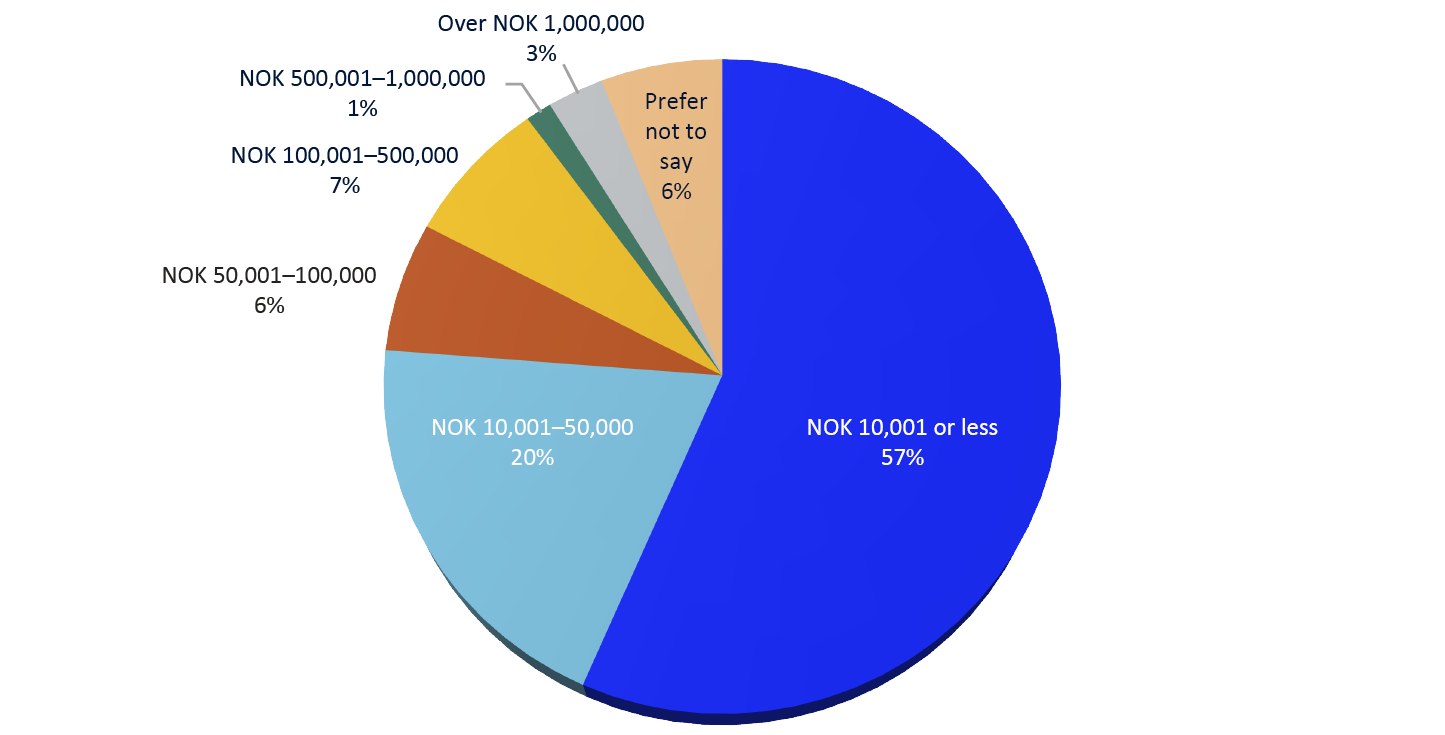
Based on these responses, it can be estimated that the total market value of Norwegian individuals’ holdings of crypto-assets was at least NOK 36.6 billion at the time of the survey.25 The actual value is likely to be higher.26 This represents a slight increase from 2024, when we estimated holdings were at least NOK 35 billion; see Norges Bank (2024).
Figure 21 shows how purchases of crypto-assets are financed.
Base: Current crypto-asset holders (n=467). It was possible to select multiple response options
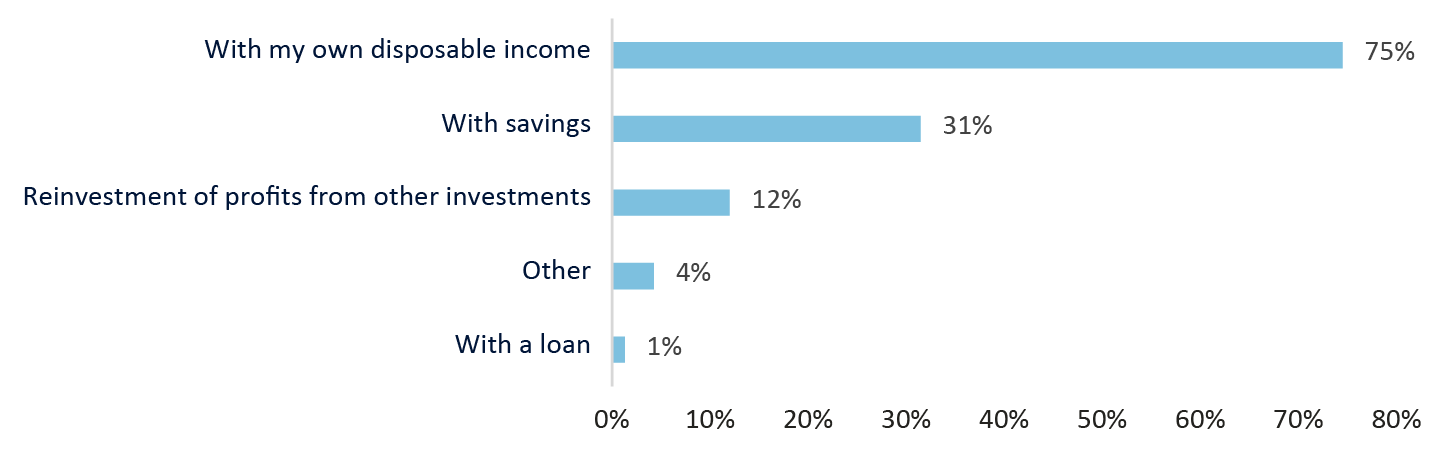
The most popular way to finance the purchase of crypto-assets is by using one’s own disposable income (75%). Only 1% report that they finance the purchase of crypto-assets through borrowing. Four per cent answered “other”. The most common examples in this category are mining or gifts. The results are similar to the findings from the 2024 survey.
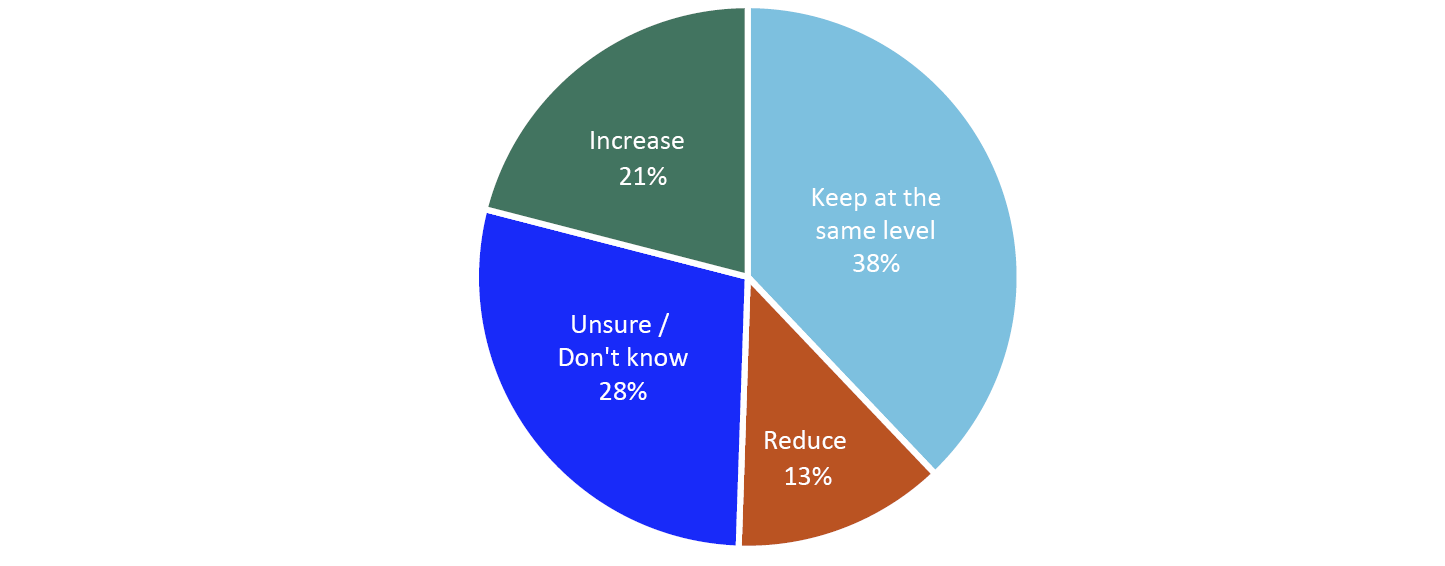
Figure 22 shows the responses to the question “How do you intend to change your holdings over the next few years?” Around 38% of crypto-asset owners state that they intend to keep their crypto-asset holdings at the same level, compared with 33% in 2024. 21% state that they plan to increase their holdings, compared to 30% in 2024. 13% of the group wish to reduce their holdings, up from 10% in 2024.
Base: Current crypto-asset owners (n=467)
Current crypto-asset holders were also asked what proportion of their financial savings was held in crypto-assets.27 Figure 23 shows the findings. Around 4 in 5 current crypto-asset holders have less than 5% of their financial savings in crypto-assets. This is an increase from 2024, when around 2 in 3 fell into the same category. The proportion of those with over 70% of their savings in crypto-assets fell from 6% in 2024 to 1% in 2026.
Base: Current crypto-asset holders (n=467)

Figure 24 shows answers to where the buying and selling of crypto-assets takes place. Respondents were able to select multiple response options. The most popular places to trade crypto-assets are centralised crypto exchanges in Norway (49%) and centralised crypto exchanges abroad (30%). In 2024, centralised crypto exchanges abroad were reported as the most commonly used.28 Around 18% of respondents did not wish to provide information on their trading platform.
Base: Current crypto-asset holders (n=467 for 2026 and n=466 for 2024). It was possible to select multiple response options
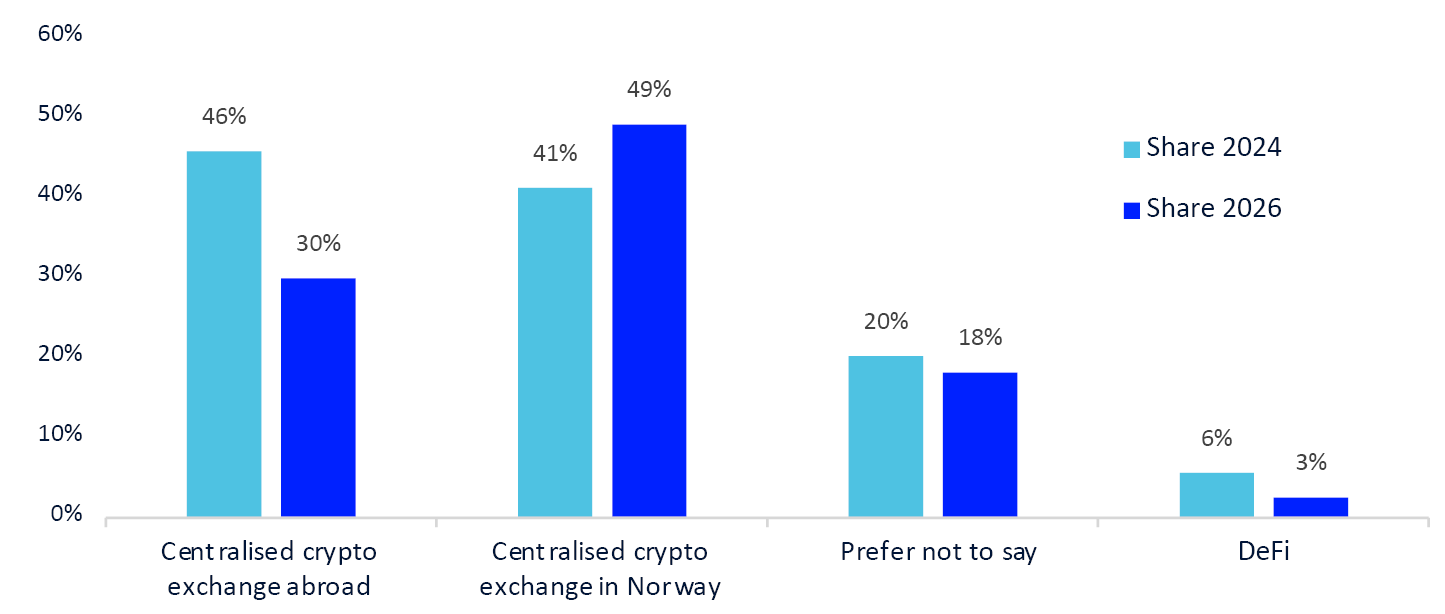
Figure 25 shows perceived investor protection for different groups.29
Base: Those who own crypto-assets at the time of the survey (n=467) vs. those who have previously owned crypto-assets (n=251)
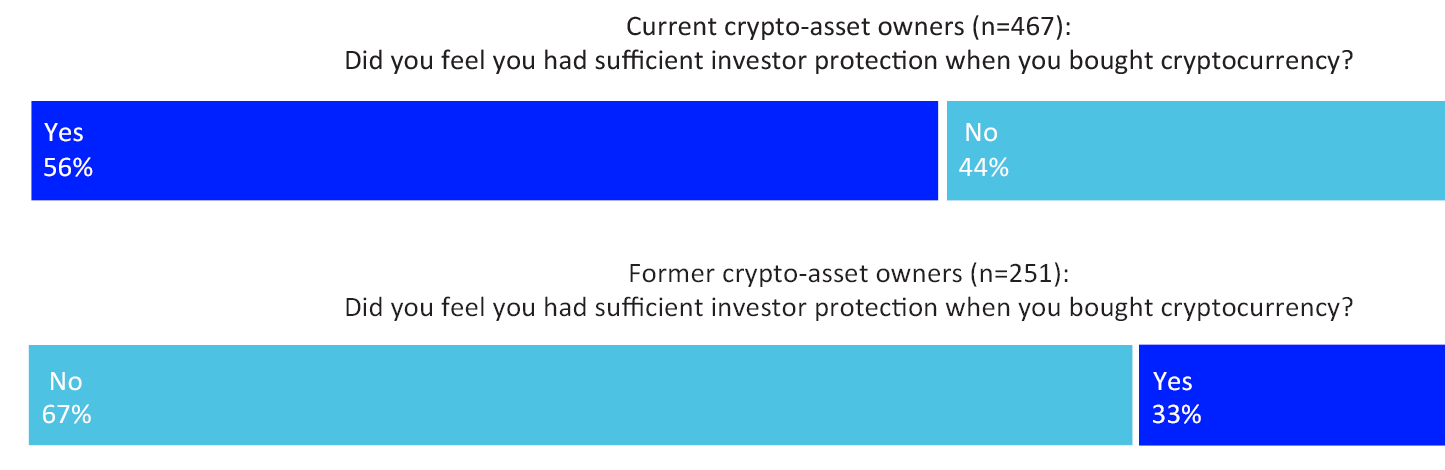
Over half of the respondents among current crypto-asset owners felt that they had experienced investor protection when purchasing crypto-assets. The situation is the reverse for those who have owned crypto-assets in the past, where two in three feel that they have not experienced sufficient investor protection. For the entire group of current and former crypto-asset owners, 52% answered “no” when asked whether they had experienced sufficient investor protection in connection with the purchase of cryptocurrency.
Respondents were also asked whether they were aware of the law on crypto-assets introduced in Norway last year, which came into force on 1 July 2025 (the Crypto-Assets Act30 ). Only 14% of all current and former crypto-asset holders answered “yes” to the question. This figure was 17% for current crypto-asset owners.
Figure 26 shows the results of follow-up questions relating to those familiar with DeFi.31 Of all those familiar with DeFi, a high proportion (74%) had never used DeFi.
Base: Those familiar with DeFi (n=335) in 2024 vs. (n=338) in 2026. It was possible to select multiple response options
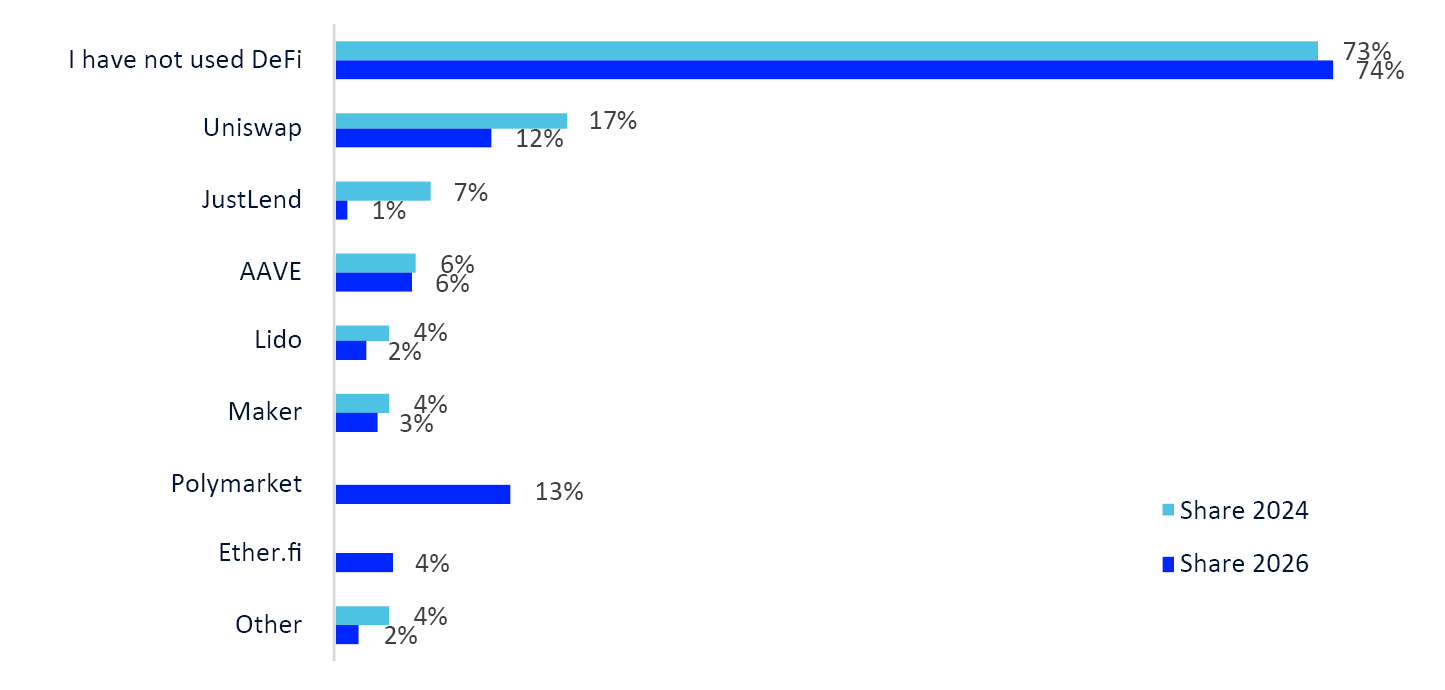
Respondents were also presented with some of the largest DeFi platforms and asked whether they had used them. Polymarket32 is the most widely used platform this year, followed by Uniswap. The most popular DeFi platform in 2024 was Uniswap (17% had used this platform).33
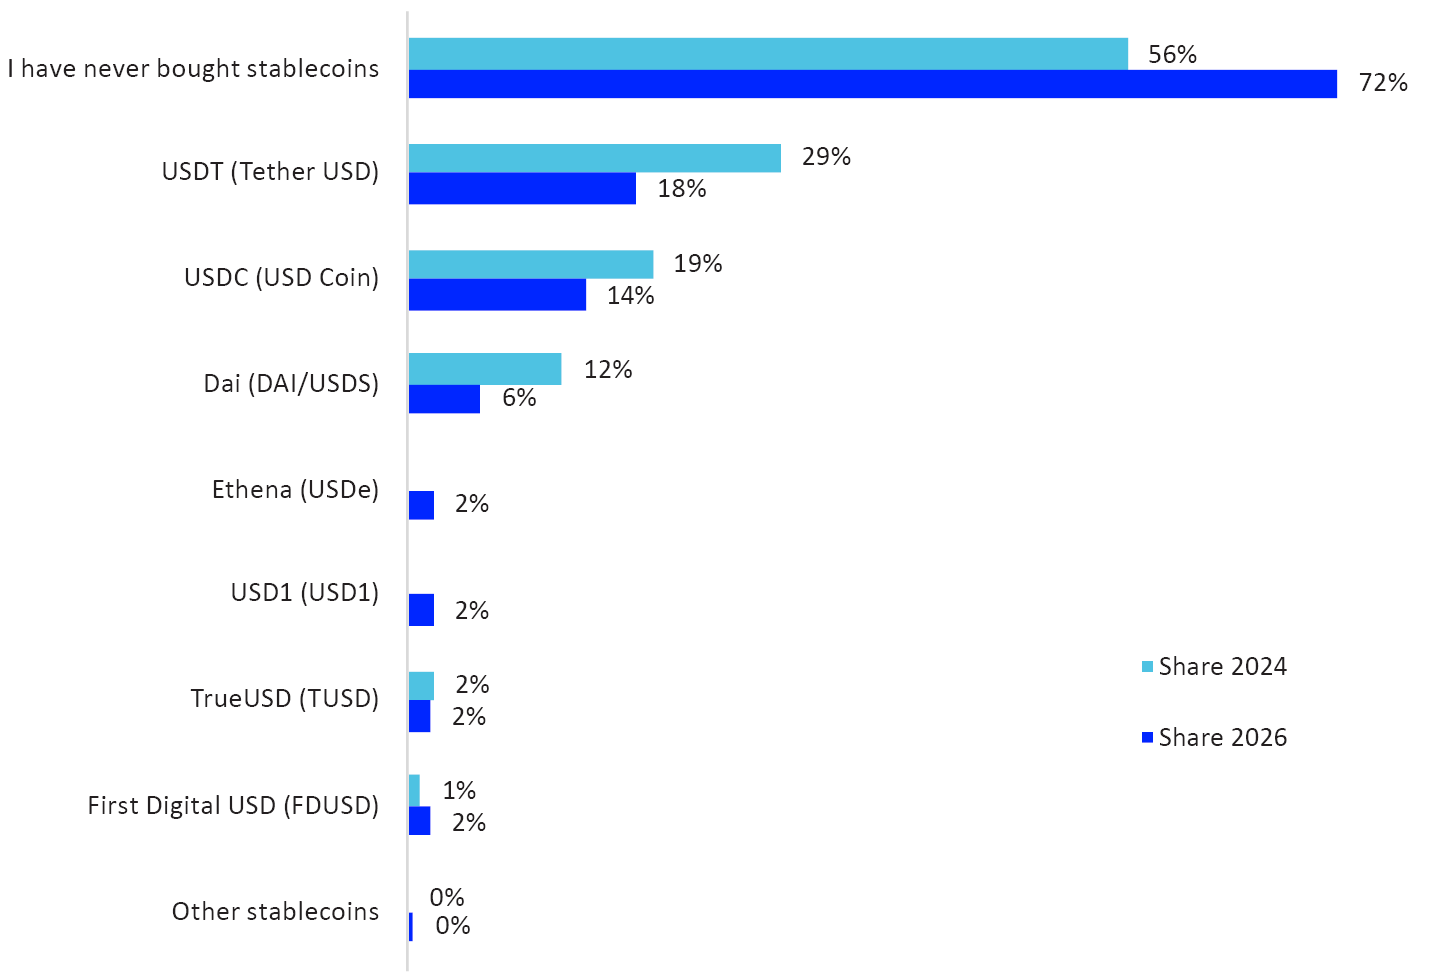
Those who replied that they were familiar with stablecoins (n=406) were asked whether they had purchased stablecoins. The results are shown in Figure 27.
Figure 27 shows that 72% of this group responded that they have never purchased stablecoins, up from 56% in 2024.34
The most popular stablecoin was Tether USD (18% of this group had experience of owning this stablecoin, which is also the largest in the world by market capitalisation), followed by USD Coin (14%).
Base: All those familiar with stablecoins (n=339) for 2024 and (n=406) for 2026. It was possible to select multiple response options
Those who replied that they had experience of buying stablecoins (n=112) were asked about the purpose of the purchase. Figure 28 shows that the three main reasons for buying stablecoins are for use in trading other cryptocurrencies (55%), for storing value (30%) and to learn more about and/or test the technology (22%). The order of the three main reasons is the same as in the 2024 findings. At the same time, there is a significant increase in the proportion who stated that the main reason was “For use when trading other cryptocurrencies” (up from 44% in 2024 to 55% in 2026).
Base: Those who bought stablecoins (n=112). It was possible to select multiple answers

Figure 29 shows the results based on a follow-up survey of those who stated that they are familiar with NFTs (n=53). Respondents were able to select multiple options. The most common reasons for owning NFTs are to use them as digital collectibles (60%) and as investment assets (42%). 1% of the population has experience with buying NFTs (not shown in the figure).
Figure 29 What NFTs are used for
|
Number of respondents |
Share of basis |
|
|---|---|---|
|
Basis: Alle de som kjenner til NFT (n=53) |
||
|
As digital collectables (in connection with art, gaming, etc.) |
32 |
60% |
|
As an investment |
22 |
42% |
|
To own physical assets (such as property, a car, etc.) |
6 |
11% |
|
Other |
3 |
6% |
Source: Norges Bank
22 Response option added in 2026.
23 See, for example, coinmarketcap.com.
24 The findings are significant.
25 The calculation method provides an estimate of the minimum value. The calculation is based on a weighted calculation of the minimum holding based on the minimum values in each interval/segment. For the group with a holding with a market value of NOK 10,000 or less, a holding of NOK 1 was assumed and multiplied by the size of the group. For the next group, with holdings of NOK 10,001–50,000, this was multiplied by an amount of NOK 10,001, and so on.
26 The Norwegian Tax Administration’s own estimates suggest that only 15 per cent of those who own cryptocurrency declare this in their tax return (see Norwegian Tax Administration, 2024).
27 To clarify the question, respondents were given the following explanation of financial savings: “By financial savings, we mean savings in the form of bank deposits or other financial assets such as shares.”
28 Note that this should not be interpreted as referring to the exchanges most frequently used, as the question does not specify this.
29 The term “investor protection” was not defined in more detail in the questionnaire, as was the case for 2024.
30 Act on Crypto-Assets (Crypto-Assets Act), Act No. 20 of 27 May 2025.
31 DeFi experienced a significant decline in market value in April 2026, but this occurred after the data collection and therefore does not affect the findings here.
32 Polymarket and Ether.fi were included in the response options for the first time this year; therefore, there is no reference to them in the 2024 survey.
33 Uniswap is a decentralised platform launched in 2018. Uniswap is a popular platform used as an AMM (“Automatic Market Maker”). More information on this platform can be found in Norges Bank (2024).
34 This increase must be seen in the context of the proportion of the population aware of stablecoins having risen from 10% in 2024 to 19% in 2026.
4. Concluding remarks
This is the second time Norges Bank has conducted such a survey. To date, this is the most detailed study of individuals’ ownership, knowledge of and experiences with crypto-assets in Norway. The survey complements other surveys conducted by private and public sector organisations; see, for example, K33 Research (2026 and 2025) and the Norwegian Tax Administration (2026 and 2024).
Our survey provides information on individual crypto-asset holders in Norway. It does not cover institutional investors’ ownership and use of crypto-assets. The findings can be used in conjunction with findings from other data sources, which can provide a useful diversity in terms of methodology, data sources and scope of analysis.
References
K33 Research (2026). Nordic Crypto Adoption Survey 2026. Available at: K33.
K33 Research (2025). Nordic Crypto Adoption Survey 2025. Available at: K33.
Financial Conduct Authority (2025). Research Note: Cryptoassets consumer research 2025 (Wave 5). Available at: FCA.
Act on Crypto-Assets (Crypto-Assets Act), Act No. 20 of 27 May 2025, in force from 1 July 2025. Available at: Lovdata.
Norges Bank (2024). Survey on crypto-assets. Norges Bank Memo 2/2024. Available at: Norges Bank.
Norwegian Tax Administration (2026). Most crypto-asset owners in the largest cities – significant differences between municipalities. Press release, published 19 April 2026. Available at: Norwegian Tax Administration.
Norwegian Tax Administration (2024). 48,155 have declared that they own cryptocurrency – the Norwegian Tax Administration believes many are unaware that this must be declared in their tax return. Press release, published 22 April 2024. Available at: Norwegian Tax Administration.
Appendix
Appendix A: Questionnaire
|
No. |
Question |
|---|---|
|
1 |
Have you heard of cryptocurrency? |
|
2 |
Have you heard of the following cryptocurrencies? Select as many as you like. |
|
3 |
Which of the following cryptocurrencies do you think you will acquire (either for the first time or buy more of if you already own some)? Select as many as you like. |
|
4 |
Have you ever owned Bitcoin or any other cryptocurrency? |
|
5 |
How much do you know about cryptocurrency? |
|
6a |
Have you heard of DeFi (“Decentralised finance”)? |
|
6b |
Have you used the following DeFi platforms/protocols? Select as many as you like. |
|
7a |
Have you heard of stablecoins? |
|
7b |
Have you ever bought any of the following stablecoins? Select as many as you like. |
|
8 |
Why did you buy stablecoins? Select as many as you like |
|
9 |
Why haven’t you bought cryptocurrency? |
|
10 |
What regulatory measures would make it more likely for you to buy cryptocurrency? Select as many as you like. |
|
11 |
Do you still own cryptocurrency? |
|
12 |
Have you ever sold cryptocurrency? |
|
13 |
Around when did you buy cryptocurrency for the first time? If you don’t remember exactly, give your best estimate. |
|
14 |
How satisfied are you with your investment in cryptocurrency? I am… |
|
15a |
Have you had any negative experiences related to cryptocurrency? |
|
15b |
What negative experiences have you had with cryptocurrency? |
|
16 |
Did you feel that you had sufficient investor protection when you bought cryptocurrency? |
|
17 |
Which cryptocurrencies do you own? |
|
18a |
Have you ever bought an NFT (non-fungible token)? |
|
18b |
How do you use/did you use NFTs? Select as many as you like. |
|
19 |
How much is your current cryptocurrency holding, in Norwegian kroner? |
|
20 |
Approximately what proportion of your financial savings is in cryptocurrency? By financial savings, we mean savings in the form of bank deposits or other financial assets such as shares. |
|
21 |
How do you intend to change your cryptocurrency holdings over the next few years? |
|
22 |
How do you pay for cryptocurrency? |
|
23 |
What influences your cryptocurrency holdings? |
|
24 |
Where do you usually buy and sell cryptocurrency? |
|
25* |
Are you familiar with the new crypto-asset law in Norway coming into force in 2025? |
|
A |
Gender |
|
B |
What is your age? |
|
C |
Where do you live? |
|
D |
What is the highest level of education you have completed? |
|
E |
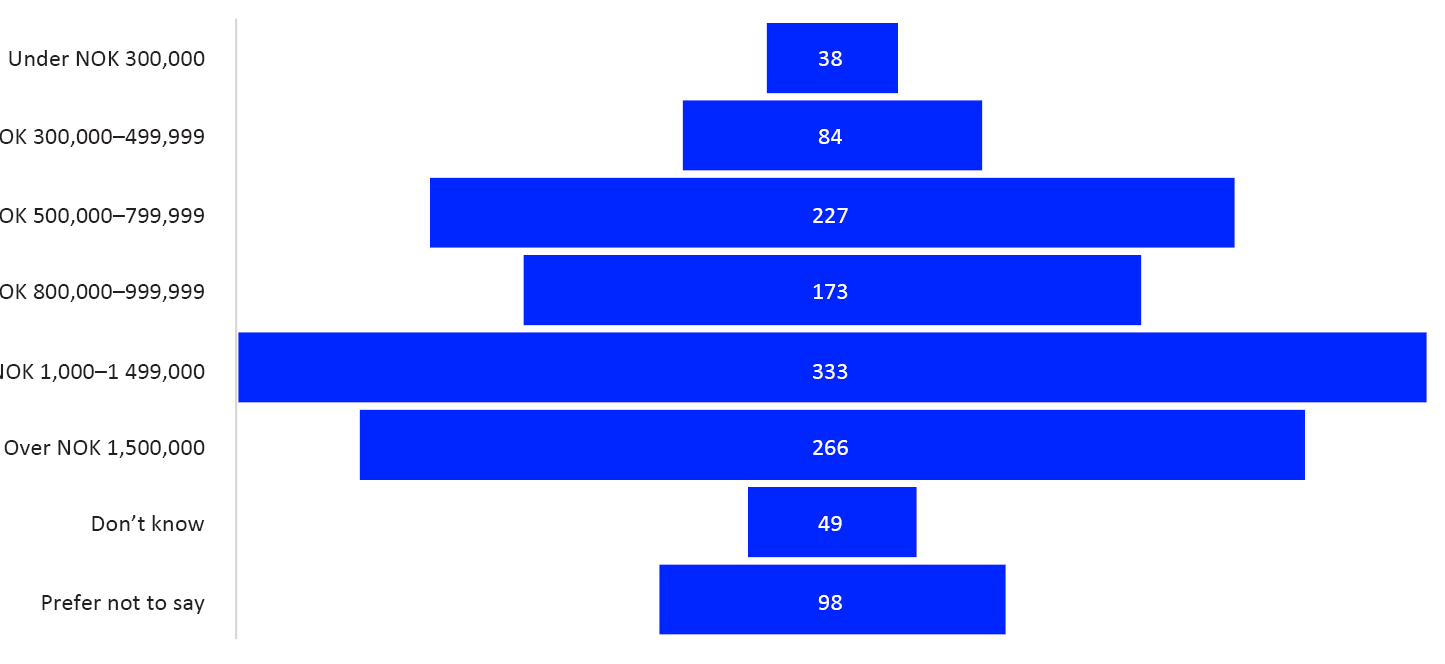
What is your household’s total gross income? |
|
F* |
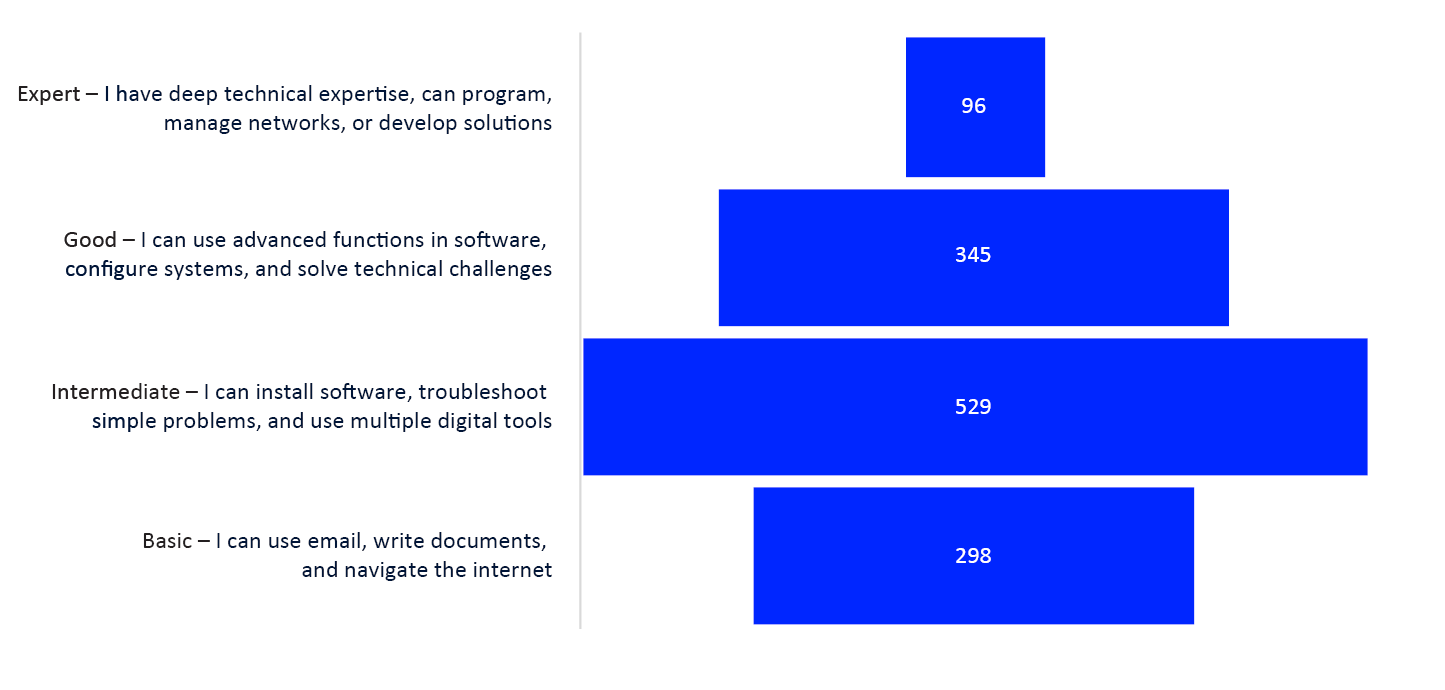
How would you describe your IT skills? |
* New questions
Appendix B: Description of the main sample
The figures below describe the main sample according to several parameters, such as age group, place of residence, total gross household income and IT skills.
Number. Base: Main sample (n=1268, unweighted)

Figure 31 Distribution of respondents by place of residence
Number. Base: Main sample (n=1268, unweighted)
|
Where the respondent lives |
Number |
|---|---|
|
Agder (Aust-Agder, Vest-Agder) |
53 |
|
Akershus |
209 |
|
Buskerud |
75 |
|
Finnmark |
11 |
|
Inland (Hedmark, Oppland) |
54 |
|
Møre og Romsdal |
44 |
|
Nordland |
58 |
|
Oslo |
228 |
|
Rogaland |
99 |
|
Telemark |
29 |
|
Troms |
41 |
|
Trøndelag |
124 |
|
Vestfold |
65 |
|
Western Norway (Hordaland, Sogn and Fjordane) |
143 |
|
Østfold |
35 |
Number. Base: Main sample (n=1268, weighted)
Number. Base: Main sample (n=1268, weighted)