
Norges Bank’s Monetary and Financial Stability Committee decided unanimously to keep the policy rate unchanged at 4% at its meeting on 25 March. The Committee’s current assessment of the inflation outlook implies that it will likely be appropriate to raise the policy rate at one of the forthcoming monetary policy meetings.
The Monetary Policy Statement provides the background for the monetary policy decision taken by the Monetary Policy and Financial Stability Committee on 25 March 2026 and the Committee’s assessment of the monetary policy outlook. A summary of the deliberations leading to the monetary policy decision is published at the same time as the monetary policy decision at norges-bank.no.
Norges Bank is tasked with keeping inflation low and stable. The operational target is inflation of close to 2% over time. We are also mandated to help keep employment as high as possible and to promote economic stability.
In recent years, the tightening of monetary policy has contributed to cooling down the Norwegian economy and to dampening inflation. Last year, the policy rate was reduced from 4.5% to 4%. Since the monetary policy meeting in December, the Committee has noted the following:
- Inflation has been markedly higher than projected. At the same time, wage growth is projected to be higher this year than projected in December, which will likely restrain disinflation ahead. On the other hand, the krone has appreciated considerably. A stronger krone will dampen imported goods inflation.
- Capacity utilisation in the Norwegian economy appears to be holding steady at close to a normal level. Unemployment has been slightly lower than projected in December. Nonetheless, Norges Bank’s Regional Network contacts report that it has become a little easier to recruit.
- The war in the Middle East has led to high volatility in energy and financial markets. Oil and gas prices have increased sharply. At the same time, global equity indices have declined, and interest rates have increased both abroad and in Norway. Higher energy prices will likely reduce global growth and push up inflation both abroad and in Norway.
The job of tackling inflation has not been fully completed. The Committee placed emphasis on the fact that inflation has remained above target for several years now and that there are prospects for higher inflation ahead than previously projected. High inflation over time can lead firms and households to plan for greater inflation persistence. Inflation may then become entrenched.
The Committee judges that a tighter monetary policy stance is needed to return inflation to target within a reasonable time horizon. The inflation outlook indicates that an increase in the policy rate will likely be required. At the same time, the unexpected high inflation in recent months makes it difficult to assess underlying inflation pressures, and the uncertainty surrounding oil and gas prices is unusually elevated. The Committee therefore wants to await further information on the prospects for inflation.
The Committee decided to keep the policy rate unchanged at this meeting. The outlook is associated with substantial uncertainty, but if the economy evolves broadly as currently envisaged, the policy rate will likely be raised at one of the forthcoming meetings.
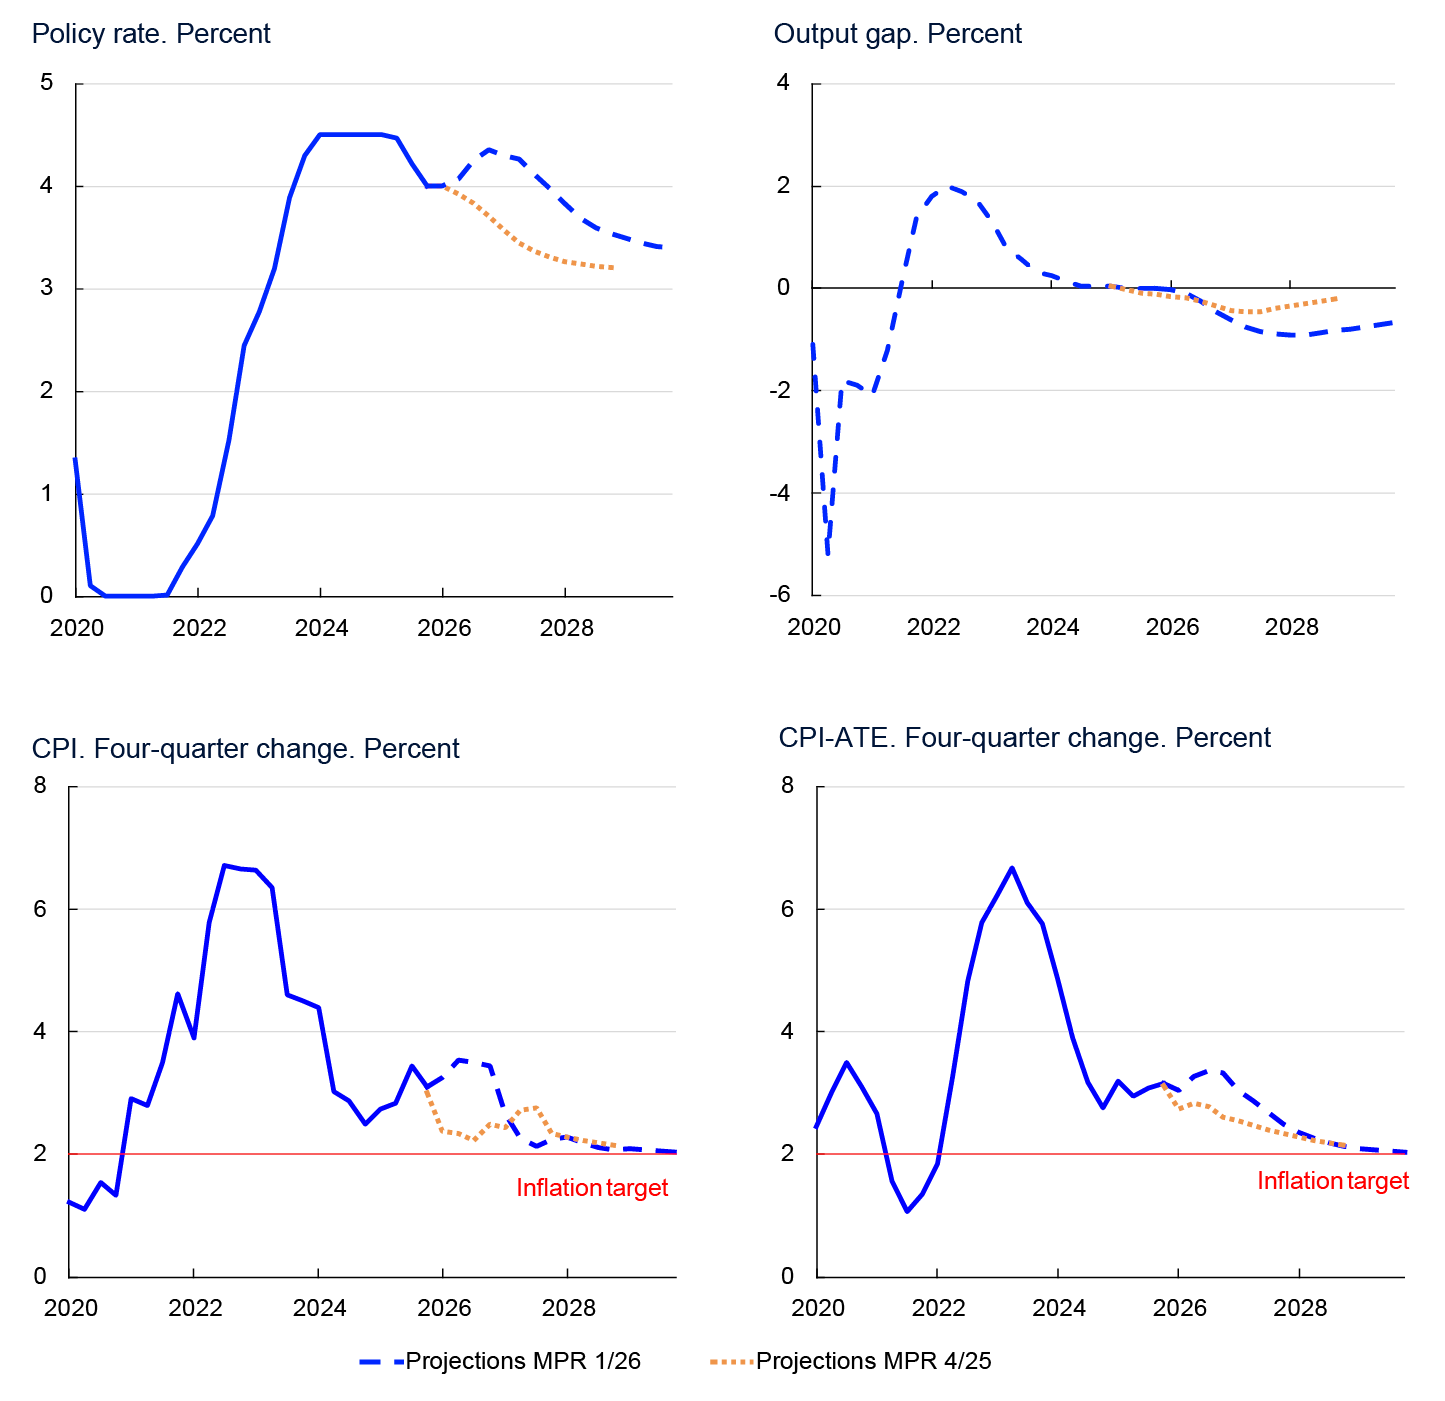
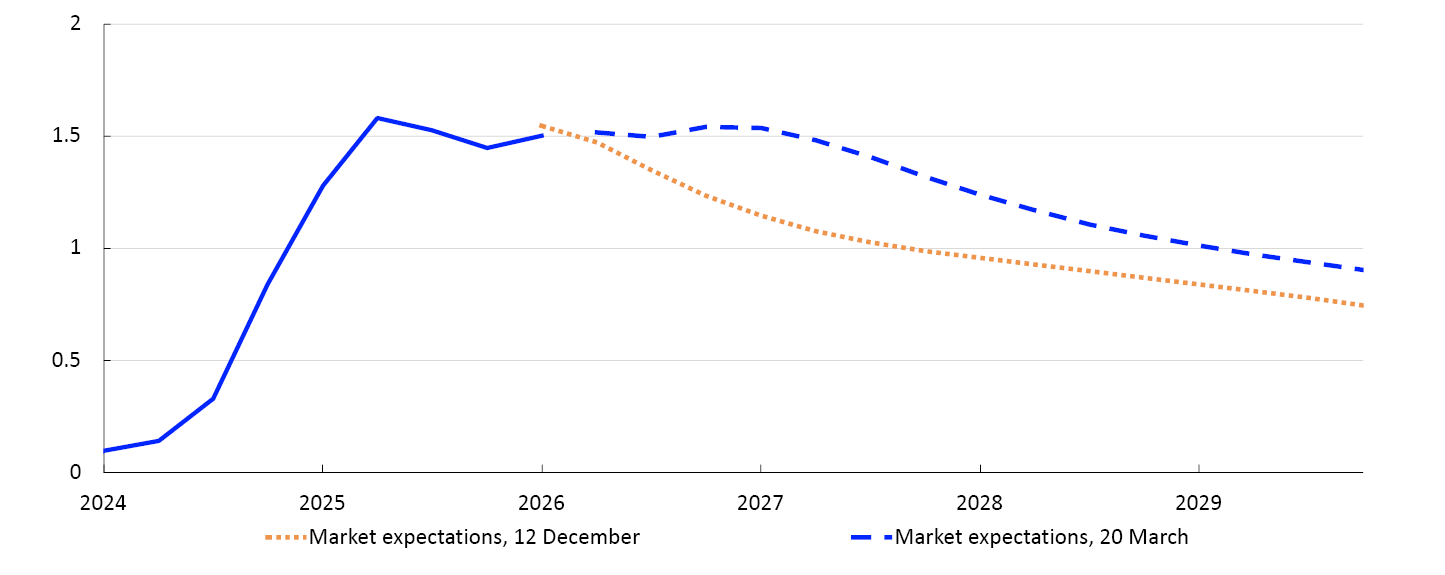
The policy rate forecast has been revised up since December and indicates an increase in the policy rate to between 4¼% and 4½% by the end of this year.
With a policy rate in line with the forecast, inflation is expected to decline from next year and reach 2.0% in 2029. A higher policy rate will cool the economy somewhat, and registered unemployment is projected to edge somewhat higher to around pre-pandemic levels.
The future path of the policy rate will depend on economic developments. The outlook is subject to greater uncertainty than normal due to the war in the Middle East. There have recently been wide swings in energy prices and the krone exchange rate. If energy prices remain elevated or move higher, inflation pressures may build up further. On the other hand, energy prices may fall back faster if the war ends swiftly and there is limited damage to infrastructure. At the same time, the krone could depreciate again should oil prices fall or financial market turbulence increase.
If the outlook indicates higher inflation than currently projected, a higher policy rate than currently envisaged may be required. If labour market conditions become weaker than projected or the outlook indicates a faster decline in inflation to target, the policy rate may become lower than currently envisaged.
Ida Wolden Bache
Pål Longva
Øystein Børsum
Hilde C. Bjørnland
Steinar Holden
25 March 2026
- 1 The output gap measures the percentage deviation between mainland GDP and projected potential mainland GDP. CPI-ATE: the CPI adjusted for tax changes and excluding energy products.
1. Overall picture
This section presents the overall picture of the Norwegian economy and discusses Norges Bank’s assessment of economic developments, with particular weight on the current economic situation, the near-term outlook, the policy rate decision and forecast and finally the economic outlook in the light of interest rate developments. In the box at the end of this section, key uncertainty and risk factors are described that may result in different economic developments than projected in this Report.
The war in the Middle East is adding to the uncertainty about both global and domestic inflation and growth prospects. In Norway, inflation has remained at around 3% for more than a year. Unemployment has risen from low levels following the pandemic but has changed little since autumn 2025. The policy rate forecast indicates a policy rate increase to between 4¼% and 4½% by the end of 2026. Inflation is projected to return to the 2% target in 2029. Registered unemployment is expected to edge somewhat higher to around pre-pandemic levels.
Sustained international activity despite turbulence
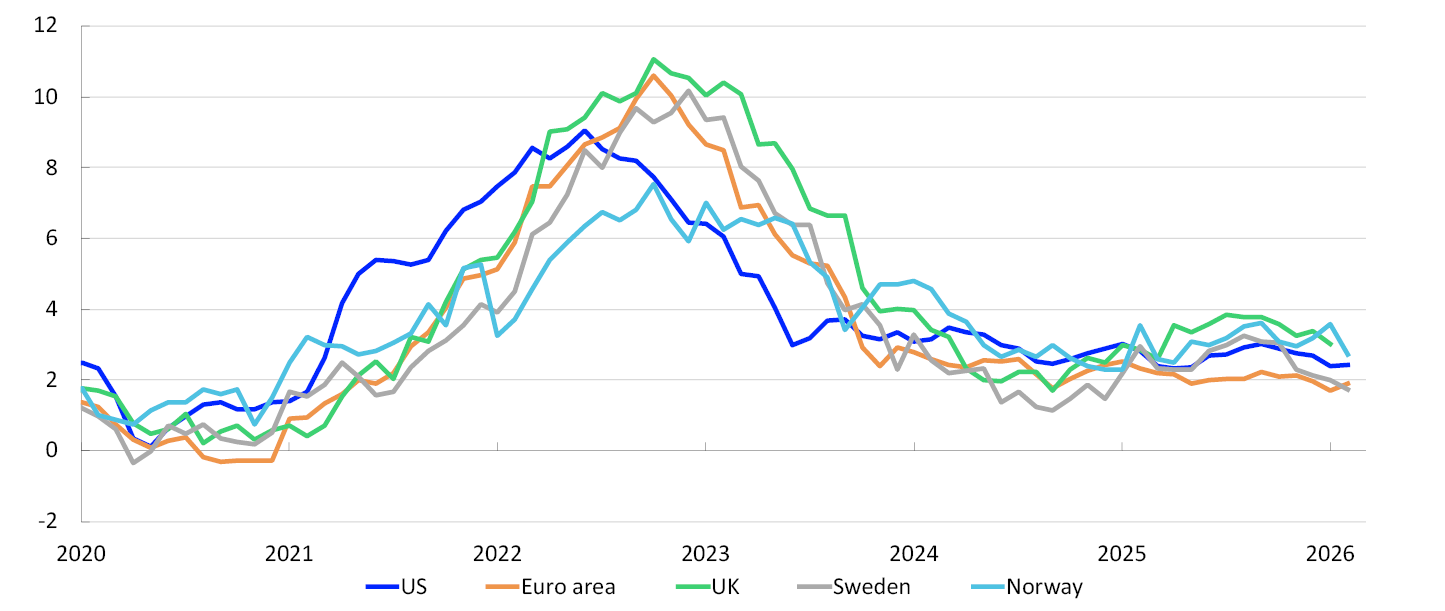
In 2025, the world economy was marked by geopolitical tensions and frequent changes in US trade policy. Economic activity nevertheless remains sustained among our main trading partners, where growth in 2025 was higher than expected. International inflation fell rapidly from high levels in the wake of the pandemic, and Swedish and euro area inflation is close to their targets (Chart 1.1). Inflation in the UK and the US is still higher than 2%.
CPI. Twelve-month change. Percent1
Economic activity remains sustained among our main trading partners.
In recent weeks, military strikes in the Middle East have triggered substantial movements in energy and commodity markets. Oil and gas prices have risen considerably (Chart 1.2). Market interest rates have risen, and market pricing now points to policy rate hikes among a number of Norway’s trading partners.
Daily figures. Futures prices to end-2029

Economic growth among Norway’s main trading partners is expected to slow in 2026. Higher oil and gas prices are likely to dampen growth and fuel inflation. On the other hand, increased defence spending and AI-related investment are likely to boost economic activity. At the same time, there are prospects that lower wage growth will contribute to curbing inflation ahead.
Inflation in Norway is above the 2% target
In Norway, inflation declined markedly through 2023 and 2024 but has since changed little. Excluding energy prices, which can fluctuate widely from one month to the next, inflation has been close to 3% since the end of 2024. In February, the 12-month rise in the consumer price index (CPI) was 2.7%. CPI inflation adjusted for tax changes and excluding energy products (CPI-ATE) was 3.0% in February. In both January and February, inflation was higher than projected in December.
Inflation excluding energy prices has been close to 3% since the end of 2024.
Higher energy prices are expected to push up overall inflation in 2026. The projections for underlying inflation are adjusted upwards for 2026 and 2027. Stronger underlying price pressures push up inflation in the near term. Higher commodity prices and supply chain disruptions owing to the war in the Middle East are expected to drive up imported consumer and intermediate goods inflation. This will contribute to higher inflation in particular towards the end of 2026 and through 2027.
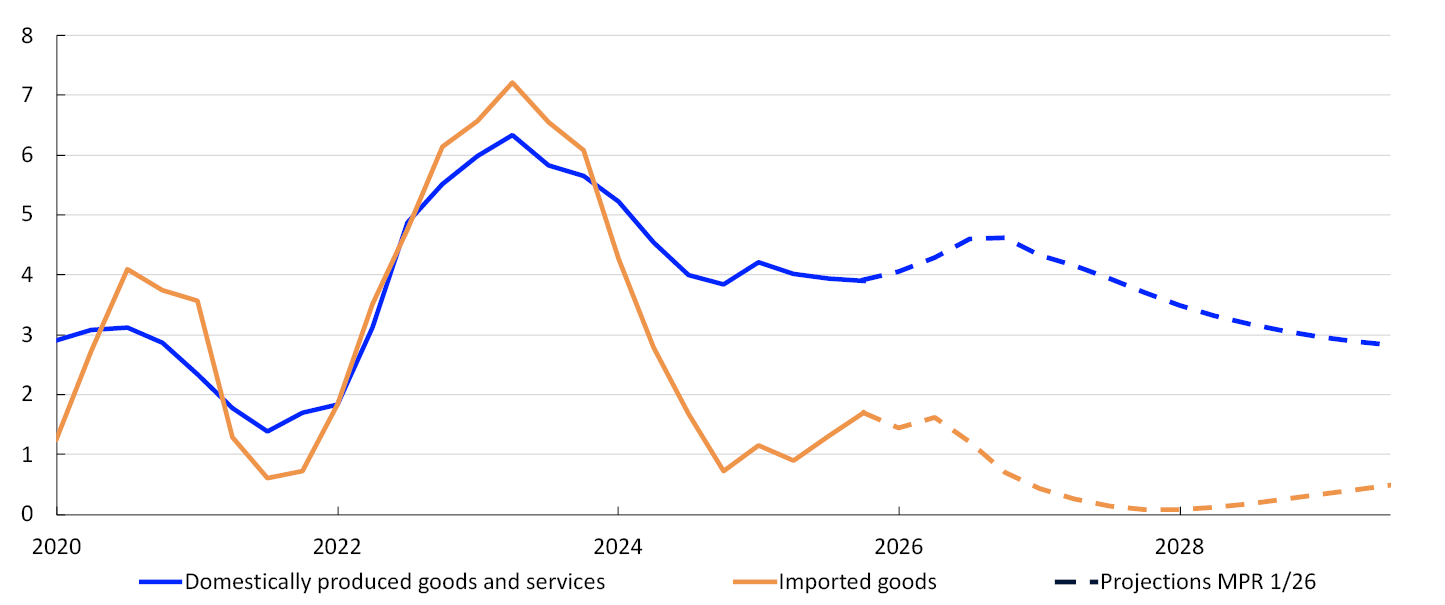
High growth in business costs is sustaining the rise in prices for domestically produced goods (Chart 1.3). Annual wage growth was 4.9% in 2025, in line with the projection in the December Report. Wage growth is expected to be lower in 2026 than in 2025, but higher than previously projected. In addition, rent inflation is expected to increase more than previously assumed.
CPI-ATE. Four-quarter change. Percent2
Since the December Report, the krone exchange rate has appreciated and been stronger than assumed. A stronger krone reduces prices for imported goods. In isolation, this will dampen inflation in Norway.
Household consumption lifts economic growth
High inflation and higher interest rates contributed to restraining the economy in the wake of the pandemic. Developments were particularly weak in the most interest rate sensitive sectors of the economy, but public sector demand, exports and petroleum investment contributed to sustaining activity.
The economic situation has since changed. Two years of solid growth in household disposable income have contributed to a pickup in consumption growth. Housing investment has also risen slightly from a low level. At the same time, the expansion in petroleum investment has likely passed.
Two years of solid growth in household disposable income have contributed to a pickup in consumption growth.
Mainland economic activity was slightly higher in 2025 than projected in the December Report and Norges Bank’s Regional Network contacts expect growth to remain close to current levels. The impact of higher oil and gas prices will likely be uneven across different sectors of the Norwegian economy but the overall effect on economic activity is expected to be limited. Mainland GDP is projected to grow by 1.4% in 2026, which is lower than in 2025, but slightly higher than projected in the December Report.
Small changes in unemployment
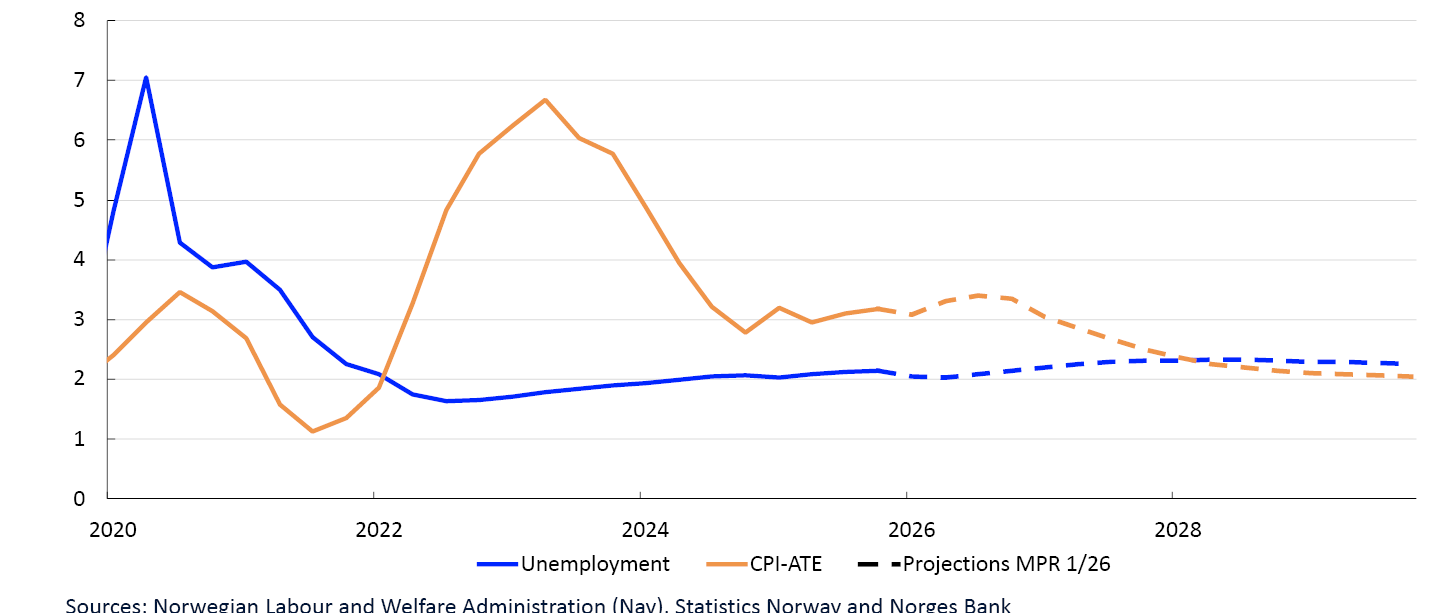
Unemployment has risen from low levels following the pandemic but is little changed since autumn last year. In February, 2.1% of the labour force was registered as fully unemployed by the Norwegian Labour and Welfare Administration (Nav), adjusted for normal seasonal variations, which was a little lower than projected in the December Report. The Labour Force Survey (LFS) indicates that unemployment has risen somewhat more over time, partly reflecting an increase in the number of young entrants to the labour market. Nonetheless, LFS unemployment has also changed little over the past six months.
At the same time, the number of employed has increased. Measured as a share of the population, employment has declined slightly over the past three years but is nevertheless appreciably higher than pre-pandemic levels (Chart 1.4). Capacity utilisation in the economy is assessed to have declined through 2023 and since remained close to a normal level.
Employment to population ratio. Aged 15–74. Percent3

Capacity utilisation in the economy is assessed to have declined through 2023 and since remained close to a normal level.
The policy rate will likely be raised at one of the forthcoming monetary policy meetings
In discussing the monetary policy stance, the Monetary Policy and Financial Stability Committee placed emphasis on the fact that inflation has remained above target for several years now and that there are prospects for higher inflation ahead than previously projected. High inflation over time may lead firms and households to plan for greater inflation persistence. Inflation may then become entrenched.
The Committee judges that a tighter monetary policy stance is needed to return inflation to target within a reasonable time horizon. The inflation outlook indicates that an increase in the policy rate will likely be required. At the same time, the unexpected high level of inflation in recent months makes it difficult to assess underlying inflation pressures, and the uncertainty surrounding future developments in oil and gas prices is higher than normal. The Committee therefore agreed to await further information on the prospects for inflation.
The Committee decided to keep the policy rate unchanged at this meeting. If the economy evolves broadly as envisaged in this Report, the policy rate will likely be raised at one of the forthcoming monetary policy meetings. The policy rate forecast has been revised up since the December Report and indicates an increase in the policy rate to between 4¼% and 4½% by the end of 2026.
Prospects for lower inflation further out
With a policy rate path in line with the forecast, inflation is expected to decline from next year and reach 2.0% in 2029 (Chart 1.5). A higher policy rate will cool the economy somewhat, and registered unemployment is projected to edge somewhat higher to around pre-pandemic levels.
CPI-ATE. Four-quarter change. Registered unemployment. Percent4
Wages are expected to rise faster than prices ahead, with a continued strengthening of household purchasing power in the coming years. This will likely contribute to a further increase in private consumption. Housing investment is also projected to rise and employment to increase in the years ahead. The employment ratio is expected to remain stable in the coming year, before rising slightly towards the end of the projection period.
- 1 Figures for Sweden are CPIF (Consumer price index with a fixed interest rate).
- 2 CPI-ATE: the CPI adjusted for tax changes and excluding energy products.
- 3 Employment is the number of employed workers according to the quarterly national accounts (QNA) less non-resident workers (from the statistics on the number of jobs and wages).
- 4 CPI-ATE: the CPI adjusted for tax changes and excluding energy products.
Uncertainty and risk
Since the outbreak of the war in the Middle East in late February, oil and gas prices have soared, with large daily swings (Chart 1.A). Other commodity prices have also increased. This has added to the uncertainty about domestic and international economic developments.
Uncertainty indicators1
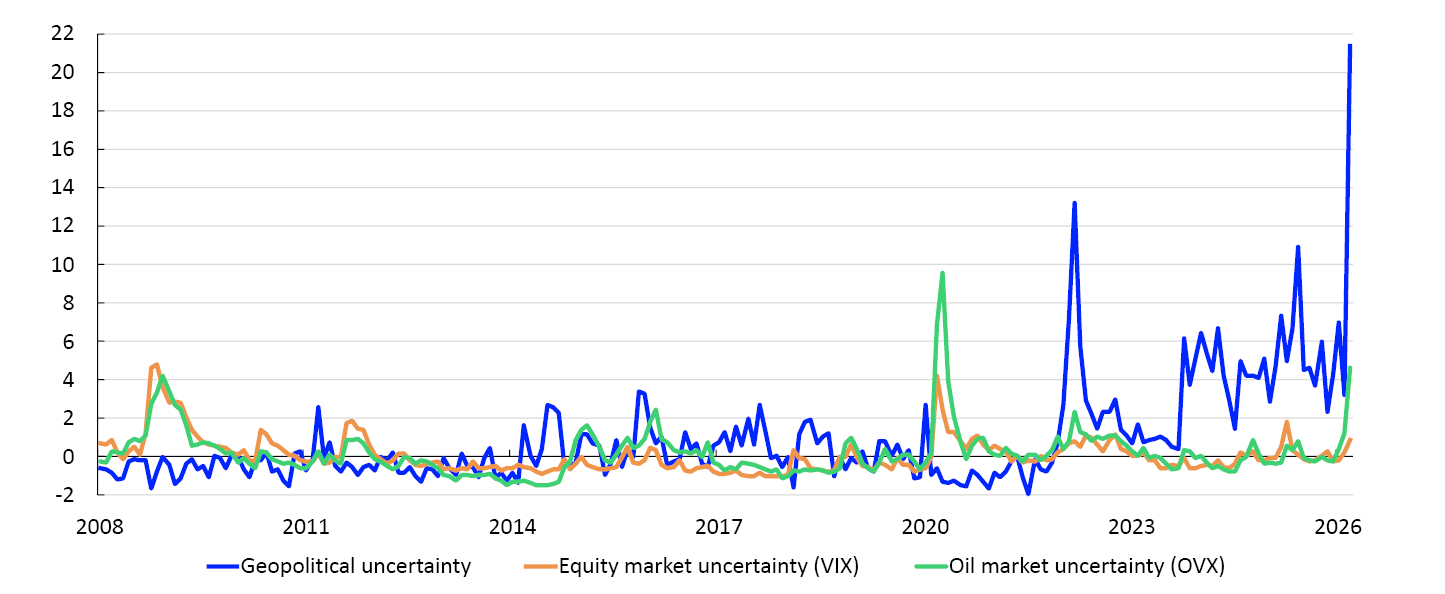
The projections of energy and commodity prices are based on futures prices. Futures prices indicate that oil and gas prices will decline somewhat ahead but will remain higher than in the December Report in the coming years. The range of outcomes is wide, and depending on how the war in the Middle East evolves, oil and gas prices could fall, increase or remain elevated for longer than currently indicated by market pricing.
On the one hand, higher energy prices will dampen economic activity among Norway's main trading partners, which will in turn reduce demand for Norwegian goods exports. Higher commodity prices could also dampen investment activity in parts of the Norwegian economy as a result of higher input prices and heightened uncertainty. On the other hand, higher prices for oil and other Norwegian commodity exports will improve profitability for parts of the export industry and boost petroleum investment. In the projections in this Report, the overall effects on activity in the Norwegian economy are limited, but there is considerable uncertainty as to which of these effects will dominate. Should oil and gas prices continue to rise or remain elevated for longer than market pricing indicates, more projects could become profitable and lead to higher petroleum investment than currently expected. At the same time, the effects on the global economy may prove to be more pronounced than currently envisaged and give rise to stronger negative growth impulses to the Norwegian economy.
Persistently high energy prices could also increase global cost pressures and drive up inflation for both domestically produced goods and imported intermediate and consumer goods. Elevated energy prices exert direct upward pressure on consumer prices even though the fixed electricity price scheme "Norgespris" dampens the impact on Norwegian households. Elevated energy prices also raise firms’ costs and may result in higher prices for other goods and services. The potential size of the cost increase for firms is uncertain, as is the strength of the pass-through to prices for other goods and services. The overall effects depend on the size and duration of the increase in commodity prices. A more rapid decline than implied by futures prices could lead to a weaker pass-through than currently projected. However, if energy and commodity prices remain elevated for longer, firms’ costs could increase more than currently assumed.
There is also uncertainty associated with underlying inflation pressures. The unexpected high level of inflation in recent months makes it difficult to assess underlying inflation pressures. At the same time, developments in inflation expectations and their impact on inflation are uncertain. After inflation declined rapidly through the second half of 2023 and much of 2024, underlying inflation has been around 3% over the past year. Inflation expectations have come down from the peak but are still above the inflation target in the medium and long term (Chart 1.B). Should inflation expectations become entrenched at a higher level, it may become more difficult to bring about a sustainable return to target.
Twelve-month change. Percent2
A decline in wage growth from 4.9% in 2025 to 3.4% in 2029 is an important precondition to bring inflation towards 2% in Norges Bank’s projections. These developments are highly uncertain. Historically, periods of high oil prices have contributed to export profitability and higher wage growth, which may push up wage growth more than projected. At the same time, the social partners and Regional Network contacts expect markedly lower wage growth in 2026 than in 2025 and lower than projected by Norges Bank. In addition, contacts report a looser labour market, suggesting wage growth may move down faster than assumed in this Report.
- 1 The index for geopolitical risk is based on Caldara, D. and M. Iacoviello (2022), “Measuring Geopolitical Risk”, American Economic Review. 112 (4), pp 1194–1225. Data for the index is available on the Economic Policy Uncertainty Index. The figures are normalised by deducting from the average and dividing by the standard deviation. The average and standard deviation are calculated for the period between 2008 and 2019. VIX is a measure of the market’s expectations of future volatility in US equity prices (S&P 500). OVX is a measure of market expectations of future volatility in oil prices (WTI). For March, average daily figures up to and including 20 March 2026 are used.
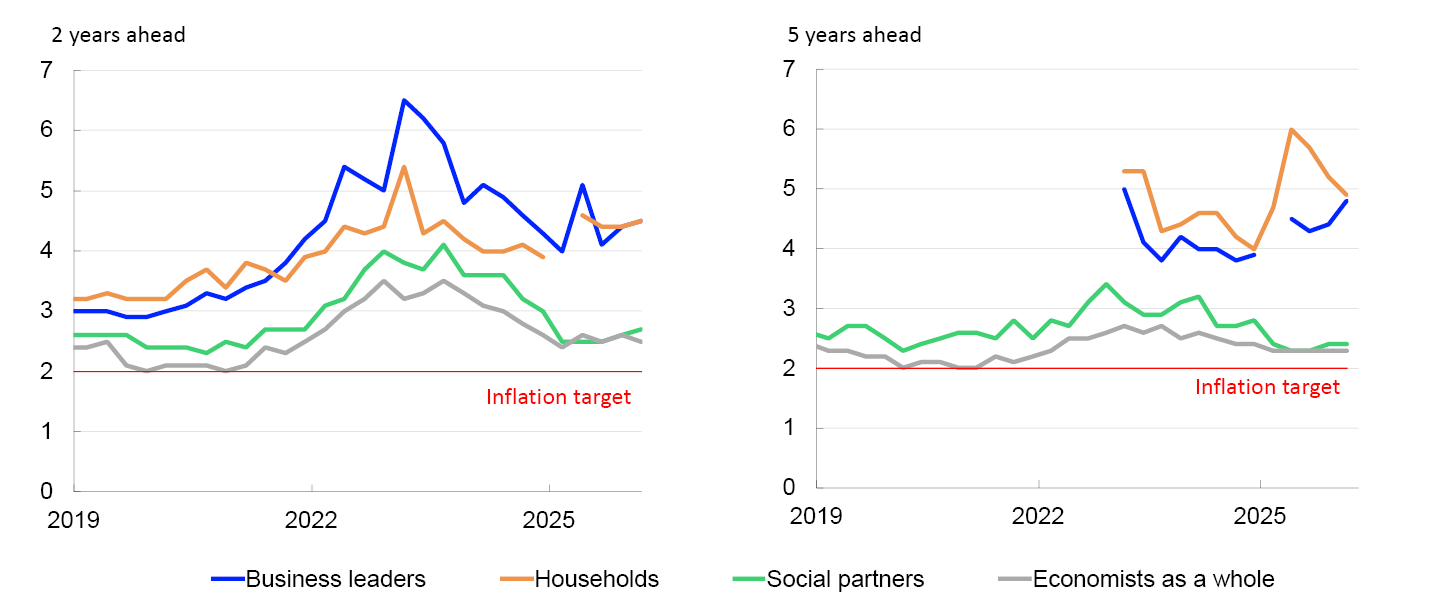
- 2 In 2023 Q1, households and business leaders were asked for the first time about expected inflation 5 years ahead. The observation for households for 2025 Q1 is omitted due to a different set of questions in the survey for 2025 Q1.
2. Assumptions and projections
This section presents the key assumptions and projections underlying the policy rate decision and the monetary policy analysis. It also describes how new data, analyses and assessments have influenced the projections since the previous Report. The projection period in this Report is between 2026 Q1 and 2029 Q4. The underlying data is available in an independent dataset that is published separately.
International economy
Following rapid economic growth in the first post-pandemic years, growth among trading partners was slow in 2023 and 2024. Inflation was high, and central banks increased rates sharply in 2023. Over the course of 2024, inflation declined, central banks were able to reduce policy rates and growth in economic activity picked up. Growth remained elevated through 2025 despite changes in US trade policy and international political tensions. Trading partner growth in 2025 was stronger than projected and was supported by both expansionary fiscal policy and investment in AI-related technology.
There have been large movements in energy markets following the outbreak of the war in the Middle East. Oil and gas prices have risen considerably (see “Energy and other commodity prices”). As a result, short-term market inflation expectations have increased markedly, leading to a sharp rise in international policy rate expectations. In the euro area, Sweden and the UK, market pricing now indicates that policy rates will be raised in the course of the year. The US policy rate is not expected to change this year (Chart 2.1). International equity indices have fallen and credit premiums have risen somewhat, reflecting heightened uncertainty about the economic outlook and lower growth expectations resulting from higher energy prices.
Policy rates and estimated forward rates. Percent1

Annual change. Percent2
Overall, economic growth is expected to be lower in 2026 and 2027 than in 2025, before edging up again in the final years of the projection period (Chart 2.2). The projections are based on the following:
- Higher prices for energy and some other commodities will dampen economic activity, particularly in Europe. This is also likely the case for disruptions in global supply chains related to eg the production of metals and artificial fertilisers. Overall growth prospects for Norway’s main trading partners in 2026 and 2027 have been revised down compared with the December Report, partly owing to the war in the Middle East. The projections are based on energy futures prices at 20 March.
- So far, the negative effects of higher tariffs have been limited, but the consequences have likely not yet been fully exhausted. In February, the US Supreme Court ruled that the tariffs imposed under the Emergency Economic Powers Act (IEEPA) are unlawful. A new global tariff of 10% has been imposed, but overall US import tariffs are slightly lower than assumed in the December Report. The projections are based on the tariffs in effect on 20 March.
- In the euro area, higher oil and gas prices will likely dampen growth in 2026 and 2027, followed by higher expected growth towards the end of the projection period.
- In the coming years, higher growth is expected in Sweden, where developments were weak for several years and unemployment has increased. The growth projections in this Report have been revised up to reflect expansionary fiscal policy related to both defence and infrastructure investment.
- In the UK, lower GDP growth is expected in the coming year as a result of higher energy prices. Stronger growth in private consumption and higher private investment will likely push up growth towards the end of the projection period.
- US growth is projected to remain firm in 2026 despite higher tariffs from 2025 and reduced labour supply as a result of stricter immigration policies. AI-related investment and an expansionary fiscal policy will support growth. Productivity growth has recently been unexpectedly high and is also expected to remain high ahead. Growth projections have been revised up slightly since the December Report for the entire projection period.
- In China, growth is projected to decline slightly from 2025 to 2026. Domestic demand will likely be dampened by sluggish growth in private investment and household consumption. Chinese goods exports have increased over the past year and have been higher than expected, even though trade with the US has fallen markedly. Chinese high-tech goods exports are expected to continue to expand. Low residential construction, a shrinking labour force and persistently weak growth in private consumption will likely weigh down on growth further out in the projection period.
Consumer price inflation among Norway’s main trading partners has slowed substantially in recent years. In the euro area and Sweden, inflation is now close to their 2% targets, while inflation in the UK and the US remains higher. Goods inflation is low and back to pre-pandemic levels in most countries, but higher tariffs have contributed to a renewed pickup in goods inflation in the US. Energy consumer price inflation will likely increase considerably ahead, particularly in Europe. Services inflation remains high, particularly in the UK and US, partly because post-pandemic wage increases were substantial. Nevertheless, international wage growth has slowed since 2023 and is expected to decline further in the coming years. Overall, the projections for underlying inflation are little changed since the December Report. The projections are based on the following:
- Higher oil and gas spot and futures prices will result in higher energy consumer price inflation ahead, and prices for some other commodities and freight rates have also risen. Underlying inflation is expected to rise somewhat. Nevertheless, with lower-than-expected inflation in Sweden and the US so far in 2026, projections for underlying inflation among Norway’s advanced trading partner economies in 2026 will be slightly lower than in the December Report.
- Services inflation is expected to slow in pace with lower wage growth. In Sweden, underlying inflation is already well below 2%, and the halving of VAT on food from April 2026 will have a further dampening effect. Among Norway’s other European trading partners, underlying inflation is projected to move down towards 2% in the course of 2027.
- In the US, the pass-through from higher tariffs to consumer prices has been weaker than expected, but trade policy measures are still expected to keep US inflation elevated in 2026. However, underlying inflation in the US is also projected to be close to target in 2027.
Energy and other commodity prices
Oil prices and European gas prices have risen sharply following the US-Israeli attack on Iran in late February (Table 2.A.). The transport of oil and natural gas through the Strait of Hormuz produced by Persian Gulf countries has almost come to a halt.1 In addition, oil and gas installations have been struck in military attacks. A number of countries in the region have also been forced to shut down production due to limited storage capacity.
Table 2.A Energy and other commodity prices
|
Percentage change from projections in Monetary Policy Report 4/2025 in parentheses |
Average price (2010–2019) |
Average price (2020–2024) |
Realised prices and futures prices2 |
||||
|---|---|---|---|---|---|---|---|
|
2025 |
2026 |
2027 |
2028 |
2029 |
|||
|
Oil, USD/barrel |
80 |
75 |
69 |
92 (51) |
81 (32) |
77 (22) |
75 |
|
Dutch gas, EUR/MWh |
20 |
51 |
36 |
54 (102) |
46 (81) |
31 (33) |
25 |
|
Coal, EUR/tonne |
66 |
128 |
88 |
111 (34) |
115 (34) |
110 (25) |
110 |
|
Carbon allowance prices, EUR/tonne |
10 |
61 |
74 |
70 (-18) |
69 (-21) |
72 (-21) |
75 |
|
German electricity, EUR/MWh |
42 |
116 |
105 |
118 (38) |
100 (20) |
79 (-1) |
71 |
|
Nordic electricity, Øre/kWh |
32 |
65 |
51 |
76 (62) |
52 (7) |
47 (-3) |
46 |
|
Electricity in southern Norway, Øre/kWh |
31 |
87 |
73 |
101(68) |
66(11) |
57(-3) |
56 |
|
Electricity in northern Norway and central Norway, Øre/kWh |
32 |
33 |
21 |
55(80) |
38(0) |
39(-5) |
40 |
|
Aluminium, USD/tonne |
1945 |
2321 |
2629 |
3189 (11) |
3020 (4) |
2906 (-1) |
2845 |
|
Copper, USD/tonne |
6762 |
8430 |
9926 |
12193 (7) |
12082 (7) |
12172 (9) |
12241 |
|
Steel, USD/tonne |
461 |
617 |
555 |
579 (0) |
575 (-2) |
n.a. |
n.a. |
|
Wheat, USD/tonne |
210 |
248 |
197 |
216 (7) |
240 (10) |
242 (6) |
n.a. |
|
Maize, USD/tonne |
183 |
206 |
173 |
182 (2) |
196 (5) |
193 (2) |
190 |
The members of the International Energy Agency (IEA) have agreed to make unprecedented volumes of emergency oil reserves available to the market to mitigate the impact of oil supply disruptions. The easing of US sanctions on Russian oil may pull in the same direction. The IEA emphasises that the ultimate effect of the conflict on oil and gas markets will depend on the intensity of the military attacks and on energy infrastructure damage. The most decisive factor is nonetheless the duration of the disruptions to shipping through the Strait of Hormuz.
Prices for refined oil products, in particular diesel and jet fuel, have increased more than crude oil prices in recent weeks. This reflects the fact that freight rates and freight insurance premiums have risen substantially and that the transport of refined products from key exporting countries in the region has been disrupted. Europe is particularly dependent on diesel and jet fuel imports.
So far, gas prices have risen more than oil prices. European gas inventories are low, following a cold winter and, unlike for oil, there are no strategic emergency reserves. In addition, private sector oil inventories have increased over the past year due to production surpluses.
The rise in prices for oil and European gas has so far been more pronounced than immediately following Russia’s invasion of Ukraine in February 2022. However, both oil and gas prices rose even further through 2022 owing to sanctions on Russian oil and cuts in Russian gas supply to Europe.
The war in the Middle East is now leading to a significant oil export shortfall.3 A persistent shortfall of LNG exports could also have implications similar to those in 2022.4
In the projections, energy and other commodity prices are assumed to move in line with futures prices (Table 2.A). Futures prices indicate that, on average, energy prices increase most in 2026 but decline gradually thereafter. At the same time, futures prices are slightly higher throughout the forecast period compared with the December Report.
There is now substantial daily volatility in oil prices and European gas prices, reflecting considerable uncertainty about the consequences of the conflict for both energy infrastructure in the region and energy supply from the region. Financial market option prices now indicate much higher uncertainty about oil prices a few months ahead than in December. Option prices indicate that oil prices may remain high due to the conflict and its aftermath, while also indicating that oil prices will most likely fall back somewhat (Chart 2.A).5
Option-implied probability distribution for Brent crude in May/July 20266

Higher European gas futures prices have pushed up power futures prices on the Continent and in the UK. Gas power is still important for price formation in the power market, although solar and wind power now accounts for a larger share of production. The decline in emission allowance prices (EU ETS) will dampen some of the pass-through to power prices.
Higher European power futures prices have also pushed up futures prices in Norway and the Nordic region. Power prices in Norway have closely followed prices on the Continent through winter due to the need for imported power. Power futures prices, particularly in southern Norway, are close to European futures prices in the near term.
Metal prices are, on the whole, somewhat higher than at the time of the December Report. The price of aluminium has risen following the outbreak of the war, as key producers around the Persian Gulf have been affected by military attacks. Several other metal prices have eased somewhat, likely reflecting expectations of weaker global economic growth. On the other hand, investment in digitalisation, electrification and military equipment is boosting metal demand.
Agricultural product prices are also expected to increase. Persian Gulf countries are important exporters of fertiliser and inputs for fertiliser production. At the same time, natural gas is a key input for fertiliser production. In addition, the value chain for agricultural products is energy intensive.
- 1 According to the International Energy Agency (IEA), the equivalent of approximately 20% of the world’s oil and LNG consumption is exported through the Strait of Hormuz, see IEA The Middle East and Global Energy Markets.
- 2 Futures prices at 20 March 2026.
Sources: LSEG Datastream and Norges Bank
- 3 The International Energy Agency March 2026: Oil Market Report
- 4 Oxford Institute of Energy Studies June 2025: Closing the Strait of Hormuz: Impact on the Global Gas Market
- 5 The calculation method used for these charts was published in Opheim, V.Ø. and Tendal, J. (2026) "Exchange rate probability distributions derived from option prices". Staff Memo 2/2026. Norges Bank.
- 6 Probability distributions for future oil prices (Brent). Distributions are estimated based on options prices in the oil market.
Krone exchange rate
The krone exchange rate, as measured by the import-weighted exchange rate index (I-44), has appreciated since the December Report. The appreciation has coincided with a weakening of the US dollar early in the period, a sharp increase in oil prices and higher interest rate differentials against other countries. Heightened financial market uncertainty has likely dampened the appreciation.
From mid-January, the krone appreciated on the back of a broad US dollar depreciation. The appreciation also reflects a rise in oil prices in this period. The publication of the January consumer price index on 10 February resulted in an immediate krone appreciation, and market policy rate expectations rose (Chart 2.B). These reactions reflect higher-than-expected inflation. Higher policy rate expectations normally result in an immediate appreciation of the krone. The market-implied interest rate differential against other countries ahead is now higher than in December (Chart 2C).
I-44 and one-year Norwegian swap rate. 7am to 9am, 10 February 20251

Policy rate differential against Norway’s main trading partners. Percent2
The sharp rise in oil prices following the outbreak of the war in the Middle East has likely pulled in the direction of a stronger krone, but heightened financial market uncertainty has likely had a dampening effect.
Since December, the krone has strengthened against the currencies of Norway’s main trading partners (Chart 2.D). Following the outbreak of the war in the Middle East, some of the US dollar depreciation at the beginning of 2026 has reversed. The US dollar is nevertheless weaker against commodity-based and minor currencies than in December. The Norwegian krone is among the currencies that have appreciated the most in the period.
Index. 12 December 2025 = 1003
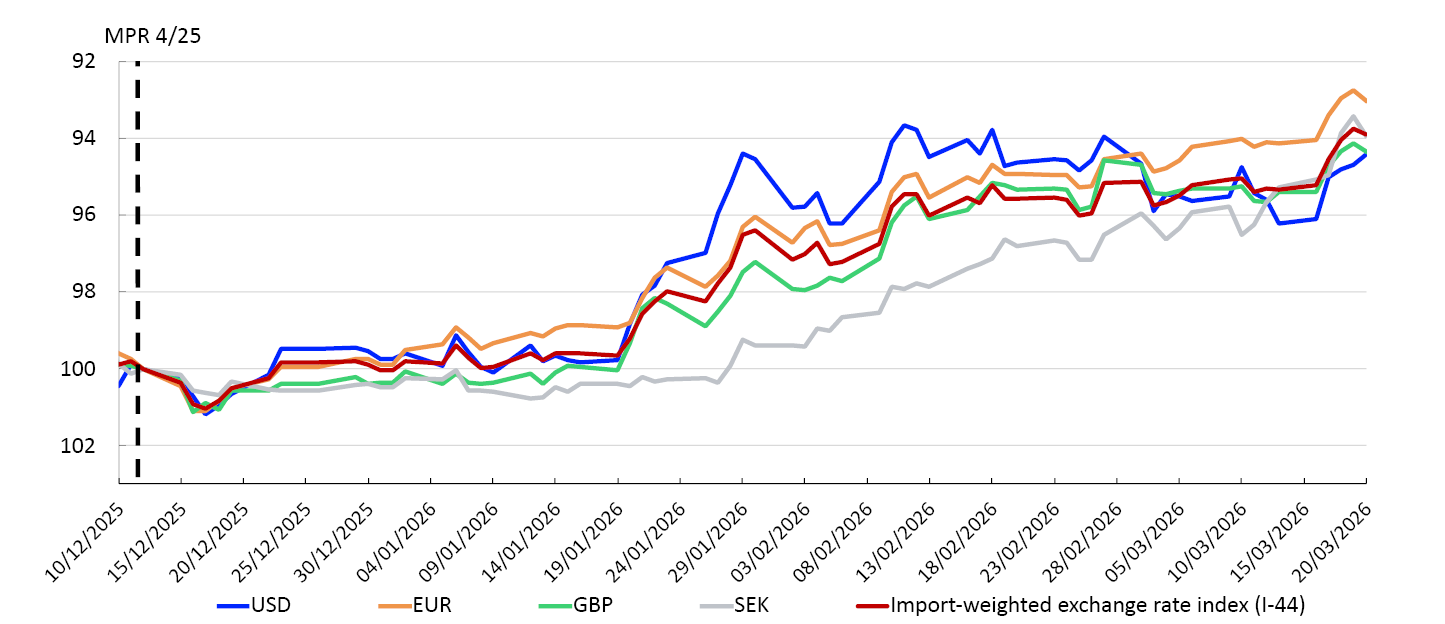
In this Report, it is assumed that the publication of the policy rate decision and the Monetary Policy Report will not lead to changes in the krone exchange rate (Chart 2.E). This must be seen in the context of the policy rate path being in line with market policy rate expectations. After publication of the policy rate decision, the krone exchange rate is assumed to remain unchanged to the end of the projection period.
Import-weighted exchange rate index. I-444

However, developments in the krone exchange rate are always uncertain. Chart 2.F illustrates uncertainty based on options prices in the FX market.5 These prices are used to calculate an implied probability distribution of the krone exchange rate at a given point in time. Assuming that market participants have risk-neutral preferences, the distribution will reflect their expectations. The chart shows such a distribution of EUR/NOK three months ahead, expressed as a deviation from forward prices – ie the exchange rate agreed in the forward market. Uncertainty about movements in the krone exchange rate has increased somewhat since the December Report. The probability of a krone exchange rate that is 5% stronger than the forward rate three months ahead has doubled from 5% to 10%, while the probability of a correspondingly weaker exchange rate has increased somewhat less.
Three-months ahead. Percentage deviation from forward rate6

- 1 Movements in the krone exchange rate and one-year swap rate. An increase in the series means a stronger krone and a rise in interest rates.
- 2 Policy rates abroad are trade-weighted averages of the policy rates of the Bank of England, Sveriges Riksbank, the Federal Reserve and the European Central Bank.
- 3 For all currencies in the chart, the exchange rate is against NOK. 12 December 2025 = 100. An increase in the series means that NOK has appreciated against the foreign currency.
- 4 An increase in the series means that NOK has appreciated against the import-weighted index I-44. The NOK exchange rate projection is based on the level of the exchange rate at 20 March.
- 5 See Opheim, V. Ø and J. Tendal (2026) “Exchange rate probability distributions derived from option prices”. Staff Memo 2/2026, Norges Bank
- 6 Market-based probability distribution for the krone exchange rate 3 months ahead, measured against euro. Deviation from futures prices. Positive values on the horizontal scale indicate a weaker krone. The distribution is estimated based on the pricing of options in the FX market.
Norwegian mainland GDP
Norwegian mainland economic growth was sluggish through 2023 and 2024. Higher interest rates and elevated price and cost inflation weighed down on investment and dampened household consumption growth. On the other hand, the krone depreciation in the period to summer 2023 led to strong export growth. An expansionary fiscal policy and increased petroleum investment also boosted activity. Growth in mainland Norway picked up in 2025 (Chart 2.3). Higher household income resulted in solid consumption growth. Petroleum investment and export growth remained high, while public sector demand growth was low.
Constant 2023 prices. In billions of NOK
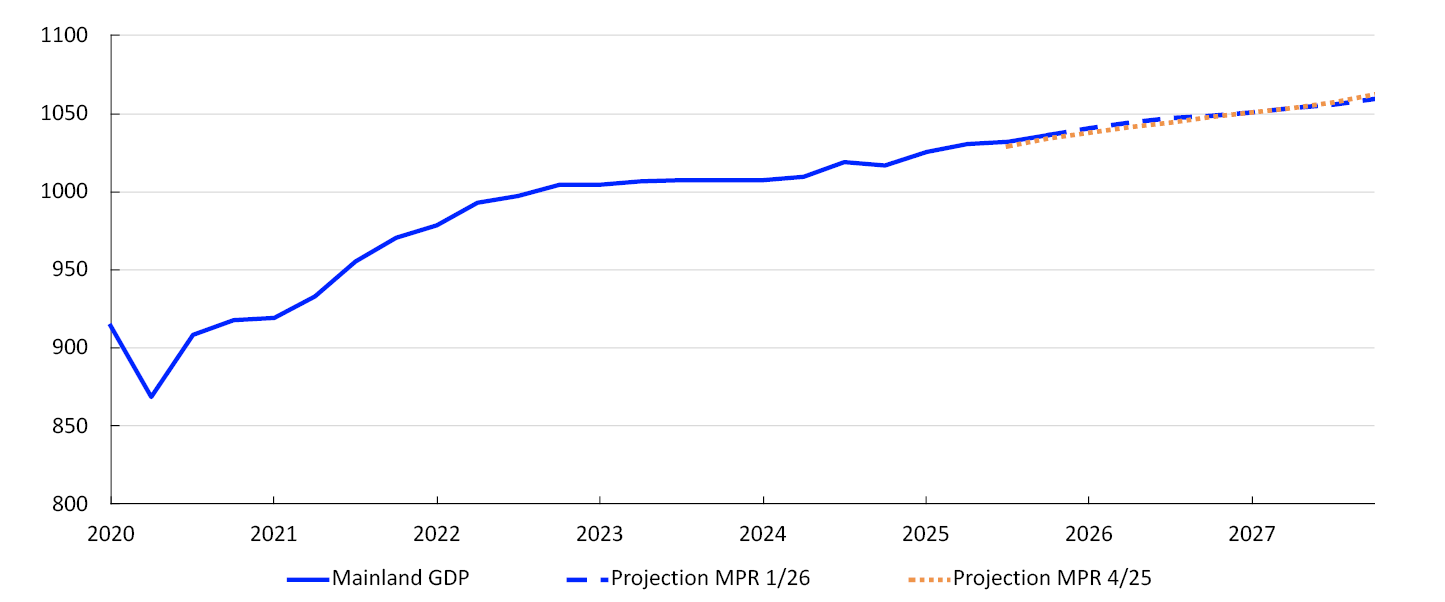
Mainland GDP rose slightly less than projected in 2025 Q4, but revisions of previously published figures entail that the level of activity was nevertheless slightly higher than projected in the December Report. Growth is expected to remain moderate in the coming quarters. The projections are based on the following:
- The war in the Middle East is adding to uncertainty surrounding economic developments ahead. The projections are based on energy and commodity futures prices. Given these prices and the current assessment of the effects of the war on trading partner growth, developments since December do not contribute to substantial changes in the projections of overall mainland activity. Higher energy and commodity prices may in isolation dampen demand from households and mainland business investment, while petroleum sector investment may benefit.
- Most interviews in this Regional Network survey were conducted prior to the US-Israeli attack on Iran in late February. Overall, Regional Network contacts expect growth to be slightly slower in 2026 Q1 than through 2025 and to pick up in Q2 (Chart 2.4, left panel), boosted by increased defence investment, an expansion of energy supply infrastructure and higher expected household demand. However, the completion of projects initiated in response to the petroleum tax package and low building construction activity are dampening growth.
Expected output. Quarterly change. Percent1
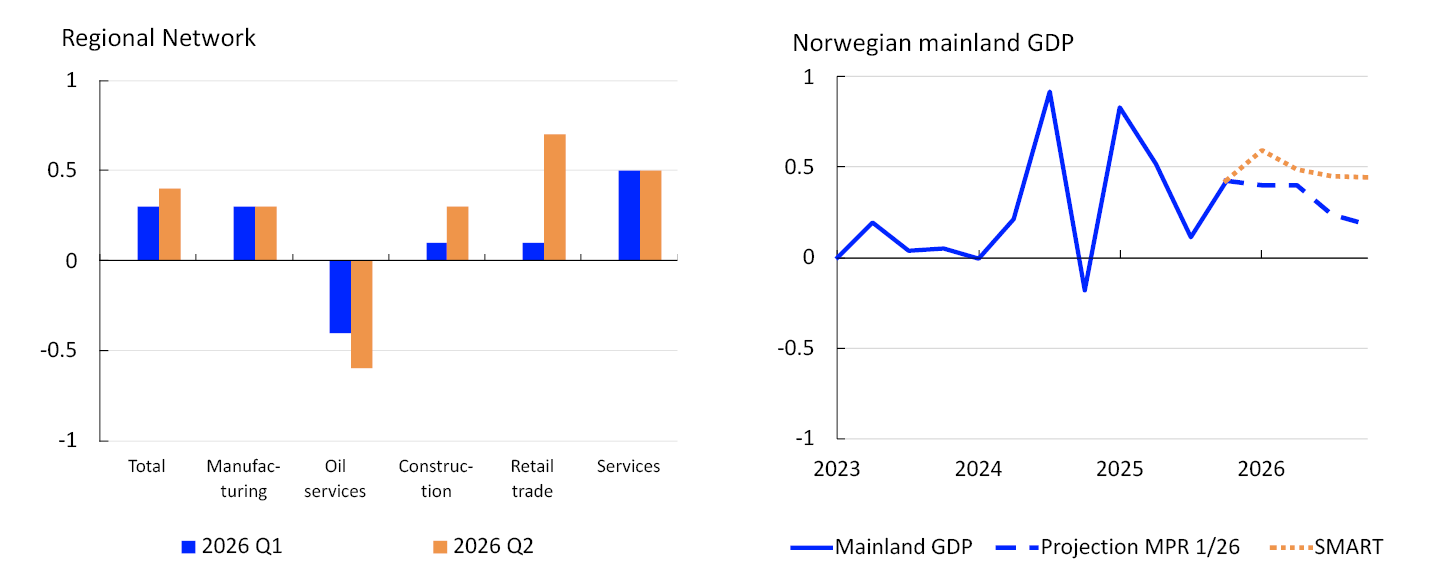
- According to Norges Bank’s System for Model Analysis in Real Time (SMART), which weights forecasts from a broad set of models, mainland GDP growth will pick up slightly in the coming quarters (Chart 2.4, right panel).
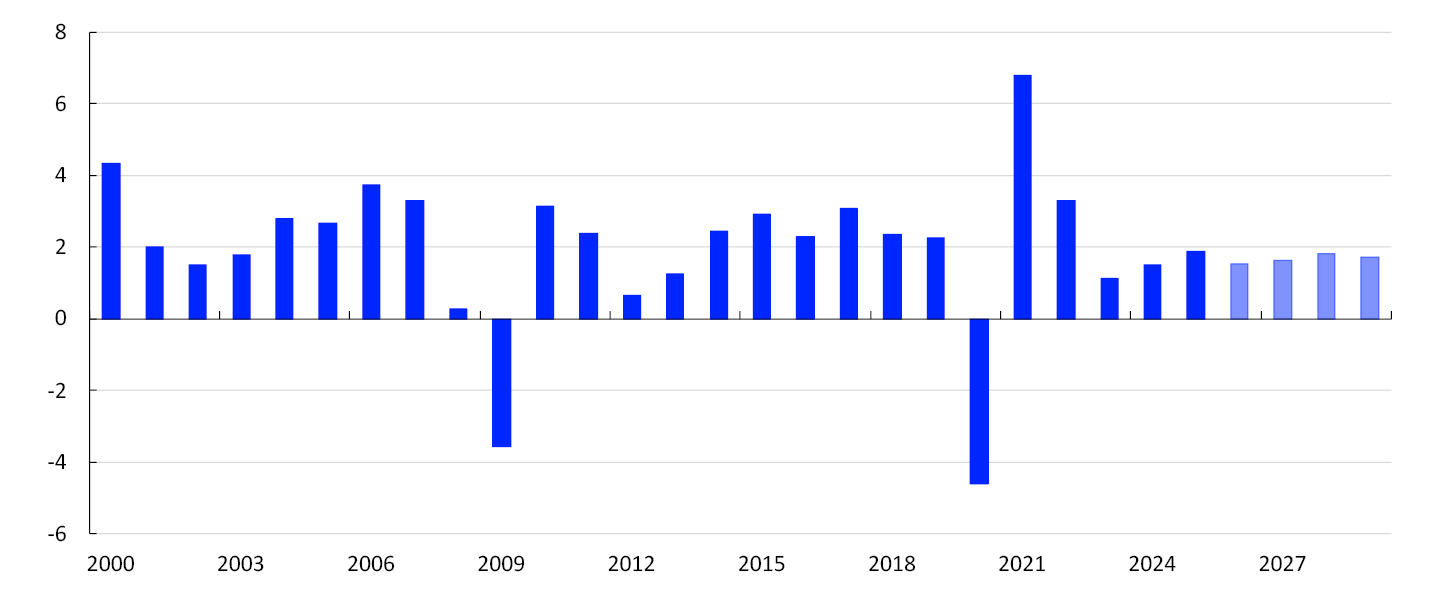
Mainland GDP growth is projected to slow from 1.8% in 2025 to 1.4% in 2026 and then to 0.9% in 2027 (Chart 2.5). The growth projection for 2026 has been revised up slightly from the December Report, while projections for 2027 and 2028 have been revised down.
Annual change. Contribution to annual change. Percentage points2
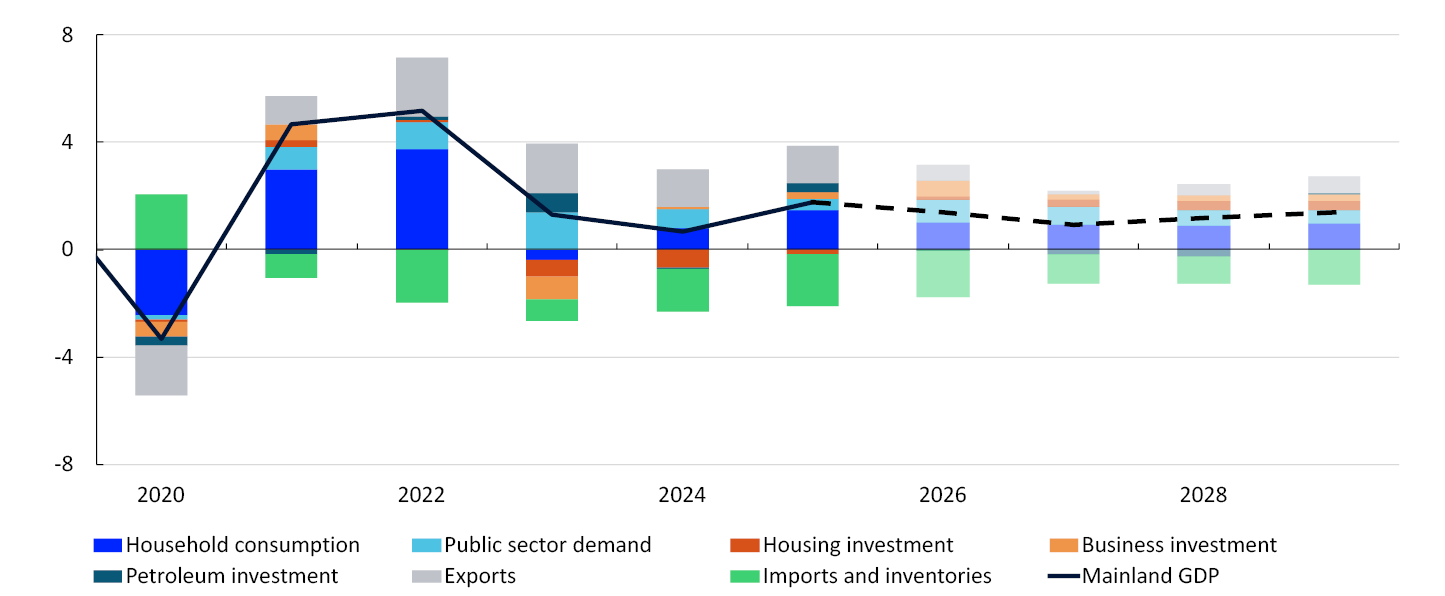
Household consumption is the primary driver of GDP growth in the coming years. Housing investment is projected to pick up somewhat from 2026, while growth in business investment will likely be moderate ahead. Growth in public sector demand is projected to increase in 2026 before gradually drifting down. Export growth will likely decline ahead. Petroleum sector investment is expected to decline as ongoing development projects reach completion. For detailed projections and changes from the previous Report, see Annex Tables 2 and 3.
- 1 Regional Network surveys 1/26. The SMART modelling system for short-term forecasting is based on historical relationships. It weights empirical models based on previous forecasting properties.
- 2 The data for petroleum investment in this chart include investment in international shipping. Public demand = public consumption + public investment.
Households
In 2023, higher interest rates and high inflation reduced household purchasing power and contributed to a fall in consumption. In 2024, household real disposable income rose markedly. Consumption picked up, albeit less than income. Together with higher pension saving, this led to an increase in the saving ratio. Strong income growth continued in 2025. At the same time, consumption increased markedly, resulting in little change in the saving ratio compared with 2024. In 2025, consumption growth was slightly higher than the average for the past 15 years.
Constant 2023 prices. In billions of NOK3
The increase in goods consumption was broad-based through 2025, while services consumption only rose in H2 (Chart 2.6). In the projection, consumption growth declines from 2.8% in 2025 to 1.9% in 2026. Further out in the projection period, growth is expected to slow slightly. The consumption growth projections for 2026 have been revised down since the December Report. The projections are based on the following:
- Household car purchases fluctuated markedly around the turn of the year, reflecting tax changes for electric vehicles. Retail sales increased from December to January.
- As a result of the tax changes for electric vehicles, Regional Network retail contacts expect only weak activity growth in 2026 Q1, followed by a marked pickup in Q2.
- Household real disposable income growth is projected to slow from 3.2% in 2025 to 2.1% in 2026 and to 1.5% in 2027. Higher consumer price inflation and higher interest rates have contributed to a marked downward revision of income growth compared with the December Report. Lower income growth will likely dampen consumption growth somewhat, but households are also projected to adjust saving in order to smooth the movements in income growth. Income growth is expected to pick up towards the end of the projection period when consumer price inflation moves down towards the inflation target and employment growth increases slightly.
- Pension saving is assumed to remain elevated ahead and consumption to increase on average less than household real disposable income in the coming years. The saving ratio is projected to rise slightly in 2026 before falling slightly in 2027.
- Statistics Norway has published a main revision of quarterly household income accounts. Real disposable income growth has been revised down for the past couple of years, but income growth has been revised up further back in time. The saving ratio has been revised down historically, but the path is broadly as previously published (Chart 2.7).
Share of disposable income. Percent

- Households are highly indebted and in the period to 2024, the interest burden increased before falling slightly through 2025 (Chart 2.8). Higher interest rates are likely to contribute to a slight increase in households’ interest burden in 2027. Interest burdens are projected to be higher than in the December Report. Debt levels are expected to rise broadly in pace with household income, resulting in minor changes in debt-to-income ratios ahead.
Percent4

Housing market
Housing investment fell by around 25% between the beginning of 2022 and autumn 2025, partly reflecting a marked increase in material costs and higher interest rates. Housing investment growth was higher in 2025 Q4 than projected in the December Report. Annual housing investment growth is expected to pick up slightly from 2026, but less than projected in the December Report. At the end of 2029, the level is expected to be slightly lower than at the beginning of 2022 (Chart 2.9). The projections are based on the following:
- Activity among many Regional Network construction contacts is low, but they expect some pickup over the course of 2026 H1.
- Figures for housing starts and new home sales indicate weak growth in housing investment in the near term.
- Compared with the previous Report, prospects for a higher policy rate will likely dampen housing investment.
- Increased household purchasing power is expected to lead to somewhat higher demand for both new and existing homes ahead.
- Further out in the projection period, lower interest rates and higher house prices will likely improve profitability in construction and lead to an increase in project starts.

Regulatory easing of equity requirements for house purchases and expectations of lower interest rates likely contributed to a pickup in existing home prices in 2025. The annual rise in existing home prices increased from 3.0% in 2024 to 5.9% in 2025. In recent months, house prices have changed little and been lower than projected in December. House prices are expected to rise through spring, but annual house price inflation will likely be moderate this year and lower than projected in the December Report. From 2027, annual house price inflation for existing homes is expected to edge higher. The projections are based on the following:
- Compared with the previous Report, prospects for a higher policy rate will likely dampen house price inflation.
- The increase in household income and high employment will likely boost housing demand in the coming years.
- A low supply of new homes points to higher house prices.
- Further ahead, a decrease in interest rates will pull in the direction of higher house prices.
Firms
Mainland business investment was sluggish between 2022 and 2024, primarily due to the rise in interest rates and other costs. In 2025, mainland business investment increased by almost 2%. Strong growth in 2025 H2 contributes to lifting annual growth in 2026. Business investment is expected to increase going forward (Chart 2.10), but less than projected in the previous Report. The projections are based on the following:
Constant 2023 prices. In billions of NOK5

- Information from the Regional Network indicates that services investment will increase in 2026 and 2027. Many of the interviews with Regional Network contacts were conducted before the war in the Middle East broke out, and the contacts likely had lower policy rate expectations at the time of the survey than indicated by the policy rate path in this Report. Lower investment growth in services is therefore expected than indicated by the Regional Network.
- According to the investment intentions survey from Statistics Norway, published in mid-February, investment in manufacturing and mining and quarrying will increase moderately in 2026. Prospects for a higher policy rate, higher costs due to the war in the Middle East and greater uncertainty about growth prospects ahead are expected to reduce investment in this sector more than indicated by the investment intentions survey.
- Changes in the monetary policy outlook are assumed to have little effect on power investment. The investment intentions survey indicates that power investment will increase markedly from 2025 to 2026, in line with projections in the December Report. The increase is primarily driven by investment related to power grid upgrades. Information from grid companies indicates that power grid investment will continue to increase in the coming years.
Petroleum sector investment has increased markedly over the past three years, reflecting the launch of a number of development projects in 2022 in response to the petroleum tax package and high oil and gas prices. Petroleum investment is expected to fall from 2026 to 2028, but less than projected in the December Report. The projections are based on the following:
- Investment in ongoing development projects is expected to fall by around NOK 100bn between 2025 and 2028 as projects reach completion.
- Oil companies have announced a host of new development projects ahead. This will generate substantial investment, but not enough to fully compensate for the decline in ongoing development projects in the period to 2028. However, petroleum investment is expected to increase somewhat in 2029 owing to the new projects.
- The investment intentions survey published in February indicates that petroleum investment will fall less in 2026 and 2027 than projected in the December Report.
- The war in the Middle East has led to a sharp rise in oil and gas prices (see discussion on page 18). The price increases are expected to curb the decline in petroleum investment ahead.
Mainland exports have expanded markedly since 2021, largely driven by the krone depreciation in the period to summer 2023 and increased tourism, as well as higher investment in oil, gas and green technology abroad. In addition, aquaculture exports were very high in 2025.
Export growth is expected to decline in these sectors ahead, and mainland exports are projected to grow moderately from 2026 to the end of the projection period. Annual growth projections for 2026 and 2027 have been revised down from the December Report. The projections are based on the following:
- Trading partner GDP growth will likely decline from 2025 to 2026 but is expected to increase slightly thereafter.
- The krone has appreciated since December and is assumed to be considerably stronger ahead than in the December Report.
- Developments in global petroleum investment are likely to be weaker ahead than in the period between 2021 and 2025. Compared with the outlook in December, the sharp rise in petroleum prices is expected to boost Norwegian oil services exports.
- Export-oriented Regional Network contacts expect output to increase moderately in 2026 H1.
- 5 Goods and services exports from mainland Norway.
Fiscal policy
Growth in public sector demand has declined from a high level over the past two years. Public investment fell through much of 2025, before increasing markedly towards the end of the year. Growth in public sector demand is assumed to be slightly higher than mainland GDP growth ahead (Chart 2.11). The projections for public demand growth are little changed from the December Report for the years 2026–2028. The projections are based on the following:
Annual change. Percent6
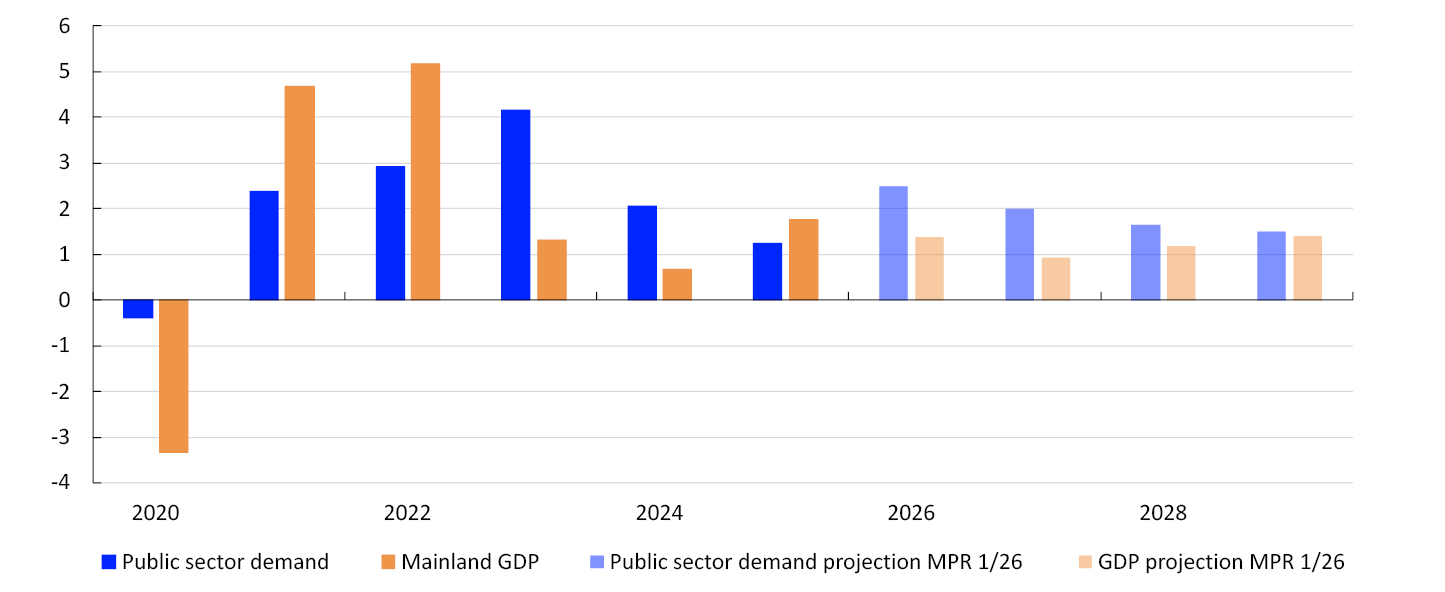
- Growth in public sector demand through 2026 is assumed to be in line with the approved fiscal budget.
- The structural non-oil budget deficit as a share of the Government Pension Fund Global (GPFG) is assumed to be in line with the final budget for 2026. As a share of the GPFG, the deficit is estimated at 2.8% in 2026. In isolation, higher oil and gas prices contribute to higher petroleum revenue for the GPFG, while lower equity prices and a stronger krone lower the market value of the GPFG. Overall, the market value of the GPFG is projected to be lower in 2027 than in the December Report, contributing to an increase in the deficit to 2.9% in 2027 and 2028.
- Support to Ukraine accounts for some of the growth in government spending in 2026 but is expected to have little effect on domestic demand.
- Defence spending is expected to boost growth in public sector demand through the projection period. Developments are assumed to be in line with the long-term plan for the Norwegian defence sector adopted in 2024.
- 6 Public demand = public consumption + public investment.
Labour market and the output gap
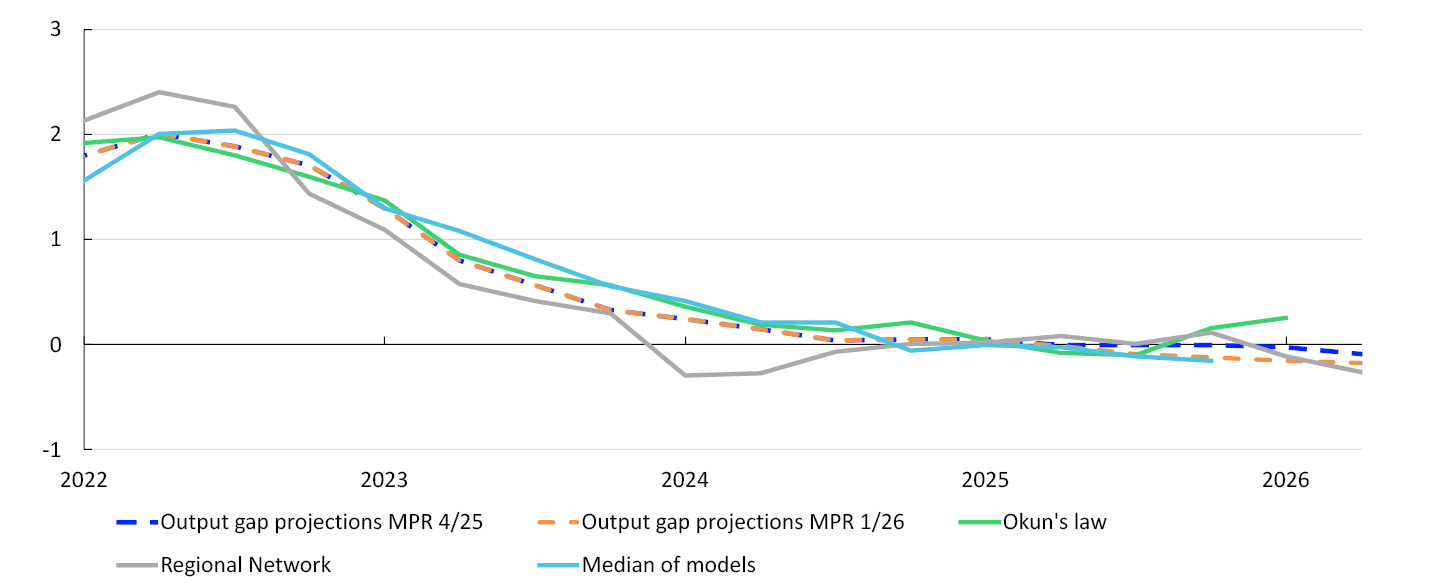
Capacity utilisation, or the output gap, is a measure of the difference between actual output in the mainland economy and potential output. The output gap and potential output cannot be observed and must therefore be estimated. In the near term, the output gap is estimated based on a number of indicators and models, with particular weight given to labour market developments. The potential output estimate follows from the output gap and GDP estimates. In the longer-term, the potential output estimate is based on estimated trend productivity and on the Bank’s assessment of the highest sustainable level of employment over time consistent with stable wage and price inflation (trend employment, N*).
Output is estimated to have been close to potential over the past few years. Since the December Report, different output gap indicators have pulled in slightly different directions. The output gap is expected to remain largely unchanged in the coming quarters, and the projections are little changed compared with the December Report (Chart 2.12). The projections are based on the following:
Percent1
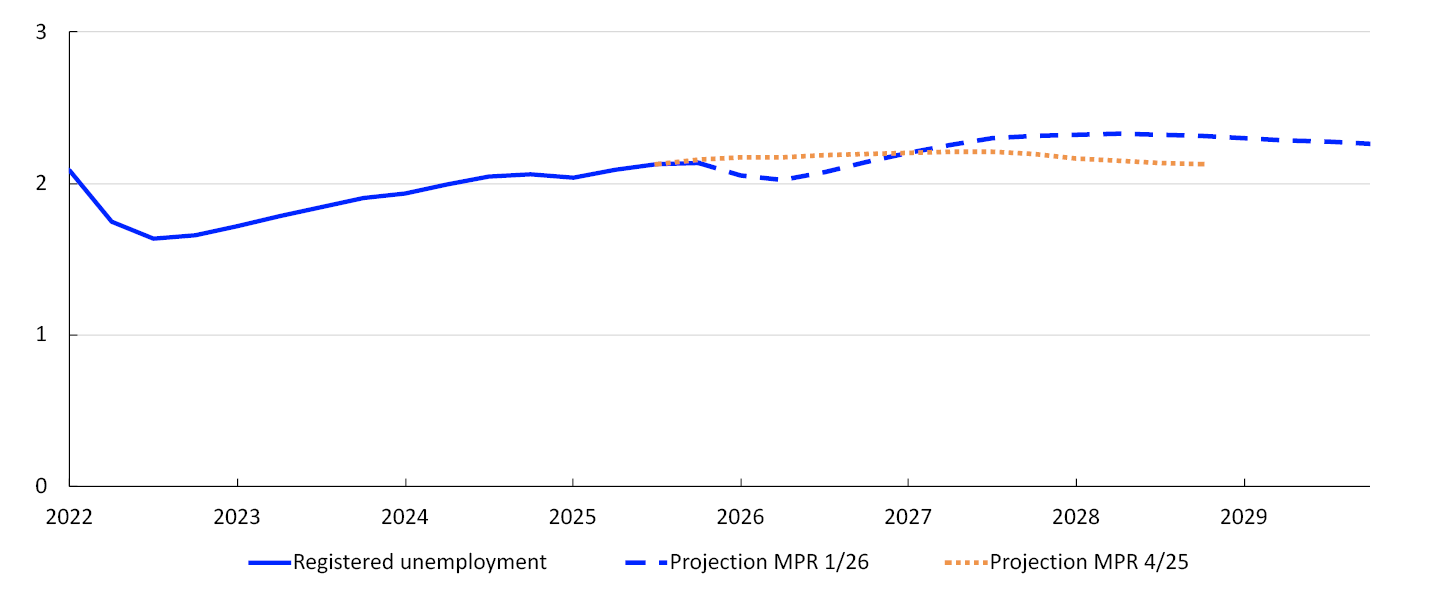
- Registered unemployment, adjusted for normal seasonal variations, was 2.1% in February. This is slightly lower than projected in the December Report, partly reflecting recent transitions among job seekers from fully unemployed to participation in labour market programmes. Unemployment is expected to fall temporarily to 2.0% in the coming months as more fully unemployed job seekers transition into labour market programmes. This is somewhat lower than the level consistent with output at potential. As some of the decline in unemployment can be attributed to temporary factors, the overall assessment is that unemployment indicates that the output gap is close to zero.
- The Labour Force Survey (LFS) indicates that over time unemployment has risen more than registered unemployment, partly reflecting an increase in the number of young job seekers. Trend LFS unemployment has changed little over the past six months, indicating that the output gap has remained largely unchanged recently.
- Employment rose further in 2025 Q4, broadly as projected in the December Report. Preliminary figures for the number of wage earners indicate further growth in January, and Regional Network contacts expect weak employment growth in 2026 Q1 and Q2.
- The share of Regional Network contacts reporting capacity constraints and labour shortages has declined slightly and is a bit below their historical averages, indicating that the output gap is declining and is somewhat below zero.
- Developments in both the stock of vacancies and the inflow of new vacancies have changed little recently. This may indicate that labour demand is little changed compared with the December Report.
- Norges Bank’s modelling system for estimating the output gap, which takes into account mainland GDP, employment, unemployment, wage growth and inflation, has been revised up slightly since the December Report. The upward revision reflects lower unemployment and a slight upward revision of mainland GDP growth forecasts. The models indicate that capacity utilisation declined somewhat towards the end of 2025, but that the output gap is still close to zero (Chart 2.12).
In the projections, the output gap declines and bottoms out at the end of 2027. The output gap remains negative throughout the projection period. Further out, the December projection has been revised down, reflecting a higher policy rate path than in the previous Report throughout the projection period. In the projections, unemployment rises somewhat more than in the December Report and increases to 2.3% (Chart 2.13).
Percent2
Potential output
Potential output growth is assessed to have been lower over the past decade than in the preceding decade (Table 2.1). Potential output growth is projected to slow gradually throughout the projection period. The potential output estimates for 2026 have been revised up slightly compared with the December Report and are little changed further out in the projection period. The assessment of potential output is based on the following:
- Productivity growth was low in 2023 and 2024 (Chart 2.14). National accounts figures show that productivity picked up through 2025. Regional Network contact expectations indicate that productivity is holding steady at the beginning of 2026, which is close to the Bank’s assessment of underlying productivity growth. For the years ahead, projected underlying productivity is little changed.
Percent3

- Population growth has picked up in recent years, primarily reflecting the large inflow of Ukrainian refugees. This has pushed up trend employment. Higher employment among younger and older cohorts has also lifted trend employment somewhat (see Monetary Policy Report 3/2025 for further details). Looking ahead, trend employment growth is projected to gradually slow, reflecting an expected decline in population growth in line with Statistics Norway’s population projections.
- Trend employment will also be affected by developments in the number of temporary foreign workers. The level has recently been stable but is expected to continue to rise in the coming years in pace with a pickup in construction activity.
Table 2.1 Output and potential output4
|
Change from projections in Monetary Policy Report 4/2025 in parentheses |
Percentage change from previous year |
|||||
|---|---|---|---|---|---|---|
|
2006–2015 |
2016–2025 |
2026 |
2027 |
2028 |
2029 |
|
|
GDP, mainland Norway |
2.8 |
1.9 |
1.4 (0.1) |
0.9 (-0.4) |
1.2 (-0.2) |
1.4 |
|
Potential output |
2.9 |
1.8 |
1.6 (0.1) |
1.5 (0) |
1.3 (0) |
1.2 |
|
Trend employment (N*) |
1.5 |
0.9 |
0.9 (0) |
0.8 (0) |
0.6 (0) |
0.6 |
|
Underlying productivity growth |
1.4 |
0.9 |
0.7 (0) |
0.7 (0) |
0.7 (0) |
0.7 |
- 1 Regional Network is a direct estimate of the output gap based on the average of the capacity utilisation indicators in the Regional Network and the historical correlation with Norges Bank’s output gap estimate where the Regional Network indicator leads by one quarter. “Okun’s law” is based on an estimated deviation from the trend in registered unemployment as a percentage of the labour force.
- 2 Registered unemployed as share of the labour force. Seasonally adjusted.
- 3 Annualised quarterly changes. Productivity growth in the Regional Network is calculated as contacts’ expected output growth less expected employment growth. A two-quarter moving average is calculated. Observations from the Regional Network for 2020 have been removed due to scaling difficulties during the pandemic. Productivity growth in the quarterly national accounts is given as mainland GDP per employed person. A four-quarter moving average is then calculated.
- 4 The contributions from the growth in N* and trend productivity do not necessarily sum exactly to the annual change in potential output due to rounding.
Wage growth
Wage growth has risen in recent years owing to high inflation, a tight labour market and high profitability in some business sectors. In 2025, wage growth was 4.9%, as projected in the December Report. In 2026, wage growth is expected to decline to 4.5%, somewhat higher than projected in the December Report. The projections for 2026 are based on the following:
- Regional Network contacts and the social partners in Norges Bank’s Expectations Survey expect wage growth to slow to 4.2% and 4.1%, respectively, in 2026 (Chart 2.15). Wage expectations have been revised up somewhat compared with 2025 Q4. The expectations may indicate that wage growth will slow more in 2026 than projected. However, wage expectations have been somewhat lower than actual wage growth in recent years.
Annual change. 2026. Percent5

- Unemployment has declined slightly compared with the December Report, indicating a slightly tighter labour market. Unemployment is projected to show little change between 2025 and 2026, suggesting that wage growth will remain elevated in 2026.
- The Norwegian Technical Calculation Committee for Wage Settlements puts inflation at 3.2% in 2026. This is 0.8 percentage point higher than Norges Bank’s December projection and contributes to an upward revision of projected wage growth in 2026 compared with the December Report.
- The overall wage share in the business sector was somewhat above a historical average in 2025. The wage share in manufacturing has been lower than its historical average in recent years and declined between 2024 and 2025. In isolation, a low wage share in manufacturing pushes up wage growth.
- Prices for a number of commodities have increased sharply, and futures prices have risen (see “Energy and other commodity prices”), contributing to higher profitability in some parts of the export industry. At the same time, the krone has recently appreciated and is stronger than projected in December, contributing in isolation to lower profitability in the export industry. Overall, profitability in the export industry is projected to improve somewhat compared with the December Report. This pulls in the direction of higher wage growth.
- Norges Bank’s empirical models for total annual wage growth indicate wage growth of 4.5% and 4.7% (Chart 2.15).
In the projections, real wage growth declines in 2026 compared with 2025, a downward revision compared with the December Report due to higher CPI projections (Chart 2.16).
Percent6
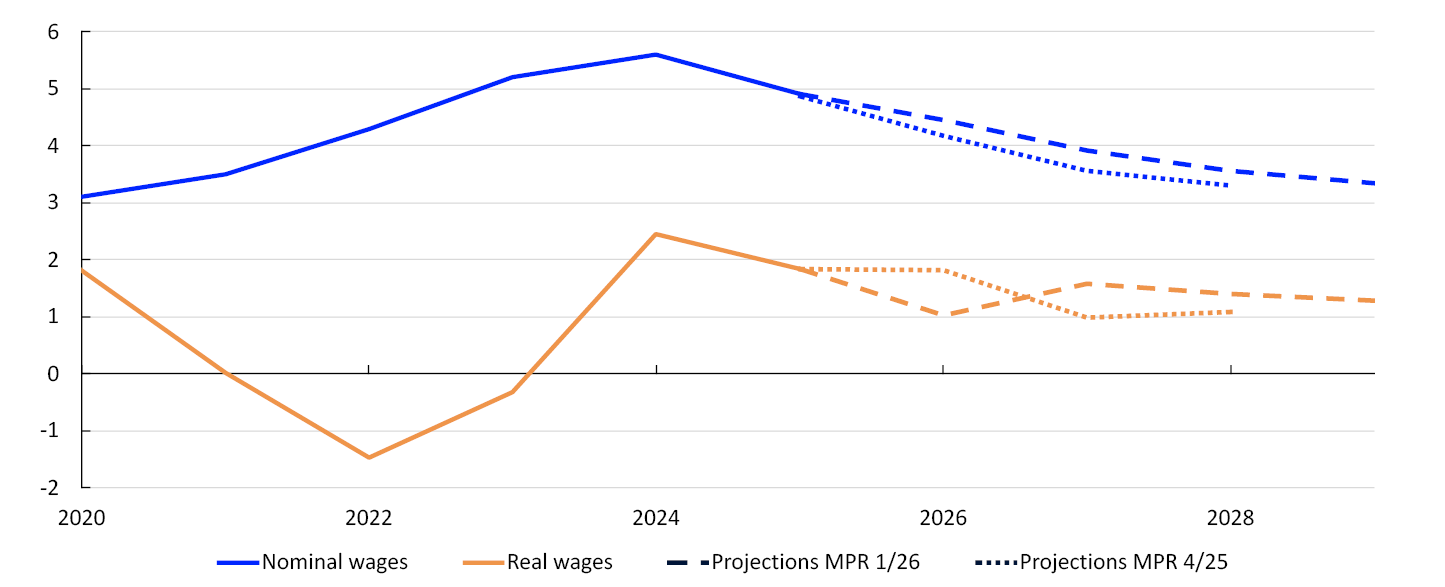
Further out in the projection period, wage growth is expected to decline further, reflecting projections of a less tight labour market, lower inflation and lower profitability in the export industry. The wage growth projections for the coming years are somewhat higher than in the December Report. The Bank’s projections indicate that real wage growth will outpace productivity growth. This is due to Norges Bank’s estimates of firms’ selling prices rising more than consumer prices.
Inflation
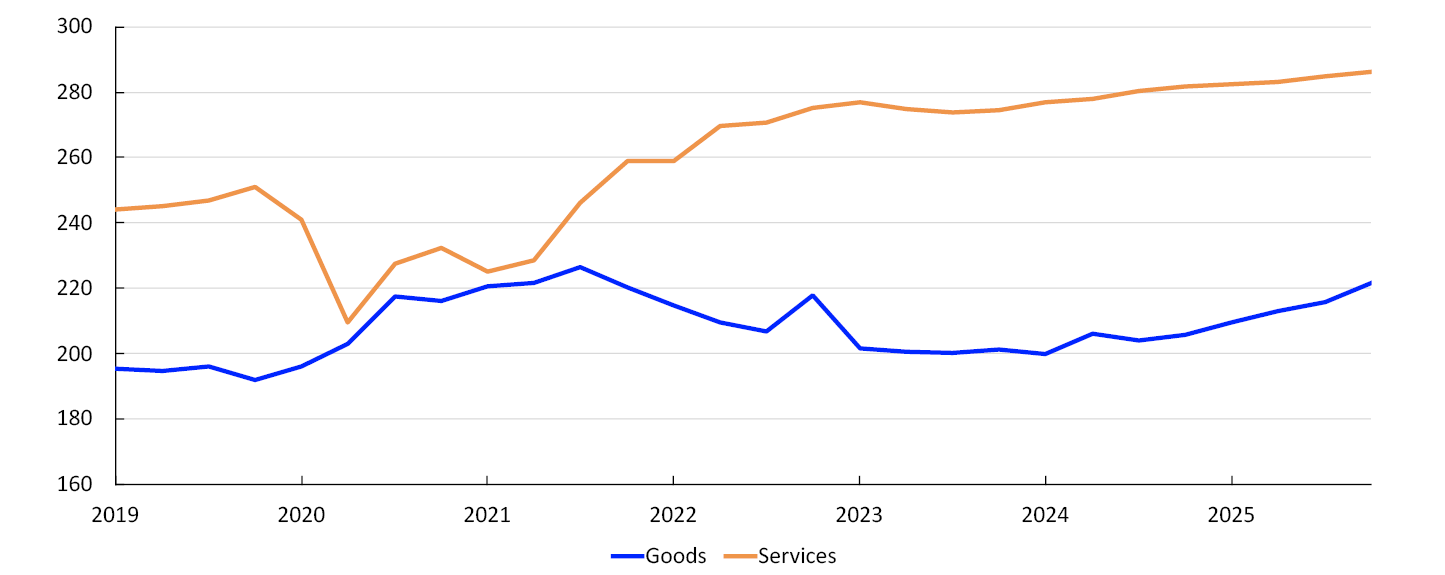
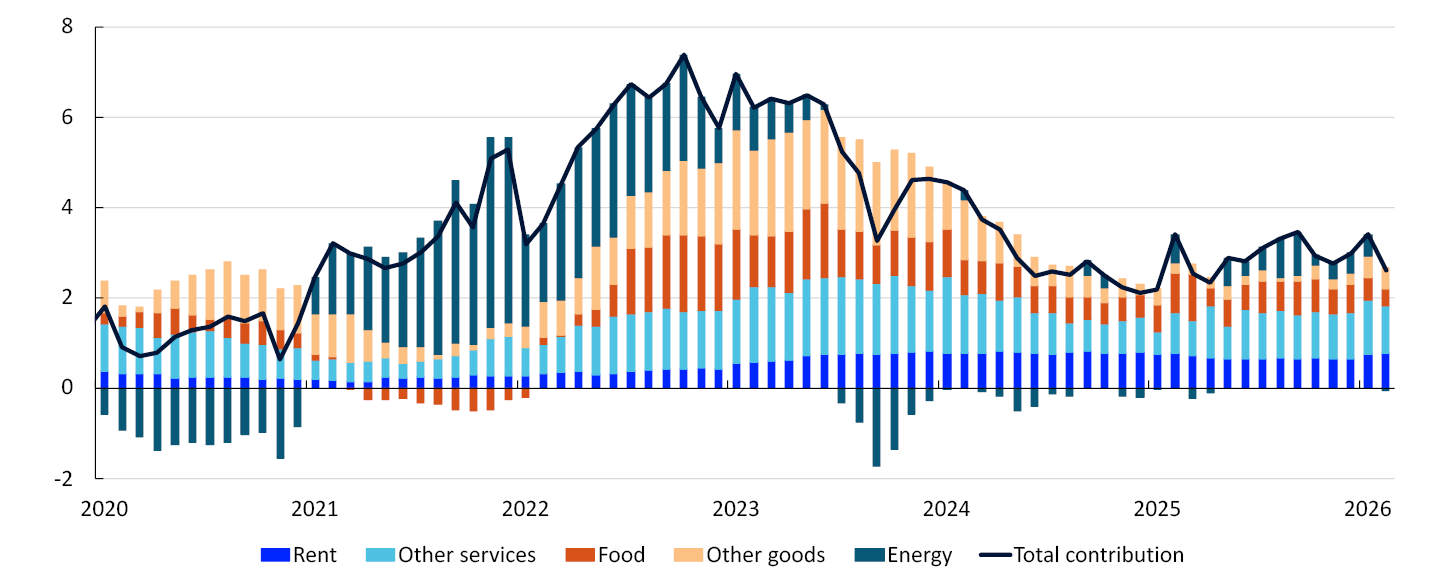
The 12-month rise in the consumer price index (CPI) peaked at 7.5% in 2022. Inflation fell markedly through 2023 and 2024 but the decline has since stalled. High services inflation is keeping inflation elevated, while the contribution from the rise in goods inflation has declined (Chart 2.17). The twelve-month rise in the CPI in February was 2.7%, while the rise in the CPI adjusted for tax changes and excluding energy products (CPI-ATE) was 3.0%.
CPI subcomponents. Contribution to twelve-month change. Percent1
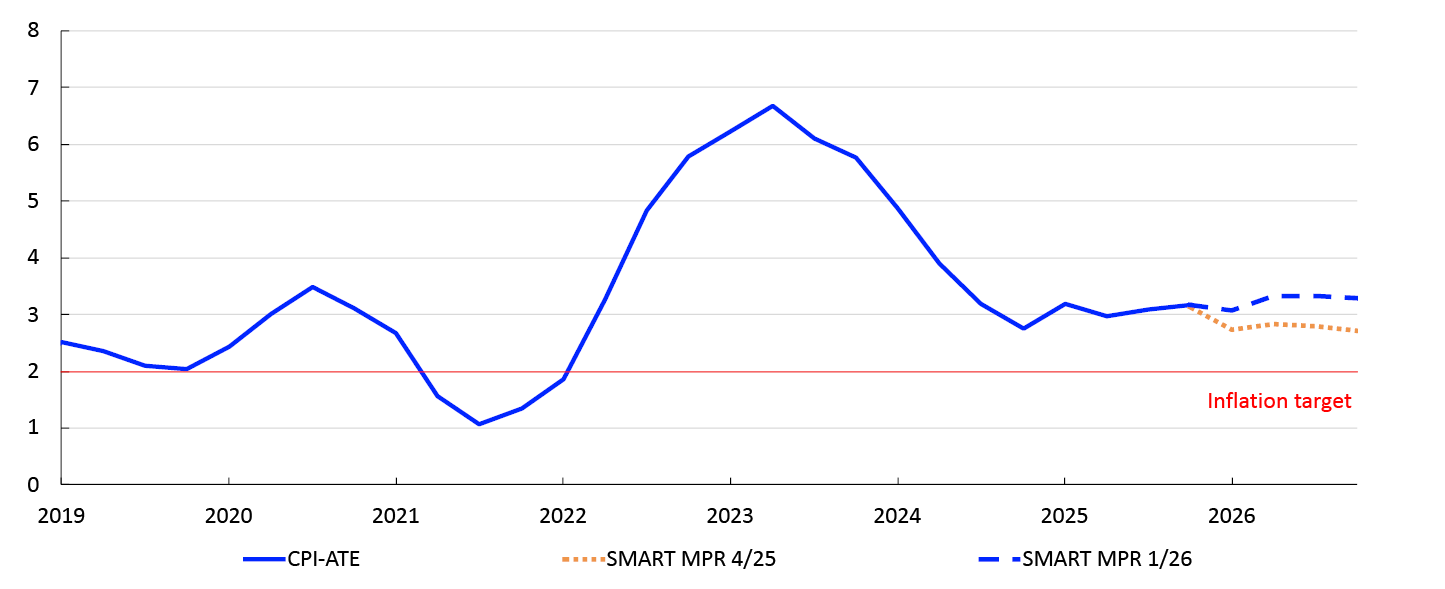
Core inflation
Core inflation, as measured by the CPI-ATE and other indicators, has been close to 3% for some time (Chart 2.18). In recent months, inflation has remained elevated and has not declined as expected in the December Report. Looking ahead, twelve-month core inflation is expected to increase before declining through 2027 and reaching 2% in 2029. The projections for core inflation in the coming year have been revised up compared with the December Report, but a higher policy rate is expected to pull down inflation further out in the projection period. The projections are based on the following:
Twelve-month change. Percent2
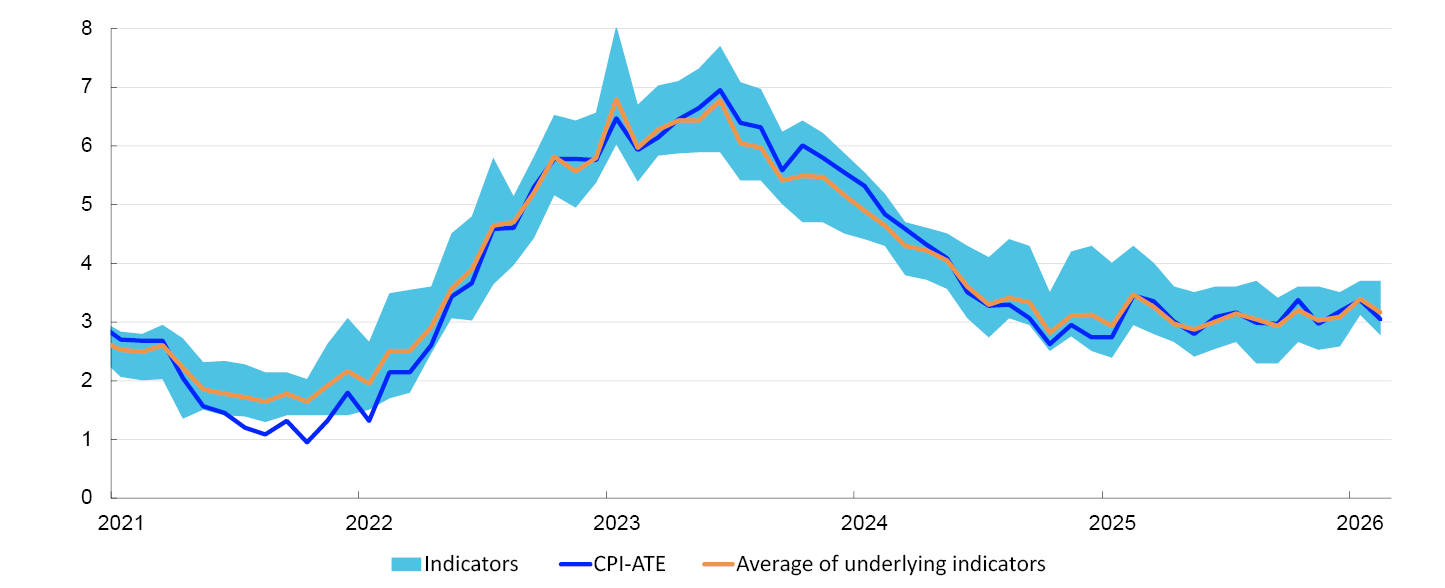
- According to Norges Bank’s System for Model Analysis in Real Time (SMART), which weights forecasts from a broad set of models, underlying inflation will increase slightly in the near term, suggesting an upward revision compared with the December Report (Chart 2.19). The forecasts for core inflation in the coming quarters are closely aligned with the SMART forecasts.
CPI-ATE. Four-quarter change. Percent3
- Due to the war in the Middle East, spot and forward prices for oil and a number of other commodities have increased substantially and freight rates have risen, pushing up Norges Bank’s indicators of international price impulses to imported intermediate goods (IPI) and international price impulses to imported consumer goods (IPK) (Chart 2.20). Further out in the projection period, international price impulses are assumed to ease gradually, but there is considerable uncertainty surrounding future developments in price impulses.
Four-quarter change. Percent4

- Wage growth has been high in recent years compared with productivity growth. This has resulted in a rapid rise in business costs, which has contributed to keeping inflation elevated (Chart 2.21). Compared with the December Report, wage growth projections have been revised up ahead.
Contribution to four-quarter change in the CPI-ATE. Percentage points5

- Following the inflation surge, rent inflation in the CPI has also increased, albeit with a lag, which may reflect limits on how much rent can be raised in existing leases. Rent inflation declined considerably through spring 2025 but has since slowed and recently edged up. Higher rent inflation may be a result of low residential construction in recent years and higher interest rates (see box on page 50 for a further discussion). If so, this may indicate that rent inflation will also remain elevated ahead. In the projections, rent inflation is assumed to continue to outpace core inflation in the coming years. Projected rent inflation has been revised up from the December Report.
- The krone exchange rate has recently appreciated (see “Krone exchange rate”). In the projections, the stronger krone has a dampening effect on inflation in the coming years (Chart 2.21).
- Capacity utilisation is expected to decline somewhat in the years ahead. Lower capacity utilisation dampens inflation through lower demand for labour, goods and services. Compared with the December Report, the near-term output gap projections are little changed and have been revised down somewhat further out in the projection period.
- Household inflation expectations ahead, as measured by Norges Bank’s Expectations Survey, are still higher than the inflation target. Business leaders’ inflation expectations are also high and can in particular provide information about inflation ahead (see “The role of expectations in price formation” for a more detailed discussion).
Consumer price inflation
Consumer price inflation measured as an annual average is expected to increase to 3.4% in 2026 and to decline thereafter through the projection period. Compared with the December Report, CPI inflation projections for 2026 have been revised up substantially. The projections are based on the following:
- Prospects for higher core inflation in 2026 contribute to raising overall inflation. In the coming years, core inflation is expected to gradually decline towards 2%.
- This winter, electricity prices have been higher than futures prices indicated in December, and upon which Norges Bank’s projections were based. In southern Norway, the fixed electricity price scheme "Norgespris" has shielded a majority of households, but this has not been the case to the same extent in central and northern Norway.
- Following the outbreak of the war in the Middle East, energy prices have increased, and futures prices indicate that they will remain elevated for a period ahead. Petrol and diesel prices have increased as a result of higher oil prices, while higher gas prices have led to a rise in electricity prices, particularly in southern Norway. While fixed price contracts shield households from the rise in electricity prices, higher petrol prices have a direct impact on consumer prices. There is substantial uncertainty concerning the duration of the war and its implications for energy markets (see “Energy and other commodity prices”).
- 1 Contributions estimated based on the CPI by consumption categories (group level). In the statistics, some differences occur between the sum of the components and overall inflation.
- 2 See Husabø, E. (2017) “Indicators of underlying inflation in Norway”. Staff Memo 13/2017, Norges Bank, for a more detailed review of the indicators. The indicators included in the bands are CPIM, CPIXE, 20 percent trimmed mean, CPI-XV, CPI-common and weighted median.
- 3 The SMART modelling system for short-term forecasting is based on historical relationships. It weights empirical models based on previous forecasting properties.
- 4 IPI: International price impulses to imported intermediate goods, see Brubakk, L., K. Matsen, K. Mjølnerød, Ø. Robstad og E, Werenskiold (2024) “Charting the upstream: An indicator for imported input goods prices”. Staff Memo 5/24. Norges Bank. IPK: Prices for consumer goods imported to Norway (including freight rates), see Røstøen, J. Ø. (2004) “External Price Impulses to Imported Consumer Goods”. Economic Bulletin 04 Q3. Norges Bank.
- 5 Isolated individual contributions from various cost components in the CPI-ATE. The residual refers to the difference between the sum of the individual contributions and the CPI-ATE. ULC: Unit Labour Cost. IPK: Prices for consumer goods imported to Norway. IPI: International price impulses to imported intermediate goods.
3. Monetary policy analysis
This section describes the monetary policy analysis presented to Norges Bank’s Monetary Policy and Financial Stability Committee, forming part of the basis for the policy rate decision. The policy rate forecast is explained in Monetary Policy Statement.
Model implications of new information
New information
The forecasts and the monetary policy analysis are based on the macroeconomic model NEMO and other economic models, as well as on analyses of the current economic situation and assumptions regarding key driving forces. For 2026 Q1 and Q2, NEMO is conditioned on projections based on the information and analyses presented in Section 2. Beyond the first two quarters, the model is conditioned on various exogenous driving forces, including oil and gas prices, global economic developments and petroleum investment. After conditioning on historical data, short-term forecasts and exogenous driving forces, NEMO provides forecasts for the remainder of the forecast horizon. The forecasts are cross-checked against other models.
Unchanged policy rate path and model path conditioned on new information since MPR 4/25. Percent1

To summarise how new information and new assessments of the economic situation have affected the forecasts since the December Monetary Policy Report, Chart 3.1 presents forecasts of the output gap and inflation adjusted for tax changes and excluding energy products (CPI-ATE) given the same policy rate path as in December. Key premises for this analysis are:
- The rise in the CPI-ATE has been higher than projected in the December Report, and the short-term inflation projection has been revised up. Higher wage growth in 2026 than previously projected is expected to push up inflation further out.
- The output gap forecast is little changed for the near term. The real interest rate is lower given the same policy rate path as in December, reflecting higher-than-projected inflation, which increases the output gap slightly in this exercise.
- The krone has appreciated since the December Report, contributing to lower inflation and a lower output gap further out. This appreciation must be viewed in the context of higher policy rate expectations and a wider interest rate differential against other countries. In the exercise with an unchanged policy rate path, the exchange rate is therefore assumed to be somewhat weaker ahead.
- Prices for oil and a number of other commodities have increased as a result of the war in the Middle East (see “Energy and other commodity prices”). This has fuelled inflation through higher prices for power and imported goods, which weighs down on household purchasing power in the model framework. In the model, higher oil prices have also contributed to a stronger krone. At the same time, the rise in prices of Norwegian exports, such as oil and aluminium, will strengthen profitability and boost activity in some segments of the Norwegian business sector. In isolation, this pushes up wage growth and purchasing power. Overall, higher oil prices lift inflation in the model framework, but the overall effect on the output gap is small.
The exercise indicates that given an unchanged rate path, inflation will be higher than projected in December throughout the projection period, and the output gap becomes slightly higher in the period to mid-2028.
The model’s policy rate path
NEMO generates a policy rate path aimed at striking a balance between low and stable inflation and high and stable output and employment given the structure of the model. New information and new assessments will normally generate changes in the model-based policy rate path (model path).
The model path is higher than the rate path from the December Report throughout the forecast horizon (Chart 3.1, left panel). Owing to a higher policy rate, the model indicates prospects for lower inflation and capacity utilisation than in the exercise with an unchanged rate path. Compared with the forecasts from December, the output gap given the model path is lower from 2026 Q4 (Chart 3.1, right panel), and inflation is higher throughout the forecast horizon (Chart 3.1, middle panel). The krone exchange rate is assumed to weaken somewhat upon publication of this Report if the rate path follows the model path, reflecting the fact that the model path is lower than market policy rate expectations ahead.
In the decomposition in Chart 3.2, NEMO and the monetary policy rule GEORG are used together to decompose how the rule would have changed the policy rate given new information since the December Report. Unlike previous Reports, the decomposition does not show the underlying driving forces behind the changes in the rate path. The bars in the chart show how changes in the model forecasts for inflation, the output gap and the krone exchange rate, among other factors, contribute to changes in the model path (see box "A monetary policy rule for understanding changes in the policy rate path" in Monetary Policy Report 4/2025). The forecasts assumed in the decomposition are consistent with new information and the model path. The broken line shows the sum of the bars, and the solid line shows changes in the policy rate forecast.
Cumulative contributions. Percentage points2
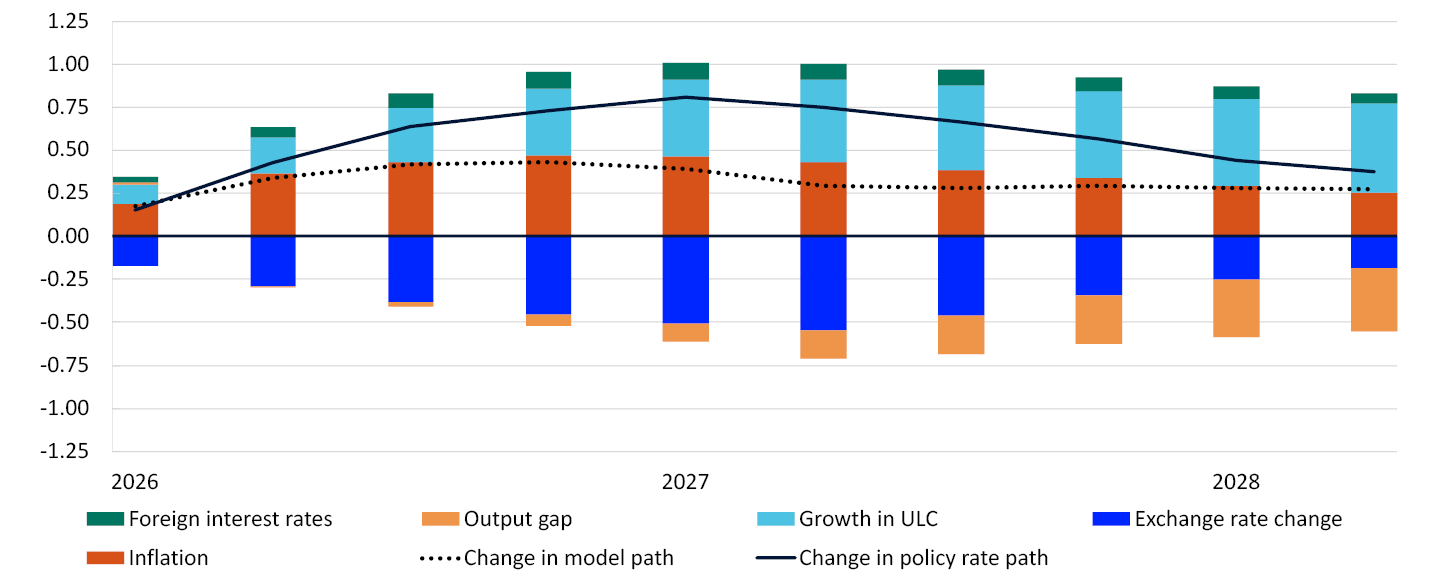
The model path is higher than in the December Report throughout the forecast horizon. The main contributions to the changes are:
- Inflation has been higher than projected in the December Report and is also projected to be higher ahead. Under the GEORG monetary policy rule, higher inflation results in a higher policy rate. Prices therefore push up the model path (red bars).
- The output gap is little changed in the near term but lower further out. This pulls down the model path from beginning of 2026 H2 (orange bars). Further out in the forecast horizon, higher interest rates also pull down the output gap.
- Compared with the December Report, wage growth is projected to be higher throughout the projection period, reflecting stronger business profitability and prospects for higher inflation. Projected productivity is little changed. Combined, these factors push up unit labour costs, which, in the model, is an indicator of future inflationary pressure. Unit labour costs push up the model path throughout the forecast horizon (light blue bars).
- The krone exchange rate has appreciated since the December Report and is projected to remain strong ahead, which will help ease inflationary pressures further out through lower prices for imported consumer and intermediate goods and weaker net exports. The krone exchange rate therefore pulls down the rate path (dark blue bars).
- In the near term, market-implied policy rates abroad are somewhat higher than in the December Report, which pulls the rate path up slightly (green bars).
Even though oil prices are not directly included in GEORG, they will affect the rate path through multiple channels. Higher oil prices have likely contributed to strengthening the krone exchange rate (see “Krone exchange rate”), which in isolation pulls down the rate path. In NEMO, higher oil prices also contribute to higher wage and price inflation, which pushes up the rate path. Overall, higher oil prices push up the policy rate in the model.
The policy rate forecast in this Report is higher than the model path. As a higher policy rate affects prospects for eg inflation and the output gap, the assumed paths for these variables in the decomposition will deviate from the projections in the Report. Inflation is for example assumed to be lower when the policy rate follows the rate path rather than the model path.
Other indicators relevant to monetary policy analysis
Other indicators relevant to the conduct of monetary policy have also been presented to the Committee:
- Norges Bank’s simple Taylor rule is used as a simple cross-check of the model path. The rule provides an estimated relationship between the policy rate on the one hand and, the policy rate in the previous quarter, the projection for the long-term interest rate level and inflation and output gap projections based on the historical monetary policy response pattern on the other hand (see Monetary Policy Report 1/2025). The rule now indicates a higher money market rate in the coming quarters than in the December Report (Chart 3.3) as the inflation projection has been revised up. Compared with the December Report, the simple rule implies that the policy rate will be 0.3 percentage point higher in 2026 Q2.
Three-month money market rate. Percent3

- Market-implied policy rates ahead can provide an indication of the market’s interpretation of new information since December and market expectations of the monetary policy response. Since December, market-implied policy rates ahead have risen throughout the forecast horizon (Chart 3.4, left panel). Policy rate expectations rose by up to 0.3 percentage point on 10 February when the January CPI inflation figure was published. Since then, market pricing has risen further, primarily for the period to end-2027, and pricing is now up to 1.0 percentage point higher than in December. Market pricing may differ from Norges Bank’s policy rate forecast eg if market participants have different expectations for inflation and developments in the Norwegian economy. In addition, term premiums may cause policy rate expectations to be below levels indicated by the market pricing in Chart 3.4.
Policy rates. Percent4

- Norway is a small and open economy, with financial markets closely intertwined with those of its trading partners. Changes in foreign market rates can affect the krone exchange rate, and they provide an indication of market expectations for the global economic outlook. Market-implied policy rates among Norway’s main trading partners are higher towards the end of the forecast horizon (Chart 3.4, right panel). Policy rate expectations have risen since the outbreak of the war in the Middle East, reflecting higher inflation expectations on the back of increased oil and gas prices. Market-implied policy rates among trading partners are now higher than in the December Report, and expectations shown in the chart are 0.6 percentage point higher than in December. As the increase in market-implied policy rates ahead is smaller abroad than in Norway, the interest rate differential against other countries has increased.
- 1 Projections from MPR 4/25; with new information conditioned on the policy rate path from the previous Report; and with new information and the model path from this Report. CPI-ATE: The CPI adjusted for tax changes and excluding energy products. The output gap measures the percentage deviation between mainland GDP and projected potential mainland GDP.
- 2 The contributions are based on the GEORG monetary policy rule and reflect changes in forecasts between this Report and the previous Report. The forecasts are derived from NEMO when monetary policy follows the model path from GEORG. The policy rate path in this Report is higher than the model path. As a higher policy rate affects prospects for eg inflation and the output gap, the assumed path in the decomposition will deviate from the projections in the Report. Since the rule also gives weight to the fact the policy rate should not be adjusted too quickly, changes to the model projections will gradually change the level. The forecasts are included as deviations from trend.
- 3 The rule uses projections three quarters ahead for inflation and projections for the current quarter for the output gap. Since the output gap has been adjusted in previous quarters, the simple rule also indicates a slightly different rate before the current quarter.
- 4 12 December: cutoff for the MPR 4/25 projections.
10 February: publication date for consumer price index for January.
20 March: cutoff for the MPR 1/26 projections.
The policy rate abroad is a trade-weighted average of the policy rates of the Bank of England, the European Central Bank, the Federal Reserve and Sveriges Riksbank. Owing to substantial uncertainty related to the level of policy rate expectations ahead, partly due to possible term premiums in market interest rates, the modeling system conditions on the foreign market interest rates only in the first year (see Monetary Policy Report 1/2025).
The monetary policy stance
Description of the policy rate path
The policy rate forecast (policy rate path) is higher than in the December Report. The policy rate path is consistent with an increase in the policy rate at one of the forthcoming policy rate meetings and is consistent with a policy rate between 4.25 % and 4.5% at the end of 2026. The forecast indicates a gradual decline in the policy rate from mid-2027, reaching 3.4% towards the end of the projection period.
Market rates and measures of monetary policy restrictiveness
How the policy rate affects the economy depends on both the pass-through to market rates and how high these rates are compared with inflation and the long-term neutral interest rate level. Key factors in this Report are:
- The money market spread is the difference between three-month Nibor, which is an important reference rate in the Norwegian money market, and the expected policy rate. From June 2026, forward-implied pricing increased slightly upon publication of information about Norges Bank's certificate programme on 25 February. Overall forward-implied pricing of the spread is nevertheless broadly as assumed in the December Report, and spread projections ahead are unchanged. The money market rate forecast has therefore been revised broadly to the same extent as the policy rate forecast (Chart 3.5).
- The residential mortgage rate has been broadly as projected in the December Report. The forecast indicates that the mortgage rate will rise approximately in line with the policy rate and the money market rate. The mortgage rate is projected to rise from 5.1% in 2026 Q1 to 5.4% in 2027 Q1, before drifting down from the end of 2027 (Chart 3.5).
Percent5
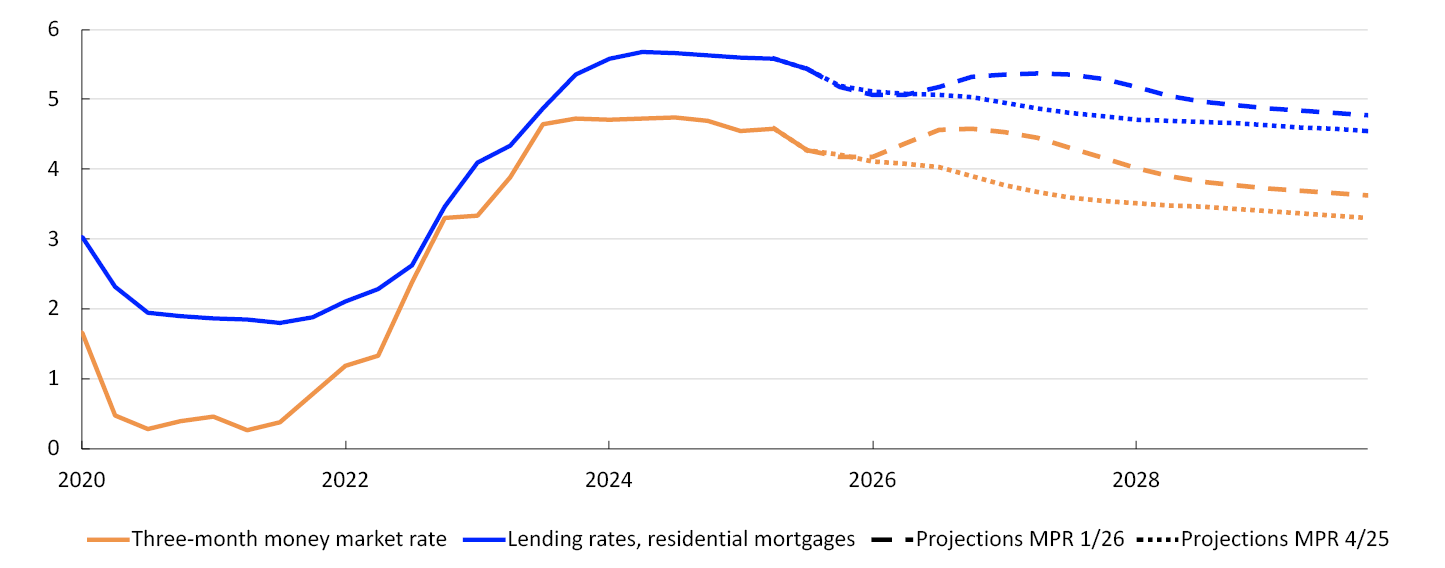
- The expected real interest rate relative to the neutral level is a measure of monetary policy restrictiveness. The neutral real interest rate is the real interest rate level that is consistent with a balanced economy over time. Here, the expected real interest rate is defined as Norges Bank’s money market rate forecast less the Bank’s inflation forecast. The expected real interest rate is higher than in the December Report throughout the projection period (Chart 3.6), which reflects the Committee’s intention to pursue a more restrictive monetary policy stance. The real interest rate is slightly higher than the interval of Norges Bank’s estimate of the neutral real interest rate.
Estimate of the expected real money market rate. Percent6

Monetary policy trade-offs
The trade-offs between low and stable inflation and high and stable output and employment are reflected in the Monetary Policy Statement and in the inflation and output gap forecasts. The policy rate, inflation and output gap forecasts are shown in the chart in the Monetary Policy Statement.
The points in Chart 3.7 show the average forecasts one to three years ahead for the output gap and the inflation gap (difference between inflation and the target) in different reports. The location of the points in the chart depends on the shocks to the economy and the monetary policy response. In this Report, inflation one to three years ahead is little changed, while the output gap is lower.
Compared with previous Reports, the forecasts now indicate that a larger decline in the output gap is needed ahead to return inflation to target within a reasonable time horizon.
Inflation gap and output gap. Average 1–3 years ahead. Percent7
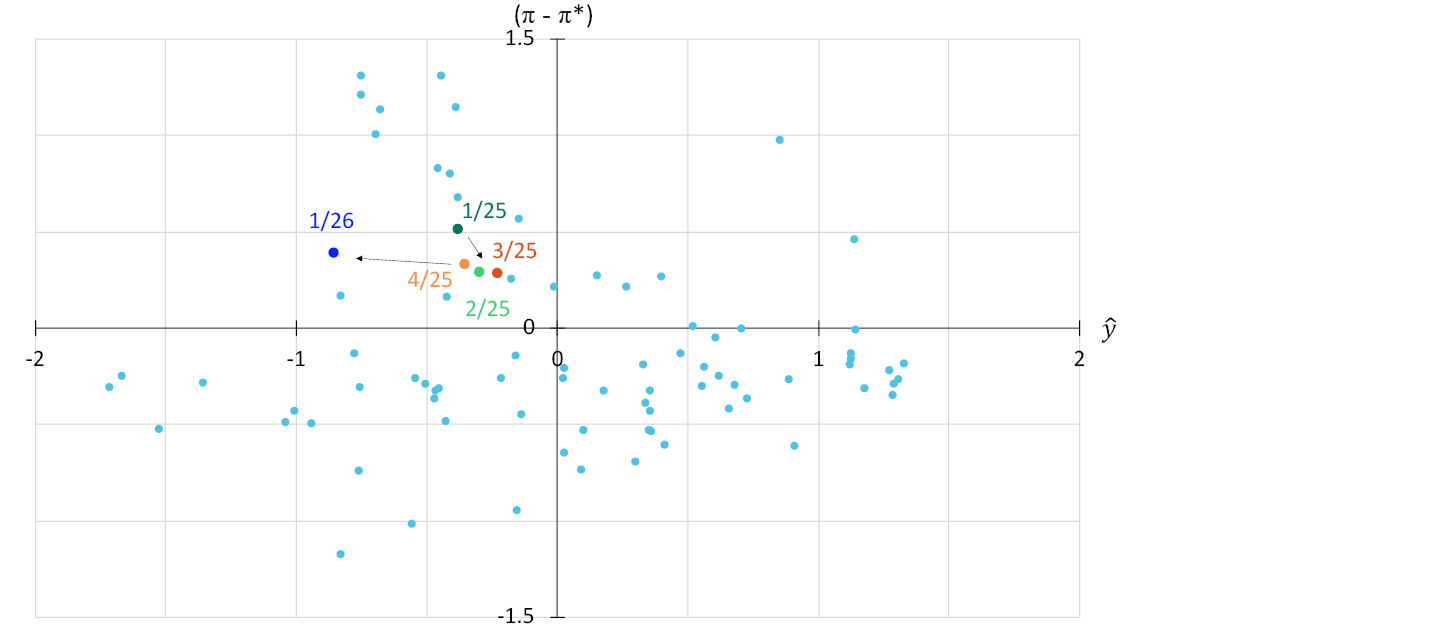
Forecast errors and trade-offs
There is substantial uncertainty associated with the projections in the Monetary Policy Report. The box "Historical forecast errors and uncertainty indicators" shows the uncertainty of the projections based on historical forecast errors. This box shows how the inflation and output gap forecasts have been revised in recent years.
The Norwegian economy may evolve differently than envisaged for a number of reasons. First, new and unforeseen shocks may occur. One example is foreign demand and supply shocks, which pushed up imported inflation in 2022 and 2023 (see box "What has driven inflation – supply or demand?" in Monetary Policy Report 2/2024). Second, economic relationships may differ from assumptions in our model framework. One example is that monetary policy may be more or less restrictive than assumed because the neutral real interest rate may differ from that assumed or because inflation expectations differ from the expectations in the model framework. Another example is that shocks to the economy may have a more persistent impact than they have had historically.
Chart 3.A shows the projections for inflation and the output gap for 2026 Q1 published in different reports. The first bar in the chart shows the projection for the current quarter published in Monetary Policy Report 1/2023, ie 12 quarters earlier. The last bar shows the projection for the same quarter published in this Report. The chart shows that the projections for both inflation and the output gap have been revised up over time. Compared with Monetary Policy Report 1/2023, the output gap is now projected to be 0.4 percentage point higher and inflation to be 0.6 percentage point higher in the current quarter.
Projections for 2026 Q1. Percent1

The projections have been changed at the same time as the economy has evolved differently than envisaged. Chart 3.B shows the inflation projections relative to the target (vertical scale) and the output gap (horizontal scale) for each quarter ahead in different monetary policy reports, from Monetary Policy Report 1/2023 to 1/2026. In each of these reports, inflation was projected to gradually decline from the high levels in 2023, while the output gap would decrease and become negative. For example, the green points show the quarterly projections published in Monetary Policy Report 1/2023. Inflation was at that time projected to be 4.2 percentage points above the inflation target in 2023 Q1 (green point, top right) and to gradually move down along the green line and end 0.4 percentage point above target at the end of the forecast horizon (last green point). The red, orange and blue points show the corresponding projections for Monetary Policy Report 1/2024, 1/2025 and 1/2026, respectively.
The thick blue line in Chart 3.B shows the actual changes in inflation and the output gap from 2023 Q1 (point, top right) to 2025 Q4. Through 2023, inflation declined approximately as quickly as assumed at the start of 2023, while the output gap remained somewhat higher than projected. Through 2024, inflation declined faster than expected, while the output gap decreased less than expected. From the end of 2024, inflation has been stable at around 1 percentage point above the inflation target while output has been close to potential.
Actual developments and projections in different reports. Percent2
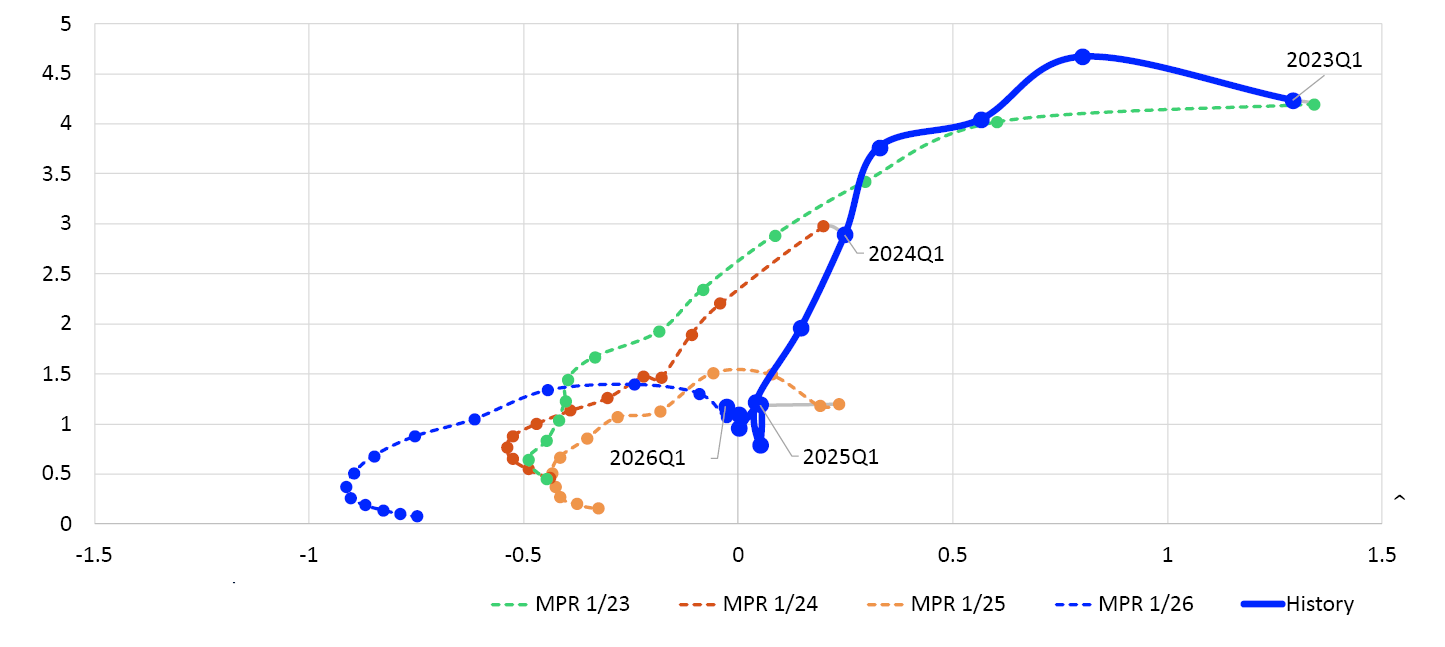
- 1 Projections for the output gap (left panel) and growth in CPI-ATE (right panel) for first quarter 2026. The projections have been published in different Monetary Policy Reports.
- 2 Broken lines show the quarterly projections for inflation relative to the inflation target (vertical axis) and the output gap (horizontal axis). Different colours show the projections published in different monetary policy reports. The blue solid line shows the actual path for inflation and the output gap from 2023 Q1 until 2025 Q4.
Historical forecast errors and uncertainty indicators
The analyses in this box form part of the basis for assessing the uncertainty related to Norges Bank’s forecasts. Fan charts based on historical forecast errors provide an indication of the general level of forecast uncertainty. Model uncertainty indicators suggest that the uncertainty surrounding GDP and underlying inflation forecasts is close to historical levels.
Historical forecast errors are deviations between forecasts and actual developments (see box "Indicators of uncertainty surrounding point forecasts in the near and medium term" in Monetary Policy Report 3/2025). Chart 3.C shows the uncertainty of the forecasts in this Report based on historical forecast errors from the past 20 years. The fan charts are centred on the forecasts in this Report. If future forecast errors follow the same pattern as the historical errors, actual outcomes will lie within the light shaded areas with a 70% probability. The distributions will change little from one report to the next.
Historical forecast errors centred on inflation, policy rate and output gap forecasts. Percent1
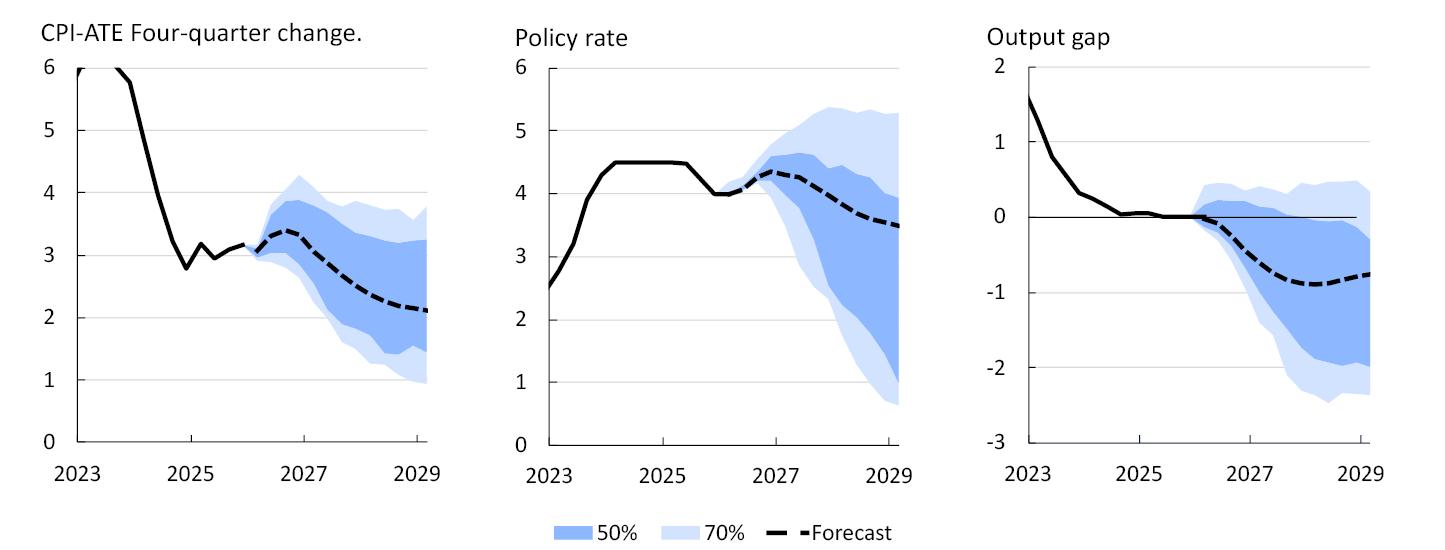
Historical forecast errors provide an indication of the uncertainty normally surrounding Norges Bank’s forecasts but provide little indication about changes in uncertainty over time. Uncertainty indicators from an estimated model framework are used to show how uncertainty has changed in recent years and how the range of possible outcomes is expected to look ahead.2 The model framework captures the relationship between a range of economic variables and uncertainty ahead. The upside risk is measured here as the difference between the 95th percentile and the median of the distribution, while the downside risk is measured as the difference between the median and the 5th percentile. As the models are based on information up to and including 2025 Q4, they will not capture the potential effects on uncertainty resulting from the war in the Middle East.
The models indicate that near-term uncertainty surrounding mainland GDP is at a normal level (Chart 3.D, left panel). In the longer term, the downside risk is somewhat lower than the historical average (right panel). Both the upside and downside risk to GDP are little changed since the December Report.
Spread between different percentiles and median from quantile regressions. Fourquarter change in Norwegian mainland GDP. Percentage points3
There are also minor changes in uncertainty related to underlying inflation in the near term (Chart 3.E, left panel). In the longer term, the distribution is slightly skewed towards the downside but has moved a little closer to its historical average since the December Report (Chart 3.E, right panel).
Spread between different percentiles and median from quantile regressions. Four-quarter change in CPI-ATE. Percentage points4
- 1 The range of possible outcomes for underlying inflation (CPI-ATE), the policy rate and the output gap are based on forecasting errors over the past 20 years. The distributions are centered on the projections from this report.
- 2 The models use quantile regressions, with different indicators to estimate the distribution of output growth, house price inflation and consumer price inflation ahead. See further description in Bowe, F., S.J. Kirkeby, I.H. Lindalen, K.A. Matsen, S.S. Meyer and Ø. Robstad (2023) “Quantifying macroeconomic uncertainty in Norway". Staff Memo 13/2023. Norges Bank.
- 3 The charts show developments in the spread between the 5th and 95th percentiles and the median for the model-estimated distribution of GDP growth one and eight quarters ahead, respectively. Broken lines indicate average 5th and 95th percentiles compared to the median between 2010 and 2019.
- 4 The charts show developments in the spread between the 5th and 95th percentiles and the median for the model-estimated distribution of consumer price inflation one and eight quarters ahead, respectively. Broken lines indicate average 5th and 95th percentiles compared to the median between 2010 and 2019.
- 5 The residential mortgage rate is the average rate on outstanding mortgage loans to households from the sample of banks and mortgage companies included in Statistics Norway’s monthly interest rate statistics.
- 6 The expected real interest rate is the projected money market rate over the next four quarters less projected CPI-ATE inflation over the same period. For 2026 Q1 and in the projection period, the expected real interest rate is estimated based on the projections in this Report. For all previous periods, the expected real interest rate is based on the most up-to-date Monetary Policy Report at the time in question. Norges Bank’s estimated interval for the neutral real interest rate has been adjusted over time (see Monetary Policy Report 2/2025). The interval for the neutral real money market rate is now between 0.4% and 1.65%.
- 7 The chart shows combinations of forecasts for the output gap (y) and inflation (Π) as deviations from the target (Π*) on average one to three years ahead. Each point represents the forecasts in a specific Monetary Policy Report. There are prospects for near-optimal attainment of objectives if the points are close to the origin. However, the points will typically be some distance from the origin following major shocks.
Boxes
Significance of the CPI rent component
The consumer price index (CPI) is constructed to reflect developments in Norwegian households’ cost of living and therefore also comprises housing costs. For tenants, rent paid represents housing costs. For homeowners, a home purchase is considered an investment in housing capital, which in turn entails a continuous flow of housing services. In the CPI, owner-occupiers’ housing services are calculated on the basis of developments in rent paid and is referred to as imputed rent. Following the general rise in prices in 2022 and 2023, rent inflation in the CPI has also increased, albeit with a lag (Chart A).
Twelve-month change. Percent1
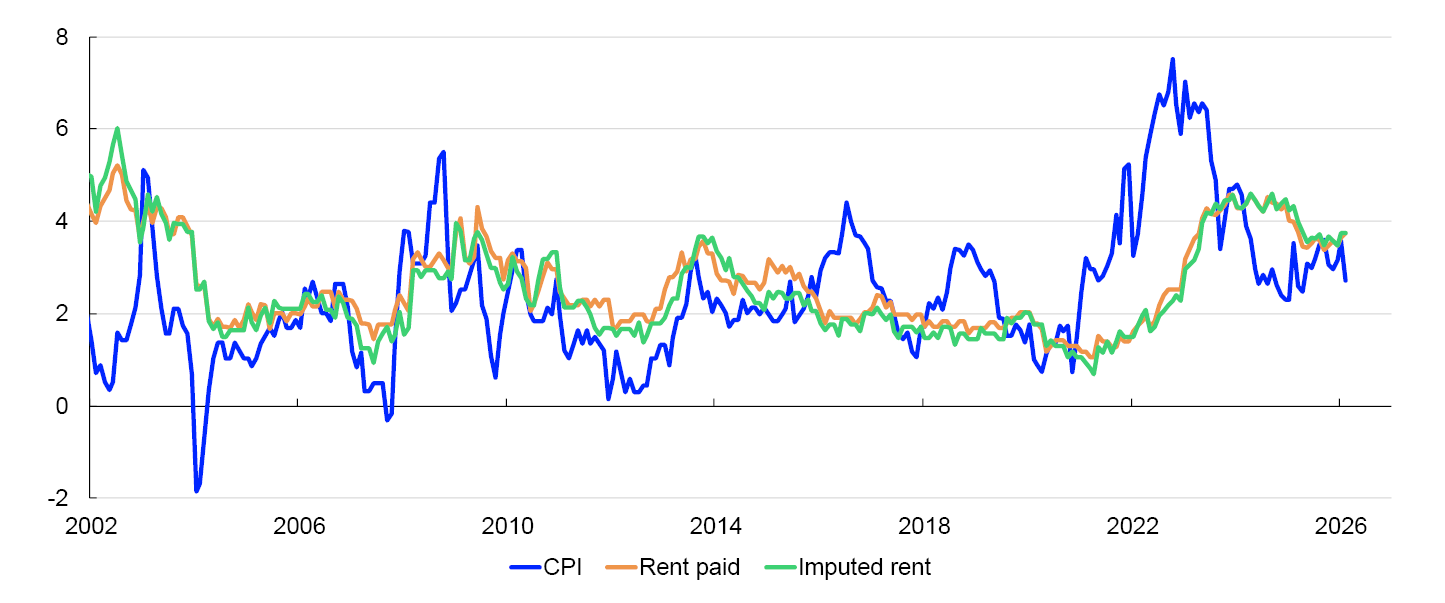
A new and improved method for calculating the value of owner-occupied housing was introduced in the latest main revision of the national accounts published in November 2025. The change in method has led to a considerable upward revision of the figures for housing consumption, with an increase in the rent weight in the CPI from 18% in 2025 to 26% in 2026.2 This weight has previously been relatively stable.
Unlike the national accounts, the CPI is not revised historically. To shed light on the isolated effect of the weight change, we calculate historical movements in the CPI using the current weight. In addition, the CPI has been calculated excluding rent (Chart B). As shown in Table A, the average rise for the three indices is approximately the same. However, rent inflation volatility has been somewhat lower than the volatility of other CPI components, which means that the variation in the CPI would have been slightly lower with the current weight.
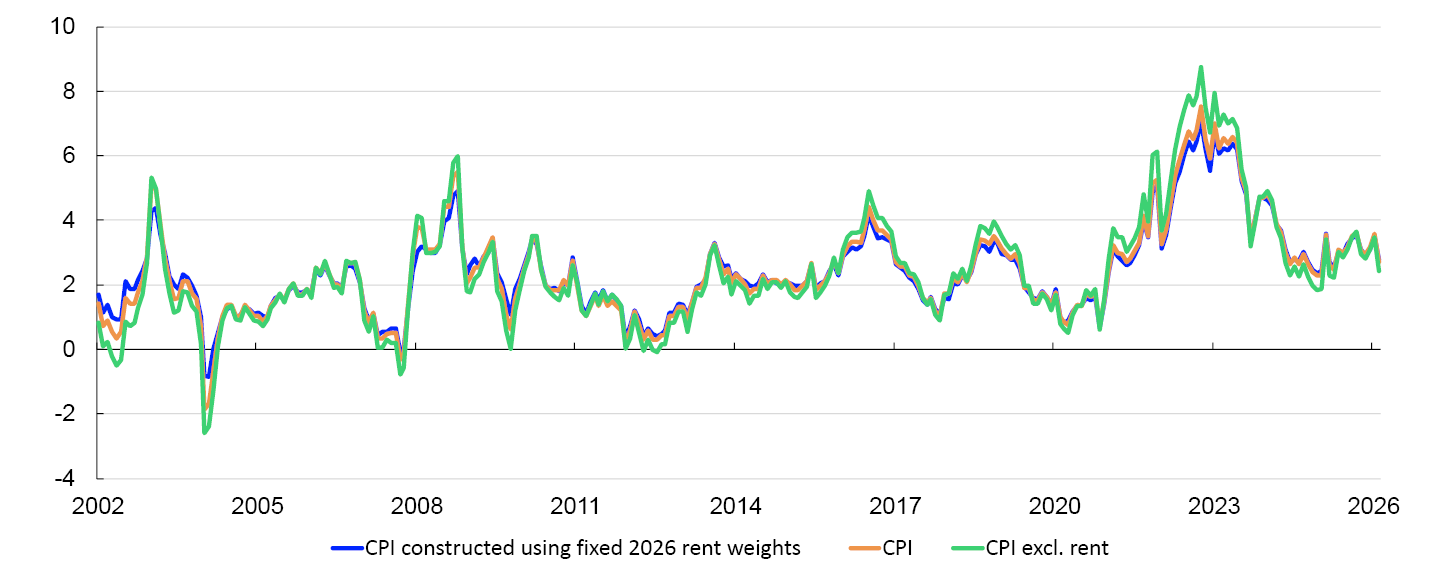
Table A
|
Weight |
Vekt |
Average (2003–2026) |
Standard deviation |
|---|---|---|---|
|
CPI 26 rent weight |
26% |
2.4 |
1.4 |
|
CPI |
14–26% |
2.4 |
1.5 |
|
CPI excl. rent |
0% |
2.4 |
1.8 |
Lower rent volatility may reflect limitations on how much rent in existing leases can be increased. Existing leases can only be adjusted in line with the CPI once a year and at the earliest one year after the rent was set. After three years, rents can be adjusted to the standard market rate (average rental price for comparable homes). Even though average rent has risen in pace with the overall CPI excluding rent over the past ten years, it is not given that this will continue.
Rents are affected by more factors than the general rise in prices alone. Factors such as population growth, income growth and housing affordability affect demand for rental housing. On the other hand, the supply of rental housing is affected by housing construction and the share of rental housing. In recent years, the number of privately owned secondary homes and homes owned by limited liability companies have fallen as a share of the housing stock in Oslo, while the share has remained stable in the rest of Norway.4 At the same time, the tax on secondary homes and interest rates have risen. Price statistics from Real Estate Norway and Husleie.no show that rents in new leases have increased markedly in recent years (Chart C). Even though leases in high-demand areas are over-represented in these indices relative to the CPI, this may indicate that new leases will push up rent inflation in the CPI ahead.
Four-quarter change. Percent5

With prospects for lower overall inflation further out in the projection period, rent inflation in the CPI is likely to moderate over time, but the time path will depend on how quickly rent in existing leases is adjusted and how other factors, such as supply and demand for rental housing, evolve. Since the December Report, rent inflation in the CPI has been higher than assumed in Norges Bank's projections. In addition, indicators of rent in new leases have picked up, at the same time as overall inflation is expected to be higher in the near term. Rent inflation is therefore assumed to remain elevated somewhat longer than assumed in December.
- 1 Paid and imputed rents refer to COICOP groups 04.1 and 04.2.
- 2 For more detailed information regarding the main revision and rent in the CPI, see Statistics Norway (2025) Benchmark revision of the national accounts – SSB (13 November) and Consumer price index – Statistics Norway.
- 3 CPI with fixed rent weights is constructed at the group level and calculated as a chained index.
- 4 NEF (2026) “Boliger eier ikke bor i – sekundærboliger, profesjonelt eide boliger og utenlandsk eierskap (2025 Q4)” [“Homes where owners do not live – secondary homes, professionally owned homes and foreign ownership (2025 Q4)”] (in Norwegian only), Norwegian Association of Real Estate Agents (NEF), Ambita and Samfunnsøkonomisk Analyse 8 March.
- 5 Storbyindeksen [city index] (Real Estate Norway) covers the areas of Oslo, Bergen, Trondheim, Stavanger and Sandnes. Husleieindeksen [rent index] (Husleie.no) covers the country as a whole.
The role of expectations in price formation
Since 2002, Norges Bank has measured the inflation expectations of different groups in the Norwegian economy in the Expectations Survey. This box examines the covariance between inflation expectations and inflation in the Norwegian economy, and whether including inflation expectations in a simple empirical model can improve the accuracy of inflation forecasts.
Recent empirical literature using firm data shows that when firms expect higher inflation, they immediately set prices higher, exceeding the level that can be explained by developments in wages and other costs.1 This suggests that firms’ expectations – as firms are price setters – may be particularly relevant for price formation.
Short-term inflation expectations are particularly relevant for price setting as firms typically take into account expected cost and price movements until the next price adjustment.2 This box therefore focuses on business leaders’ inflation expectations 12 months ahead. Business leaders represent price-setting firms, and inflation expectations are therefore assessed against domestically produced goods and services inflation, which reflects domestic cost and demand conditions to a greater extent.
Inflation expectations 12 months ahead have historically been relatively close to the inflation target. In recent years, business leaders’ expectations in particular have risen markedly, in pace with the surge in domestic inflation (Chart D). Even though inflation has fallen considerably since the peak, both inflation and inflation expectations remain relatively high.
Four-quarter change. Expectations refer to 12-month change in the CPI 12 months ahead3

A simple empirical framework is used based on the expectations-augmented Phillips curve,4 where inflation relates to the output gap, inflation expectations and a set of control variables.5 Through the expectations channel, higher expected inflation can immediately lead to higher wage growth and price adjustments. The Expectations Survey is deliberately scheduled to measure expectations in the period preceding the publication of the CPI figure. The output gap is measured using an unemployment gap, defined as the deviation between actual unemployment and the lowest unemployment level that is estimated to be consistent with stable inflation at any given time.
This is investigated empirically by assessing the extent to which inflation expectations explain inflation volatility, by comparing specifications with and without expectations in the Phillips curve, defined by:
πtbenchmark = βππt–m + βu(ut – u*t) + βsst + εt
πt = βππt–m + βu(ut – u*t) + βEEt[πt+12] + βsst + εt
where πt is inflation measured by 12-month change, πt–m is the rise in prices over the past m months to time t, ut – u*t is the unemployment gap and Et[πt+12] is 12-month CPI inflation expectations 12 months ahead. st is a price shock6 vector that affects firms’ production costs and is included as a control variable in the model. εt is the residual term. When inflation is measured as the 12-month change, price developments in the preceding months will explain some of the rise in inflation in the current period.
The results imply that business leaders’ inflation expectations have a positive and statistically significant relationship with inflation when included in the model (Table B). When business leaders expect higher inflation 12 months ahead, this coincides with higher inflation in the current period. The relationship cannot be interpreted as causal and does not rule out that expectations may also correlate with variables omitted from the analysis. At the same time, the results suggest that inflation expectations reflect relevant information as the model’s explanatory power increases. Beyond this, the results are consistent with what one would expect from a Phillips curve framework: a tighter labour market, as measured by a narrower unemployment gap, is related to higher inflation.
Table B
|
Dependent variable: π12-month growth |
Benchmark |
Business leaders |
|
ut – u*t |
-0.19*** |
-0.15** |
|
πt–1 |
0.59*** |
0.51*** |
|
Et[πt+12] |
0.13*** |
|
|
Controls |
Yes |
Yes |
|
Adjusted R2 |
0.919 |
0.923 |
|
N |
94 |
94 |
The results above show that inflation expectations correlate with inflation in the current period. A natural question is whether expectations also reflect information about inflation ahead. In the following, we investigate the robustness of this relationship by testing the model’s forecasting properties (out-of-sample) with and without inflation expectations, ie whether they lead to more accurate estimates than a model without expectations. The investigation is based on the same Phillips curve as in the previous analysis, but with the dependent variable adjusted to apply to inflation h quarters ahead. Chart E shows the models’ ability to predict future inflation at different horizons for the entire sample period, and for periods before and after the pandemic, relative to forecast errors from a benchmark model without expectations.
RMSE for model including expectations relative to the benchmark for different periods7
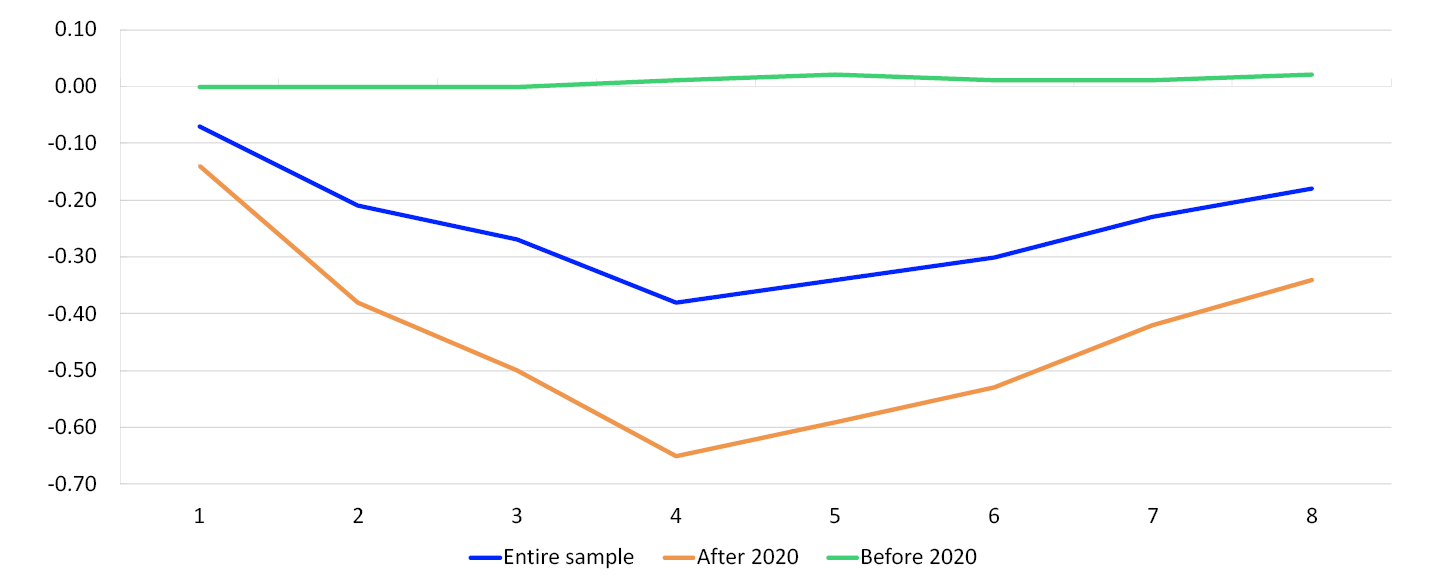
Over the entire sample period, business leaders’ expectations are found to improve the model’s forecasting properties, measured as root mean square error (RMSE).8 This is shown by the black line being below zero for all horizons. The improvement is greatest for forecasts four quarters ahead where the model, which includes expectations, has a 0.6 percentage point lower forecast error.9
Relative to the benchmark, the improvements are most prominent in the period since 2020, which has been marked by high inflation and wider variation in inflation expectations. In the years preceding 2020, the expectations provide no added value. This may suggest that the informational value of inflation expectations is highest in periods when expectations are in flux, while the contribution is limited when inflation and expectations are low and stable. In line with international literature, the results show that the forecasting properties of the Philips curve vary over time and depend on the economic situation.10
Overall, the analysis indicates that the inflation expectations of business leaders partly explain developments in domestic inflation, even when other macroeconomic driving forces are controlled for.11 This may indicate that high inflation will be more persistent if expectations remain high over time.
- 1 Gautier E., F. Savignac and O. Coibion (2025) “Firms’ Inflation and Wage Expectations during the Inflation Surge”. NBER Working Papers 33799.
- 2 See eg Coibion O. and Y. Gorodnichencho (2025) “Inflation, Expectations and Monetary Policy: What Have We Learned and to What End?». NBER Working Papers 33858.
- 3 Expectations and domestic inflation in the period to 2025 Q3, same sample upon which the analysis is based.
- 4 See eg Phelps E.S. (1967) “Phillips Curves, Expectations of Inflation and Optimal Unemployment over Time”. Economica, 34(135), pp 245–281 and Friedman M. (1968) “The role of monetary policy”. American Economic Review, 58(1), pp 1–17.
- 5 For a more detailed description of the method, see Lindalen, I.H. and K. Mjølnerød (2026) "The role of inflation expectations in price setting: the Norwegian experience". Staff Memo 3/2026. Norges Bank. Forthcoming.
- 6 The control variables in this analysis include exchange rates, energy prices and international food prices.
- 7 Each line shows RMSE for a model without expectations relative to benchmark for each horizon and each sample. The X axis shows quarters ahead and the Y axis shows difference in RMSE across the models. A value of -0.10 means that the forecast error is 0.10 percentage point lower in the model with expectations than in the model without.
- 8 RMSE (Root Mean Square Error) measures deviation between values predicted by the model and observed data. A lower RMSE indicates stronger explanatory power.
- 9 These forecast errors are nevertheless more pronounced than in MPR and SMART forecasts.
- 10 See eg Stock, J.H. and M. W. Watson (2008) “Phillips Curve Inflation Forecasts”. NBER Working Papers 14322.
- 11 The results are robust, also when rent is excluded. The specification therefore better captures prices directly set by Norwegian firms.
Annex
Detailed tables of projections
Table 1 International projections
|
Change from projections in Monetary Policy Report 4/2025 in parentheses |
Weights1 Percent |
Percentage change from previous year |
||||
|---|---|---|---|---|---|---|
|
2025 |
2026 |
2027 |
2028 |
2029 |
||
|
GDP |
||||||
|
US |
12 |
2.1 (0.2) |
2.2 (0.4) |
1.8 (0.1) |
1.9 (0.2) |
1.9 |
|
Euro area |
47 |
1.5 (0.1) |
0.9 (-0.3) |
1.1 (-0.2) |
1.4 (0) |
1.4 |
|
UK |
15 |
1.3 (-0.1) |
0.7 (-0.3) |
1.4 (0) |
1.7 (0.5) |
1.6 |
|
Sweden |
18 |
1.8 (-0.1) |
2.2 (-0.1) |
2.1 (0.2) |
2 (-0.1) |
1.6 |
|
China |
8 |
5 (0.1) |
4.8 (0.4) |
4.2 (0.1) |
3.8 (0) |
3.7 |
|
5 trading partners1 |
100 |
1.9 (0.1) |
1.5 (-0.2) |
1.6 (-0.1) |
1.8 (0.1) |
1.7 |
|
Prices |
||||||
|
Underlying inflation2 |
2.6 (-0.1) |
2.2 (-0.1) |
2.2 (0.1) |
2.2 (0) |
2.1 |
|
|
Wage growth2 |
3.8 (0) |
3.4 (0.1) |
3.2 (0.1) |
3.2 (0.3) |
3.1 |
|
|
Prices for consumer goods imported to Norway, including freight rates3 |
0.1 (0) |
0.6 (0.6) |
1.3 (1) |
1.1 (0.4) |
1.2 |
|
|
Prices for intermediate goods imported to Norway4 |
0.6 (0.1) |
3 (2.3) |
2.6 (0.9) |
1.8 (0) |
1.9 |
|
Table 2 Short-term estimates
Table 2a Consumer prices. Twelve-month change. Percent
|
2025 |
2026 |
||||||
|---|---|---|---|---|---|---|---|
|
Dec |
Jan |
Feb |
Mar |
Apr |
May |
Jun |
|
|
Consumer price index (CPI) |
|||||||
|
Actual |
3.2 |
3.6 |
2.7 |
||||
|
Projections MPR 4/25 |
2.9 |
2.7 |
1.9 |
2.6 |
|||
|
Projections MPR 1/26 |
3.5 |
3.7 |
3.3 |
3.6 |
|||
|
CPI-ATE |
|||||||
|
Actual |
3.2 |
3.4 |
3.0 |
||||
|
Projections MPR 4/25 |
3.0 |
2.9 |
2.6 |
2.7 |
|||
|
Projections MPR 1/26 |
3.0 |
3.2 |
3.3 |
3.3 |
|||
Sources: Statistics Norway and Norges Bank
Table 2b House prices. Monthly change. Seasonally adjusted. Percent
|
2025 |
2026 |
||||||
|---|---|---|---|---|---|---|---|
|
Dec |
Jan |
Feb |
Mar |
Apr |
May |
Jun |
|
|
Actual |
0.0 |
0.6 |
-0.3 |
||||
|
Projections MPR 4/25 |
0.8 |
0.6 |
0.6 |
0.6 |
|||
|
Projections MPR 1/26 |
0.3 |
0.2 |
0.4 |
0.4 |
|||
Sources: Eiendomsverdi, Finn.no, Real Estate Norway and Norges Bank
Table 2c Registered unemployment (rate). Percent of labour force. Seasonally adjusted
|
2025 |
2026 |
||||||
|---|---|---|---|---|---|---|---|
|
Dec |
Jan |
Feb |
Mar |
Apr |
May |
Jun |
|
|
Actual |
2.1 |
2.1 |
2.1 |
||||
|
Projections MPR 4/25 |
2.2 |
2.2 |
2.2 |
2.2 |
|||
|
Projections MPR 1/26 |
2.0 |
2.0 |
2.0 |
2.0 |
|||
Sources: Nav and Norges Bank
Table 2d GDP for mainland Norway. Quarterly change.1 Seasonally adjusted. Percent
|
2025 |
2026 |
|||
|---|---|---|---|---|
|
Q3 |
Q4 |
Q1 |
Q2 |
|
|
Actual |
0.1 |
0.4 |
||
|
Projections MPR 4/25 |
0.5 |
0.3 |
||
|
Projections MPR 1/26 |
0.4 |
0.4 |
||
- 1 Quarterly figures based on monthly national accounts.
Sources: Statistics Norway and Norges Bank
Table 3 Projections of main economic aggregates
|
Change from projections in Monetary Policy Report 4/2025 in parentheses |
Percentage change from previous year (unless otherwise stated) |
|||||
|---|---|---|---|---|---|---|
|
Constant 2023 prices (NOK bn) 2024 |
2025 |
Projections |
||||
|
2026 |
2027 |
2028 |
2029 |
|||
|
Prices and wages |
||||||
|
CPI |
3.1 (0.1) |
3.4 (1.0) |
2.3 (-0.3) |
2.2 (0.0) |
2.1 |
|
|
CPI-ATE |
3.1 (0.0) |
3.3 (0.6) |
2.8 (0.4) |
2.2 (0.0) |
2.1 |
|
|
Annual wages |
4.9 (0.0) |
4.5 (0.3) |
3.9 (0.3) |
3.6 (0.3) |
3.4 |
|
|
GDP deflator, mainland Norway |
3.4 (0.1) |
4.0 (0.6) |
3.9 (0.7) |
3.3 (0.4) |
2.9 |
|
|
Real economy1 |
||||||
|
Gross domestic product (GDP) |
5448 |
1.2 (-0.2) |
1.2 (0.0) |
0.3 (-0.2) |
-0.3 (-0.6) |
-0.2 |
|
GDP, mainland Norway2 |
4125 |
1.8 (0.2) |
1.4 (0.1) |
0.9 (-0.4) |
1.2 (-0.2) |
1.4 |
|
Output gap, mainland Norway (level) |
0.0 (0.0) |
-0.2 (0.0) |
-0.8 (-0.4) |
-0.9 (-0.6) |
-0.7 |
|
|
Employment, persons, QNA |
0.7 (0.0) |
0.5 (0.0) |
0.4 (-0.2) |
0.5 (-0.2) |
0.7 |
|
|
Registered unemployment (rate, level) |
2.1 (0.0) |
2.1 (-0.1) |
2.3 (0.1) |
2.3 (0.2) |
2.3 |
|
|
Demand1 |
||||||
|
Mainland demand2 |
4290 |
1.9 (0.1) |
2.5 (0.1) |
2.0 (-0.2) |
1.9 (0.0) |
1.9 |
|
– Household consumption |
2200 |
2.8 (-0.5) |
1.9 (-0.2) |
1.7 (0.0) |
1.7 (0.2) |
1.7 |
|
– Business investment |
465 |
1.9 (0.1) |
5.1 (1.1) |
1.7 (-1.1) |
1.6 (-0.4) |
2.0 |
|
– Housing investment |
193 |
-3.6 (-2.1) |
2.8 (-0.5) |
5.2 (-2.5) |
6.6 (-1.0) |
6.4 |
|
– Public demand |
1432 |
1.2 (1.2) |
2.5 (0.3) |
2.0 (0.0) |
1.6 (0.0) |
1.5 |
|
Petroleum investment2 |
264 |
8.2 (2.2) |
-1.0 (2.0) |
-3.0 (3.0) |
-4.0 (2.0) |
1.0 |
|
Mainland exports2 |
1180 |
5.1 (0.9) |
2.1 (0.6) |
0.5 (-0.8) |
1.5 (-0.7) |
2.1 |
|
Mainland imports2 |
1692 |
3.8 (0.1) |
2.9 (3.7) |
2.8 (0.3) |
2.6 (0.1) |
2.6 |
|
House prices and debt |
||||||
|
House prices |
5.9 (-0.1) |
4.0 (-2.3) |
6.1 (-1.3) |
7.1 (0.8) |
6.1 |
|
|
Household credit (C2)3 |
4.7 (0.2) |
4.7 (0.2) |
4.7 (0.1) |
4.6 (0.1) |
4.5 |
|
|
Interest rates and exchange rate |
||||||
|
Policy rate (level) |
4.3 (0.0) |
4.2 (0.3) |
4.2 (0.8) |
3.7 (0.5) |
3.4 |
|
|
Import-weighted exchange rate (I-44) (level) |
119.6 (0.0) |
113.2 (-6.3) |
112.5 (-7.0) |
112.5 (-7.0) |
112.5 |
|
|
Policy rate, trading partners (level)4 |
2.8 (0.0) |
2.7 (0.3) |
3.0 (0.5) |
3.0 (0.3) |
3.0 |
|
|
Household income and saving1 |
||||||
|
Real disposable income excl. dividend income |
3.2 (-0.8) |
2.1 (-1.3) |
1.5 (-0.8) |
2.3 (0.1) |
2.1 |
|
|
Saving ratio incl. dividend income (rate, level) |
4.3 (-2.2) |
4.7 (-2.1) |
4.0 (-2.7) |
4.1 (-2.7) |
4.2 |
|
|
Saving ratio excl. dividend income (rate, level) |
-1.2 (-3.2) |
-0.4 (-3.0) |
-0.9 (-3.6) |
-0.6 (-3.7) |
-0.2 |
|
|
Fiscal policy |
||||||
|
Structural non-oil deficit as a percentage of GPFG5 |
2.7 (0.0) |
2.8 (0.0) |
2.9 (0.1) |
2.9 (0.1) |
2.8 |
|
- 1 All figures are working-day adjusted.
- 2 Annual figures based on monthly national accounts.
- 3 Household credit is reported as four-quarter growth at the end of the year.
- 4 Overnight Index Swap.
- 5 Government Pension Fund Global measured at the beginning of the year.
Sources: Eiendomsverdi, Finn.no, LSEG Datastream, Ministry of Finance, Norwegian Labour and Welfare Administration (Nav), Real Estate Norway, Statistics Norway and Norges Bank