Norges Bank’s Monetary Policy and Financial Stability Committee unanimously decided to reduce the policy rate from 4.25 percent to 4 percent at its meeting on 17 September. The Committee judges that a somewhat higher policy rate will likely be needed ahead compared with the outlook in June. The economic outlook is uncertain, but if the economy evolves broadly as currently projected, the policy rate will be reduced further in the course of the coming year.
The Committee’s assessment summarises the Committee members’ assessments that led to the monetary policy decision at the meeting on 17 September 2025. The analyses in Monetary Policy Report 3/2025 summarise the basis for the assessment.
The operational target of monetary policy is annual consumer price inflation of close to 2 percent over time. Inflation targeting shall be forward-looking and flexible so that it can contribute to high and stable output and employment and to counteracting the build-up of financial imbalances.
The monetary policy stance is restrictive and has contributed to cooling down the Norwegian economy and to dampening inflation in recent years. Inflation has fallen but is still above target. At the same time, unemployment has increased somewhat from a low level. Output is now close to potential. In June, the Committee began a cautious normalisation of monetary policy and reduced the policy rate from 4.5 percent to 4.25 percent.
The Committee noted that the outlook for the international economy remains highly uncertain but that trade policy uncertainty appears to have subsided somewhat. US import tariffs appear to have been clarified to a further extent, and many countries have signed trade agreements with the US. Different measures of global uncertainty have fallen considerably since April. The tariff increases will likely curb economic growth among trading partners to some extent and do not as yet appear to have had a substantial impact on inflation in the US or in other countries. Since the June Report, economic growth among Norway’s main trading partners has been a little higher than expected, while the growth outlook for the coming years appears to be little changed. Euro area inflation is close to target, while inflation among other trading partners is still somewhat higher. Oil and gas prices have declined somewhat since June.
Major equity indices have risen in many countries. Policy rate expectations have declined in the US but are little changed among other trading partners. As expected, Norwegian interest rate expectations fell, and the krone depreciated following the publication of the policy rate decision in June. The krone weakened further at the end of June at the same time as oil prices fell but has since appreciated a little again and is now slightly stronger than assumed in the June Report.
Activity in the Norwegian economy has increased further and been stronger than projected, while labour market developments have been broadly as expected. Business and housing investment in particular have risen more than projected. At the same time, new home sales remain low, and house prices have risen broadly as expected. Growth in household consumption appears to have been somewhat stronger than expected. Norges Bank’s Regional Network contacts expect growth to remain stable through 2025. Employment has continued to rise since the June Report. The number of registered unemployed has increased slightly through summer, while the unemployment rate has remained at 2.1 percent, as projected. LFS data show an increase in unemployment this year, but with little change in recent months.
In its assessment of capacity utilisation, the Committee noted that a large share of the rise in economic activity so far in 2025 reflects increased productivity growth. At the same time, Regional Network contacts report a small recent rise in labour shortages. Overall, new information indicates that capacity utilisation in the Norwegian economy is a little higher than previously assumed.
Inflation has evolved as projected. The 12-month rise in the consumer price index (CPI) was 3.5 percent in August. The CPI adjusted for tax changes and excluding energy products (CPI-ATE) was 3.1 percent. The Committee noted that underlying inflationary pressure appears to be slightly stronger than expected. The reduction in child daycare prices from August, which were not incorporated in the June forecasts, has pushed down inflation. The reduction in daycare prices will dampen the 12-month rise in consumer prices in the coming year. The rapid rise in prices for food and a wide range of services remains the main factor keeping overall price inflation at an elevated level. The sharp rise in business costs over the past years will likely restrain further disinflation ahead. It appears that wage growth will remain high in 2025 but likely lower than in 2024. The Committee noted that current wage statistics indicate higher wage growth in 2025 than projected in the June Report. The rise in productivity growth could provide room for higher wage growth without firms finding the need to raise prices to the same extent. At the same time, there are wide differences across industries and uncertainty as to how firms will adapt.
The Committee judges that a restrictive monetary policy is still needed. If the policy rate is lowered too quickly, inflation could remain above target for too long. On the other hand, an overly tight monetary policy stance could restrain the economy more than needed to bring inflation down to target. Since the June Report, inflation has evolved as projected, but the outlook indicates that it will remain elevated for a little longer. Growth in the Norwegian economy seems to be stronger in 2025 than previously projected, and there appears to be slightly lower spare capacity. Based on the Committee’s current assessment of the outlook, a somewhat higher policy rate will likely be needed ahead compared with the outlook in June. The Committee considered keeping the policy rate unchanged at this meeting but concluded that a rate cut is now appropriate.
A cautious normalisation of the policy rate will pave the way for inflation to return to target further out without a substantial increase in unemployment. The policy rate forecast in this Report declines gradually to somewhat above 3 percent towards the end of 2028. The forecast has been revised up somewhat since the June Report. Registered unemployment will likely increase a little. Given a gradual decline in wage growth ahead, inflation is projected to move down and be close to 2 percent in 2028.
There is uncertainty about future economic developments. The Committee gave special attention to the fact that the unpredictable framework for international cooperation and trade creates uncertainty about the inflation and growth outlook for both the Norwegian and the international economy. There is also uncertainty about wage growth and its impact on domestic inflation going forward. If the economy takes a different path than currently envisaged, the policy rate path may also differ from that implied by the forecast. If the outlook indicates that inflation will remain elevated for longer than projected, a higher policy rate than currently envisaged may be required. If the outlook indicates that inflation will return to target faster or labour market conditions weaken, the policy rate may be lowered faster.
Ida Wolden Bache
Pål Longva
Øystein Børsum
Ingvild Almås
Steinar Holden
17 September 2025
1. Overall picture
Inflation has come down substantially from the peak, but the pace of disinflation has slowed. While import price inflation is currently low, domestic inflation remains elevated due to the rapid rise in services prices. In 2025, mainland economic growth has picked up, and more than projected, without a commensurate increase in the number of employed, and unemployment has edged up further. With a policy rate path in line with the forecast, there are prospects for gradual disinflation towards 2% in the years ahead, while unemployment will likely edge up. Household purchasing power is projected to rise gradually.
Developments among trading partners
Global trade policy is undergoing significant change. Higher tariffs and geopolitical uncertainty will likely dampen global growth, but so far developments do not appear to have significantly affected economic activity in Norway or among Norway’s main trading partners. Trade policy uncertainty led to heightened financial market volatility in the first half of 2025, but market movements have been less pronounced recently. Major equity indices have strengthened, and global credit premiums have fallen back somewhat. Growth in the US has been markedly higher than among Norway’s European trading partners over the past two years but activity in Europe picked up in 2024. Through spring, growth declined in both the US and Sweden while growth has remained steady in the UK and the euro area. Overall, global growth has been slightly stronger than projected in the June Report and is expected to remain broadly steady ahead. Increased defence and infrastructure investment will likely boost activity in Europe.
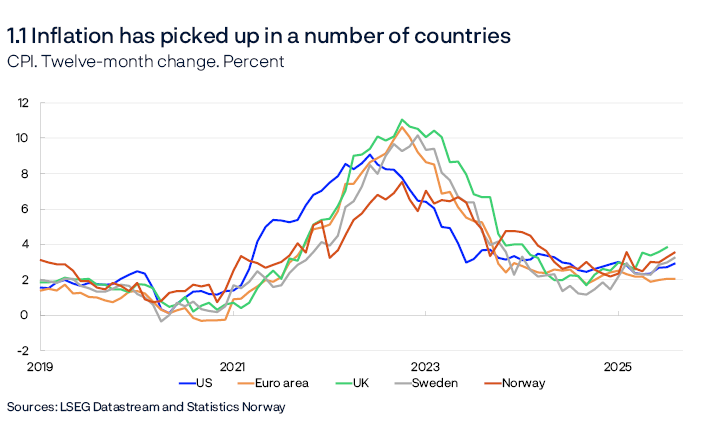
International inflation has come down substantially from the high levels in the wake of the pandemic but has recently picked up in a number of countries (Chart 1.1). Core inflation is also above 2% among a number of Norway’s trading partners, and the pace of disinflation has slowed. Overall, inflation among trading partners has been somewhat higher than projected in June. US inflation may take some time to return to target owing to higher tariffs. Among other main trading partners, core inflation is projected to move down towards 2% over the coming years.
Inflation
In Norway, inflation has also come down substantially from the peak, but the pace of disinflation has slowed. In August, the 12-month rise in the consumer price index (CPI) was 3.5%. Energy prices in particular have risen sharply since August 2024. Excluding the volatile component energy prices, inflation has been close to 3% so far in 2025. The rise in the CPI adjusted for tax changes and excluding energy products (CPI-ATE) was 3.1% in August. The reduction in child daycare prices from 1 August 2025 has dampened inflation and will contribute to lower 12-month consumer price inflation in the coming year.
The inflation surge was triggered by an import price shock. Import price inflation has since fallen sharply (Chart 1.2). There are prospects that external price pressures will remain weak ahead.
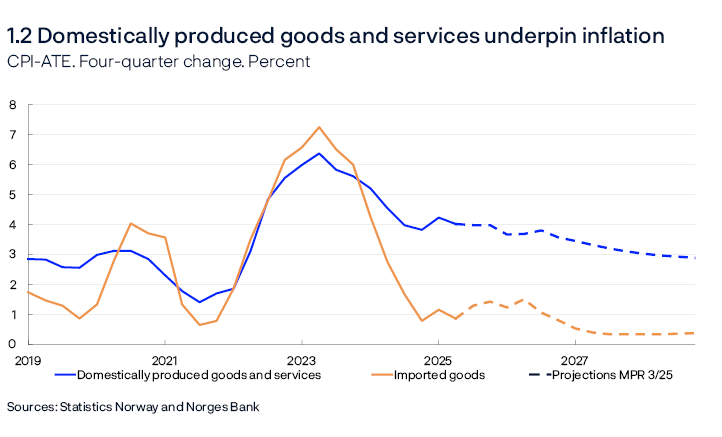
The rapid rise in services prices in Norway is fuelling the rise in prices for domestically produced goods and services. In 2024, annual wage growth was 5.6%, the highest level since 2008. Wage growth is projected to slow to 4.7% in 2025, which is higher than projected in the June Report and higher than the norm for the wage settlement in manufacturing.
Output and demand
In the wake of the pandemic, high inflation and subsequently higher interest rates contributed to cooling the economy, and over the past two years, growth in the Norwegian economy has slowed. This is primarily due to a marked fall in housing investment and weak growth in household consumption. High public demand and strong growth in petroleum investment have contributed to underpinning economic activity.
The picture is now changing. Growth in the Norwegian economy has picked up in 2025, partly owing to higher household demand. In 2025 Q2, mainland GDP rose by 0.6%, which was higher than projected in the June Report. Norges Bank’s Regional Network contacts expect moderate growth to the end of the year. After a period of sharp decline, construction contacts now expect increased activity, while contacts in oil services, where activity is strong, expect weak growth.
Labour market and the output gap
As the Norwegian economy cooled, employment growth slowed. Unemployment has risen from a very low level. Capacity utilisation in the Norwegian economy is assessed to have declined through 2023 but has remained close to a normal level since the start of 2024. Capacity utilisation is projected to be a little higher in 2025 and 2026 than in the June Report.
The recent strengthening in economic growth has not been followed by a corresponding increase in the number of employed persons. Since the previous Report, employment has evolved as projected despite higher economic activity. Productivity growth has therefore risen and been higher than projected, which means that potential output is likely higher than previously assumed.
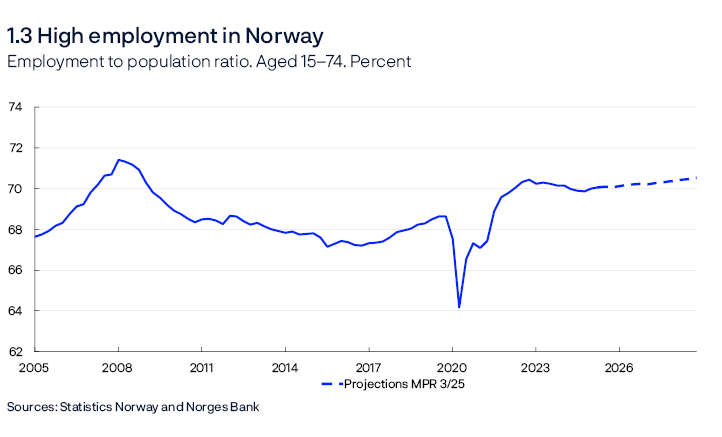
In August, seasonally adjusted registered unemployment was 2.1%. Registered unemployment is now 0.5 percentage point higher compared with the trough in summer 2022 and is around pre-pandemic levels. The Labour Force Survey indicates that unemployment has risen somewhat more. Some of the rise in unemployment reflects an increase in labour market inflows, especially among the youngest age cohorts. The employment to population ratio has declined somewhat in recent years but is nevertheless higher than pre-pandemic levels (Chart 1.3).
Monetary policy
The policy rate was raised significantly to tackle high inflation. After being held at 4.5% for a year and half, the policy rate was reduced to 4.25% in June. At this monetary policy meeting, Norges Bank’s Monetary Policy and Financial Stability Committee decided to reduce the policy rate further to 4%. The forecast in this Report is consistent with a gradual decline in the policy rate to somewhat above 3% towards the end of 2028.
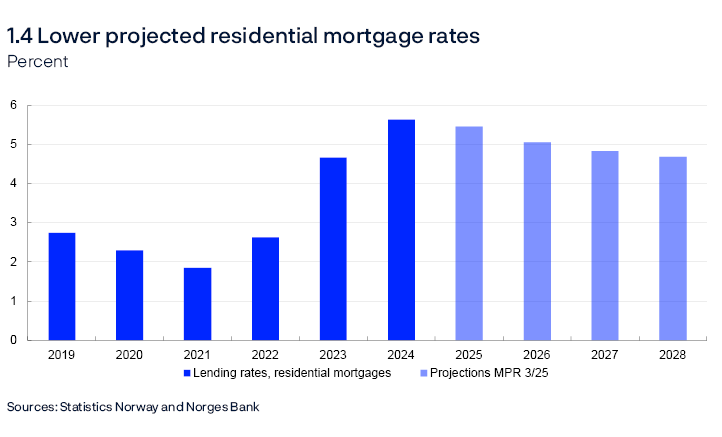
If the economy evolves as projected in this Report and the policy rate is reduced in line with the forecast, the average residential mortgage rate is expected to decline to 4.7% in 2028 (Chart 1.4).
Outlook for the Norwegian economy
Mainland GDP growth is projected to pick up from 0.6% in 2024 to 2.0% in 2025, which is higher than projected in the June Report. In the years ahead, growth is expected to slow somewhat again. Given prospects for a faster rise in wages than prices ahead and somewhat lower interest rates, household purchasing power will continue to strengthen in the coming years. This will likely contribute to a further increase in private consumption, although households are expected to save more of their income than in the past years.
Housing investment is projected to pick up markedly ahead but to a level at the end of 2028 that is still clearly lower than before the pandemic. Mainland business investment is also expected to increase ahead.
Petroleum investment will likely decline ahead towards the level prior to the introduction of the petroleum tax package in 2020. On the other hand, export growth is expected to remain firm this year, followed by moderate growth in the coming years. Growth in public sector demand is projected to increase next year before gradually declining.
Overall, employment will likely increase further and outpace working-age population growth in the coming years. The employment to population ratio is therefore expected to increase in the years ahead. Registered unemployment is projected to edge up to 2.2%.
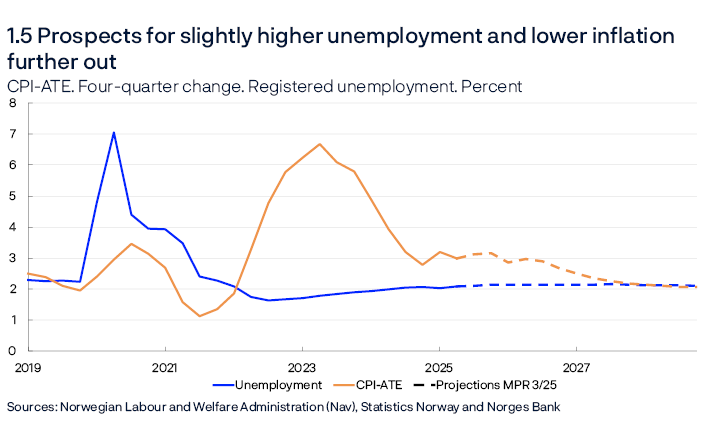
There are prospects for gradual disinflation towards the 2% target (Chart 1.5). Lower wage growth combined with sustained higher productivity growth than in recent years will dampen growth in business costs. Domestic services inflation is therefore projected to moderate in the years ahead. In addition, import price inflation is expected to remain low and dampen overall inflation. According to Norges Bank’s Expectations Survey, long-term inflation expectations remain above 2% but around the same level as before the inflation surge.
Uncertainty and risk
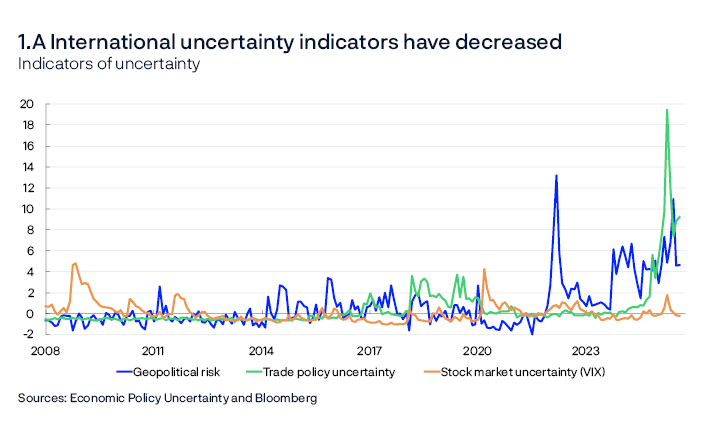
The economic forecasts are uncertain. Indicators of geopolitical uncertainty are at a high level owing to a number of ongoing military conflicts and heightened tensions between countries, despite the fact that the indicators have moved down this summer (Chart 1.A)1. Global trade policy uncertainty has also been elevated over the past year, but as many countries have entered into new tariff agreements with the US, trade policy uncertainty indices have fallen. However, the economic effects of changes in international trade remain uncertain. The effects of the tariffs on international supply chains and their impact on domestic and global inflation have yet to be seen. Higher tariffs and supply chain disruptions may result in higher inflation. At the same time, prices for some products could be reduced if producers facing tariffs on exports seek out new markets. If so, this would dampen inflation.
The effect of domestic conditions on inflation in Norway is also uncertain. An important reason why inflation moves down to 2% in the Bank’s projections is that wage growth is assumed to decline from 5.6% in 2024 to 3.4% in 2028. Continued high manufacturing profitability may, however, contribute to higher wage growth ahead than currently assumed, and this may again lead to higher inflation than currently projected. On the other hand, productivity growth has increased over the past year and has been higher than projected. In the projections, productivity growth is assumed to be higher in 2025 than in 2024 and then to fall back to projected trend productivity. However, it is difficult in real time to distinguish between temporary conditions and persistent trends. If productivity growth persists for longer than assumed, wage growth will feed through to inflation to a lesser extent. Alternatively, the rise in productivity growth may signal the beginning of a cyclical upturn. In that case, wage and price inflation will be higher ahead than assumed.
- 1 The index for geopolitical risk is built on Caldara, D. and M. Iacoviello (2022) “Measuring Geopolitical Risk”, American Economic Review. 112 (4), pages 1194-1225. Data is available at Geopolitical Risk (GPR) Index. The index for trade policy uncertainty is built on Caldara, D., M. Iacoviello and P. Molligo, A. Prestipino and A Raffo (2020), “The economic effects of trade policy uncertainty”, Journal of Monetary Economics. 109, pages 38-59. Data is available at Economic Policy Uncertainty Index.
2. Assumptions and projections
This section presents the key assumptions and projections underlying the policy rate decision and the monetary policy analysis. It also describes how new data, analyses, and assessments have influenced the projections since the previous Report. The projection period in this Report is between 2025 Q3 and 2028 Q4. The underlying data is available in an independent dataset that is published separately.
International economy
High inflation and the rapid rise in policy rates dampened economic activity among Norway’s main trading partners in 2023. In 2024, real wages rose while a number of countries reduced policy rates, which boosted economic growth, particularly in Europe. Nevertheless, growth in the US has been markedly higher than among Norway’s European trading partners over the past two years. Economic growth in Sweden and the US was weak at the beginning of 2025, but both economies recovered in Q2. In the euro area and the UK, growth continued through spring. For trading partners as a whole, growth was slightly stronger in Q2 than projected in the June 2025 Monetary Policy Report.
Uncertainty surrounding US trade policy led to heightened financial market volatility in 2025 H1, but market movements have been small since the June Report. Major equity indices have strengthened, for example in the US, reflecting renewed optimism regarding AI technology and the fact that the US has entered into a number of bilateral trade agreements. Credit spreads internationally are slightly lower than in the previous Report and have returned to levels prevailing prior to the trade turbulence in April. The effective USD exchange rate weakened broadly in 2025 H1 but has stabilised in recent months and is unchanged since the June Report.
The Riksbank and Bank of England reduced policy rates further this summer (Chart 2.1). In European countries, market policy rate expectations have changed little since the June Report, and central banks are expected to be nearing the end of their rate-cutting cycles. At the same time, US policy rate expectations have fallen following publication of weaker key labour market indicators. Long-term US interest rates have fallen since the June Report, while corresponding rates in Europe have risen. Prospects for deepening fiscal deficits in a number of European countries and heightened political uncertainty, particularly in France, have contributed to higher European long-term rates.

In the projection, overall GDP growth among trading partners is slightly higher in 2025 than in 2024 and remains unchanged in 2026. This is expected to stimulate the Norwegian economy. The overall growth projection for trading partners in 2025 has been revised up slightly. Projections are little changed from 2026 and to the end of the projection period. The projections are based on the following:
- Higher US import tariffs are likely to dampen global growth ahead. In July, the US raised tariffs on imports from most countries. At the same time, the US has entered into some agreements that entail lower tariffs or tariff exemptions in important sectors. Overall, the new US import tariffs are somewhat higher than assumed in June, but slightly lower for Norway’s main European trading partners. In the projections, the tariffs in effect on 12 September are assumed to apply.
- Euro area GDP growth is projected to edge down in 2026 but to pick up further out in the projection period. Higher real wages, lower interest rates and increased defence and infrastructure investment boost growth, while higher tariffs on exports to the US dampen growth.
- In Sweden, a gradual recovery is projected, with weak growth in 2025 and higher growth from 2026. Rising real wages and a more expansionary economic policy boost activity ahead.
- In the US, growth is expected to decline in 2025 and remain lower through the projection period than in recent years, with lower immigration and higher tariffs weighing on growth. At the same time, stronger growth in software and hardware investment is boosting economic activity.
- In China, growth is expected to slow slightly in the years ahead. Exports have risen so far in 2025, despite high tariffs curbing exports to the US. Even though government stimulus is boosting growth, activity is being dampened by a contracting labour force and highly indebted local governments and state-owned firms.
Overall growth projections for trading partners in 2025 and 2026 are in line with Consensus Forecast’s projections.
Headline CPI inflation among Norway’s trading partners has declined substantially since the peak in 2022. In the euro area, inflation is close to the 2% target, while inflation among other trading partner countries is still somewhat higher than their targets. Core inflation has also declined, but the overall pace of disinflation among Norway’s main trading partners has slowed so far in 2025, and in a number of countries, core inflation has picked up somewhat through summer. Looking ahead, overall core inflation is expected to move down to 2% in the course of 2026. The projections are based on the following:
- Euro area inflation is close to target but has been slightly higher than expected. Services inflation in particular is fuelling inflation but is expected to soften further out in response to lower wage growth.
- In both Sweden and the UK, inflation remains elevated and has been higher than expected, in part owing to administrative prices. In Sweden, the announced halving of VAT on food from April 2026 will help bring inflation notably below target for a period.
- In the US, both expectation surveys and market-based measures indicate somewhat higher inflation in the near term, partly fuelled by higher tariffs. So far, the pass-through from higher tariffs to inflation nevertheless appears more limited and slightly slower than assumed in June, and the projection for 2025 has been revised down slightly.
On balance, the projections for inflation among trading partners are little changed from the June Report.
Oil prices and European gas prices
Oil prices have fallen since exceeding USD 100 per barrel in summer 2022 following Russia’s invasion of Ukraine. The fall in recent years primarily reflects both higher OPEC and non-OPEC oil production and lower global economic growth. Upon publication of the June 2025 Monetary Policy Report, prices rose temporarily to over USD 75 per barrel in response to the conflict between Israel and Iran. So far in September, oil prices have again stayed between USD 65 and 70 per barrel. Futures prices indicate that oil prices will remain at approximately current levels ahead (see Table 2.A).
Table 2.A Energy prices
|
Percentage change from projections in Monetary Policy Report 2/2025 in parentheses |
Average price (2010–2019) |
Realised prices and futures prices1 |
||||
|---|---|---|---|---|---|---|
|
2024 |
2025 |
2026 |
2027 |
2028 |
||
|
Oil, USD/barrel |
80 |
80 |
70 (-2) |
66 (-4) |
66 (-3) |
67 (-2) |
|
Dutch gas, EUR/MWh |
20 |
34 |
37 (-7) |
32 (-10) |
30 (-4) |
27 (0) |
European gas prices also rose temporarily in June but then continued to decline from the record levels reached after Russia cut gas exports to Europe from autumn 2021. Futures prices indicate a further decline, reflecting higher expected global LNG supply, particularly from the US. Weak growth in energy-intensive manufacturing in Europe and an increased supply of renewable energy are also weighing on gas prices.
- 1 Futures prices at 12 September 2025.
Sources: LSEG Datastream and Norges Bank
Norwegian mainland GDP
Mainland economic growth has slowed in recent years and was weak in 2024. Higher interest rates and high price and cost inflation have contributed to reducing investment and curbing household consumption growth. On the other hand, the krone depreciation in the period to summer 2023 has fuelled a sharp rise in exports. An expansionary fiscal policy and high petroleum investment have also lifted activity.
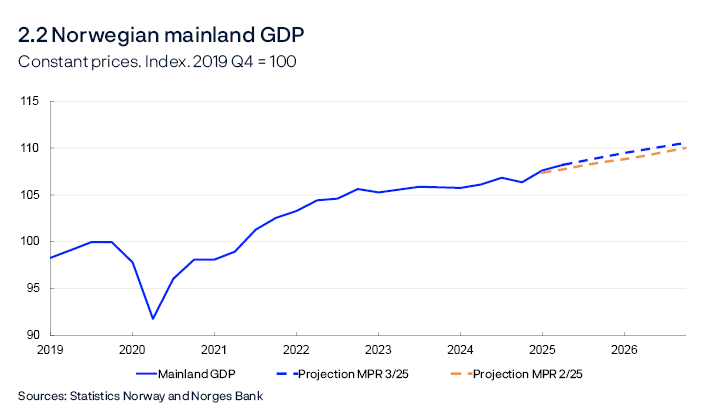
Following little change in activity levels in 2024 H2, mainland GDP growth picked up in 2025 H1 (Chart 2.2) and was stronger than projected. In the coming quarters, growth is expected to moderate, broadly as envisaged in the June Report. The projections are based on the following:
- Overall, Regional Network contacts expect that activity growth in Q3 will be in line with expectations in the previous survey and hold steady in Q4 (Chart 2.3, left panel). Construction contacts expect output growth to pick up in H2, while oil services contacts expect weak output growth towards the end of the year.
- Norges Bank’s System for Model Analysis in Real Time (SMART), which weights projections from a broad set of models, projects a slight decline in mainland GDP growth in the coming quarters (Chart 2.3, right panel).
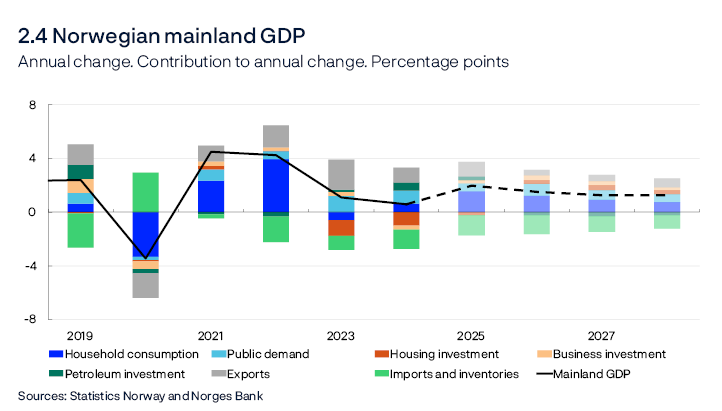
Mainland GDP growth is projected to be 2% in 2025, before declining to 1.5% in 2026 and then slowing slightly further out in the projection period (Chart 2.4). The projections for 2025 and 2026 have been revised up since the June Report.
Household consumption is the largest contributor to growth in 2025 and 2026. Export growth will remain firm in 2025 but is expected to slow ahead. Both housing and business investment are expected to pick up further out in the projection period. Petroleum sector investment is expected to fall ahead as ongoing development projects are completed. Growth in public sector demand is projected to increase in 2026 before drifting down. For detailed projections and changes from the June Report, see Annex Tables 2 and 3.
Indicators of uncertainty surrounding point forecasts in the near and medium term
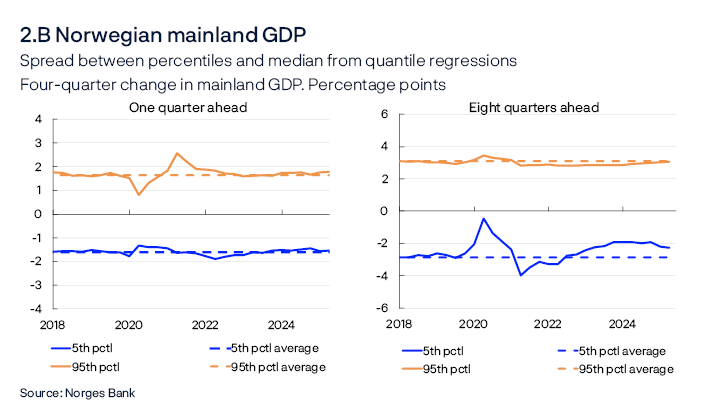
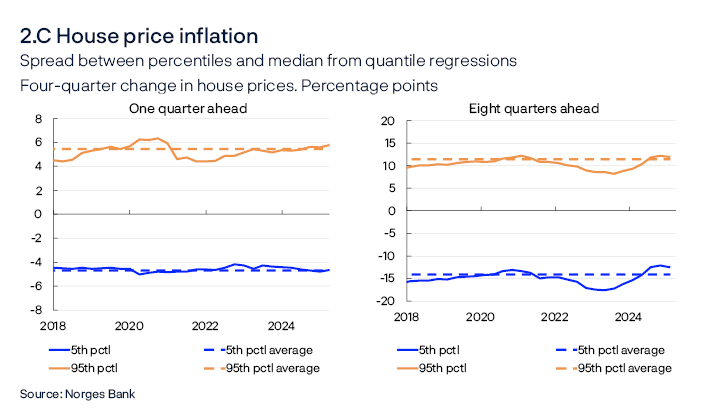
Economic forecasts will always be uncertain. The Bank’s uncertainty assessments use both judgement and model estimations. This box sheds light on uncertainty by using a model framework to quantify the risk linked to developments in three key macroeconomic variables: GDP for mainland Norway, consumer prices and house prices.1
The analysis is based on data for the period to the end of 2025 Q2. For each of the variables, the model estimates a probability distribution divided into percentiles. As a measure of risk, the difference between the median (50th percentile) and the endpoints (95th and 5th percentiles) is used. Wider spreads between the median and the endpoints indicate increased uncertainty. The charts show the changes in upside and downside risk across the different variables over time.
The risk of high inflation has decreased and approached its historical average (Chart 2.A). After rising in 2025 Q1, near-term risk decreased slightly in Q2. Longer-term upside risk is close to its historical average. Note that the inflation data for July and August 2025 are not included in the analysis.

The models indicate that the risk surrounding mainland GDP growth in the near term is close to its historical average (Chart 2.B). The medium-term downside risk is somewhat lower than the average for the 2010s (Chart 2.B, right panel).
The risk surrounding house price inflation in the near term is close to its historical average (Chart 2.C, left panel). After having been higher than normal over a couple of years, the medium-term downside risk has receded again and is now lower than its historical average (Chart 2.C, right panel). Note that July and August house price figures are not included in the analysis.
- 1 The models use quantile regressions, with different indicators to project output growth, house price inflation and consumer price inflation. See further description in Bowe, F., S.J. Kirkeby, I.H. Lindalen, K.A. Matsen, S.S. Meyer and Ø. Robstad (2023) “Quantifying macroeconomic uncertainty in Norway". Staff Memo 13/2023. Norges Bank.
Households
In 2023, higher interest rates and high inflation reduced household purchasing power and contributed to a fall in consumption. However, households limited the decline in consumption by reducing saving. In 2024, growth in household real disposable income was the strongest in over a decade, and consumption picked up. Solid income growth and higher pension saving contributed to a higher saving ratio.
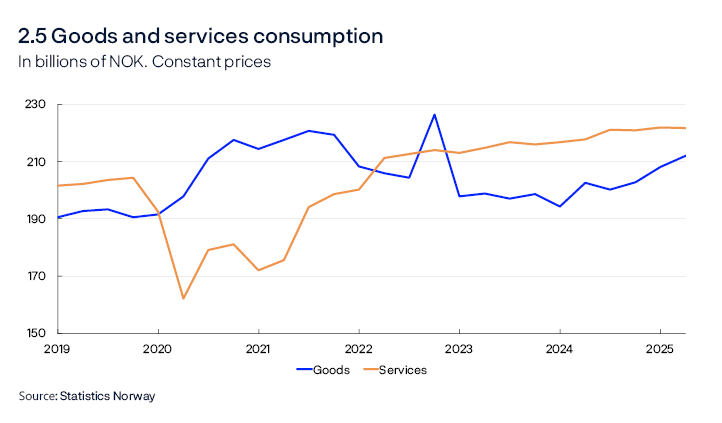
After remaining virtually unchanged in 2024 H2, consumption increased in 2025 H1. Services consumption has shown little change in recent quarters (Chart 2.5). The rise in goods consumption is broad-based but is pulled up in particular by higher car sales. In Q2, the level of household consumption was in line with projections in the June Report. Consumption growth is expected to be 3.1% in 2025 and to slow further out in the projection period. In 2025 and 2026, consumption growth is projected to be above the average for the past 15 years. Projections for both real disposable income and household consumption in 2025 and 2026 are higher than in the June Report. The projections are based on the following:
- Regional Network contacts in retail trade and household services expect stronger purchasing power to push up household demand further through autumn. Retail trade and car sales growth and household card usage data indicate solid growth in goods consumption in Q3.
- Growth in household real disposable income is projected at 4.1% in 2025. Further ahead, lower wage growth is expected to weigh on income growth, but lower interest rates are expected to dampen the fall. Lower income growth will likely curb consumption growth.
- Pension saving is assumed to remain high ahead and consumption is expected to increase less than household disposable income in the coming years. The saving ratio is projected to increase and reach the average level from the 2010s towards the end of the projection period.
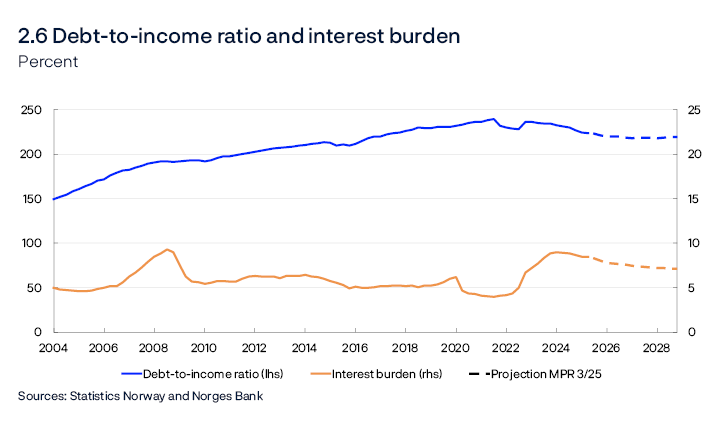
- Households are highly indebted, and the interest burden has increased in recent years (Chart 2.6). Household income growth is expected to outpace credit growth somewhat ahead, resulting in a slight decline in the debt-to-income ratio through the projection period. A lower policy rate will reduce household interest burdens in the coming years.
Housing market
Housing investment fell by around 40% from the beginning of 2022 to the end of 2024, partly owing to higher interest rates and a sharp rise in material costs. Annual housing investment growth is projected to pick up from 2026, but the level in 2028 is still considerably lower than in 2022 (Chart 2.7). The projections are based on the following:
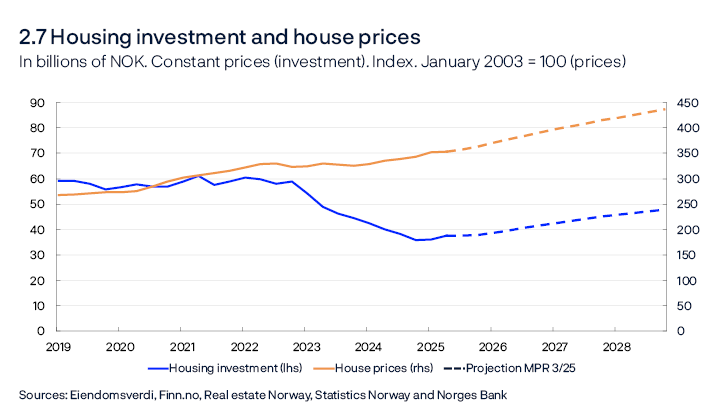
- Regional Network contacts in construction expect activity to pick up through 2025 H2. Some housing construction contacts will launch a number of projects this autumn, particularly in cities.
- Housing investment growth was high between Q1 and Q2, markedly higher than projected in June. Figures for housing starts and new home sales indicate that growth will soften in H2.
- Increased household purchasing power is expected to lead to higher demand for both new and existing homes ahead.
- Lower interest rates and higher house prices boost profitability in construction and may lead to more projects coming to fruition.
In 2024, prices in the secondary housing market increased by 3%. At the beginning of 2025, house prices rose sharply. Regulatory easing of equity requirements for house purchases and expectations of lower interest rates may have contributed to the increase. However, house price inflation has since been lower. Developments since the June Report have been broadly as projected. The annual rise in prices in the secondary housing market is expected to increase in 2025 and remain firm to the end of the projection period. The projections are based on the following:
- Lower interest rates pull in the direction of higher house prices.
- Continued household income growth and high employment are expected to boost housing demand in the coming years.
- A low supply of new homes suggests higher house prices.
Firms
In 2024, mainland business investment fell after having risen in the preceding years. The decline reflects in large part the substantial rise in interest rates and other expenses since 2021. A moderate increase in business investment is expected through the projection period (Chart 2.8). The projections are based on the following:
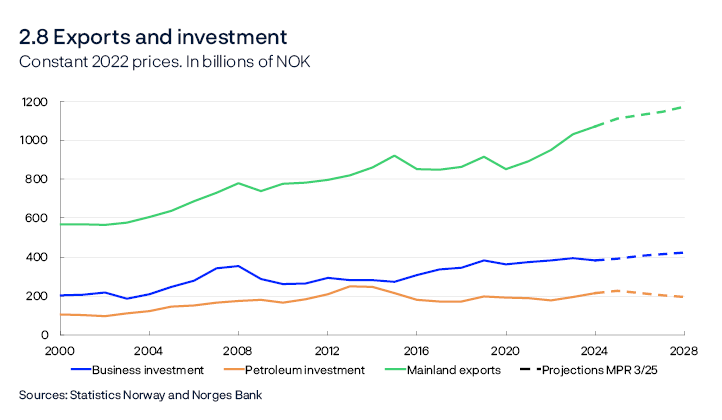
- Lower interest rates are expected to boost investment somewhat in the projection period.
- Information from the Regional Network indicates that services investment will be stable in 2025 and increase in 2026, when commercial real estate investment will likely pick up. Services investment accounts for two-thirds of mainland business investment.
- The most recent investment intentions survey from Statistics Norway indicates strong growth in power investment in 2025 and 2026.
- According to the survey, investment in manufacturing and mining and quarrying is likely to increase notably in 2026. Investment in these sectors has been unusually high in recent years, driven in part by the energy transition and defence investment. The same conditions will likely sustain high investment in the period ahead.
Petroleum investment has increased markedly over the past two years, reflecting the launch of a number of development projects in 2022 in response to the petroleum tax package and high oil and gas prices. Petroleum investment is expected to increase further in the period between 2024 and 2025, and then to decline notably over the next three years. The projections are based on the following:
- Investment in ongoing development projects will fall from around NOK 110bn in 2025 to close to zero in 2028.
- Oil companies have announced a host of new development projects ahead. This will generate substantial investment, but not enough to fully compensate for the decline in ongoing development projects.
- The investment intentions survey indicates lower investment by oil companies in 2026 than in 2025, but the reduction will be less pronounced than projected in the June Report.
- Oil and gas prices have fallen somewhat since the June Report.
Mainland exports have expanded markedly since 2021, largely driven by the krone depreciation in the period to summer 2023, increased tourism and higher investment in oil, gas and green technology abroad. Several of the same factors are expected to sustain export growth in 2025. In addition, there is a very high level of activity in the aquaculture sector. Export growth is projected to be moderate from 2026 to the end of the projection period. The projections are based on the following:
- According to the Regional Network, Norwegian exporters expect solid growth in 2025 H2, and only a small proportion expect the higher tariff rates introduced to date to dampen output.
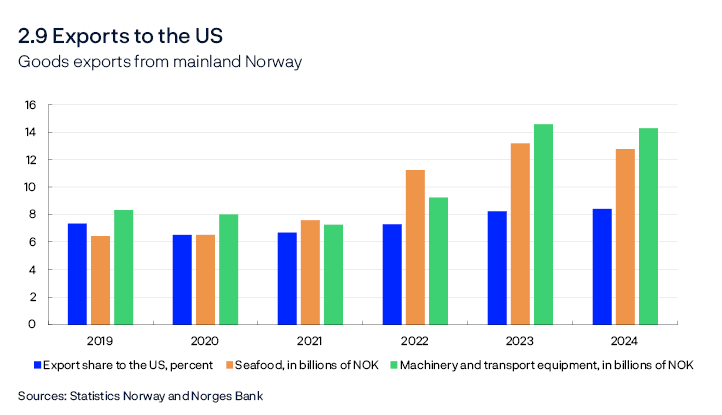
- Slightly more than 8% of mainland goods exports are directly exported to the US (Chart 2.9). Salmon and specialised machinery for the offshore industry and other industries are among the main export goods. Supply-side conditions determine in large part the volume of seafood produced by Norwegian firms. If US demand were to fall, a substantial share of seafood exports could be redirected to other markets. Although that could take some time, the overall negative impact on Norwegian exports is likely to be small.
- Trading partner GDP growth is expected to pick up slightly over the coming years, and the growth projection for 2025 has been revised up a little compared with the June Report.
- Developments in global petroleum investment are likely to be far weaker ahead than in the period between 2022 and 2024 and dampen Norwegian export growth. Some of the decline may be offset by increased global green technology investment.
Fiscal policy
After rising sharply in 2023, growth in public demand weakened somewhat in 2024 and is likely to slow further in 2025. Since the end of 2024, the level of public demand has weakened, in particular due to lower public investment, contributing to a downward revision of the growth projection for 2025 compared with the June Report. From 2026, growth in public demand is projected to be somewhat higher than mainland GDP growth (Chart 2.10). The projections are based on the following:
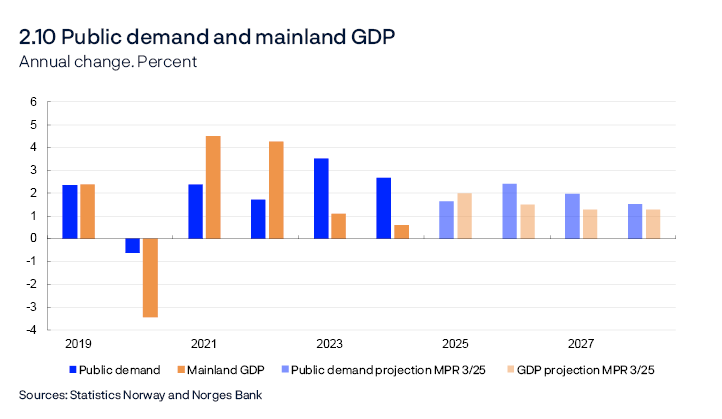
- The structural non-oil budget deficit as a share of the Government Pension Fund Global (GPFG) is estimated at close to 2.7% in 2025 and to rise to 2.8% in 2026, and then remain stable to the end of the projection period.
- Increased support to Ukraine accounts for some of the growth in government spending in 2025. This is expected to have little effect on domestic demand but will contribute to increasing the budget deficit.
- Increased defence spending is expected to lift public demand growth through the projection period. Developments are assumed to be in line with the long-term defence plan adopted in 2024.
According to the estimates from the Ministry of Finance, the fiscal stance will have an expansionary effect on the level of activity in both 2025 and 2026.
Labour market and the output gap
Capacity utilisation, or the output gap, is a measure of the difference between actual output in the mainland economy and potential output. The output gap and potential output cannot be observed and must therefore be estimated. In the near term, the output gap is estimated based on a number of indicators and models, with particular weight given to labour market developments. The potential output estimate follows from the output gap and GDP estimates. In the longer term, the potential output and output gap estimate is based on estimated trend productivity and the Bank’s assessment of the highest sustainable level of employment over time consistent with stable wage and price inflation (trend employment, N*).
Output is assessed to have declined somewhat relative to potential through 2023 and to have remained close to potential since mid-2024 (Chart 2.11). Output relative to potential is projected to be a little higher in 2025 and 2026 than in the June 2025 Monetary Policy Report. This assessment is based on the following:
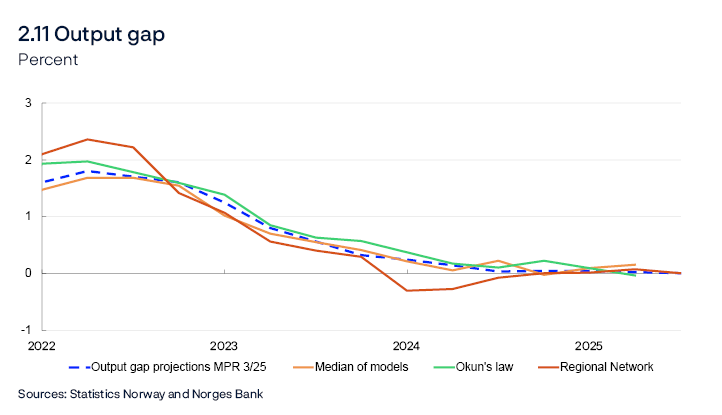
- Adjusted for normal seasonal variations, registered unemployment has remained at 2.1% since the June Report, which is in line with projections and close to the level consistent with output at potential.
- Employment continued to rise in 2025 Q2, as projected in the June Report. The employment to population ratio remains close to trend employment. Preliminary data indicate that employment rose further in July, and Regional Network contacts expect continued growth in Q3 and Q4. The employment to population ratio appears to remain steady and implies, in isolation, a stable output gap in the near term.
- The Labour Force Survey (LFS) indicates that unemployment has risen somewhat more than registered unemployment. Some of the rise in the LFS data reflects an increase in the number of job seekers.
- The share of Regional Network contacts reporting capacity constraints is unchanged from the previous quarter, while the share reporting labour shortages has increased slightly. The shares are close to their historical averages. Capacity utilisation indicators have been slightly stronger than implied by the output gap forecasts. This suggests slightly higher output relative to potential in the near term than expected in June.
- The number of new job vacancies has held steady over summer, according to the Norwegian Labour and Welfare Administration (Nav). According to Statistics Norway’s sample survey, the stock of vacancies declined in Q2 and is now close to the level from before the end of 2024. Developments indicate continued strong labour demand.
- Norwegian mainland GDP increased in Q2 and was higher than expected, suggesting, in isolation, slightly higher output relative to potential.
- Norges Bank’s modelling system, which among other variables incorporates mainland GDP, employment, unemployment, wage growth and inflation, indicates that capacity utilisation has been stable and close a normal level so far in 2025. The models estimate slightly higher output relative to potential than in the June Report (Chart 2.11).
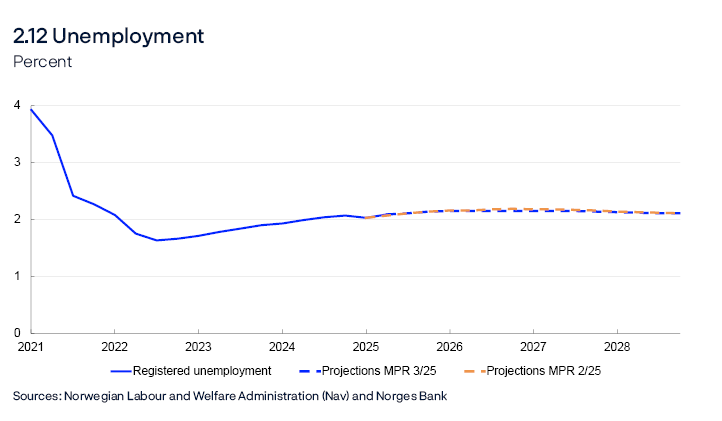
Output is expected to remain close to potential in the coming year and decline slightly thereafter. The projections imply that unemployment will increase to 2.2% at the end of 2025 and remain at this level to 2027 H2 (Chart 2.12). Further out in the projection period, output relative to potential and unemployment are little changed since the June Report.
From 2026, employment is projected to rise slightly faster than the working-age population, resulting in a higher employment to population ratio in the coming years. Employment to population ratio projections further out are little changed from the previous Report.
Norges Bank’s assessment is that growth in potential output slowed over the past decade compared with the preceding decade (see Table 2.1). Potential output is projected to increase markedly in 2025, before declining and remaining close to the average for the period between 2015 and 2024 through the projection period. This assessment is based on the following:
Table 2.1 Output and potential output1
|
Change from projections in Monetary Policy Report 2/2025 in parentheses |
Percentage change from previous year |
|||||
|---|---|---|---|---|---|---|
|
2005–2014 |
2015–2024 |
2025 |
2026 |
2027 |
2028 |
|
|
GDP, mainland Norway |
2.8 |
1.6 |
2.0 (0.4) |
1.5 (0.1) |
1.3 (-0.1) |
1.3 (-0.1) |
|
Potential output |
2.7 |
1.6 |
2.1 (0.4) |
1.6 (0) |
1.5 (0) |
1.2 (-0.1) |
|
Trend employment (N*) |
1.5 |
0.9 |
1.0 (-0.1) |
0.9 (0) |
0.8 (0) |
0.6 (0.1) |
|
Underlying productivity |
1.2 |
0.7 |
1.0 (0.4) |
0.7 (0) |
0.7 (0) |
0.7 (-0.1) |
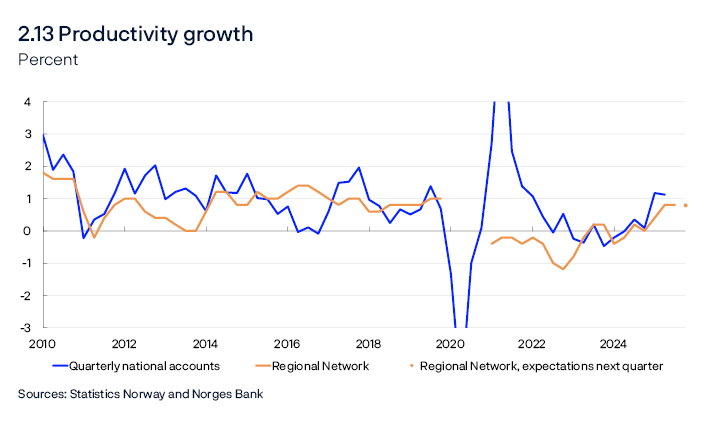
- In recent years, productivity growth has been low (Chart 2.13). So far in 2025, mainland activity has picked up more than employment, resulting in increased productivity. The Bank’s output gap estimate for 2025 has been revised up since the June Report, albeit less than the mainland GDP estimate, implying higher underlying productivity growth in 2025. Norges Bank assesses this increase in productivity growth to be temporary. Further ahead, projected productivity growth is broadly unchanged compared with the June Report. Productivity growth will then be higher than in recent years.
- So far in 2025, the increase in the number of hours worked has been slightly weaker than the increase in the number employed (Chart 2.14 and further discussion in “Younger and older age cohorts in particular have boosted employment”). Fewer hours worked per employee may indicate that potential output is somewhat lower than indicated by the number employed.

- Norges Bank’s trend employment estimates are based on Statistics Norway’s population projections, adjusted for current population statistics. There are prospects for moderate growth in the working-age population in the coming years.
- Trend employment is affected by the large inflow of Ukrainian refugees to Norway in recent years. In line with government projections, slightly fewer refugees from Ukraine are expected in 2025 and 2026 than assumed in June. It is assumed that these refugees will gradually lift trend employment.
- Trend employment is also affected by developments in the number of temporary foreign workers, which has risen since the end of 2024 and is expected to continue to rise in the coming years, in pace with a pickup in construction activity.
- 1 The contributions from the growth in N* and trend productivity do not necessarily sum exactly to the annual change in potential output due to rounding.
Wages
Wage growth has increased in recent years on the back of high inflation, a tight labour market and high profitability in some business sectors. In 2025, wage growth is expected to decline to 4.7%, which is slightly higher than projected in the June Report (Chart 2.15). The projection is based on the following:
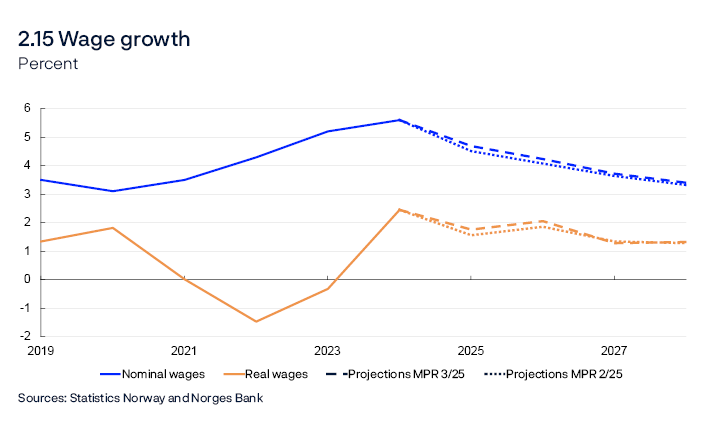
- In the 2025 wage negotiations, the wage norm for the manufacturing sector was set at 4.4%.
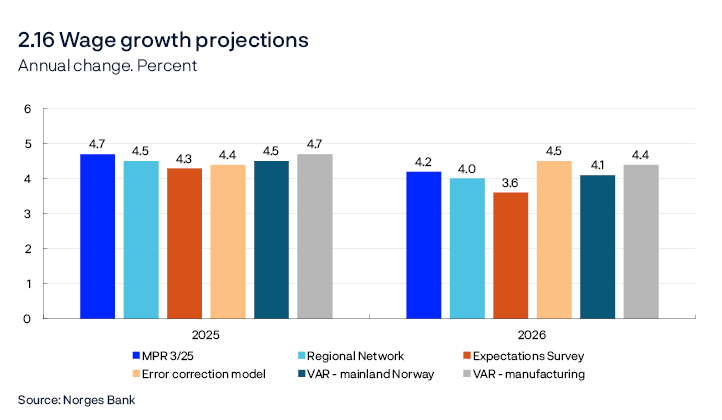
- Regional Network contacts expect wage growth of 4.5% in 2025, while according to Norges Bank’s Expectations Survey the social partners expect 4.3% (Chart 2.16). Wage expectations among Regional Network contacts are unchanged since the previous Report, while they have decreased slightly among the social partners.
- Unemployment is expected to increase slightly towards the end of the year, as projected in June.
- Register-based data for wage earners show that overall monthly wages increased by 6.3% in Q2 compared with the same period in 2024. Wage growth has been broad-based across sectors, suggesting higher wage growth.
- Some of the growth reflects the fact that the conflict related to the central government wage agreement resulted in retroactive payments accrued in 2024 being made in 2025. In the national accounts, this wage growth has been backdated to 2024 (see “Wage terms”). In addition, the extent to which bonuses and various wage settlements so far in 2025 are captured in the statistics is also uncertain, and the figures fluctuate widely. Overall, the data show that wage growth was high in 2025 H1, suggesting higher wage growth in 2025 than projected in the June Report.
In 2026, wage growth is expected to slow to 4.2%, while real wage growth will increase somewhat as a result of lower inflation. The projections have been revised up slightly from the June Report. The assessment is based on the following:
- Higher productivity boosts firms’ ability to pay wages ahead.
- The overall wage share in the business sector was close to the historical average in 2024 (Chart 2.17) and has likely remained close to this level in 2025. At the same time, the wage share in manufacturing in 2024 was still clearly lower than the historical average, and so far in 2025, it has declined and been lower than projected in the June Report. Continued strong profitability in manufacturing is expected to contribute to sustained wage growth ahead.
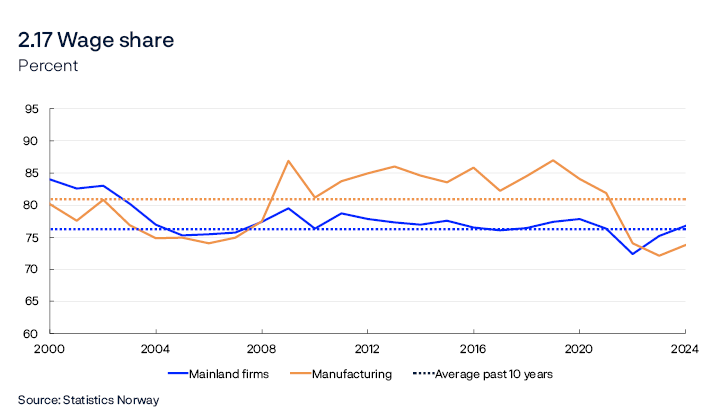
- Producer price inflation, measured by the mainland GDP deflator, is expected to outpace consumer price inflation throughout the projection period. This allows real wages deflated by consumer prices to increase more than productivity without weakening firms’ overall profitability. The projections imply a slight decline in the wage share for mainland Norway, but the wage share remains close to the average for the past ten years.
- In the projections, lower output relative to potential and lower inflation dampen wage growth in the coming years.
- The empirical models estimate slightly lower wage growth in 2026, but the model estimates have been revised up a little from the June Report (Chart 2.16). This is in line with the upward revision of the estimate for 2026 in this Report.
Wage terms
Annual wages in the national accounts:
- Include agreed monthly wages, irregular supplements and bonuses. Overtime allowances are not included.
- Show average wages per full-time equivalent.
- Follow the accrual principle, where wages outstanding are recorded in the period in which they accrued.
- Norges Bank projects annual wage growth in the national accounts.
Average monthly wages in statistics on the number of employments and earnings:
- Comprise the same as annual wages in the national accounts and also show average wages per full-time equivalent.
- Follow a cash-based accounting system, with wages reported in the period they are disbursed.
- Quarterly figures for monthly wages are based on earnings data from the middle month of the quarter.
Prices
Inflation has fallen markedly since the end of 2022, but the pace of disinflation has slowed over the past year. The sharp rise in rents and prices for services and food is keeping inflation elevated, while the contribution from other goods prices has fallen markedly since the peak (Chart 2.18).
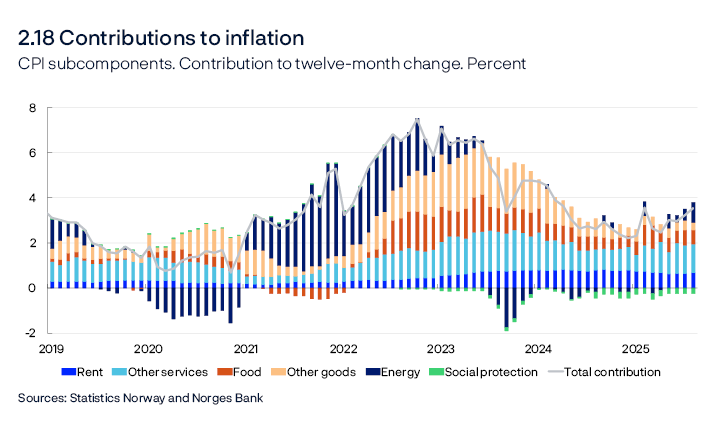
In August, the year-on-year rise in the consumer price index (CPI) was 3.5%, lifted by higher energy prices than one year earlier, when high precipitation resulted in low energy prices in South Norway. The rise in the CPI adjusted for tax changes and excluding energy products (CPI-ATE) was 3.1% in August. Changes in some administered prices affect inflation considerably. The maximum price paid by parents for child daycare was reduced in August 2025 and continues to pull down inflation (see contribution from the social protection subcomponent in Chart 2.18).
Underlying inflation
Underlying inflation, measured by both the CPI-ATE and other indicators, has levelled off over the past year (Chart 2.19). Imported consumer goods inflation has fallen substantially after surging in the wake of the pandemic. At the same time, domestically produced goods and services inflation has fallen less and remains high.
![2.19 Indicators of underlying inflation
Twelve-month change. Percent
Line chart
See Husabø, E. (2017) “Indikatorar for underliggjande inflasjon i Noreg” [Indicators of underlying inflation in Norway]. Staff Memo 13/2017. Norges Bank (in Norwegian only), for a detailed review of the indicators.
Sources: Statistics Norway and Norges Bank](/contentassets/6a0f0ce201a1487dbe92e21a6dd998ce/en-638968275443936706/imageslide25.png?v=23102025144550)
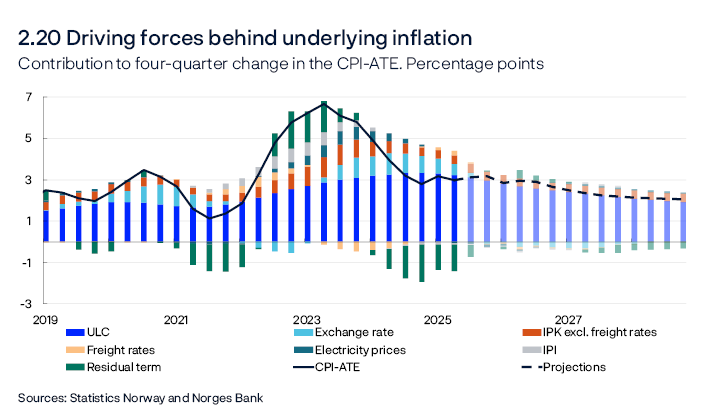
Inflation is projected to be slightly higher ahead than projected in the June Report. Underlying inflation measured by the CPI-ATE is projected to decline from 3.1% in 2025 to 2.8% in 2026 and to move down further to 2% towards the end of the forecast horizon. The projections are based on the following:
- Wage growth has been high in recent years, while productivity growth has been weak across most sectors. This has contributed to a rapid rise in business costs, which has underpinned domestic inflation (Chart 2.20). Labour costs are projected to gradually decline further out in the projection period, pushing down domestic inflation.
- Wage growth projections have been revised up for 2025 and 2026. At the same time, higher productivity growth is projected in 2025, dampening unit labour costs.
- Compared with the June Report, the projection of capacity utilisation has been revised up. Higher capacity utilisation pushes up inflation through increased demand for labour, goods and services.
- The reduction in daycare prices was not incorporated in the June projections. The reduction will dampen year-on-year CPI-ATE inflation over the year ahead. Adjusted for child daycare prices, inflation has been somewhat higher than projected, suggesting slightly higher inflation ahead. The rise in Norges Bank’s indicators of international price impulses to imported intermediate and consumer goods has slowed considerably from the peak and is now at a low level (Annex Table 1). Subdued international price impulses are expected to keep imported consumer goods inflation low ahead.
- Freight rates rose at the beginning of summer owing to high demand and increased unrest in the Middle East but have since fallen somewhat again. Looking ahead, freight rates are assumed to fall further to pre-pandemic levels.
- Higher tariffs and resulting changes to supply chains may also affect some consumer prices in Norway. However, current tariffs are not expected to have a pronounced impact on domestic inflation.
- A slightly stronger krone exchange rate is expected ahead compared with the June Report (see “The krone exchange rate”), pulling in the direction of slightly lower imported goods inflation.
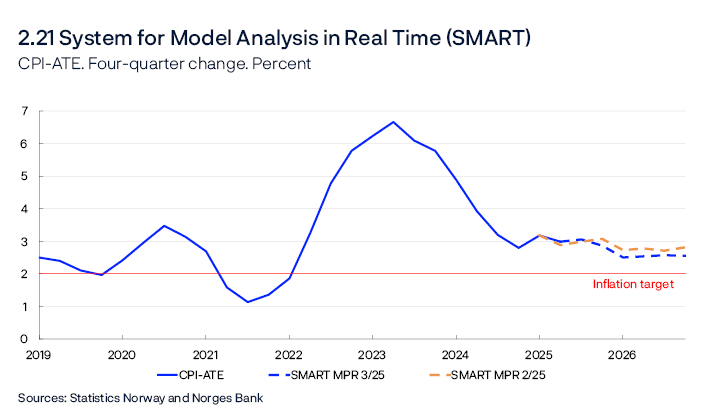
- According to the forecast from Norges Bank’s System for Model Analysis in Real Time (SMART), which weights forecasts from a broad set of models, inflation will decline gradually (Chart 2.21). In the coming quarters, the forecasts are little changed compared with the June Report. However, SMART can overestimate the significance of large price changes for individual goods and services, such as daycare prices. The Bank’s forecasts are therefore slightly higher than the SMART forecasts.
Overall inflation
Energy prices lead to wide fluctuations in overall CPI inflation, but the introduction of state-funded fixed electricity price contracts, “Norgespris”, is expected to make the energy subcomponent of the CPI more stable ahead. In recent months, energy prices pushed up overall inflation, but lower energy costs are expected to pull down annual CPI inflation to 2.2% in 2026. The projections are based on the following:
- Underlying inflation is expected to decline and gradually approach 2%. The projections for underlying inflation have been revised up slightly ahead compared with the June Report.
- Energy prices in the CPI have been broadly as projected, despite the compromise in the Revised National Budget, which did not entail the electrical power tax reduction in July assumed in the June Report. Looking ahead, energy prices in the CPI are expected to fall as a result of lower electrical power taxes and the availability of “Norgespris” from October. However, the effect will be dampened slightly because futures prices for 2026, which form the basis for the Bank’s projections, are slightly higher than in June.
The krone exchange rate
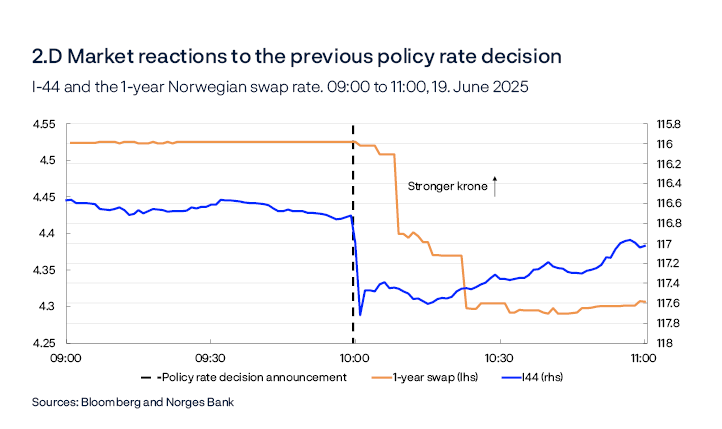
The krone exchange rate, as measured by the import-weighted exchange rate index I-44, weakened upon publication of the June 2025 Monetary Policy Report (Chart 2.D), in line with that projected. In the days following publication, the krone depreciated further at the same time as oil prices fell. The exchange rate changed little through summer but has strengthened since August. The krone has appreciated at the same time as developments in some Norwegian key economic indicators have been somewhat stronger than market expectations indicated prior to publication. The krone is now slightly stronger than projected in the June Report.
The krone exchange rate has changed little against the currencies of Norway’s main trading partners (Chart 2.E). The broad depreciation of the US dollar leading up to the June Report has slowed. Overall, the krone exchange rate has changed little against the US dollar but has weakened slightly against the euro and the Swedish krona.

Norges Bank’s krone projections assume an effect of unexpected policy rate changes in the short term (see box “The effect of monetary policy on the krone exchange rate” in Monetary Policy Report 1/2025). The magnitude of the assumed effect depends on how Norges Bank expects market interest rates to move following a policy rate decision. Beyond policy rate developments, Norges Bank normally has no information other than what the market has already priced into the exchange rate, and the krone exchange rate is therefore normally assumed to remain stable further ahead.
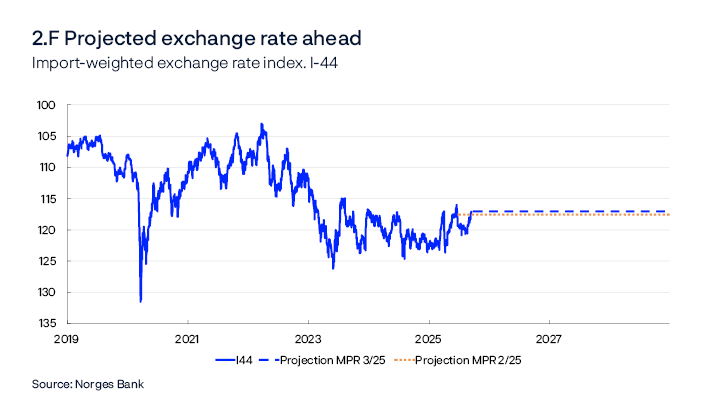
In this Report, the krone exchange rate is expected to remain broadly unchanged upon publication of the policy rate forecast (Chart 2.F), which may be viewed in the context of the forecast being slightly lower than market expectations in 2025 and slightly higher in 2026. The krone is then assumed to remain unchanged to the end of the projection period.
3. Monetary policy analysis
This section describes the monetary policy analysis presented to Norges Bank’s Monetary Policy and Financial Stability Committee, which forms part of the basis for the policy rate decision. The policy rate forecast is described and explained in the Committee’s assessment.
Model implications of new information
New information
The forecasts and the monetary policy analysis are based on analyses of the current economic situation and assumptions regarding exogenous driving forces. For 2025 Q3 and Q4, the macroeconomic model, NEMO, is conditioned on the projections further described in Section 2. The driving forces incorporated in the model analysis further out than the first two quarters include petroleum prices, global economic developments and petroleum investment.
After conditioning on historical data, short-term forecasts and exogenous driving forces, NEMO provides forecasts for the remainder of the forecast horizon. To summarise how new information and new assessments of the economic situation have affected the forecasts since the June Report, output gap and core inflation (CPI-ATE) forecasts are presented given the same policy rate path as in the previous Report.
Key premises for this exercise are:
- CPI-ATE inflation has been as projected in the June Report, despite the contribution to lower inflation from the reduction in daycare prices. Underlying inflationary pressure is therefore assumed to be slightly higher than envisaged in June.
- The krone exchange rate is slightly stronger than projected in the June Report. Given an unchanged policy rate path in the exercise, the krone exchange rate is assumed to depreciate slightly upon publication of the policy rate decision and will be as projected in the June Report.
- Projected capacity utilisation in the Norwegian economy has been revised up slightly in the coming period.
The exercise indicates that given an unchanged policy rate path, the output gap will narrow a little compared with the June Report throughout the projection period (Chart 3.1).

The model’s policy rate path
NEMO generates a policy rate path aimed at achieving an optimal trade-off between the outlook for inflation and the output gap. New information and new assessments will normally generate changes in the model-based policy rate path (model path).

In the decomposition in Chart 3.2, Nemo is used to decompose the main driving forces behind changes in the model path since the June Report. In models like NEMO, disruptions that move inflation away from the target and output away from potential output are explained by structural shocks. When data and projections differ from that envisaged, the shocks change. The decomposition shows how such changes contribute to changes in the model path. The bars show contributions from different types of shocks, and the broken line shows the sum of the bars. The solid line shows the change in the policy rate forecast. The model path is somewhat higher than in June. The main contributions to changes in the model path since the June Report are:
- Developments in a number of demand components have been stronger than projected in June. Near-term projections for household consumption and housing and business investment have been revised up. The Bank’s assessment is that capacity utilisation is slightly higher than estimated in the June Report. Higher projected underlying productivity implies a lower contribution from a rise in demand to pressures in the economy, which dampens the effect of higher demand on the model path. Overall, demand and productivity pull the model path up (orange bars).
- Developments in the CPI-ATE in recent months suggest that underlying inflationary pressure is slightly higher than anticipated in the June Report, pulling up the model path somewhat. The wage projections for 2025 and 2026 have been revised up. In the model, the upward revision of wage growth is explained by the upward revision of underlying productivity and a slightly higher output gap than in the June Report. This means that the wage contribution beyond what can be explained by underlying driving forces is small. Overall, prices and wages pull up the model path a little (red bars).
- There are prospects for slightly higher growth among Norway’s main trading partners than projected in the June Report, which in isolation boosts demand for Norwegian exports. Market rates abroad are little changed and the projections for underlying inflation are unchanged since the June Report. Overall, external factors push up the model path slightly in the coming quarters (dark green bars).
- The krone exchange rate is slightly stronger than projected in the June Report, and the krone is expected to appreciate slightly ahead. In the model, a higher interest rate differential pulls in the direction of a stronger krone, while lower oil prices pull in the direction of a weaker krone. Movements in the krone exchange rate have been in line with the model drivers and do not affect the model path.
- Petroleum prices are lower than in June. In the model, petroleum prices contribute in isolation to a weaker krone, lower wage growth and lower petroleum investment. At the same time, the projections for petroleum investment are broadly unchanged since the June Report and therefore higher than implied by changes in oil prices. Overall, petroleum prices and investment pull down the model path slightly (light blue bars).
Monetary policy indicators and trade-offs
Simple rule for the money market rate
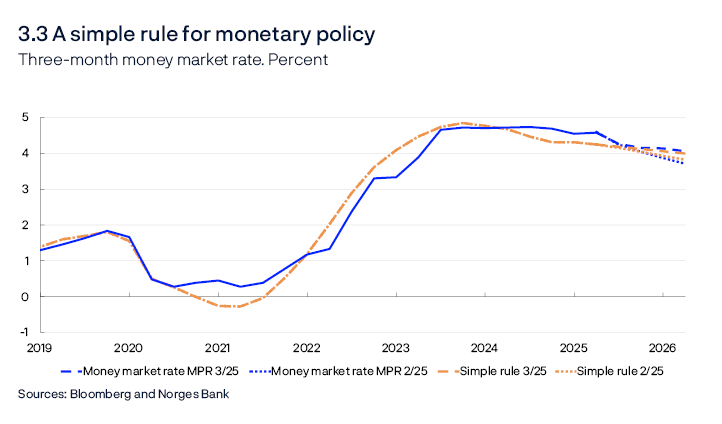
Simple estimated interest rate rules can provide a description of the average monetary policy reaction function and can be used as a cross-check of the model path. See Monetary Policy Report 1/2025 for further information on Norges Bank’s simple monetary policy rule. The simple rule for the money market rate now indicates a slightly higher rate than the rule indicated in the June Report (Chart 3.3) given that the inflation projections are slightly higher further out in the forecast horizon and the output gap relative to potential has been revised up slightly. The estimated rule indicates a money market rate that is close to the Bank’s projection.
Policy rate expectations
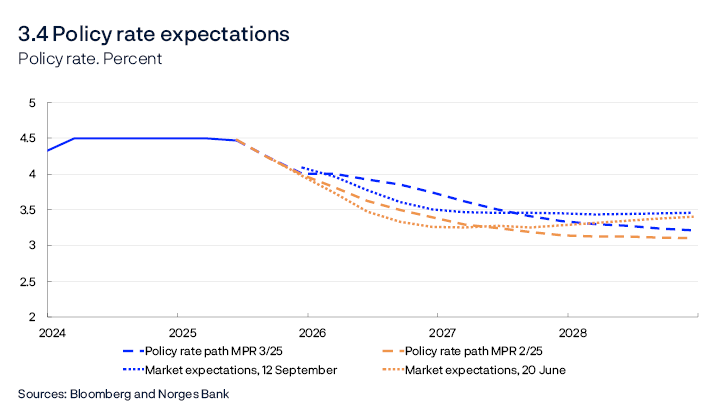
Market-implied policy rates further out can provide an indication of how market participants have interpreted new information and how they expect Norges Bank to react. Market rates fell upon publication of the June Report and have since recovered somewhat (Chart 3.4). Market rates are slightly higher than the policy rate forecast in this Report in 2025 and slightly lower in 2026.
Policy rate expectations among Norway’s trading partners
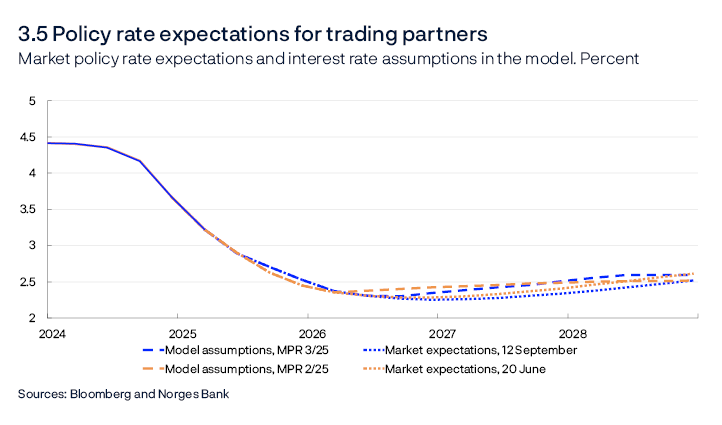
Norway is a small open economy, with financial markets closely intertwined with trading partner markets. Changes in foreign interest rates can affect the krone exchange rate. Market policy rate expectations among Norway’s main trading partners are little changed (Chart 3.5).
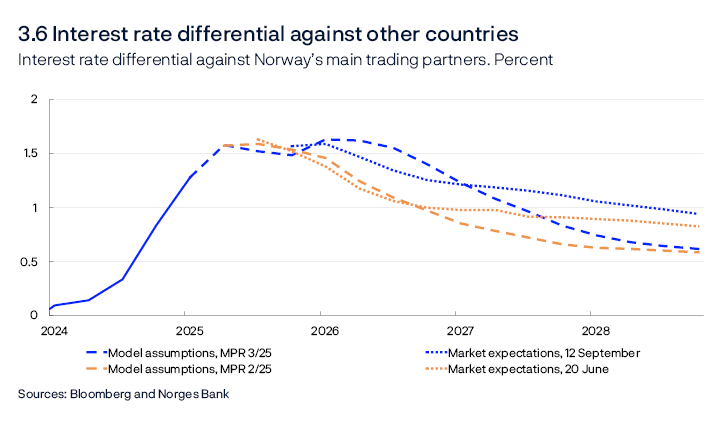
In Norway, market policy rate expectations have risen and the interest rate differential against other countries has increased since June (Chart 3.6). The differential based on projected policy rates and the Bank’s foreign interest rate assumptions are on the whole slightly higher than in the June Report. In isolation, a higher interest rate differential is consistent with a stronger krone.
Expected real interest rate
The expected real interest rate relative to the interval for the neutral real interest rate can indicate how monetary policy is transmitted to the economy. In this Report, the expected real interest rate is defined as the expected nominal policy rate less expected future inflation. The policy rate forecast has been revised up more than the CPI-ATE projections. The Bank’s estimate of the expected real interest rate has therefore been revised up for the coming year and remains broadly unchanged thereafter (Chart 3.7). In isolation, a higher expected real interest rate suggests a more contractionary monetary policy than in the June Report. However, this is only one measure of the transmission of monetary policy to the economy (see for example the box “Both nominal and real interest rates influence consumption” in Monetary Policy Report 3/2023).

The expected real interest rate in the years ahead lies in the upper half of the interval of the Bank’s estimates of the neutral real interest rate. The neutral real interest rate is estimated to be in the interval between 0.25% and 1.5% (see box on the neutral real interest rate in the Monetary Policy Report 2/2025).
Household and corporate interest rates
Household and corporate interest rates have been relatively stable since the beginning of 2024. Key developments in this Report are:
- The policy rate forecast indicates a somewhat higher rate than in the June Report (Chart 3.8).
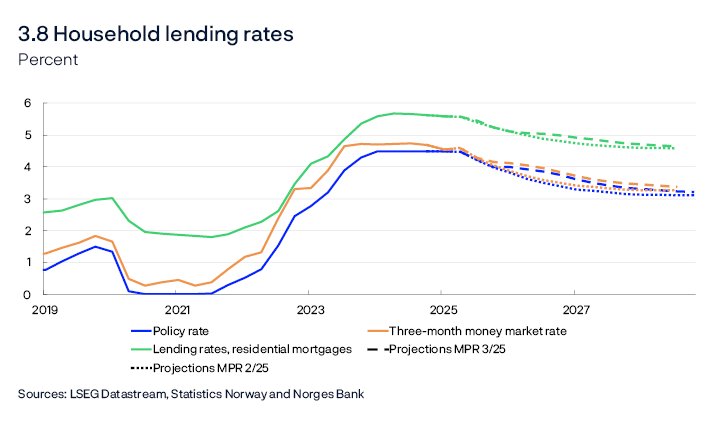
- The policy rate path is consistent with a 0.25 percentage point reduction in the course of 2026, another reduction in 2027 followed by one more in 2028.
- The policy rate forecast at the end of the forecast horizon is 3.2%.
- The money market spread is broadly as projected in the June Report, and futures prices indicate that it will remain at the current level ahead. The money market spread is projected to remain unchanged from the June Report.
- A number of banks announced a reduction in the interest rate on outstanding mortgages effective only from August. Mortgage rates have therefore been somewhat higher than assumed. Lending rates are expected to fall as the policy rate is reduced. The average mortgage rate is projected at 4.7% in 2028.
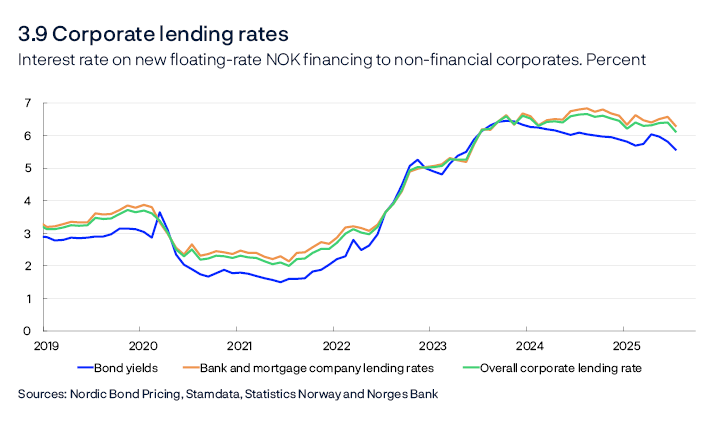
- The interest rate on new corporate loans, measured as a weighted average of bank and bond debt, has fallen somewhat since the end of 2024 (Chart 3.9), driven by lower interest rates on both new bank loans and bonds.
Trade-offs between inflation, output and employment
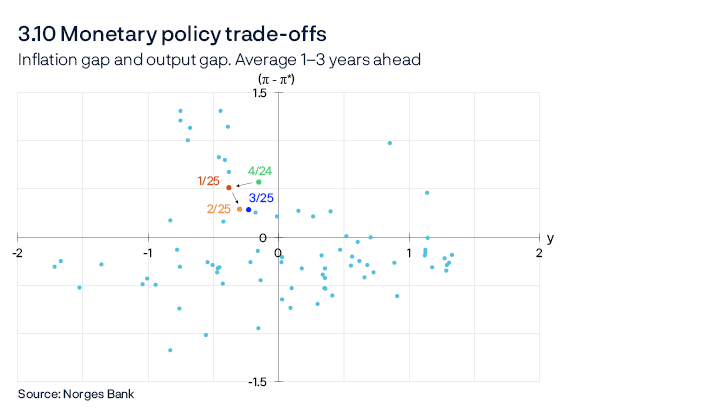
The trade-offs between low and stable inflation and high and stable output and employment are reflected in the Committee’s assessment and the inflation and output gap forecasts. The policy rate, inflation and output gap forecasts are shown in the chart in the Committee’s assessment. The points in Chart 3.10 show the average forecasts one to three years ahead for the output gap and inflation gap (the difference between inflation and the target) in different reports. The location of the points in the chart depends on the shocks to the economy and the monetary policy response. In this Report, the outlook suggests that inflation remains broadly unchanged one to three years ahead compared with the June Report, whereas the output gap relative to output is slightly higher.
Historical forecast errors
Forecasts are uncertain, and outcomes may deviate from the projections. The deviation between historical forecasts and actual developments can provide insight into the range of possible outcomes ahead. The left panel in Chart 3.A shows historical policy rate forecasts and the upward revisions in 2022 and 2023. The right panel shows a fan chart for the forecast ahead based on historical forecast errors. The fan chart is constructed using forecast errors from the past 20 years. If future forecast errors follow the same pattern as the historical errors, 70% of outcomes are expected to lie within the light shaded area.
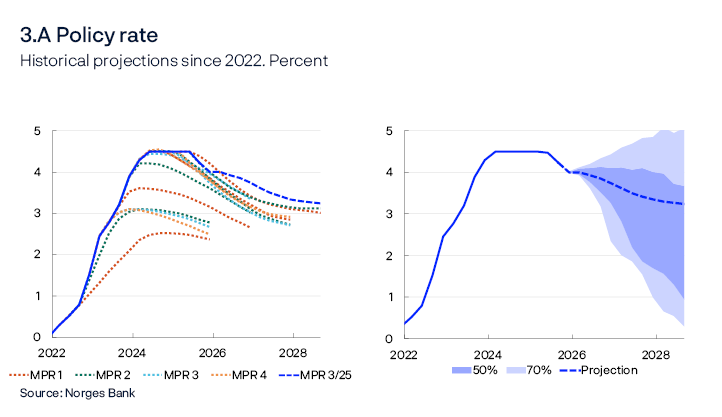
The fan chart in the right panel indicates that the range of possible outcomes for the policy rate increases further out in the forecast horizon. The fan chart is skewed to the downside, which reflects the clear downward trend in interest rates in the decade following the financial crisis, which was not captured early enough when the forecasts were made. In the near term, the range of possible outcomes is narrower, reflecting the fact that the actual policy rate has proven to be close to the communicated policy rate path.
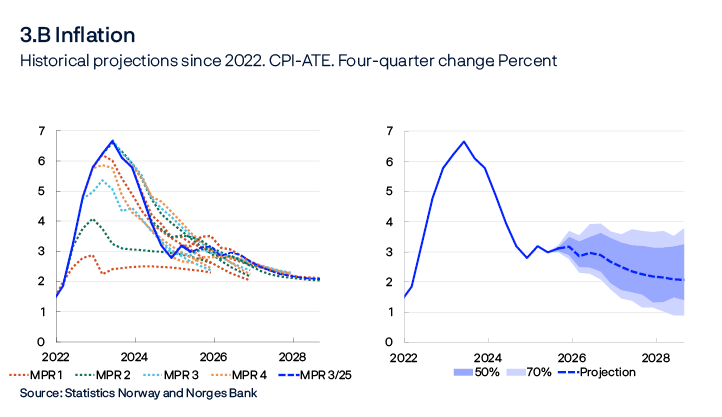
Chart 3.B shows a corresponding panel for inflation. Inflation was higher than expected following the pandemic, and the inflation forecasts were revised up accordingly through 2022 and 2023 (left panel). This was the main reason for the higher policy rate forecasts for the same years in Chart 3.A. The fan chart in the right panel is relatively symmetrical.
The left panel in Chart 3.C shows previous output gap forecasts. In 2022, the forecasts were revised down. From mid-2023, the gap forecasts were revised up for the coming quarters. The output gap fan chart is fairly symmetrical (Chart 3.C, right panel).
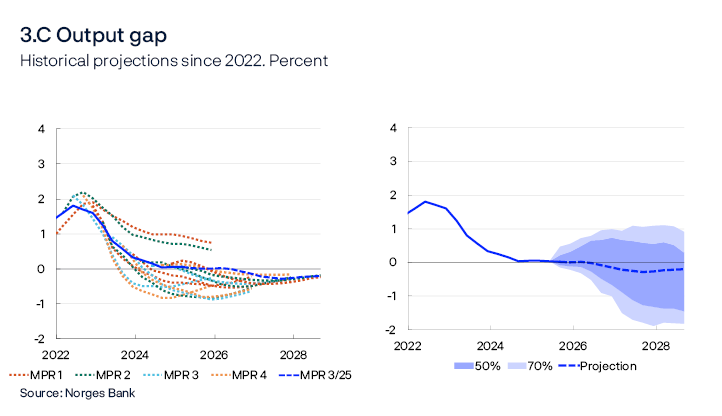
The fan charts in the right panel for the three variables show a range of possible outcomes that only capture forecast errors for each variable. Shocks to the economy will often affect multiple variables simultaneously, and Norges Bank will typically react by changing the policy rate. 1 Thus, developments ahead for one variable will be dependent on other variables. The relationship between developments in the different variables will depend on the type of shocks that impact the economy. In the event of a demand shock, the output gap and inflation will be pulled in the same direction. This will not normally cause any conflicts between monetary policy objectives, and the policy rate will be changed to stabilise both the output gap and inflation. This will pull the policy rate to the outer bands of the fan chart in Chart 3.A, while inflation and output gap move away from the original forecasts to a lesser extent.
A supply shock, however, pulls the output gap and inflation in opposite directions. This will result in monetary policy trade-offs and a more moderate response. The range of possible outcomes will then usually be greater for inflation and the output gap than for the policy rate. In the charts, inflation and the output gap could be drawn towards the outer bands of the fan charts, while changes to the policy rate will be less pronounced.
Overall, the fan charts indicate increased uncertainty over time and greater variation in the policy rate further out in the forecast horizon.
- 1 See Norges Bank’s monetary policy strategy statement for a further description of Norges Bank’s monetary policy response to different shocks.
Boxes
To what extent do international impulses affect the Norwegian economy?
This box seeks to quantify the share of Norwegian cyclical fluctuations driven by international conditions. We find that international shocks can explain up to 40% of the variation in core inflation and mainland GDP growth.
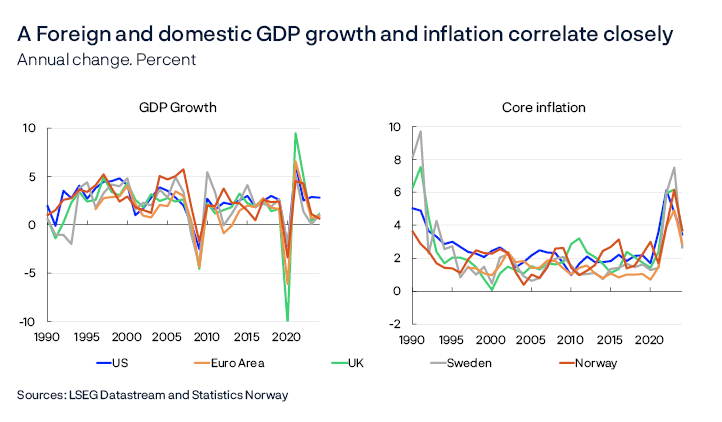
Chart A shows a relatively close covariation between economic growth and inflation in both Norway and its main trading partners. Some of the covariation is due to shocks that hit both Norway and Norway’s trading partners simultaneously. However, the covariation is also driven by shocks that first originate abroad and then propagate to the Norwegian economy through various channels. For example, higher demand among trading partners may boost activity in the Norwegian economy through the trade channel, while higher international prices may push up Norwegian inflation through higher prices for imported intermediate goods and imported consumer goods. In this box, the focus is on how different international impulses like these influence the Norwegian economy.
To provide an indication of possible causal relationships, a Bayesian estimated vector autoregression (BVAR) model is used.1 This model can differentiate between different types of shocks and isolate their impact over time. Eight variables are included in the model: GDP and core inflation for OECD countries, oil prices, Norwegian core inflation, Norwegian mainland GDP growth, the krone exchange rate (I-44) and Norwegian and international money market rates. For a more detailed description of the model, see the Documentation Note.2
The unexplained data variation is assumed to be driven by underlying structural shocks. Based on economic theory, four such foreign shocks from abroad are identified: an international supply shock, an international demand shock, an international interest rate shock and an oil price shock. The oil price shock is intended to account for the impact of changes in oil prices beyond those driven by international business cycles.
The impact of these four international shocks on the Norwegian economy is compared with four other shocks: a domestic supply shock, a domestic demand shock, a domestic interest rate shock and a risk premium shock. As Norway is a small economy, domestic shocks are assumed not to affect international variables. Interest rate and risk premium shocks are intended to cover changes in the money market rate and krone exchange rate, respectively, beyond what would be expected from other driving forces in the model. Given that the money market rate is used, interest rate shocks can capture shocks to both the policy rate and the money market premium.
Chart B shows the share of the variation in Norwegian GDP growth and inflation that can be explained by the eight shocks in the model. Around 40% of the variation in Norwegian GDP growth is explained by the four international shocks. The shocks’ relative contribution to the variation is fairly stable throughout the horizon.
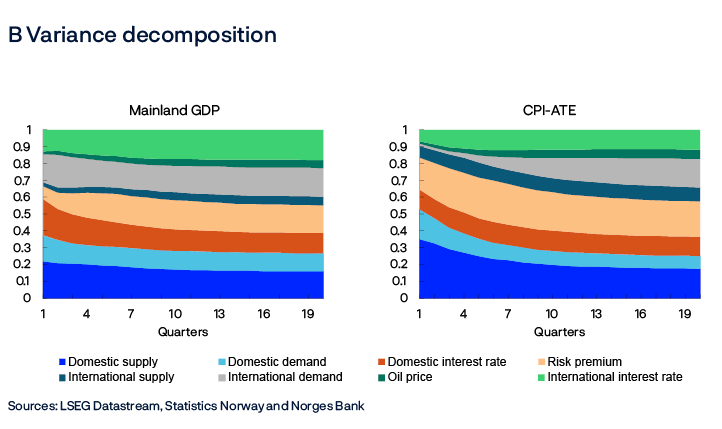
In terms of inflation, international shocks explain around 15% of the near-term variation and around 40% in the slightly longer term. International demand shocks in particular take time to spill over to Norwegian prices. This is likely due to the fact that increased demand for Norwegian goods and services primarily affects Norwegian prices through higher wage growth, which is relatively slow to adjust.
The risk premium shock also explains a relatively large share of inflation variation. An important reason for this is that risk premium affects the exchange rate, which in turn affects prices for both imported intermediate and consumer goods. Given that exchange rates are relative prices that depend on both domestic and international conditions, some of the risk premium shocks can represent an additional international channel into the Norwegian economy.
The analysis shows that international shocks may explain a considerable share of the variation in Norwegian GDP growth and inflation, in line with previous studies.3 This may be an important reason why Norwegian economic variables often closely correlate with corresponding variables in other countries. The results are uncertain because the model builds upon assumptions that will not always be fulfilled. However, the shares of the variation are relatively stable for the choice of model and the specification changes.
By using a richer model than in previous empirical studies, better insight is provided into how foreign shocks impact Norway. For example, the analysis also emphasises the importance of shocks for international interest rates, also beyond supply and demand shocks. Norges Bank is working on an ongoing project that seeks to incorporate insights from the empirical analysis into a structural macroeconomic model.
- 1 The model expands upon the model presented in Monetary Policy Report 2/2024. The krone exchange rate and oil prices are added to better account for the impact from abroad. The price margin is omitted given that the model focuses less on Norwegian conditions.
- 2 Documentation Note 5/2025. “To what extent do international impulses affect the Norwegian economy?” (forthcoming Friday, 19 September).
- 3 This is qualitatively in line with previous studies from Norges Bank, see Bergholt, D. and V. H. Larsen (2016) "Business cycles in an oil economy: Lessons from Norway". Kravik, E. M. and Y. Mimir (2019) “Navigating with NEMO” Working Papers 16/2016, Norges Bank. Staff Memo 5/2019. Norges Bank, and Aastveit, K.A., F. Furlanetto, F. Ravazzolo (2013) "On the importance of foreign factors for the Norwegian economy". Economic Commentaries 3/2013. Norges Bank.
Younger and older age cohorts in particular have boosted employment
Higher employment among persons aged under 25 and over 62 in particular has helped keep the employment to population (EPOP) ratio high after the pandemic. In the same period, the number of hours worked per employee has increased less than employment, as a result of employment increasing the most in the age cohorts that work the least hours.
The EPOP ratio declined rapidly during the pandemic but has since picked up and is now at a higher level than before the downturn (Chart 1.3). To gain a better understanding of why the ratio has remained high, this box explores how different age cohorts have influenced developments in employment.
Overall, the EPOP ratio for residents in Norway rose by over 1 percentage point since 2019 (Chart C), with a relatively even distribution between men and women. The rise has been somewhat more pronounced for immigrants, excluding Ukrainians, than for native-born. If Ukrainians are included in the data, the overall rise is less pronounced. However, the largest differences are between EPOP ratio developments for different age cohorts (Chart C). In recent years, the EPOP ratio has risen by far the most for the age cohort 15-19, and there is also a substantial rise for the age cohort 20-24. In addition, there is a marked rise in the EPOP ratio for the oldest age cohorts (62-74). Developments have been weaker for the core age cohorts (25-61).
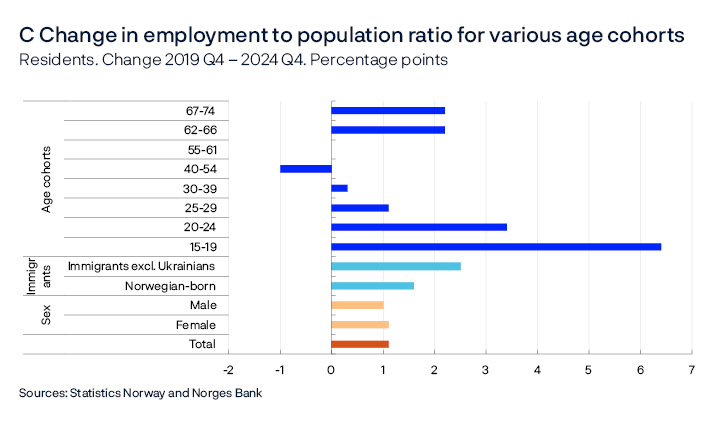
For the oldest cohort, the rise in employment is broadly based across sectors, reflecting later retirement in recent years, which may also be due to pension reform.
For the youngest cohorts, the rise in the EPOP ratio largely reflects that a higher proportion is working while in education. This trend is also strongest among those younger than 20. For those employed and not in education in the youngest cohorts, the rise in the EPOP ratio since 2019 has been less pronounced and more in line with that of the other cohorts in Chart C. At the same time, particularly in the youngest age cohort, there are more employed workers with a lower number of contracted hours per week. The largest increase in the number of employed is among those who have between one and four contracted hours (Chart D). The EPOP ratio for the 20-24 cohort has also risen most for those with a low number of contracted hours, but differences are smaller than for the youngest cohorts.
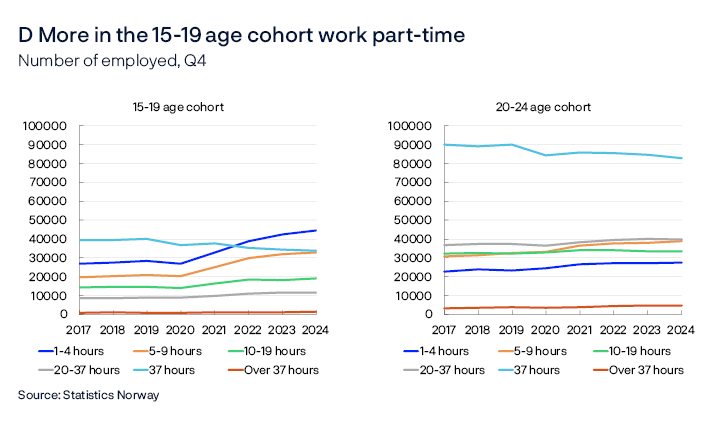
Changes in the EPOP ratio may be due to both cyclical and structural conditions. It is important to distinguish between these two conditions in order to better interpret developments in employment. This is done below by estimating a model indicator1 for the trends in the various subgroups. These trends can be aggregated to an overall trend for the overall EPOP ratio. Trend estimates can provide an indication of underlying structural developments but will always be subject to uncertainty.
The calculations show that the trend varies across different age cohorts but rises the most in the youngest and oldest cohorts. In the oldest cohort, the EPOP ratio has risen in pace with the estimated trend (Chart E). This may imply that the increase in the EPOP ratio for this cohort is primarily due to more structural conditions and that it will likely continue to increase ahead. For the 20-24 cohort, the EPOP ratio has also been somewhat above trend but has recently levelled out close to trend. For the youngest cohort, the EPOP ratio is higher than the estimated trend, which may indicate that the rise in the EPOP ratio is due to both structural and cyclical conditions.
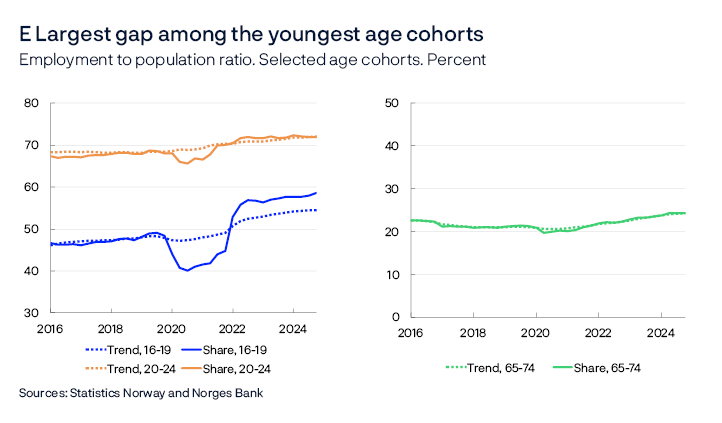
When assessing the effect of the higher EPOP ratio on production capacity in the economy, weight must also be given to hours worked per employee. Employment and hours worked have moved approximately in tandem for much of the past 20 years (Chart 2.13). However, since 2021, hours worked have risen less than employment, suggesting a slight decline in the number of hours worked per employee.
As with the EPOP ratio, it is important to assess the extent to which developments in hours worked per employee can be expected to be permanent. In isolation, a higher EPOP ratio in the youngest and oldest cohorts reduces hours worked per employee as these cohorts work fewer hours on average than other cohorts. Since trend employment for these cohorts has risen, this may imply that structural conditions also contribute to the decline in hours worked per employee. On the other hand, a larger share of the decline could be considered cyclical if it coincides with a further pickup in employment in cyclical industries where working hours are shorter, eg in the accommodation and food services sector. In such cases, there may be reason to place less weight on the decline when assessing the Norwegian economy’s production capacity.
By assessing the significance of the composition effects based on both age and sector, a distinction may be made between the various explanations. If the age composition had remained unchanged since mid-2022, contracted hours would have remained more elevated (Chart F). On the other hand, if the employment shares of the different sectors are kept unchanged over the same period, the average number of contracted hours would have declined approximately as much as it actually has. The results indicate that the age composition has had greater significance than the sector composition in dampening contracted hours. Since parts of the contribution from the youngest and oldest cohorts to EPOP ratio developments are considered permanent, this also suggests that some of the decline in hours worked per employee is structural.
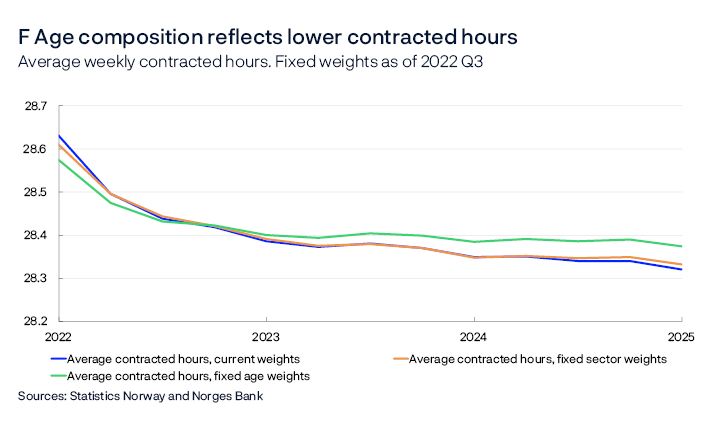
Monetary policy seeks to stabilise employment around the trend that is consistent with low and stable inflation over time. In recent years, this employment trend appears to have picked up and the estimate of the sustainable level of employment over time consistent with stable wage and price inflation has been revised up. It is often assumed that developments in hours worked per employee are stable over time, which means that an increase in trend employment results in a corresponding increase in potential output. However, in recent years, higher employment among the youngest and oldest cohorts has contributed to a somewhat lower hours worked trend. The EPOP ratio adjusted for hours worked has risen less compared with the pre-pandemic period. This indicates that the decline in trend growth in hours worked has likely offset some of the effect of higher trend employment and may in isolation indicate that potential output has been somewhat lower.
- 1 See box “Increased immigrant employment lifts the employment trend” in Monetary Policy Report 1/2024, and Ellingsen, N., L. Fosso, S. M. Galaasen (2024) "Employment trends in Norway". Staff Memo 1/2024. Norges Bank. The trends are estimated using VAR models with time varying trends, as in Staff Memo 1/2024. Registered unemployment is also included as an additional explanatory variable in the models.
Annex
Detailed tables of projections
Table 1 International projections
|
Change from projections in Monetary Policy Report 2/2025 in parentheses |
Weights1 Percent |
Percentage change from previous year |
||||
|---|---|---|---|---|---|---|
|
2024 |
2025 |
2026 |
2027 |
2028 |
||
|
GDP |
||||||
|
US |
12 |
2.8 (0) |
1.8 (0.2) |
1.6 (0.2) |
1.7 (-0.1) |
1.7 (0) |
|
Euro area |
47 |
0.8 (0) |
1.3 (0.3) |
1.1 (-0.1) |
1.3 (-0.1) |
1.4 (0.1) |
|
UK |
15 |
1.1 (0) |
1.3 (0.2) |
1.1 (0) |
1.3 (0) |
1.1 (-0.1) |
|
Sweden |
18 |
0.8 (-0.2) |
1.2 (-0.1) |
2.1 (-0.1) |
2.1 (0) |
2.1 (0) |
|
China |
8 |
4.9 (-0.1) |
4.8 (0.3) |
4.1 (0.3) |
4.1 (0) |
3.8 (0) |
|
5 trading partners1 |
100 |
1.4 (-0.1) |
1.6 (0.2) |
1.6 (0) |
1.8 (0) |
1.7 (0) |
|
Prices |
||||||
|
Underlying inflation2 |
3 (0) |
2.6 (0) |
2.3 (0) |
2.1 (0) |
2.2 (0.1) |
|
|
Wage growth2 |
4.4 (0) |
3.5 (0.1) |
3.2 (0) |
3 (0) |
2.9 (0) |
|
|
Prices for consumer goods imported to Norway, including freight rates3 |
2.7 (0) |
0.1 (-0.1) |
0 (-0.5) |
0.7 (0) |
0.9 (0) |
|
|
Prices for intermediate goods imported to Norway4 |
0.1 (0) |
0.5 (-0.2) |
0.9 (0.1) |
1.5 (0) |
1.5 (0) |
|
Table 2 Short-term estimates
Table 2a Consumer prices. Twelve-month change. Percent
|
2025 |
|||||||
|---|---|---|---|---|---|---|---|
|
Jun |
Jul |
Aug |
Sep |
Oct |
Nov |
Dec |
|
|
Consumer price index (CPI) |
|||||||
|
Actual |
3.0 |
3.3 |
3.5 |
||||
|
Projections MPR 2/25 |
3.1 |
3.1 |
3.5 |
3.7 |
|||
|
Projections MPR 3/25 |
3.7 |
2.7 |
2.5 |
2.6 |
|||
|
CPI-ATE |
|||||||
|
Actual |
3.1 |
3.1 |
3.1 |
||||
|
Projections MPR 2/25 |
3.1 |
3.1 |
3.1 |
3.1 |
|||
|
Projections MPR 3/25 |
3.2 |
3.2 |
3.1 |
3.1 |
|||
Sources: Statistics Norway and Norges Bank
Table 2b House prices. Monthly change. Seasonally adjusted. Percent
|
2025 |
|||||||
|---|---|---|---|---|---|---|---|
|
Jun |
Jul |
Aug |
Sep |
Oct |
Nov |
Dec |
|
|
Actual |
0.3 |
0.3 |
0.6 |
||||
|
Projections MPR 2/25 |
0.2 |
0.4 |
0.5 |
0.6 |
|||
|
Projections MPR 3/25 |
0.6 |
0.5 |
0.5 |
0.4 |
|||
Sources: Eiendomsverdi, Finn.no, Real Estate Norway and Norges Bank
Table 2c Registered unemployment (rate). Percent of labour force. Seasonally adjusted
|
2025 |
|||||||
|---|---|---|---|---|---|---|---|
|
Jun |
Jul |
Aug |
Sep |
Oct |
Nov |
Dec |
|
|
Actual |
2.1 |
2.1 |
2.1 |
||||
|
Projections MPR 2/25 |
2.1 |
2.1 |
2.1 |
2.1 |
|||
|
Projections MPR 3/25 |
2.1 |
2.1 |
2.1 |
2.2 |
|||
Sources: Nav and Norges Bank
Table 2d GDP for mainland Norway. Quarterly change.1 Seasonally adjusted. Percent
|
2025 |
||||
|---|---|---|---|---|
|
Q1 |
Q2 |
Q3 |
Q4 |
|
|
Actual |
1.2 |
0.6 |
||
|
Projections MPR 2/25 |
0.3 |
0.4 |
||
|
Projections MPR 3/25 |
0.4 |
0.4 |
||
- 1 Quarterly figures based on monthly national accounts.
Sources: Statistics Norway and Norges Bank
Table 3 Projections of main economic aggregates
|
Change from projections in Monetary Policy Report 2/2025 in parentheses |
Percentage change from previous year (unless otherwise stated) |
|||||
|---|---|---|---|---|---|---|
|
Constant 2022 prices (NOK bn) 2024 |
2024 |
Projections |
||||
|
2025 |
2026 |
2027 |
2028 |
|||
|
Prices and wages |
||||||
|
CPI |
3.1 |
2.9 (-0.1) |
2.2 (0.0) |
2.5 (0.2) |
2.1 (0.0) |
|
|
CPI-ATE |
3.7 |
3.1 (0.0) |
2.8 (0.1) |
2.3 (0.1) |
2.1 (0.0) |
|
|
Annual wages |
5.6 |
4.7 (0.2) |
4.2 (0.1) |
3.7 (0.1) |
3.4 (0.1) |
|
|
GDP deflator, mainland Norway |
3.5 |
3.7 (0.1) |
3.8 (0.0) |
3.3 (0.2) |
2.9 (0.2) |
|
|
Real economy1 |
||||||
|
Gross domestic product (GDP) |
5857 |
2.1 |
0.4 (0.3) |
1.2 (0.2) |
0.2 (-0.1) |
-0.3 (-0.1) |
|
GDP, mainland Norway2 |
3729 |
0.6 |
2.0 (0.4) |
1.5 (0.1) |
1.3 (-0.1) |
1.3 (-0.1) |
|
Output gap, mainland Norway (level) |
0.1 |
0.0 (0.0) |
-0.1 (0.2) |
-0.3 (0.0) |
-0.2 (0.0) |
|
|
Employment, persons, QNA |
0.5 |
0.8 (-0.1) |
0.8 (0.1) |
0.6 (-0.1) |
0.6 (-0.1) |
|
|
Registered unemployment (rate, level) |
2.0 |
2.1 (0.0) |
2.2 (0.0) |
2.1 (-0.1) |
2.1 (0.0) |
|
|
Demand1 |
||||||
|
Mainland demand2 |
3754 |
0.3 |
2.2 (0.2) |
2.7 (-0.1) |
2.2 (-0.2) |
1.8 (-0.1) |
|
– Household consumption |
1861 |
1.3 |
3.1 (0.2) |
2.5 (0.3) |
1.8 (-0.1) |
1.5 (-0.1) |
|
– Business investment |
383 |
-2.9 |
2.4 (1.1) |
3.4 (-0.2) |
2.6 (-0.6) |
2.0 (0.1) |
|
– Housing investment |
157 |
-19.1 |
-4.7 (1.7) |
7.5 (-2.4) |
9.1 (-1.2) |
6.9 (-0.5) |
|
– Public demand |
1354 |
2.7 |
1.7 (-0.3) |
2.4 (-0.4) |
2.0 (0.0) |
1.5 (-0.1) |
|
Petroleum investment2 |
216 |
9.8 |
5.0 (0.0) |
-5.0 (1.0) |
-5.0 (0.0) |
-4.0 (0.0) |
|
Mainland exports2 |
1072 |
3.9 |
3.8 (0.4) |
1.4 (0.2) |
1.6 (-0.3) |
2.3 (0.0) |
|
Mainland imports2 |
1502 |
4.3 |
0.4 (-2.0) |
2.3 (-0.7) |
2.9 (-0.3) |
2.7 (-0.1) |
|
House prices and debt |
||||||
|
House prices |
3.0 |
6.0 (-0.3) |
6.9 (-1.1) |
6.6 (0.2) |
5.4 (0.6) |
|
|
Household credit (C2) |
3.5 |
4.4 (0.3) |
4.5 (0.3) |
4.6 (0.3) |
4.6 (0.1) |
|
|
Interest rates and exchange rate |
||||||
|
Policy rate (level) |
4.5 |
4.3 (0.0) |
3.9 (0.3) |
3.5 (0.3) |
3.3 (0.2) |
|
|
Import-weighted exchange rate (I-44) (level) |
120.3 |
119.1 (0.3) |
117.0 (-0.5) |
117.0 (-0.5) |
117.0 (-0.5) |
|
|
Policy rate, trading partners (level)3 |
4.1 |
2.8 (0.0) |
2.3 (0.0) |
2.3 (0.0) |
2.4 (-0.1) |
|
|
Household income and saving1 |
||||||
|
Real disposable income excl. dividend income |
3.9 |
4.1 (0.2) |
3.7 (0.3) |
2.7 (-0.1) |
2.3 (0.1) |
|
|
Saving ratio excl. dividend income (rate, level) |
2.4 |
2.2 (0.1) |
2.7 (0.1) |
2.9 (-0.1) |
3.3 (0.1) |
|
|
Fiscal policy |
||||||
|
Structural non-oil deficit as a percentage of GPFG4 |
2.6 |
2.7 (0.0) |
2.8 (-0.1) |
2.8 (0.0) |
2.8 (0.0) |
|
- 1 All figures are working-day adjusted.
- 2 Annual figures based on monthly national accounts.
- 3 Overnight Index Swap.
- 4 Government Pension Fund Global measured at the beginning of the year.
Sources: Eiendomsverdi, Finn.no, LSEG Datastream, Ministry of Finance, Norwegian Labour and Welfare Administration (Nav), Real Estate Norway, Statistics Norway and Norges Bank