The Committee’s assessment summarises the Monetary Policy and Financial Stability Committee members’ assessments that led to the monetary policy decision at the meeting on 18 June 2025. The analyses in Monetary Policy Report 2/2025 summarise the basis for the assessment.
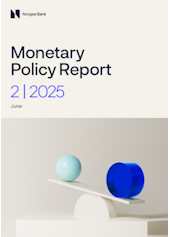
Norges Bank’s Monetary Policy and Financial Stability Committee unanimously decided to reduce the policy rate from 4.5 percent to 4.25 percent at its meeting on 18 June. The economic outlook is uncertain, but if the economy evolves broadly as currently projected, the policy rate will be reduced further in the course of 2025.
The operational target of monetary policy is annual consumer price inflation of close to 2% over time. Inflation targeting shall be forward-looking and flexible so that it can contribute to high and stable output and employment and to counteracting the build-up of financial imbalances.
The policy rate was raised significantly to tackle high inflation and has stood at 4.5% since December 2023. The tightening of monetary policy has contributed to cooling down the Norwegian economy and to dampening inflation. Inflation has fallen in recent years but is still above target. At the same time, unemployment has increased somewhat from a low level. The output gap has narrowed, and output is now close to potential.
The global economic outlook is still marked by uncertainty about international trade policies. Since the March Report, the US has raised tariffs further on a range of goods, and some countries have responded with countermeasures. The Committee noted that the growth outlook for trading partners appears to be somewhat weaker than in March. Increased tariff rates pull inflation in different directions. Lower global growth and a shift in trade towards tariff-free markets could dampen inflation. On the other hand, higher tariffs could drive up inflation in the tariff-imposing countries and in other countries through more expensive intermediate goods or due to global supply chain disturbances. The Committee noted that most international forecasters have revised up their US inflation forecasts, while their forecasts have been revised down for the euro area. Some commodity prices, for example steel and aluminium prices, have fallen since March. The military strikes in the Middle East have led to a rise in oil prices over the past week, and prices are now back to the levels seen in March.
There have been large movements in financial markets since March. Major equity indices declined sharply in the beginning of April, while bond market spreads and a number of uncertainty indicators increased. These movements were since largely reversed. In recent months, the US dollar has depreciated against a range of currencies, including the Norwegian krone. The krone exchange rate, as measured by the import-weighted exchange rate index (I-44), depreciated during the market turbulence in April but has since appreciated again and is now somewhat stronger than assumed in March.
The Committee noted that both international and Norwegian interest rate expectations have fallen somewhat, but that longer-term interest rate expectations remain markedly higher than the policy rate forecast in the March Report. Long-term interest rates have risen in recent years. Estimates of the neutral interest rate provide an indication of what a normal interest rate level will be in the long term. The Committee noted that updated analyses indicate that the neutral rate is a little higher than previously assumed.
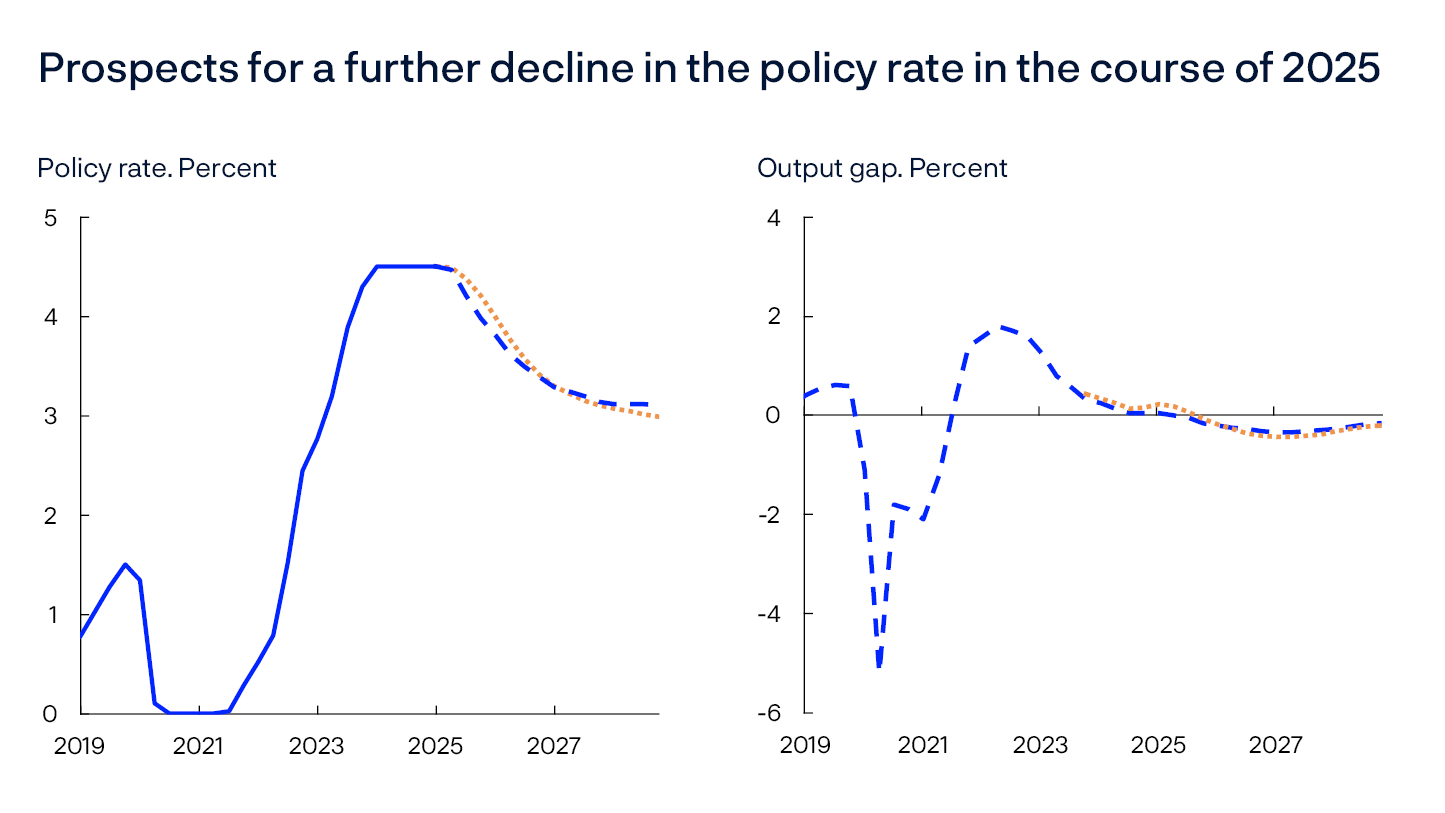
The Committee gave special attention to the fact that underlying inflation has declined and been somewhat lower than projected. Twelve-month consumer price inflation (CPI) adjusted for tax changes and excluding energy products (CPI-ATE) decreased to 2.8% in May. At the same time, higher energy prices pushed up CPI inflation to 3.0%, which was somewhat higher than projected. Domestically produced goods and services inflation is still stoking overall inflation. International price impulses to imported consumer and intermediate goods appear to be weaker than previously assumed. It appears that wage growth will be notably lower in 2025 than in 2024, in line with the projection in the previous Report.
The Committee noted that new information on capacity utilisation in the Norwegian economy pulls in different directions. Economic activity appears to be holding up well. After falling towards the end of 2024, activity has risen again and been higher than projected. The Committee noted that Regional Network contacts expect growth to hold steady in the coming period. After declining over a long period, activity in the construction sector now appears to have stopped falling. On the other hand, labour market developments appear to have been a little weaker than expected. Employment has increased further, while registered unemployment rose to 2.1% in May. LFS unemployment has shown a gradual increase this year. Overall, new information indicates that there may be a little more spare capacity in the Norwegian economy than assumed in the previous Report.
The direct effects of higher tariff rates on growth in the Norwegian economy are likely limited. The Committee noted that many Regional Network contacts report increased uncertainty due to international trade conflicts, but few contacts expect higher tariff rates to have a significant impact on activity ahead.
The Committee judges that a restrictive monetary policy is still needed but that it is now appropriate to begin a cautious normalisation of the policy rate. At the monetary policy meeting in March, the Committee’s assessment was that the policy rate would most likely be reduced in the course of 2025. Inflation is still above target, and the recent years’ high growth in costs will likely stoke inflation for a period ahead. Since March, underlying inflation has declined somewhat faster than expected, and the inflation outlook for the coming year indicates somewhat lower inflation than previously expected. The Committee judges that a cautious normalisation of the policy rate will pave the way for inflation to return to target without restricting the economy more than necessary.
The policy rate forecast in this Report declines to just below 4% at the end of 2025 and to about 3% towards the end of 2028. The forecast is little changed from the previous Report but is slightly lower in the near term and slightly higher further out in the projection period. Economic growth is likely to be higher in 2025 than in 2024 and is expected to remain moderate in the coming years. Registered unemployment is expected to increase slightly to around pre-pandemic levels. Inflation is projected to move down and be close to 2% in 2028.
The uncertainty surrounding the outlook is greater than normal. An escalation of conflicts between countries and uncertainty about future trade policies may result in renewed financial market turbulence and could impact both Norwegian and international growth prospects. If the economy takes a different path than currently envisaged, the policy rate path may also differ from that implied by the forecast. If prospects suggest that wage and price inflation will remain elevated for longer than projected, a higher policy rate than currently envisaged may be required. If inflation falls faster than projected, or unemployment rises more than projected, the policy rate may be reduced faster.
Ida Wolden Bache
Pål Longva
Øystein Børsum
Ingvild Almås
Steinar Holden
18 June 2025
1. Overall picture
International trade and cooperation are undergoing significant change, but this has so far had limited impact on the economic outlook for Norway. In Norway, underlying inflation increased at the beginning of the year but has slowed again in recent months. At the same time, unemployment has edged up. Based on the policy rate forecast underlying the projections in this Report, inflation is expected slow further out, moving down to around 2% in 2028. Registered unemployment is likely to increase somewhat further ahead, to around pre-pandemic levels.
Inflation
Inflation both in Norway and internationally has declined markedly in recent years, after rising sharply in the wake of the pandemic and Russia’s invasion of Ukraine. Among a number of Norway’s main trading partners, overall CPI inflation was close to the 2% inflation targets in May (Chart 1.1). In Norway, CPI inflation was 3.0%, up from 2.5% in April. While energy prices dampened international inflation, energy prices in Norway were appreciably higher in May than in the same month one year earlier. Low levels of precipitation in spring have pushed up electricity prices recently.

In Norway, the CPI, adjusted for tax changes and excluding energy products (CPI-ATE), was 2.8% in May, a decline from 3.4% in February and March. This was also lower than projected in the March 2025 Monetary Policy Report, but broadly as high as inflation at the end of 2024. While food inflation increased considerably in the first month of 2025, the rise in food prices has abated in the past couple of months.
GDP and demand
In Norway and among our main trading partners, economic activity rose rapidly in the wake of the pandemic, but the rise in many European countries was dampened as wage growth failed to keep up when inflation surged. Subsequently, central banks’ policy rate hikes also acted as a brake on growth.
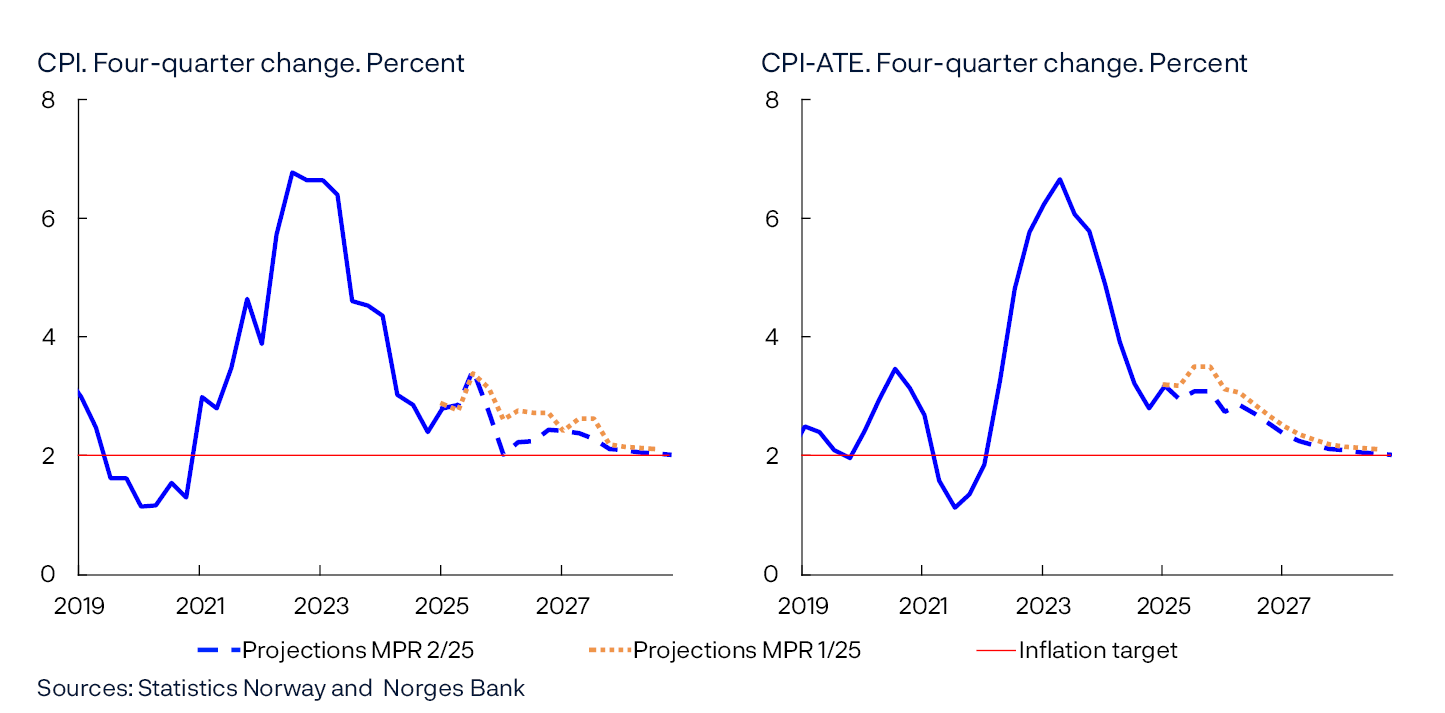
In 2024, however, wages rose more than prices, and in conjunction with lower interest rates, contributed to growth picking up somewhat among European trading partners from the previous year. At the same time, US growth remained markedly higher (Chart 1.2).
Norwegian mainland GDP growth in 2024 was lower than in 2023 and lower than growth among our main trading partners (Chart 1.2). In Norway, growth has been dampened by the unchanged policy rate, but GDP figures also reflect more random fluctuations. Mainland GDP fell by 0.4% in 2024 Q4, before rising by 1.0% in 2025 Q1, which was higher than projected in the March Report. Reports from Norges Bank’s Regional Network contacts point to somewhat steadier growth in the same period. Overall, contacts report higher activity levels since summer 2024, but reports indicate that growth has picked up somewhat into 2025. Contacts expect growth to hold firm through summer.
At the same time, data indicate a clear upswing in household demand in 2025 Q1. Private consumption rose by 1.5% from the previous quarter and housing investment also picked up a little, after falling by around 40% since the beginning of 2022.
On the other hand, demand components that have shown relatively strong growth in recent years were weaker in 2025 Q1. Both public demand and investment on the Norwegian continental shelf fell from 2024 Q4, while exports were little changed.
Labour market and the output gap
Employment recovered rapidly following the pandemic, but the rise in employment has also softened in line with slower economic growth. Since 2022, the employment rate has edged down (Chart 1.3). However, population growth was unusually high in this period. Ukrainian refugees have accounted for much of the growth, and as in previous refugee waves into Norway, few refugees have directly entered the labour market. Since the previous Report, employment has evolved as projected.
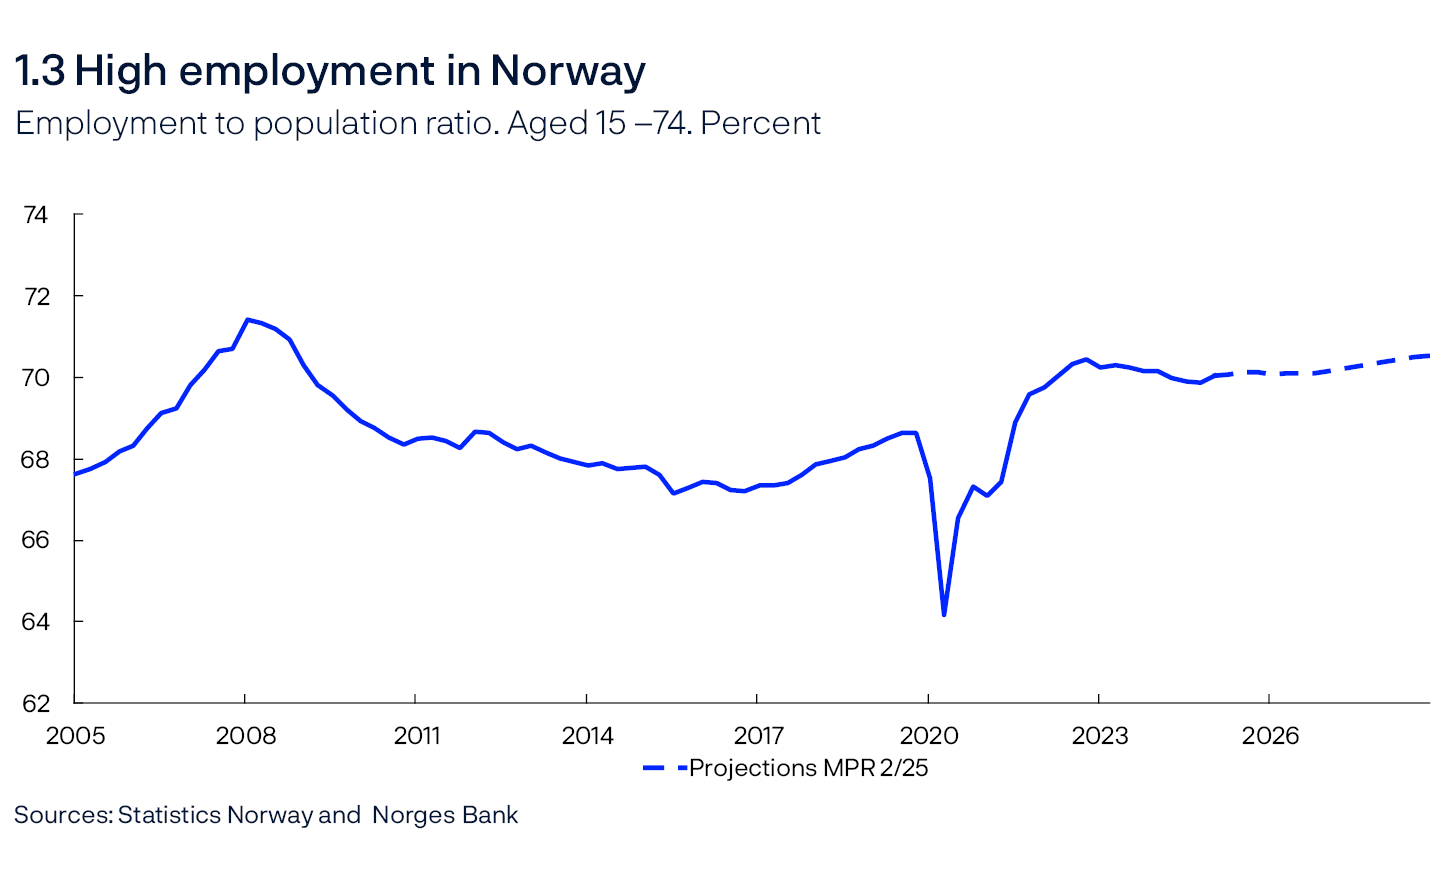
At the same time, registered unemployment has increased and been somewhat higher than assumed in March. In May, seasonally adjusted registered unemployment was 2.1%. Unemployment is now 0.5 percentage point higher than its trough in summer 2022.
Even though the labour market has loosened somewhat in recent years, wage growth has picked up. In 2024, annual wage growth was 5.6%, the highest level since 2008. As in the March Report, annual wage growth is projected to slow to 4.5% in 2025.
The output gap is assessed to have declined somewhat through 2023, but output is estimated to have remained close to potential since the start of 2024. The output gap estimate is slightly lower than in the March Report. In the assessment, particular weight is given to the rise in unemployment, which indicates that there may be a little more spare capacity in the Norwegian economy than previously assumed.
Global economic outlook
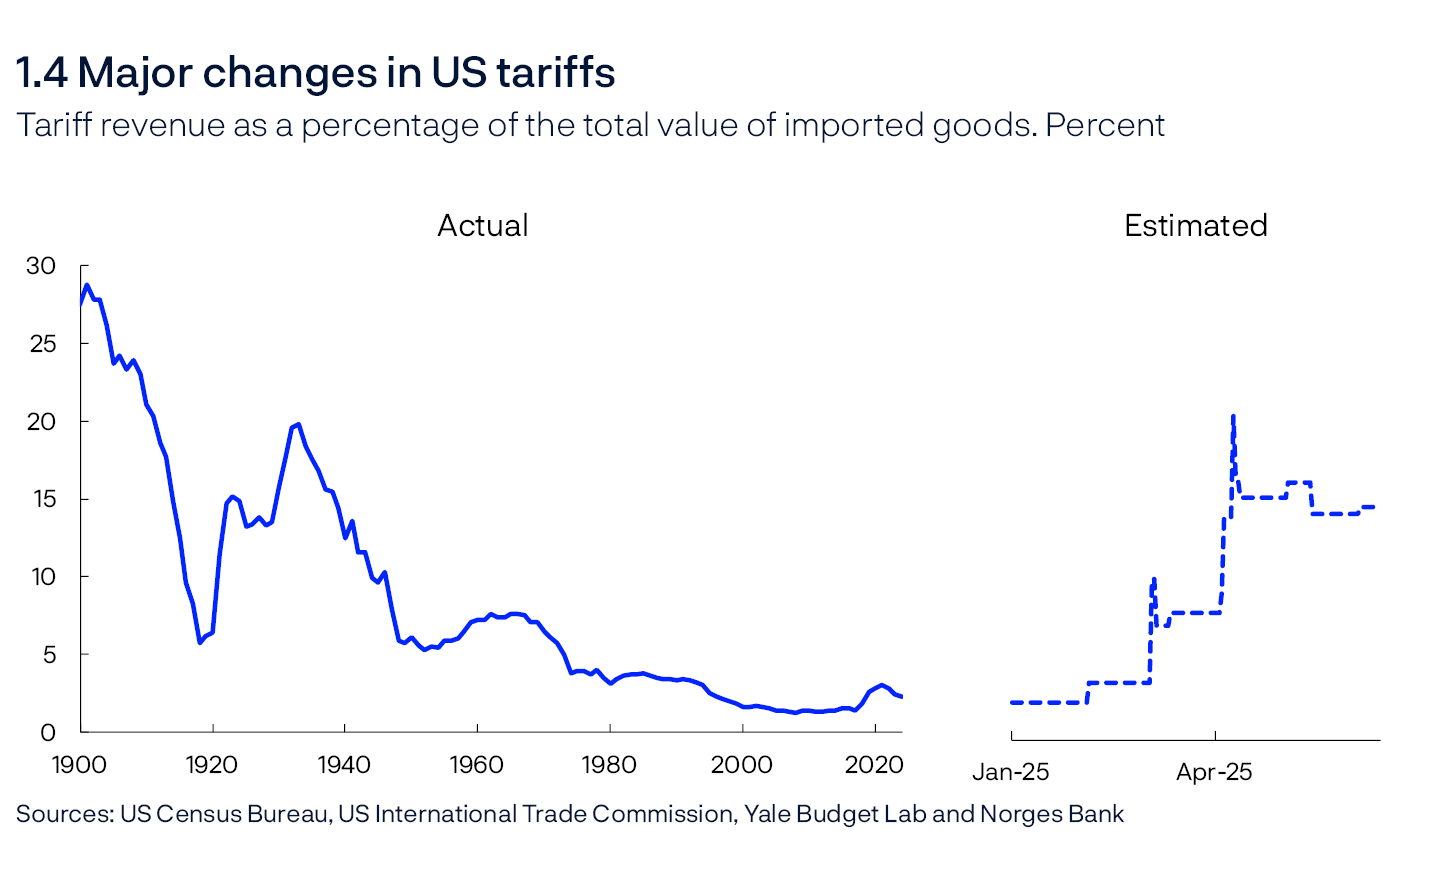
The global economic outlook is marked by substantial shifts in US policy since the new US president took office in January this year. Not least, US tariffs were raised markedly, a number of which have been postponed pending trade negotiations, but US tariff rates are nevertheless now at their highest level since the interwar period (Chart 1.4). At the same time, there is considerable uncertainty surrounding tariff developments ahead.
US policy changes have contributed to considerable financial market volatility. Equity markets fell substantially in early April in response to the tariff announcements, but markets have since recovered. Policy rate expectations have fallen across European countries, and both the Bank of England and the European Central Bank (ECB) have reduced rates further at their most recent meetings. The Federal Reserve policy rate was reduced towards the end of 2024 but has been kept unchanged so far in 2025. US policy rate expectations have changed little since March, but the US dollar has nevertheless depreciated against many other currencies, including the Norwegian krone. The krone depreciated notably during the market turbulence in early April but has since recovered. Oil prices have risen amid the military strikes between Israel and Iran in recent days, and the Norwegian krone has appreciated further. Measured against a broad basket of other currencies, the Norwegian krone is now somewhat stronger than at the time of the monetary policy meeting in March.
Owing in part to higher tariffs and trade policy uncertainty, the projections for growth among trading partners in 2025 and in the period ahead have been revised down somewhat since the previous Report. A number of other economic forecasting institutions have also revised down their forecasts for this period. In the Bank’s projections, US growth slows sharply, while Chinese growth also declines. At the same time, growth in European countries picks up somewhat, partly reflecting increased defence spending, but the projections are nevertheless somewhat lower than in March.
Monetary policy in Norway
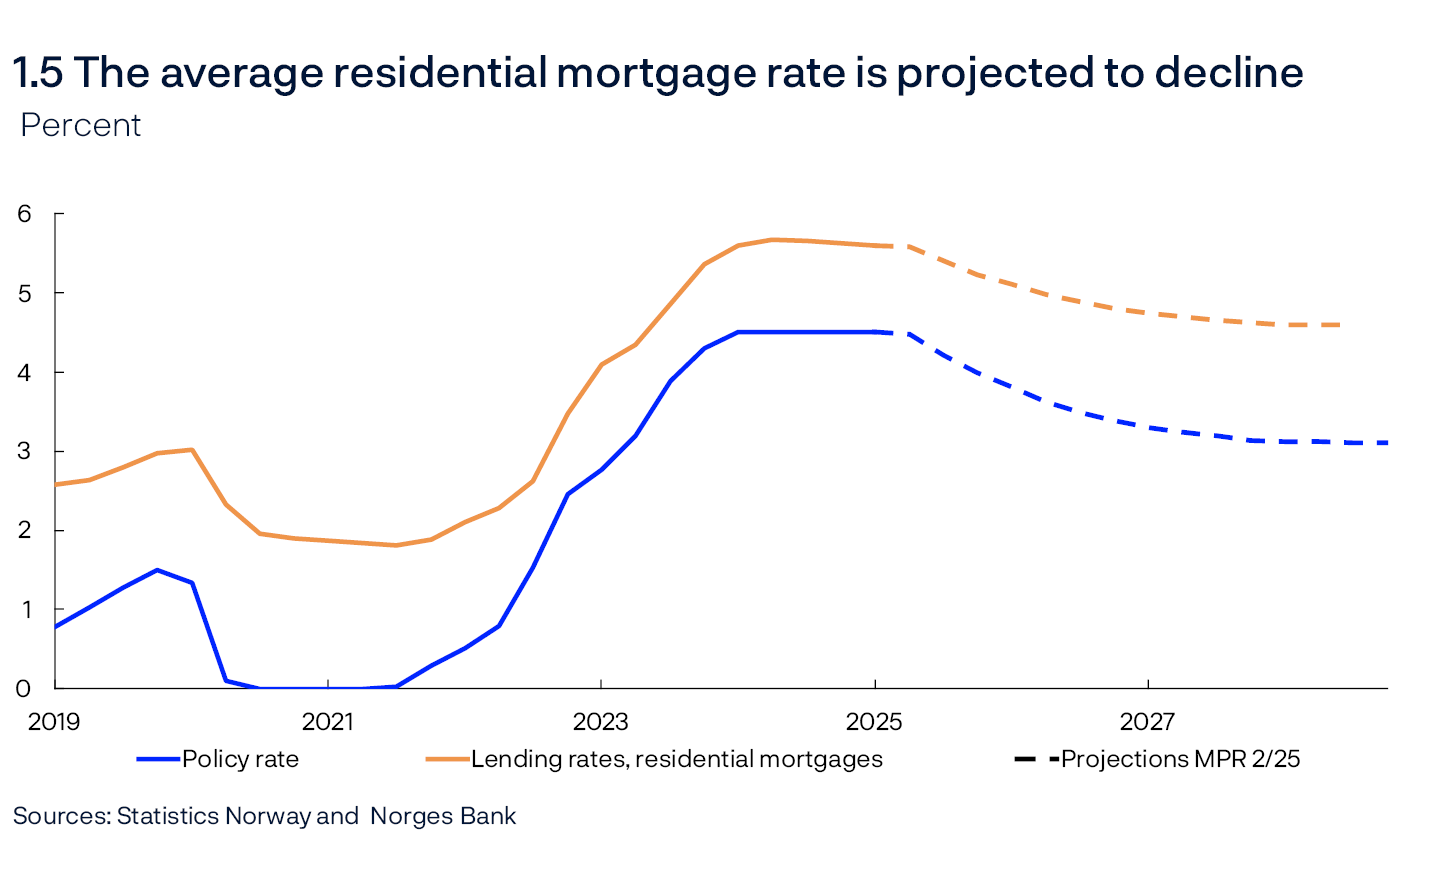
The policy rate was raised significantly to tackle high inflation and has stood at 4.5% since December 2023. The interest rate has contributed to cooling down the Norwegian economy and to dampening inflation. At this monetary policy meeting, Norges Bank’s Monetary Policy and Financial Stability Committee decided to reduce the policy rate from 4.5% to 4.25%. The policy rate forecast in this Report declines to just below 4% at the end of 2025 and to about 3% towards the end of 2028. If the economy evolves as projected in this Report and the policy rate is reduced in line with the forecast, the average residential mortgage rate is expected to decline from 5.6% at present to 4.6% in 2028 (Chart 1.5). The average residential mortgage rate is projected to decrease somewhat less than the policy rate ahead, partly because the increase in the mortgage rate was also somewhat smaller when the policy rate was raised.
The economic outlook in Norway
Mainland economic growth in 2025 is expected to be markedly higher than in 2024. In the projections, growth is somewhat lower in the coming years, albeit higher than in 2023 and 2024. Household real disposable income rises further following a marked rise in 2024, supported by continued real wage growth and lower interest rates. While the saving ratio is expected to fall somewhat from 2024 to 2025, it is however expected to increase in the coming years. Consumption is therefore expected to increase further but not as quickly as in 2025.
In the projections, oil investment also starts to decline as ongoing development projects are completed, and export growth is dampened by less traction from the past krone depreciation. US tariff increases also dampen exports, and uncertainty regarding US policy ahead may weigh down on investment, but these effects are assessed to be limited for Norway. Overall, business investment has been revised up from the March Report, reflecting among other things prospects for a substantial increase in power sector investment.
Housing investment is also projected to pick up markedly ahead but to a level at the end of 2028 that is still clearly lower than in the pre-pandemic period. The rise in prices for existing homes has picked up, which increases the profitability of housing starts. House price inflation has been somewhat lower than assumed in the March Report but is expected to increase again as interest rates move down.
Employment is projected to continue to rise, but slightly less than the labour supply, resulting in a slight increase in unemployment. Registered unemployment is projected to rise to 2.2%, broadly in line with pre-pandemic levels (Chart 1.6).
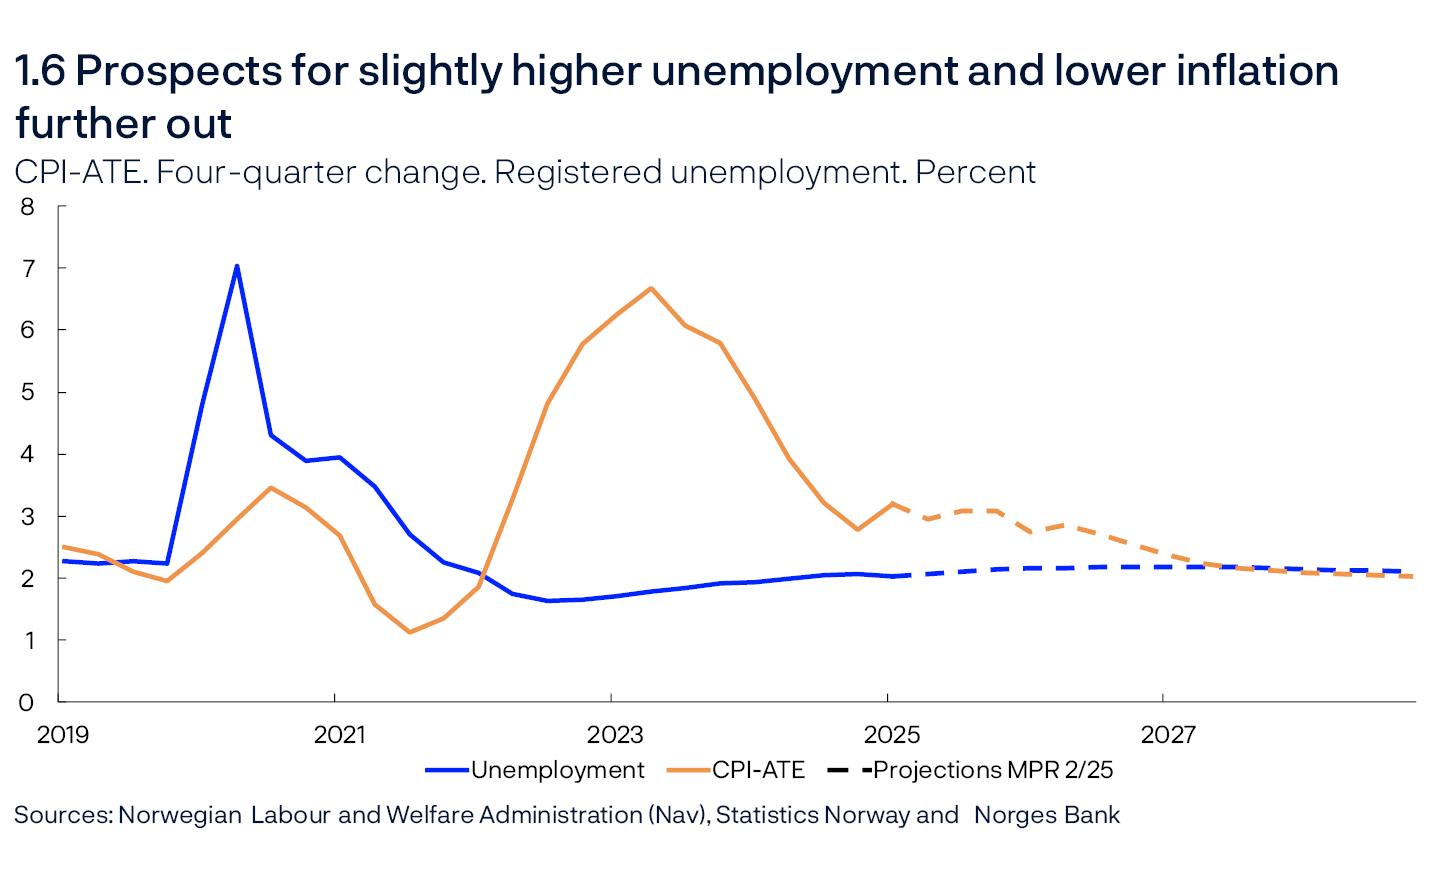
In the projections, inflation picks up somewhat through the remainder of the year, primarily reflecting the base effect stemming from the reduction in childcare prices in August 2024 dropping out of four-quarter inflation. A new reduction in childcare prices from August 2025 first became known after the projections were made. Into 2026 and in the period ahead, inflation is projected to slow, reflecting expectations that productivity growth edges up while wage growth drifts down, dampening growth in business costs. Imported goods inflation has declined substantially and has been lower than projected. Among other things, a number of commodity prices have declined, which may reflect ongoing trade tensions. Beyond this, the higher international tariffs are not assumed to have a material impact on inflation in Norway. Overall, this results in prospects for gradual disinflation towards the 2% target (Chart 1.6). Norges Bank’s Expectations Survey indicates that long-term inflation expectations remain slightly above 2% but have declined since the start of 2024 and are now at about the same level as in 2020 and 2021.
Uncertainty and risk
Economic forecasts are uncertain, and not least, the uncertainty surrounding international trade policies is substantial. Several of the US announced tariff hikes have been put on hold while negotiations are ongoing, and should the negotiations fail, a number of countries are likely to respond with counter-measures. There is therefore a risk of more extensive trade restrictions than assumed in this Report. If so, economic activity in Norway and among Norway’s main trading partners is likely to be lower than currently projected. Higher tariffs could push up inflation in tariff-imposing countries, but the Norwegian government has announced that it will not respond to US measures. In sum, the effects of higher tariffs in other countries on inflation in Norway is unclear.
On the other hand, should US negotiations succeed, tariff rates could be lower than currently assumed. If so, economic activity is also likely to be higher than currently projected.
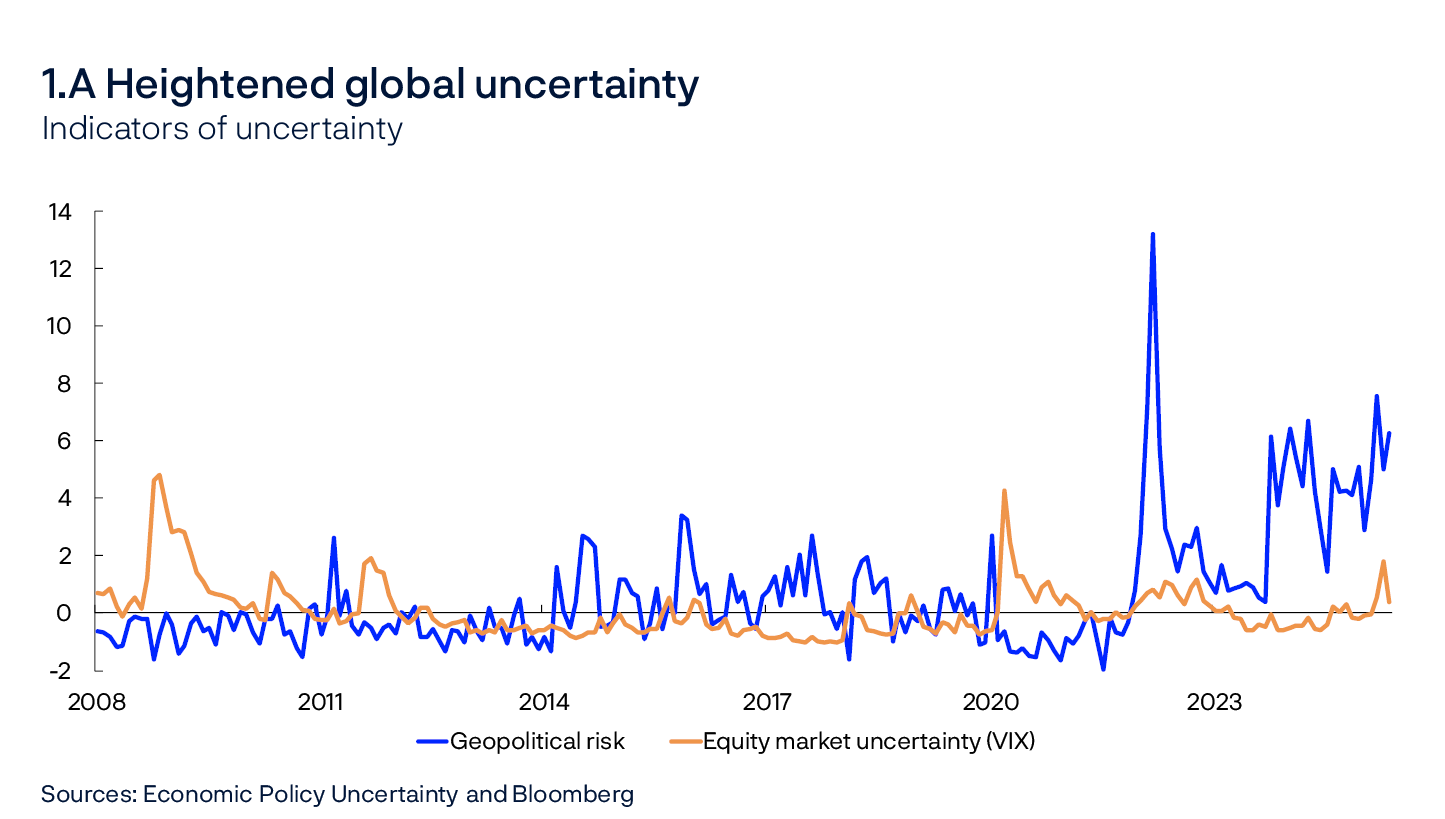
Uncertainty can in itself influence economic developments. Firms may postpone investments and hiring, and households may become more reluctant to spend. There has been a lot of uncertainty about trade policy in recent months, but a number of ongoing military conflicts and heightened tensions between countries are factors behind the current geopolitical uncertainty indicators also being at a high level (Chart 1.A1). A number of studies have concluded that higher uncertainty, as captured by text-based measures such as these, results in lower economic growth, but causal relationships are difficult to identify in such studies. For example, higher uncertainty will often have an impact on financial markets, and although markets have fluctuated in recent months, major equity indices are at about the same level or higher than at the start of the year. Any uncertainty-related economic consequences will also likely be reflected in data sources, such as business and household surveys, which are given considerable weight in the forecasting work. In the latest Regional Network survey, in response to special topic questions, only a few contacts reported to have revised down their investment plans due to higher tariffs. The projections in this Report are based on the fact that the high level of uncertainty observed will not in itself significantly dampen economic activity in Norway. If the uncertainty-related effects are underestimated, activity could prove to be lower than currently assumed.
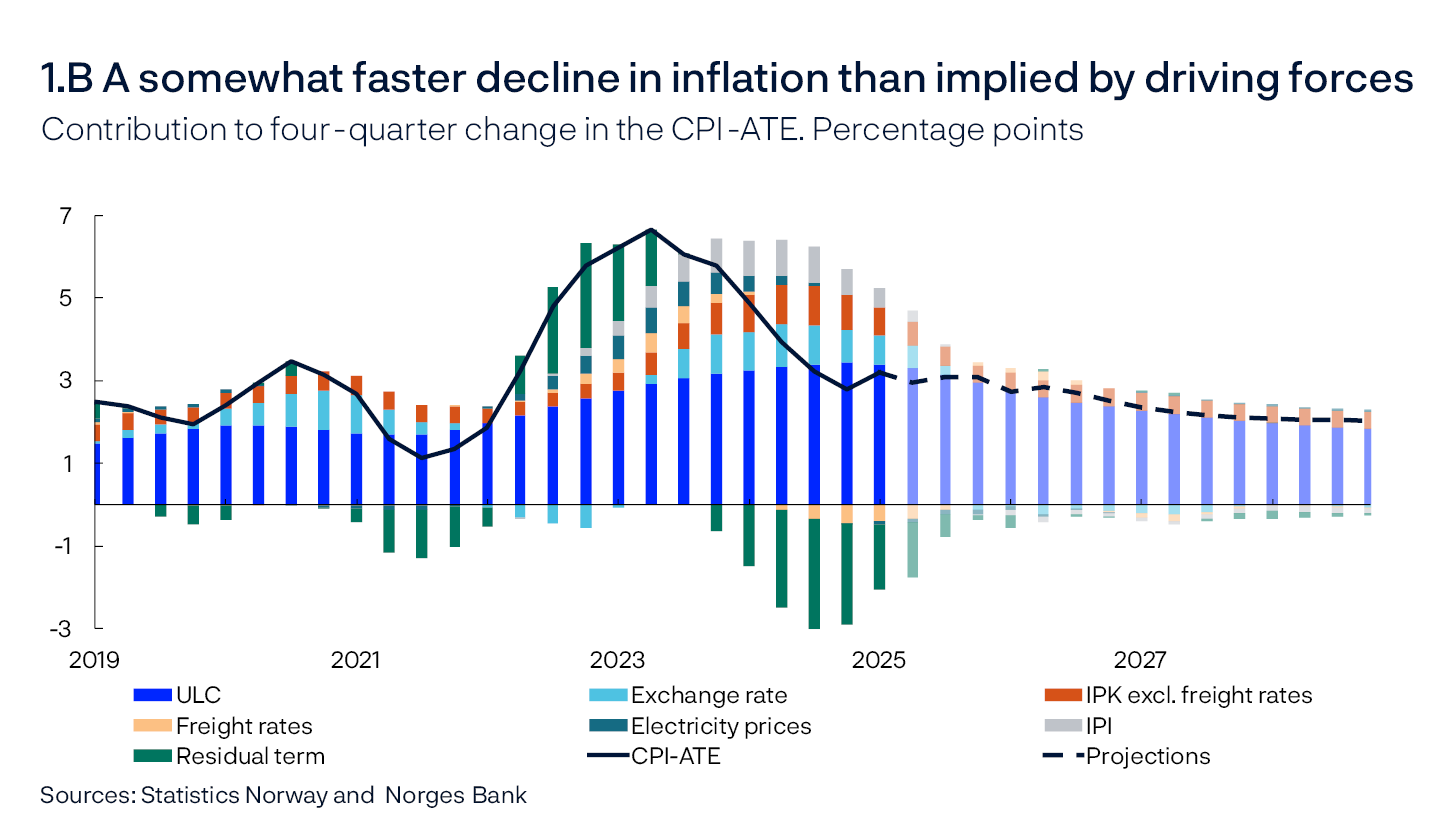
The domestic outlook is also uncertain. In Norway, disinflation was faster than projected through 2024, and underlying inflation has also been somewhat lower than projected in the previous Report. Although the gap has narrowed somewhat recently, inflation has been lower for some time than implied by the historical relationships between inflation and, for example, wage growth (Chart 1.B). Inflation developments are assumed to be more consistent with those implied by the historical relationships ahead, but if the recent deviation has been due to relationships differing from those assumed, inflation may also turn out to be lower than projected.
At the same time, there are domestic conditions that may imply that inflation will not slow as currently projected. A main reason why inflation moves down to 2% in the Bank’s projections is that wage growth is assumed to decline from 5.6% in 2024 to 3.3% in 2028. Continued high manufacturing profitability may, however, contribute to higher wage growth ahead than currently assumed, and this may again lead to higher inflation than currently projected.
- 1 The index for geopolitical risk is built on Caldara, D. and M. Iacoviello (2022) “Measuring Geopolitical Risk”, American Economic Review. 112 (4), pages 1194-1225. Data is available at Geopolitical Risk (GPR) Index.
2. Assumptions and projections
This chapter presents the key assumptions and projections underlying the interest rate decision and the monetary policy analysis. It also describes how new data, analyses, and assessments have influenced the projections since the previous Report. The projection period in this Report is from 2025 Q2 to 2028 Q4. The underlying data is available in an independent dataset that is published separately.
International economy
High inflation and rapidly increasing policy rates dampened economic activity among Norway’s main trading partners in 2023. In 2024, real wages rose while a number of countries lowered policy rates, boosting economic growth, particularly in Europe. In the past couple of years, growth in the US has nevertheless been appreciably higher than in Europe. In 2025 Q1, however, growth was stronger in the euro area, UK and China, while both the US and Sweden experienced a minor downturn. On the whole, growth was broadly as projected in the March 2025 Monetary Policy Report.
So far in 2025, the global economy has been marked by considerable uncertainty related to changes in global trade policy. In early April, the US announced extensive tariff increases on imports from almost all countries, and some countries have responded with counter-measures. In the days that followed the announcement, equity markets declined sharply, credit premiums rose, the US dollar depreciated and policy rate expectations fell.
However, the market movements were largely reversed when a pause on the higher tariff rates was announced. On the whole, global equity indices are slightly higher, while credit premiums have shown little change since the March Report. An important exception is the US dollar, which remains weaker.
The European Central Bank (ECB) and the Bank of England have lowered policy rates since the March Report, while Sveriges Riksbank and the Federal Reserve have left policy rates unchanged. A number of central banks have expressed concern about the effects of global trade policy changes, and policy rate expectations are now generally somewhat lower than they were in March. One exception is the US, where expectations are little changed, likely reflecting the fact that prospects for higher inflation counteract lower growth expectations.
Long-term US interest rates have risen since the March Report, while corresponding rates in other countries have fallen slightly. The differential partly reflects diverging developments in policy rate expectations. Together with heightened uncertainty surrounding the outlook for US growth and inflation, prospects for continued substantial budget deficits may have prompted investors to demand higher yields on US government securities.
Overall GDP growth among trading partners is projected to remain broadly unchanged in 2025 compared with 2024 and to rise slightly in 2026, which is expected to stimulate the Norwegian economy. The overall growth projection for trading partners in 2025 and to the end of 2027 has been revised down slightly since March. The downward revisions of the projections for the US and Sweden have been particularly pronounced since the March Report. The projections are based on the following:
- Global trade policy uncertainty is likely to dampen global growth ahead. In the projections, the tariffs that were in effect on 13 June are assumed to apply. This means that effective US import tariffs have almost doubled since March.
- In the euro area, higher real wages, interest rate reductions and increased defence and infrastructure investment are expected to boost activity, while trade policy uncertainty is likely to dampen demand. GDP growth in the euro area is expected to rise ahead.
- In Sweden, a recovery is expected to take somewhat longer owing to sluggish global growth and higher trade barriers. At the same time, higher real wage growth and a more accommodative economic policy contribute to lifting activity further out.
- In the US, lower household income growth, reduced immigration and higher tariffs are expected to dampen GDP growth.
- In China, government stimulus measures are expected to lift activity, while higher tariffs on goods trade, a shrinking labour force, high local government debt and highly indebted state-owned firms are expected to dampen growth ahead.
Headline CPI inflation among Norway’s trading partners has declined substantially since the peak in 2022 and has recently been close to the 2% targets in a number of countries. On the whole, core disinflation among Norway’s main trading partners has slowed, but core inflation is expected to drift down towards the targets ahead. The projections are based on the following:
- Both expectation surveys and market-based measures indicate higher near-term US inflation, and higher tariffs are expected to push US inflation higher in 2025 and 2026 than assumed in March.
- The impact of higher tariffs on European countries is assumed to be limited, but the effect i still uncertain. Indicators of short-term inflation expectations in Europe have fallen in recent months.
- Wage growth is expected to decline markedly between 2024 and 2025.
Overall, inflation among Norway’s main trading partners is little changed in 2025. The projection for 2026 has been revised up slightly owing to prospects for higher US inflation.
Energy prices
Oil prices have fallen in recent years, from over USD 100 per barrel in summer 2022 to currently around USD 75. Since the March 2025 Monetary Policy Report, oil prices have been broadly as implied by futures prices (see Table 2.A). The combination of a weaker global economic outlook and higher OPEC+ production pushed down oil prices in the period to June, but the military strikes between Israel and Iran in recent days have pushed prices up again.
Table 2.A Energy prices
|
Percentage change from projectionsin Monetary Policy Report 1/2025 in brackets |
Average price (2010–2019) |
Realised prices and futures prices1 |
|||||
|---|---|---|---|---|---|---|---|
|
2023 |
2024 |
2025 |
2026 |
2027 |
2028 |
||
|
Oil, USD/barrel |
80 |
83 |
80 |
72 (0) |
69 (1) |
68 (1) |
68 (2) |
|
Dutch gas, EUR/MWh |
20 |
41 |
34 |
40 (-9) |
36 (1) |
31 (6) |
27 (3) |
|
German electricity, EUR/MWh |
42 |
102 |
90 |
96 (-1) |
92 (6) |
83 (8) |
73 (4) |
|
Electricity in southern Norway, øre/kWh |
31 |
84 |
55 |
71 (26) |
60 (8) |
56 (1) |
56 (0) |
|
Electricity in northern Norway, øre/kWh |
32 |
43 |
32 |
21 (15) |
30 (1) |
34 (1) |
37 (0) |
European gas prices rose through 2024 and into 2025 but have been considerably lower than in previous years. Compared to earlier in 2025, prices have fallen back, and have continued to fall since March, but with some reversal in recent days due to the escalating conflict between Israel and Iran. The EU’s aim of reducing dependence on Russian gas may have slowed the fall in prices. From 2026, futures prices show a further decline, which may reflect higher expected global LNG supply.
Electricity prices in Europe rose through 2024 and into 2025 but are lower than in the period between 2021 and 2023. Electricity prices in southern Norway also rose but were lower than in Europe, reflecting considerable precipitation and high reservoir levels in 2024. Since March, electricity prices in Europe have declined somewhat, while prices in southern Norway have been higher than expected. This reflects a dry spring and little snow in the mountains in 2025, which is now providing less reservoir inflow. Prices have risen in northern Norway but are also still low owing to high reservoir levels and ample snow in the mountains.
- 1 Futures prices at 13 June 2025.
Sources: LSEG Datastream and Norges Bank
Norwegian mainland GDP
Following a rapid post-pandemic recovery, growth in the Norwegian economy has moderated. Higher interest rates and high cost and price inflation have dampened demand in the Norwegian economy, in part by reducing investment and curbing growth in household consumption. On the other hand, the krone depreciation up to summer 2023 contributed to strong export growth. An expansionary fiscal policy and strong petroleum investment have also lifted activity in recent years. For 2024 as a whole, mainland economic growth was weak.
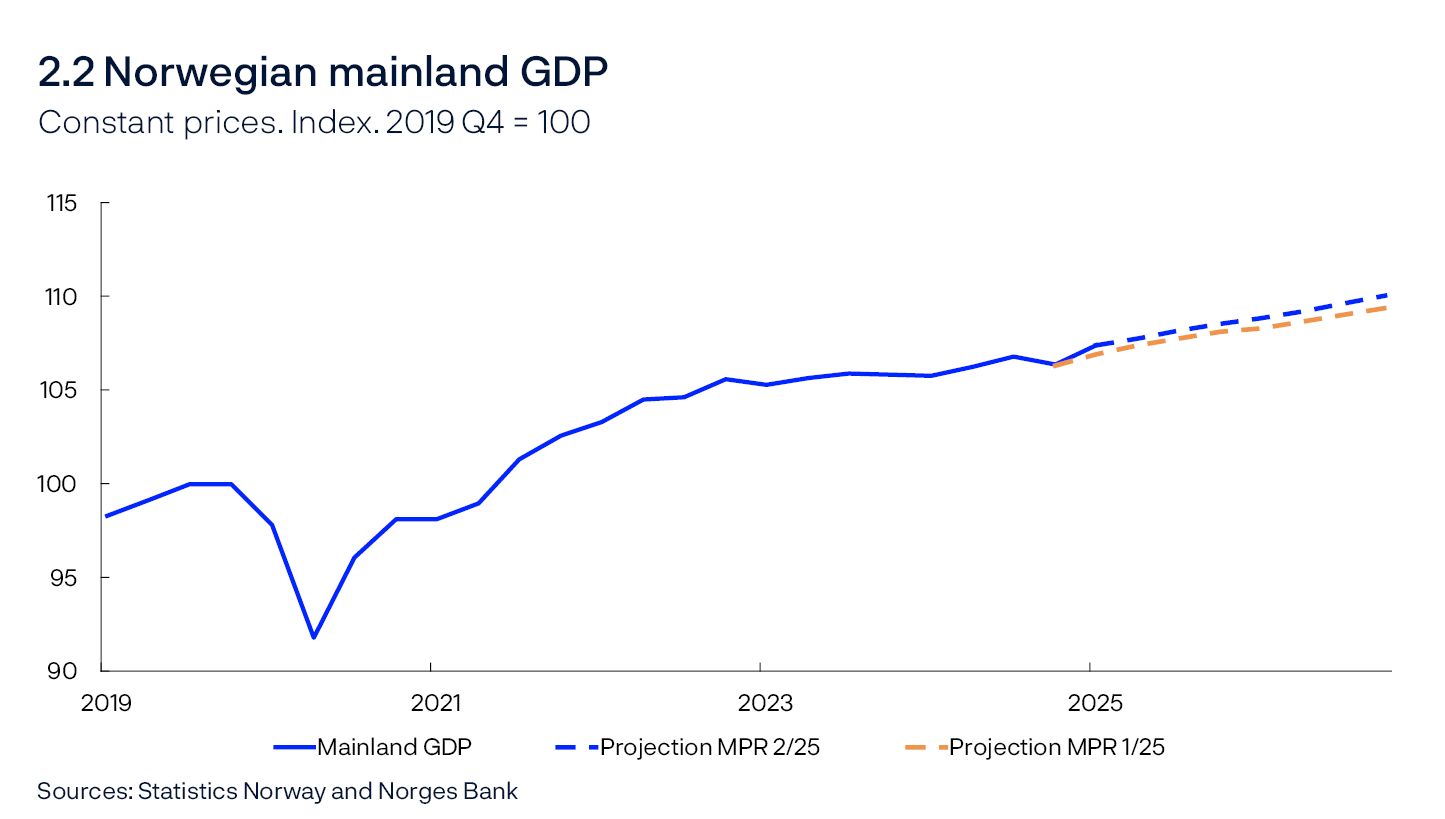
After falling in 2024 Q4, Norwegian mainland GDP increased in 2025 Q1 (Chart 2.2). The increase was stronger than projected, but growth in the next quarters is expected to be moderate, broadly in line with that projected in the previous Report. The projections are based on the following:
- Regional Network contacts expect growth in activity in Q2 to be in line with that expected in the previous survey and to hold steady in Q3 (Chart 2.3, left panel). Construction contacts expect production to stop falling in Q3, while oil services contacts expect weaker growth in production ahead.
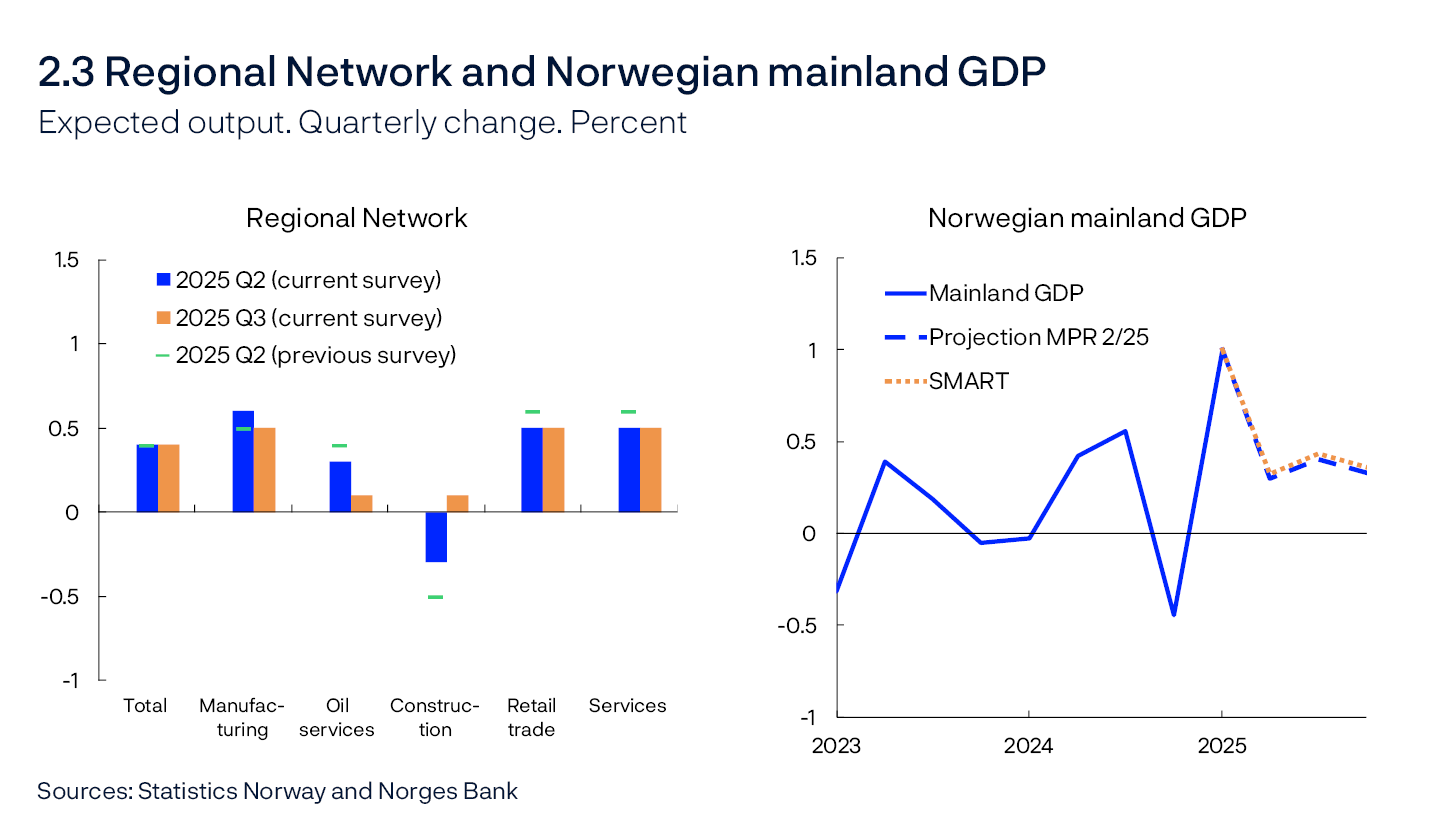
- According to Norges Bank’s forecasting system SMART, which weights forecasts from a broad set of models, growth is forecast to be moderate in the coming quarters (Chart 2.3, right panel).
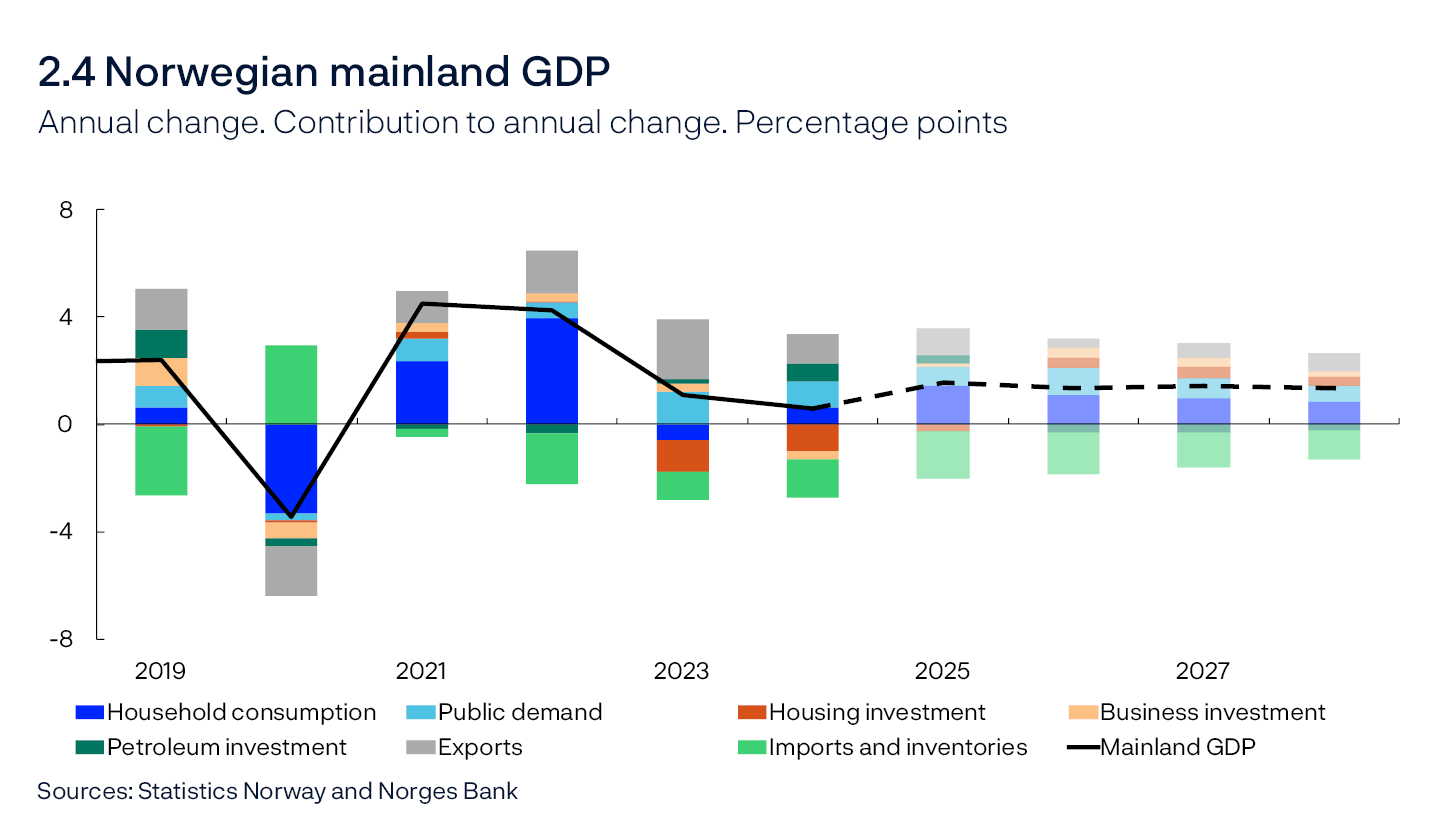
Norwegian mainland GDP growth is projected to be 1.6% in 2025, before declining to 1.4% in 2026 and remaining stable to the end of the projection period (Chart 2.4). The projections are based on the following:
- High real wage growth contributes to lifting household consumption.
- Estimated real interest rates are expected to remain firm in the coming years, but lower nominal interest rates will, in isolation, contribute somewhat to higher private consumption and housing and business investment in the coming years.
- Norges Bank’s assessment is that the tariff increases imposed to date and the uncertainty about trade policies will have a limited direct effect on Norwegian goods exports and business investment.
- Growth in public sector demand is projected to remain strong next year, gradually easing thereafter.
- As ongoing development projects are completed, petroleum sector investment is expected to decline ahead.
Indicators of uncertainty surrounding point forecasts in the near and medium term
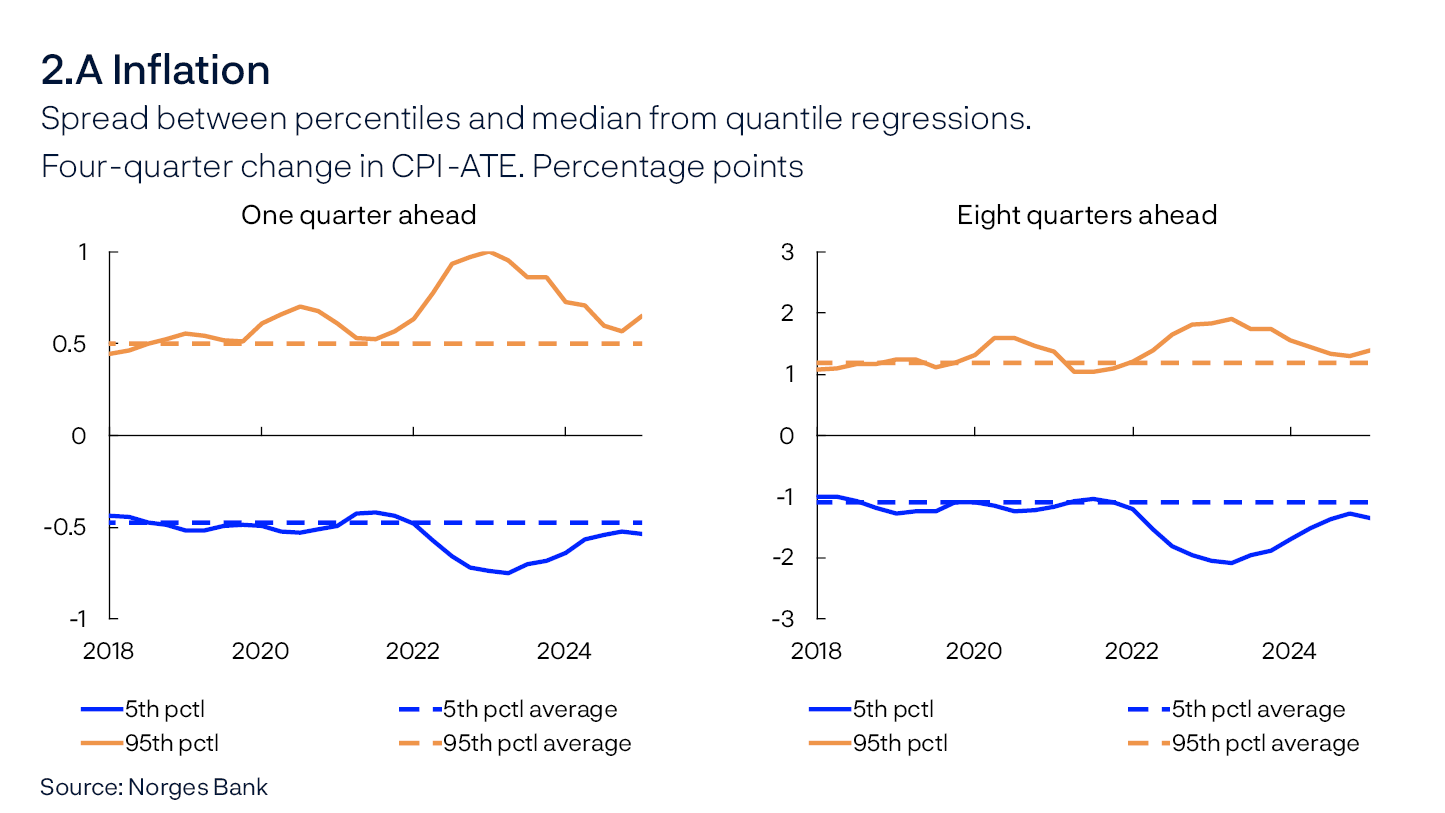
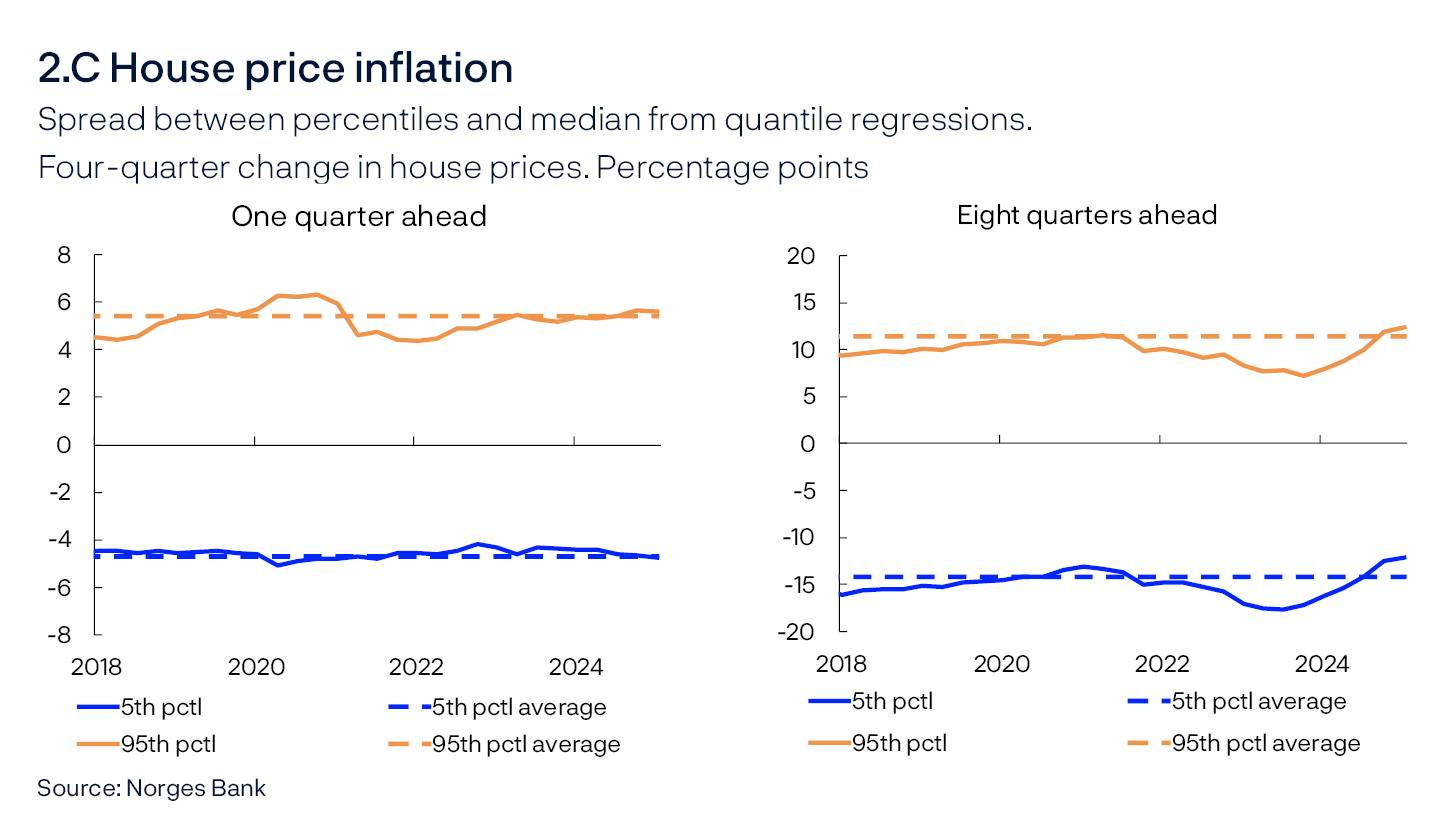
Economic forecasts will always be uncertain. The Bank’s uncertainty assessments use both judgement and model estimations. This box sheds light on uncertainty by using a model framework to quantify the risk linked to developments in three key macroeconomic variables: GPD for mainland Norway, consumer prices and house prices1.
The analysis is based on data for the period to 2025 Q1. The models estimate a distribution of forecasts of each of the variables, divided into percentiles. As a measure of risk, the difference between the median (50th percentile) and the endpoints (95th and 5th percentiles) is used. Wider spreads between the median and the endpoints indicate increased uncertainty. The charts show the changes in upside and downside risk across the different variables over time.
After having increased considerably in 2022, the risk of high inflation has decreased and approached its historical average (Chart 2.A). In 2025 Q1, the risk increased again slightly, particularly the near-term upside risk. Note that the inflation data for April and May 2025 are not included in the analysis.
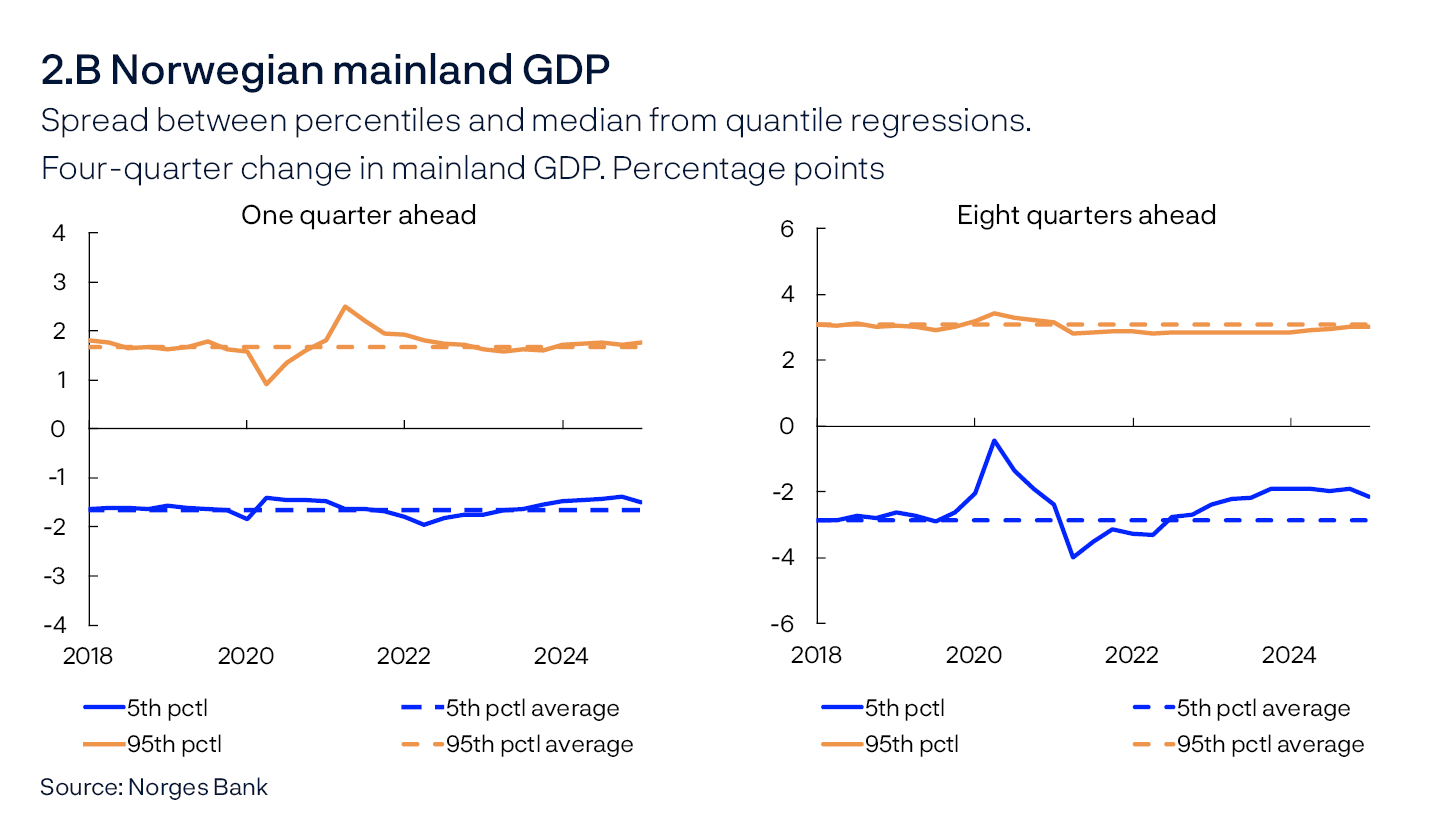
The models indicate that the near-term risk related to mainland GDP growth is close to its historical average (Chart 2.B). The medium-term downside risk is somewhat lower than the average for the 2010s (Chart 2.B, right panel).
In the near term, the risk related to house price inflation is close to its historical average (Chart 2.C, left panel). After having been higher than normal over a couple of years, the medium-term downside risk has recently receded again and is now lower than its historical average (Chart 2.C, right panel).
- 1 The models use quantile regressions, with different indicators to project output, house price inflation and consumer price inflation. See further description in Bowe, F., S.J. Kirkeby, I.H. Lindalen, K.A. Matsen, S.S. Meyer and Ø. Robstad (2023) “Quantifying macroeconomic uncertainty in Norway “. Staff Memo 13/2023. Norges Bank.
Households
In 2023, higher interest rates and high inflation reduced household purchasing power and contributed to a fall in consumption. In 2024, household real disposable income rose by 3.6%, the strongest growth in over a decade, and consumption picked up, but less so than income, resulting in an increase in the saving ratio.
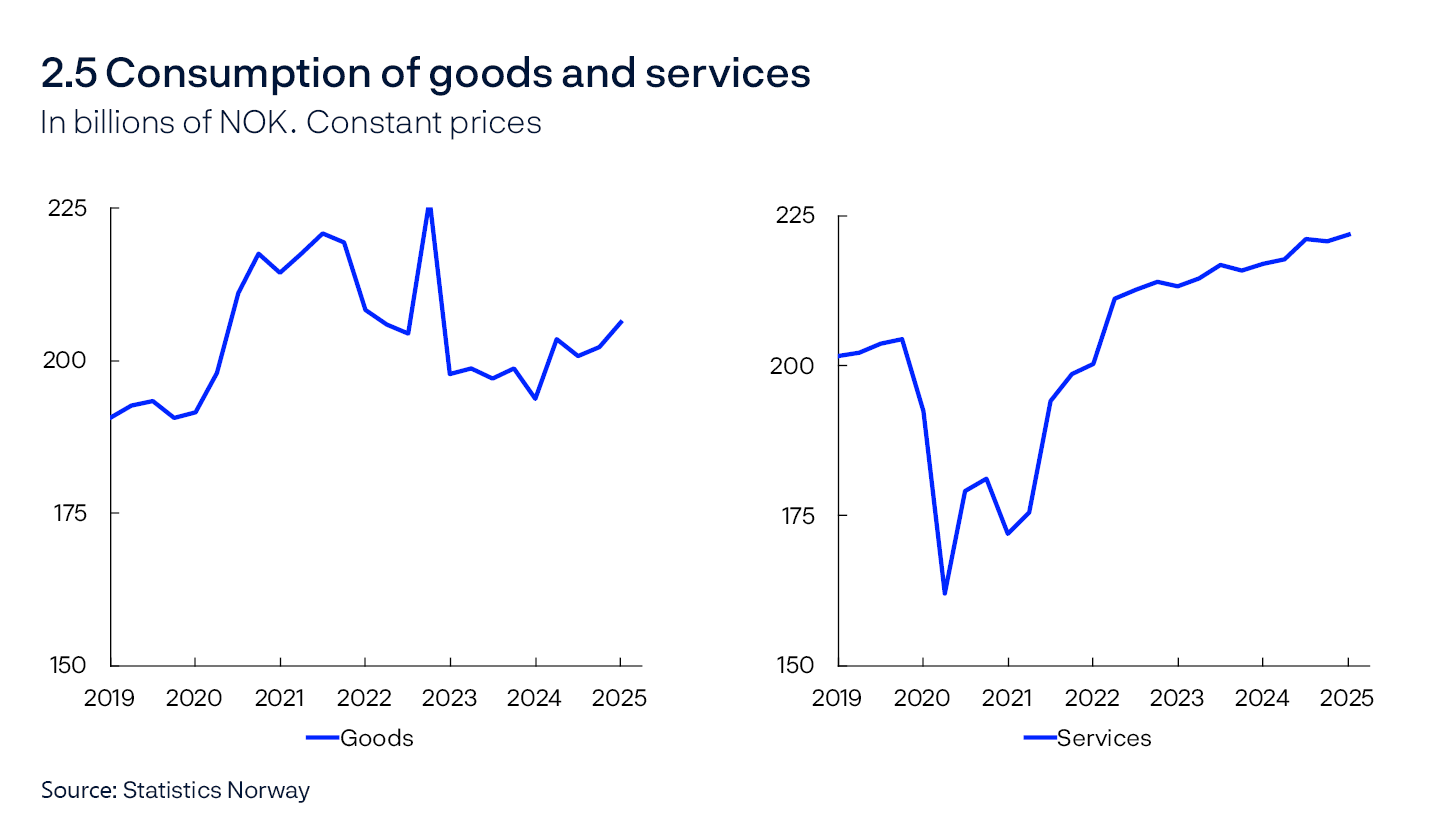
Consumption growth increased substantially in 2025 Q1 (Chart 2.5). Both goods and services consumption increased more than projected in the previous Report. Car, clothing and furniture sales in particular increased, but hotel and restaurant services also increased sharply. Annual consumption growth is projected at 2.9% in 2025 and to slow further out in the projection period. The projections are based on the following:
- Regional Network contacts in retail trade and household services report increased household demand particularly for durable goods such as cars and furniture. Further growth in retail trade and car purchases in recent months suggest continued goods consumption growth in 2025 Q2.
- New information indicates that government transfers and interest expenses together push up real disposable income more in 2025 than previously assumed.
- Real wage growth is projected to be high in the years ahead and then to slow towards the end of the projection period.
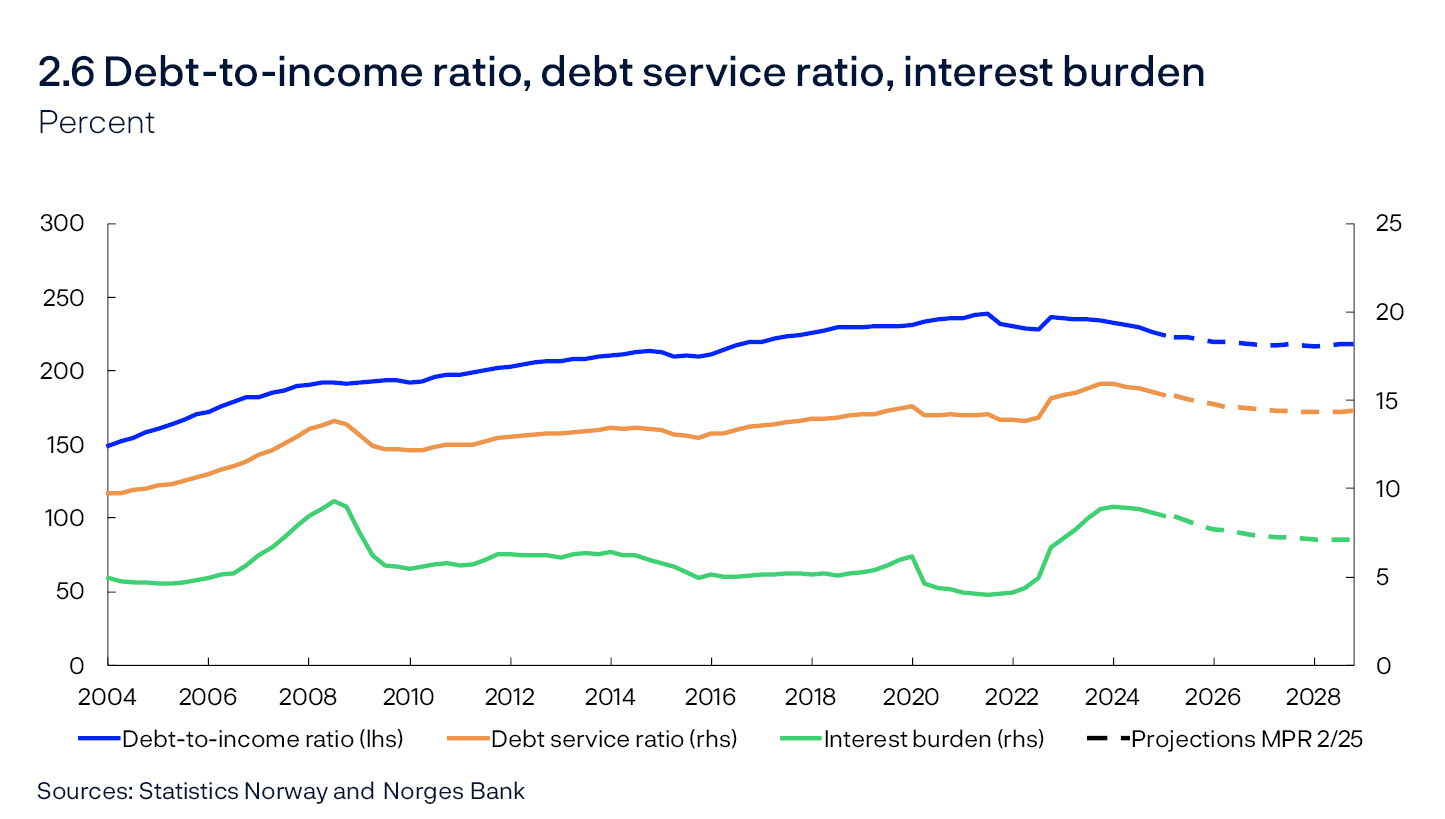
- Household debt growth has increased since spring 2024. Higher house prices and lower interest rates suggest higher debt growth ahead, while a low supply of new homes has a dampening effect. A rise in housing investment further out will pull up credit growth. Overall, a gradual increase in household debt growth is expected. Household income growth is expected to outpace credit growth somewhat, resulting in a slight decline in the debt-to-income ratio through the projection period (Chart 2.6). A lower policy rate will reduce the household interest burden in the coming years.
- Overall, household real disposable income growth is projected at 3.9% in 2025 and then to slow. Consumption growth is expected to moderate in line with slower income growth.
- The saving ratio adjusted for dividend income fell slightly at the start of 2025 after having increased in 2024. Increased pension saving dampened the decline. In the coming years, pension saving is expected to remain high and consumption to increase less than household disposable income. This means that the saving ratio will increase to its average level from the 2010s.
Projected levels of consumption and real disposable income have been revised up throughout the projection period compared with the March Report.
Housing market
Housing investment has fallen by around 40% since 2022, partly owing to higher interest rates and a sharp rise in material costs. In the previous Report, the decline in housing investment was expected to persist until after summer. However, housing investment increased in Q1 and is now projected to increase further ahead (Chart 2.7). Housing investment is assumed to increase gradually, but to a level in 2028 that is still lower than in 2022. The projections are based on the following:
- Housing investment has been higher than assumed in the previous Report, and new building permit figures indicate that growth will continue in Q2.
- Regional Network housing construction contacts report improved new home sales and higher project volumes. Overall, construction contacts expect weak growth in Q3. Other statistics, however, indicate somewhat weaker developments in new home sales than reported by Regional Network contacts.
- Increased household purchasing power is expected to lead to higher demand for both new and existing homes ahead.
- Lower interest rates help improve profitability in the construction sector and could lead to more projects coming to fruition.

Since the previous Report, projected levels of housing investment have been revised up for the entire projection period.
In 2024, prices in the secondary housing market increased by 3%. Housing prices rose sharply in January and February 2025. Higher turnover and the rise in prices for small flats in larger cities may indicate that some of the rapid rise at the start of the year was due to the regulatory easing of equity requirements for house purchases, which came into effect on 1 January. Since the previous Report, house prices have remained flat and weaker than assumed in March. The weaker rise in house prices may in part be attributable to the fact that the policy rate was not reduced in March. There are wide regional differences in house price inflation, and fluctuations in Oslo have been particularly strong since the beginning of the year.
House price inflation is projected to rise further in 2025 and 2026 before declining through the projection period. The projections are based on the following:
- Lower interest rates pull in the direction of higher house prices.
- More homes have recently been listed for sale than have been sold. In isolation, increased supply suggests weaker house price inflation. At the same time, housing market turnover remains elevated and selling times have shortened since the start of the year. This suggests continued high housing demand, which is underpinning prices. Overall, moderate house price inflation is expected ahead.
- Continued household income growth is expected to boost demand for homes in the coming years.
- Low supply of new homes in the coming years suggests higher house prices.
Since the March Report, house price projections have been revised down in the near term, while the projections further out in the forecast horizon are little changed.
Firms
In 2024, mainland business investment fell after having risen in the preceding years. The decline particularly reflects the substantial rise in interest and other expenses since 2021. Business investment is expected to show a moderate rise through the projection period (Chart 2.8). The projections are based on the following:
- Regional Network contacts report that higher trade barriers will have little impact on investment plans in 2025 and 2026.
- Estimated real interest rates are expected to remain firm in the coming years, but lower nominal interest rates will, in isolation, boost investment somewhat in the projection period.
- Information from Regional Network contacts indicates that services investment, which accounts for two-thirds of business investment, will decline somewhat in 2025 and increase slightly in 2026. In particular, investment in new commercial real estate falls in 2025.
- Power sector investment is expected to increase substantially ahead. The most recent investment intentions survey from Statistics Norway indicates strong growth in power investment in 2025 and 2026.
- According to the investment intentions survey, investment in manufacturing and mining and quarrying is likely to increase in 2025 and 2026. These investments have been unusually high in recent years, driven in part by the energy transition and defence investment. Similar conditions will likely underpin elevated investment in the period between 2026 and 2028.

Petroleum investment has increased markedly over the past two years, reflecting the launch of a number of development projects in 2022 in response to the petroleum tax package and high oil and gas prices. Petroleum investment is projected to rise further between 2024 and 2025, and then decline somewhat over the next three years. The projections are based on the following:
- Investment in ongoing development projects will fall from around NOK 110bn in 2025 to close to zero in 2028.
- Oil companies have announced that they will launch many development projects ahead. This will generate substantial investment, but not enough to fully compensate for the decline in ongoing development projects.
- The investment intentions survey indicates that oil companies will invest less in 2026 than in 2025, but that the fall will be less pronounced than projected in the March Report.
Mainland exports have expanded markedly since 2021, largely driven by stronger competitiveness, increased tourism in Norway and higher investment in oil, gas and green technology abroad. The same factors will underpin firm growth in exports in 2025. Export growth is projected to be moderate in the period between 2026 and 2028. The projections are based on the following:
- According to the Regional Network, Norwegian exporters expect firm growth in 2025 Q2 and Q3, and only a few of these expect that the increased tariffs introduced so far will dampen their production.
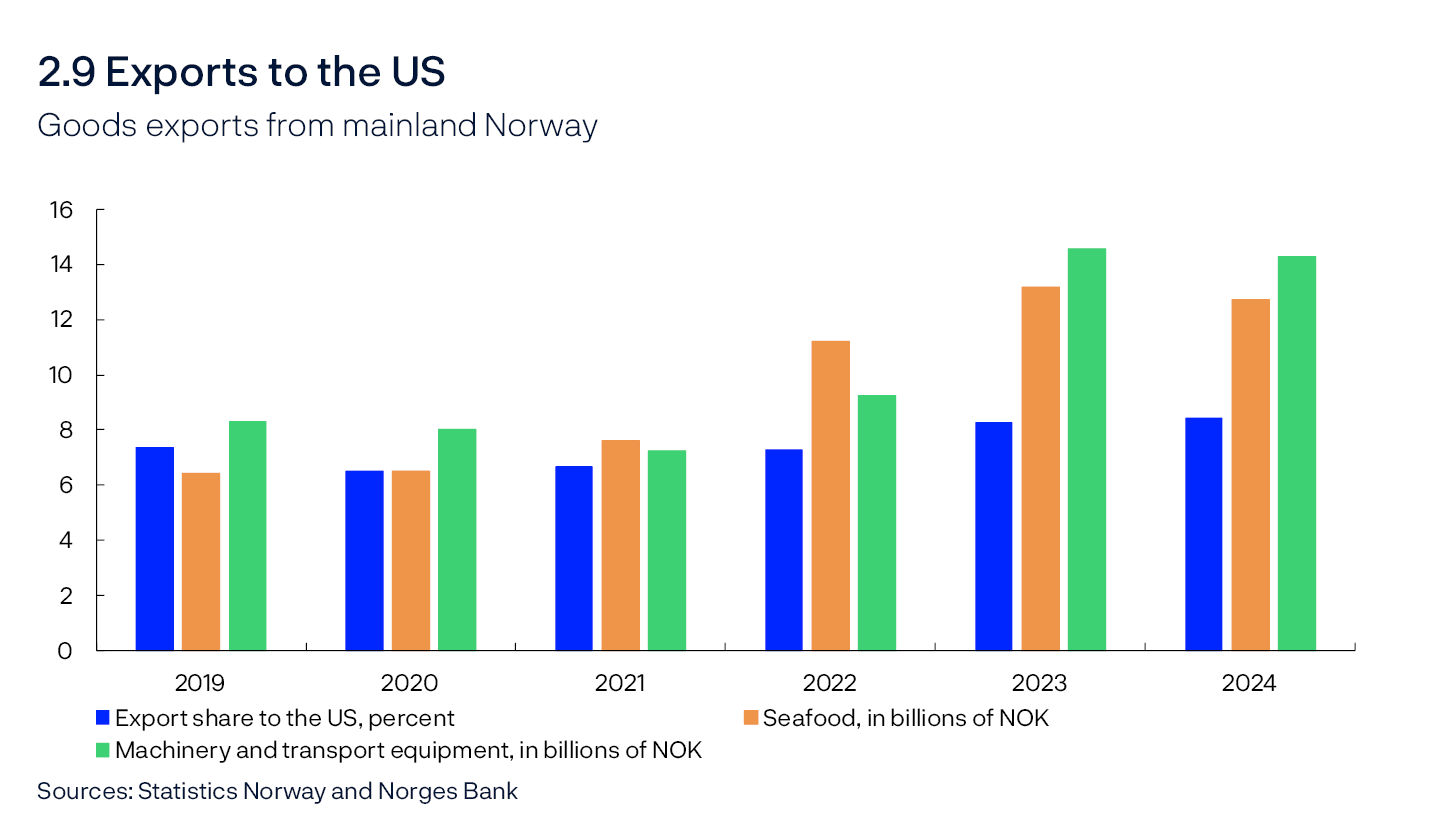
- Just above 8% of mainland goods exports are direct exports to the US (Chart 2.9). Salmon and specialised machinery to the offshore industry and other industry are among the main export goods. Supply side conditions determine to a great extent the quantity of seafood produced by Norwegian firms. If US demand were to fall, seafood exports could shift to other markets. The overall negative impact on Norwegian exports is therefore likely to be small.
- Trading-partner GDP growth is expected to pick up gradually over the coming years, but the growth projections have been revised down compared with the March Report.
- Global petroleum investment is likely to increase far less ahead than in the period between 2022 and 2024 and to dampen Norwegian export growth. Some of the decline may be offset by increased investment in green technology worldwide.
Fiscal policy
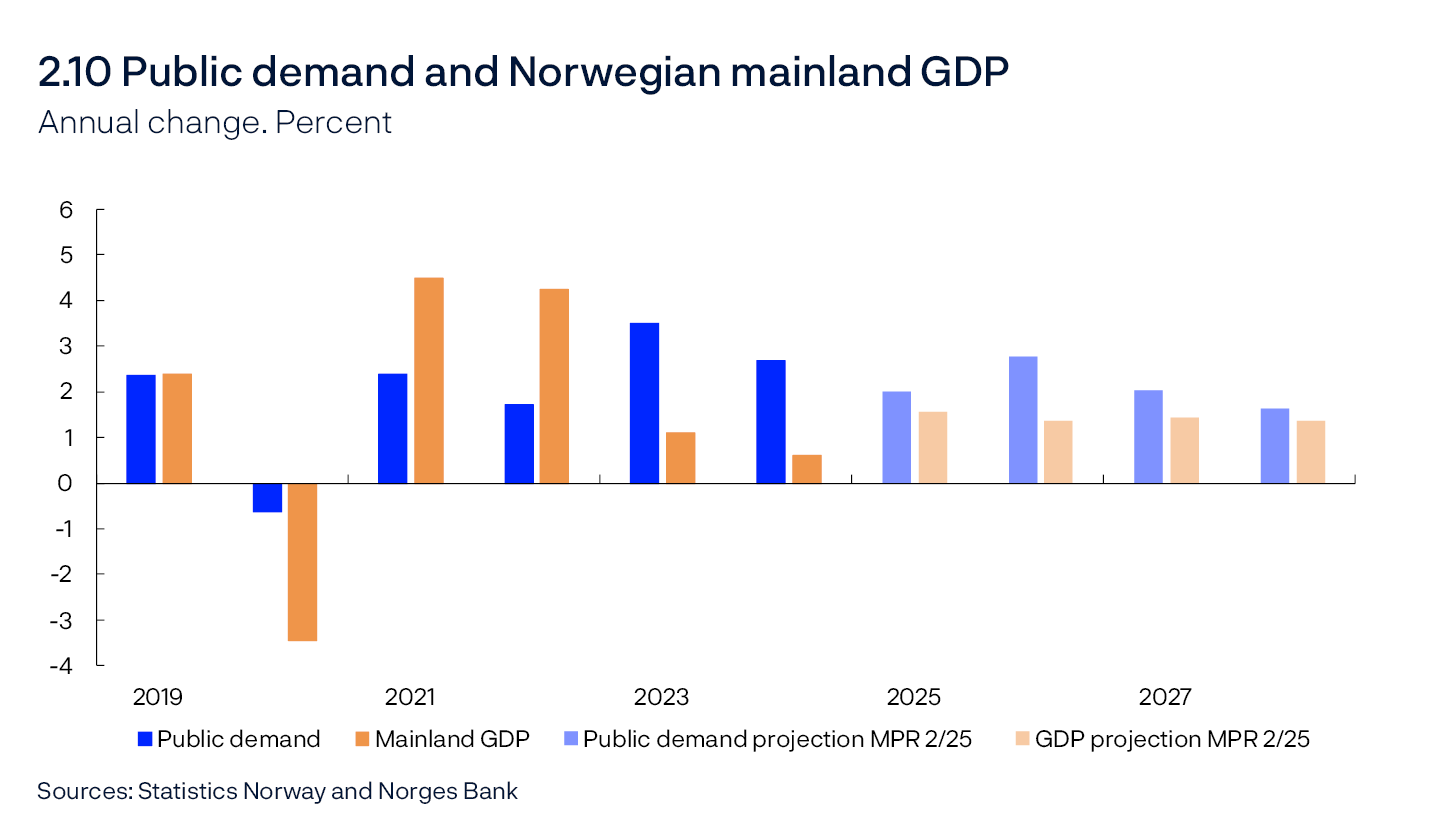
After strong growth in 2023, growth in public demand moderated in 2024. In the coming years, growth in public demand is expected to remain above mainland GDP growth (Chart 2.10). The projections are based on the following:
- Public demand fell between 2024 Q4 and 2025 Q1, primarily owing to a decline in public investment. The growth projection for 2025 has therefore been adjusted down from the March Report.
- Information on the expected level of public sector activity in the Revised National Budget (RNB) for 2025 implies further growth in public demand in 2025. Expected underlying growth in petroleum revenue spending in 2025 in the RNB is in line with that projected in the March Report.
- The structural non-oil budget deficit as a percentage of the Government Pension Fund Global (GPFG) will be close to 2.7% in 2025, broadly in line with that assumed in the March Report.
- Increased support to Ukraine accounts for some of the growth in government spending in 2025. This is expected to have little effect on domestic demand but will contribute to increasing the budget deficit.
- Increased defence spending is expected to lift growth in public demand through the projection period.
Labour market and output gap
The output gap is a measure of the difference between actual output in the mainland economy and potential output. The estimated gap can vary over time, based on productivity and the highest sustainable level of employment over time consistent with stable wage and price inflation (N*).
In Norges Bank’s assessment, the Norwegian economy reached a cyclical peak in the mid-2022. In 2023 and 2024, growth slowed and unemployment edged up. Output is estimated to have remained stable at close to potential through 2024. Recent data pull in slightly different directions. While activity has picked up, which may indicate increased output, the number of unemployed has increased, which indicates that there may be a little more spare capacity in the economy. Continued solid employment growth indicates more labour market entrants, raising potential output. Overall, output is still assessed to be near potential, but slightly lower than envisaged in the March Report. This assessment is based on the following:
- Both registered unemployment and LFS unemployment have increased recently. Unemployment is now slightly higher than projected in March, but still close to the level Norges Bank considers to be consistent with output at potential.
- There is a break in NAV’s (Norwegian Labour and Welfare Administration) registered unemployment statistics for April and May, and in May, NAV published break-adjusted and seasonally adjusted statistics. The rise in unemployment in recent months is supported by an increase in the number of unemployed entitled to receive unemployment benefits (Chart 2.11). According to Nav, the break has had little effect on this category.

- Over the past two years, labour market integration of Ukrainian refugees has contributed to an increase in unemployment, but the number of unemployed in this group has declined since the March Report.
- Employment increased in 2025 Q1, and the level was consistent with projections from the previous Report. Preliminary figures indicate that employment picked up further in April, and Regional Network contacts expect employment to increase further in Q3. This means that the employment rate appears to remain firm and suggests, in isolation, a broadly unchanged output gap.
- The share of Regional Network contacts reporting capacity constraints is unchanged from the previous quarter, while the share reporting labour shortages has declined slightly. The shares are close to their historical averages.
- According to Statistics Norway’s sample survey, the stock of vacancies increased in both the private and public sectors in Q1. The inflow of new vacancies to NAV has remained firm through spring. Developments indicate continued strong demand for labour.
- After falling in 2024 Q4, Norwegian mainland GDP increased in 2025 Q1 and was higher than expected. In isolation, this suggests output slightly closer to potential.
- Norges Bank’s modelling system, which takes into account among other things Norwegian mainland GDP, employment, unemployment, wage growth, inflation and investment, indicates that the output gap declined somewhat towards the end of 2024 and then edged up in 2025 Q1. The models indicate that the output gap is slightly lower than assumed in the previous Report, albeit still close to potential (Chart 2.12).
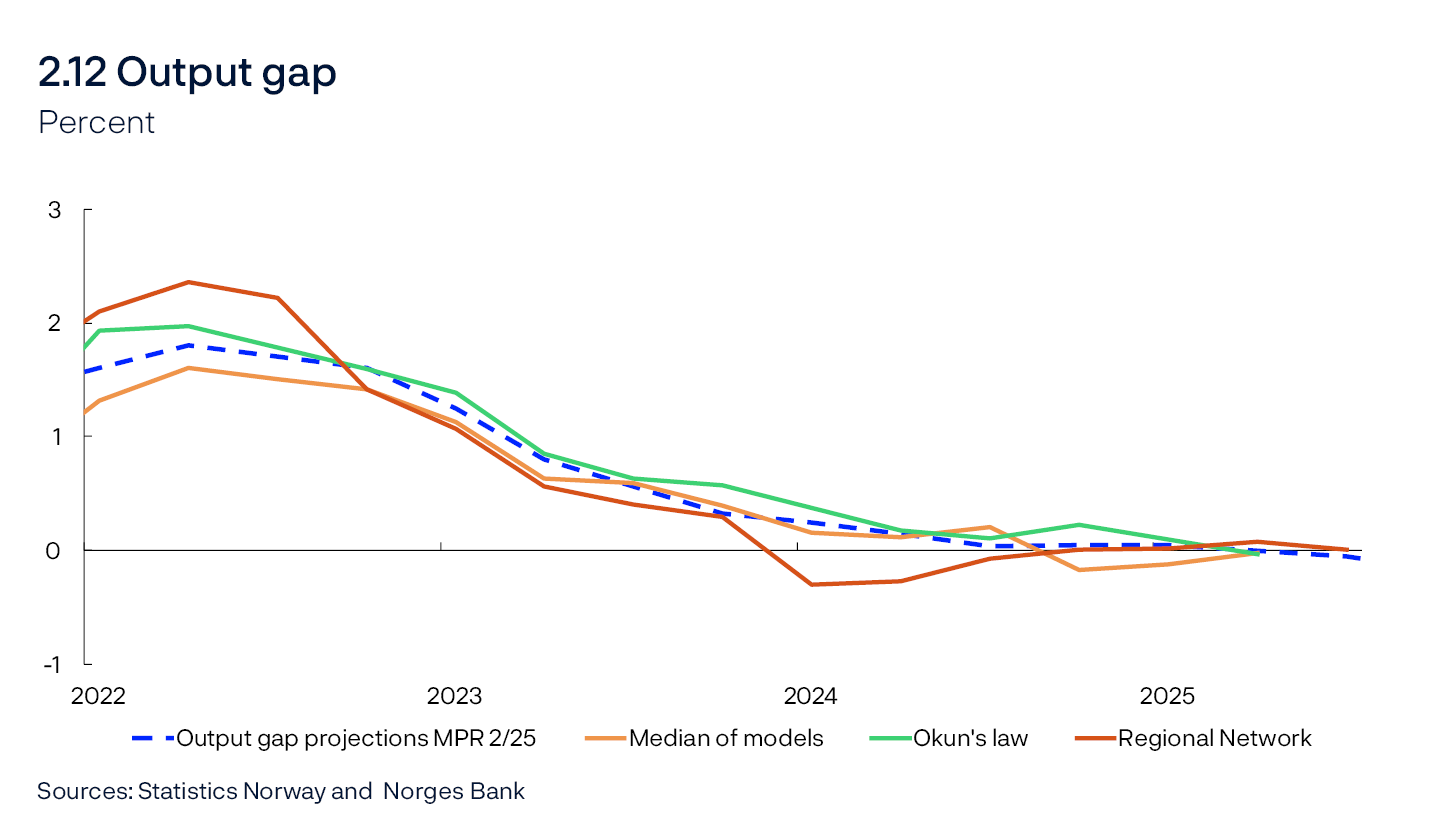
- The models suggest that the output gap was slightly wider in the past, and the output gap assessment has been revised down since mid-2022.
The output gap is expected to widen through 2025 and output to remain below potential. In the projections, registered unemployment rises to 2.2% over the course of the projection period. Further out, the output gap and unemployment are broadly as projected in March.
Employment growth is expected to soften in 2026 and to be broadly in line with population growth. Employment growth is expected to increase thereafter, while population growth declines. This means that employment rate projections are now higher than in the previous Report.
Norges Bank’s assessment is that the lowest unemployment level estimated to be consistent with stable price and wage inflation over time (u*) has declined in recent decades, and Norges Bank now estimates u* to be around 2.1%. This estimate is unchanged from the previous Report.
Table 2.1 Output and potential output1
|
Change from projections in Monetary Policy Report 1/2025 in brackets |
Percentage change from previous year |
|||||
|---|---|---|---|---|---|---|
|
2005–2014 |
2015–2024 |
2025 |
2026 |
2027 |
2028 |
|
|
GDP, mainland Norway |
2.8 |
1.6 |
1.6 (0.4) |
1.4 (0.2) |
1.4 (0) |
1.4 (0) |
|
Potential output |
2.7 |
1.6 |
1.7 (0.4) |
1.6 (0) |
1.5 (0) |
1.3 (0) |
|
N* |
1.5 |
0.9 |
1.1 (0.2) |
0.9 (0) |
0.8 (0) |
0.5 (-0.1) |
|
Trend productivity |
1.2 |
0.7 |
0.6 (0.2) |
0.7 (0) |
0.7 (0) |
0.8 (0.1) |
Norges Bank’s assessment is that growth in potential output (y*) has slowed over the recent decade due to lower growth in underlying productivity and N* (see Table 2.1). There are prospects that growth in y* will remain close to the average for the period between 2015 and 2024 throughout the projection period. The potential output estimate has been revised up in 2025 due to somewhat higher expected growth in underlying productivity and N*. This assessment is based on the following:
- Norges Bank’s estimates of N* are based on population projections from Statistics Norway, adjusted for current population statistics. There are prospects for moderate population growth in the coming years.
- N* is affected by the inflow of Ukrainian refugees to Norway in recent years. Refugees from Ukraine are expected to continue to arrive in 2025 and 2026, in line with government projections, but probably slightly fewer than previously assumed. Historical experience suggests that it will take some time for refugees to find employment. It is assumed that they will gradually lift N*.
- N* is also affected by developments in the number of temporary foreign workers, which is expected to gradually increase in coming years, in pace with a pickup in construction activity.
- A higher share of the youngest and oldest age cohorts has found employment in recent years and contributes to higher employment over time. This pulls in the direction of a slightly higher employment trend than previously assumed.
- The projection of underlying productivity growth has been revised up in 2025, in line with developments in current figures so far this year. Further ahead, underlying productivity growth is expected to remain low, in line with the average for the past ten years. Weak underlying productivity growth dampens potential output growth.
- 1 The contributions from the growth in N* and trend productivity do not necessarily sum exactly to the annual change in potential output due to rounding.
Wages
Wage growth has risen in recent years, owing to high inflation, a tight labour market and high profitability in some business sectors.
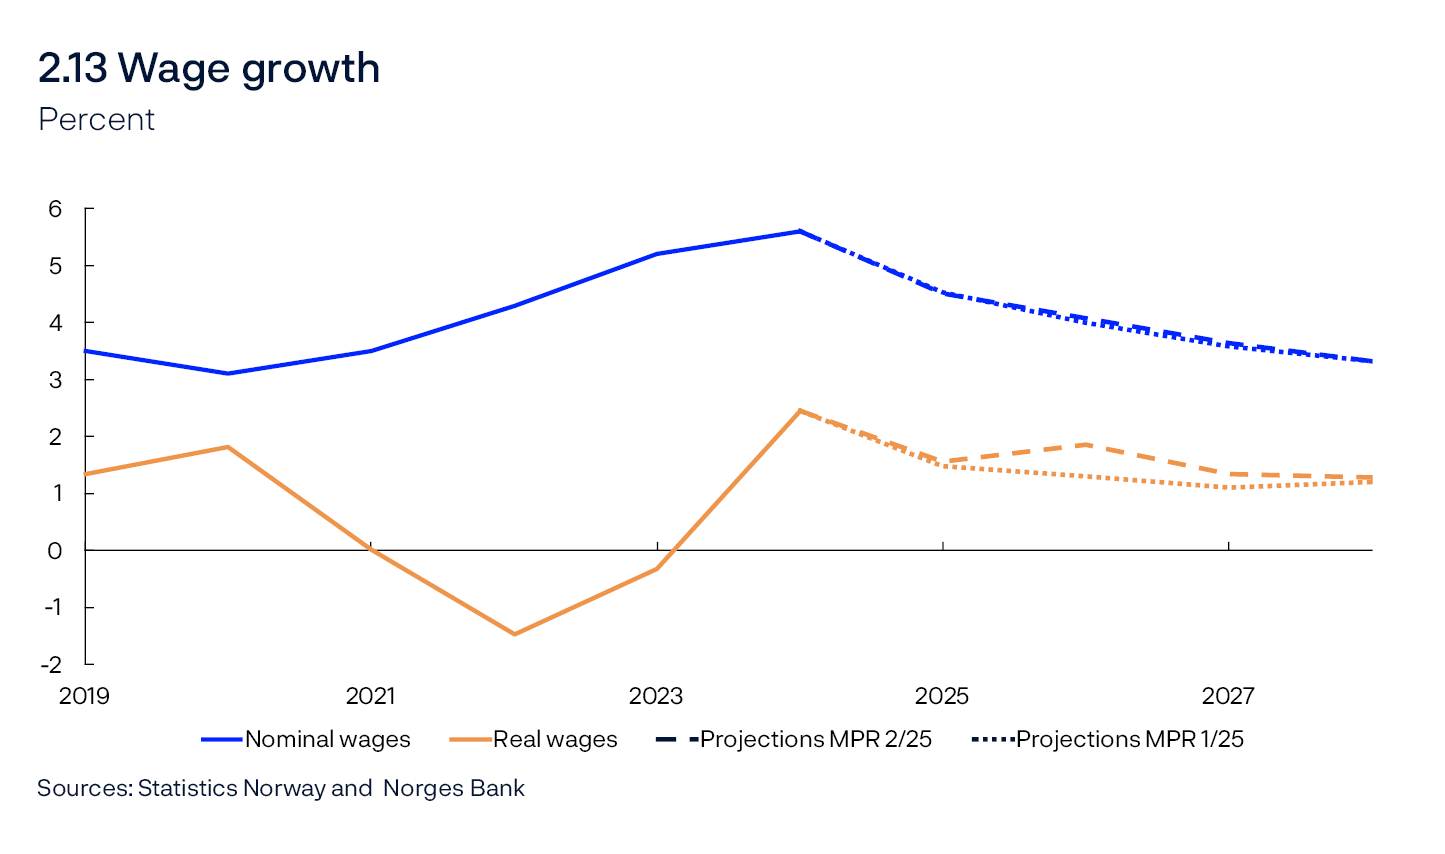
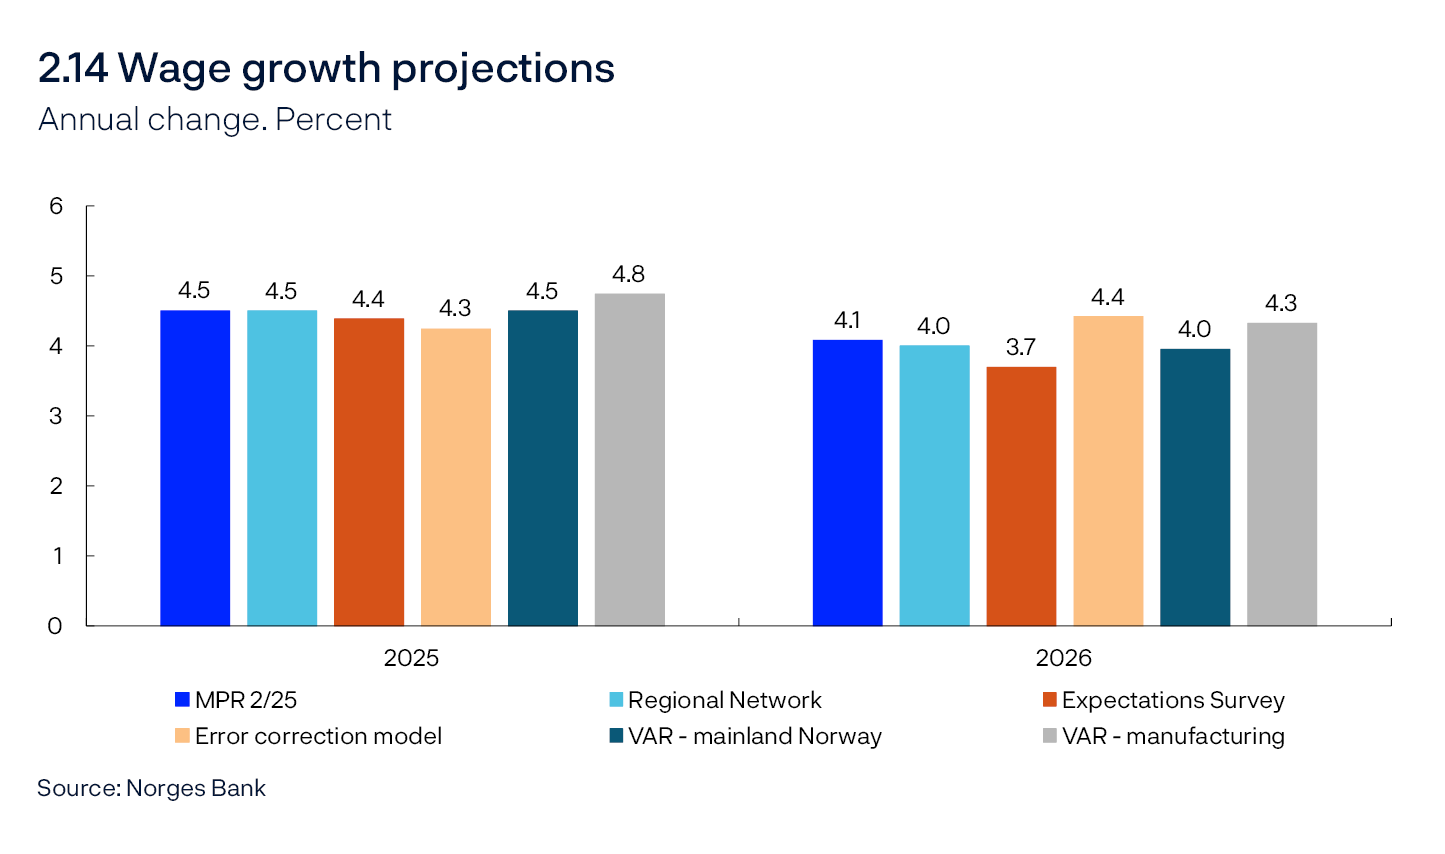
Wage growth in 2025 is expected to decline to 4.5% (Chart 2.13). The projection is unchanged from the March Report. Real wage growth is expected be slightly lower ahead, but still higher than the average for the past ten years. The projections for nominal wage growth are little changed from the previous Report, while real wage growth is expected to be slightly higher in 2026. The projections are based on the following:
- In this year’s wage negotiations, the wage norm was set at 4.4% for the manufacturing sector.
- Regional Network contacts expect wage growth of 4.5% in 2025, while Norges Bank’s Expectations Survey shows that the social partners expect 4.4% (Chart 2.14). Wage expectations in both surveys have increased slightly from the previous quarter.
- Unemployment is expected to increase slightly in 2025 and more than previously projected. This pulls in the direction of slightly lower wage growth.
- Average monthly wages increased by 5.2% in Q1 compared with the corresponding period in 2024. These developments may indicate that wage growth will be slightly higher than Norges Bank’s projections, but statistics vary substantially from quarter to quarter.
- Norges Bank’s empirical models indicate wage growth of between 4.3% and 4.8% in 2025. The model with the wage share in manufacturing as an explanatory variable indicates the highest wage growth in 2025.
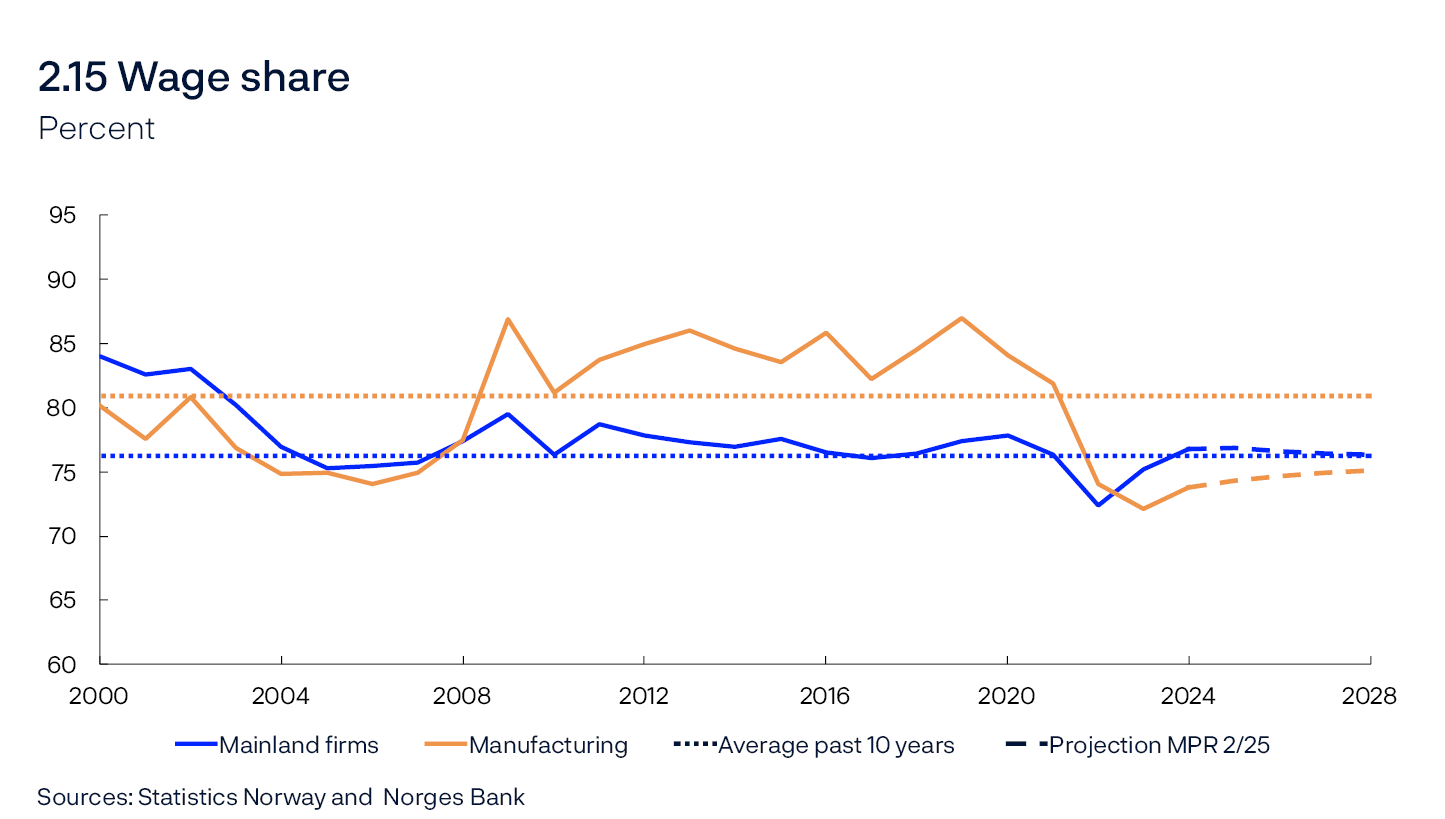
- The overall business wage share was close to the historical average in 2024 (Chart 2.15). At the same time, the wage share in manufacturing remained clearly lower than its historical average. Profitability in manufacturing is expected to remain strong and to contribute to keeping wage growth elevated ahead. Producer prices, measured by the Norwegian mainland GDP deflator, are expected to outpace consumer price inflation throughout the projection period. This allows real wages relative to consumption prices to increase more than productivity without weakening firms’ profitability. For mainland Norway, the wage share is therefore projected to decline slightly.
- Looking ahead, a wider negative output gap and lower inflation contribute to a decline in wage growth in the coming years.
Prices
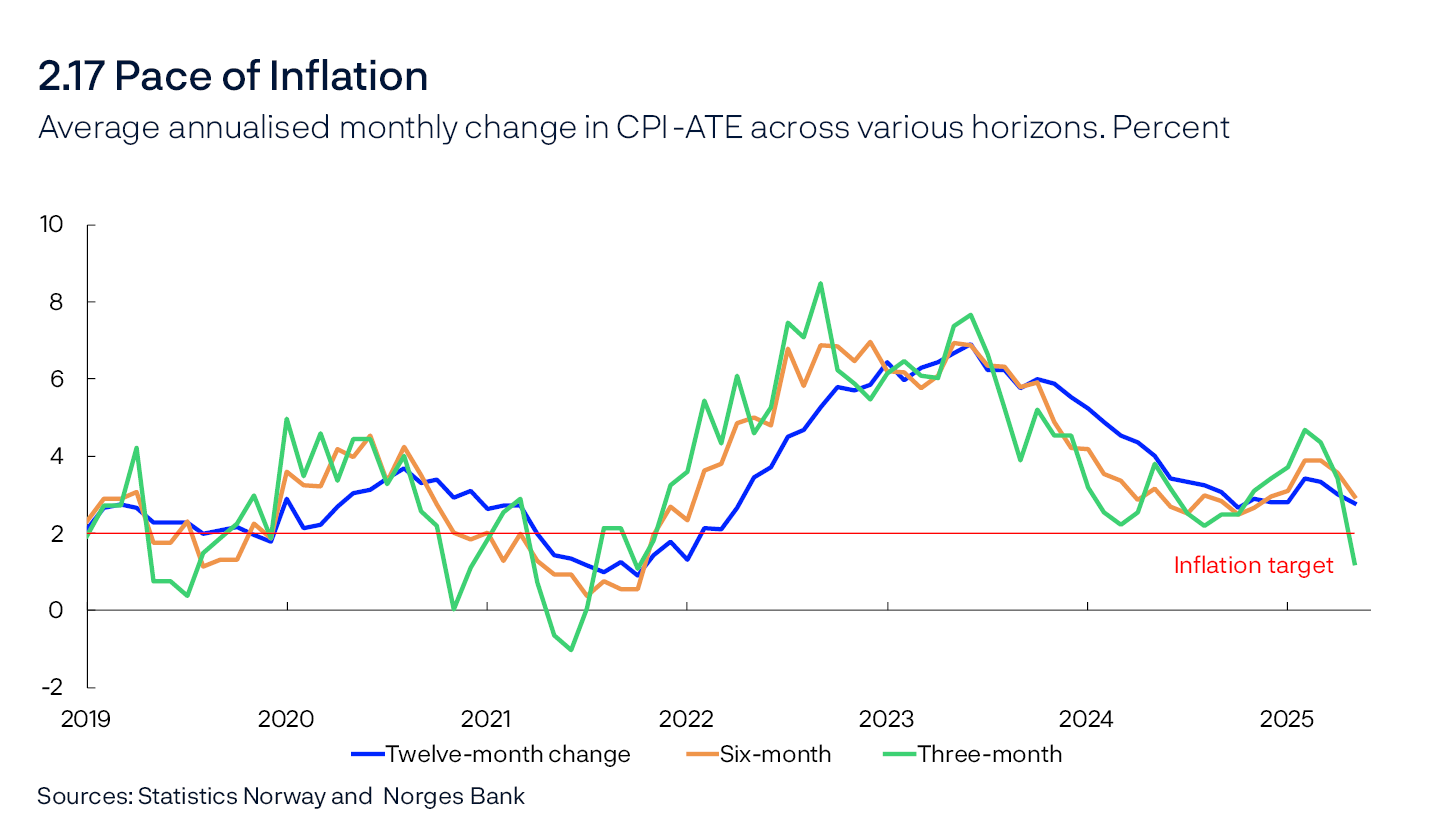
Inflation has fallen markedly since the end of 2022, but the pace of decline has slowed over the past year, and inflation increased in 2025 Q1. Inflation has come down again somewhat since the March Report (Chart 2.16). In May, 12-month CPI inflation was 3.0%, while CPI inflation adjusted for tax changes and excluding energy products (CPI-ATE) was 2.8% (Chart 2.17). Shorter-term measures of inflation, such as three- and six-month annualised inflation, have declined in recent months. Other indicators of underlying inflation have also declined.
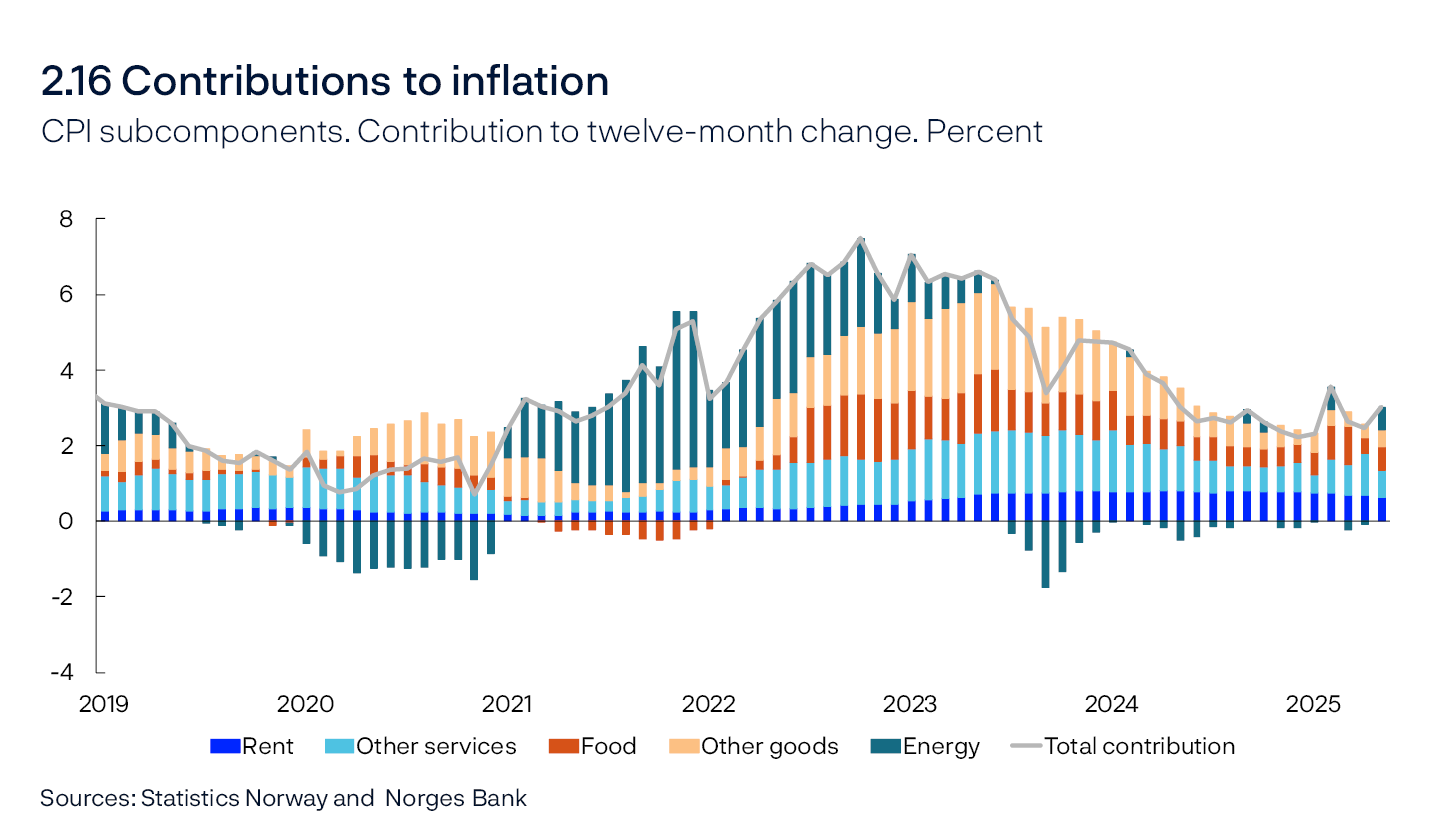
Services inflation is driving up overall inflation, while the contribution from goods inflation has declined substantially since the peak (Chart 2.16). Food and beverage inflation pulled up goods inflation markedly at the start of the year but has since come down. Rent inflation in the CPI has fallen slightly in recent months after having been high for an extended period.
Underlying inflation
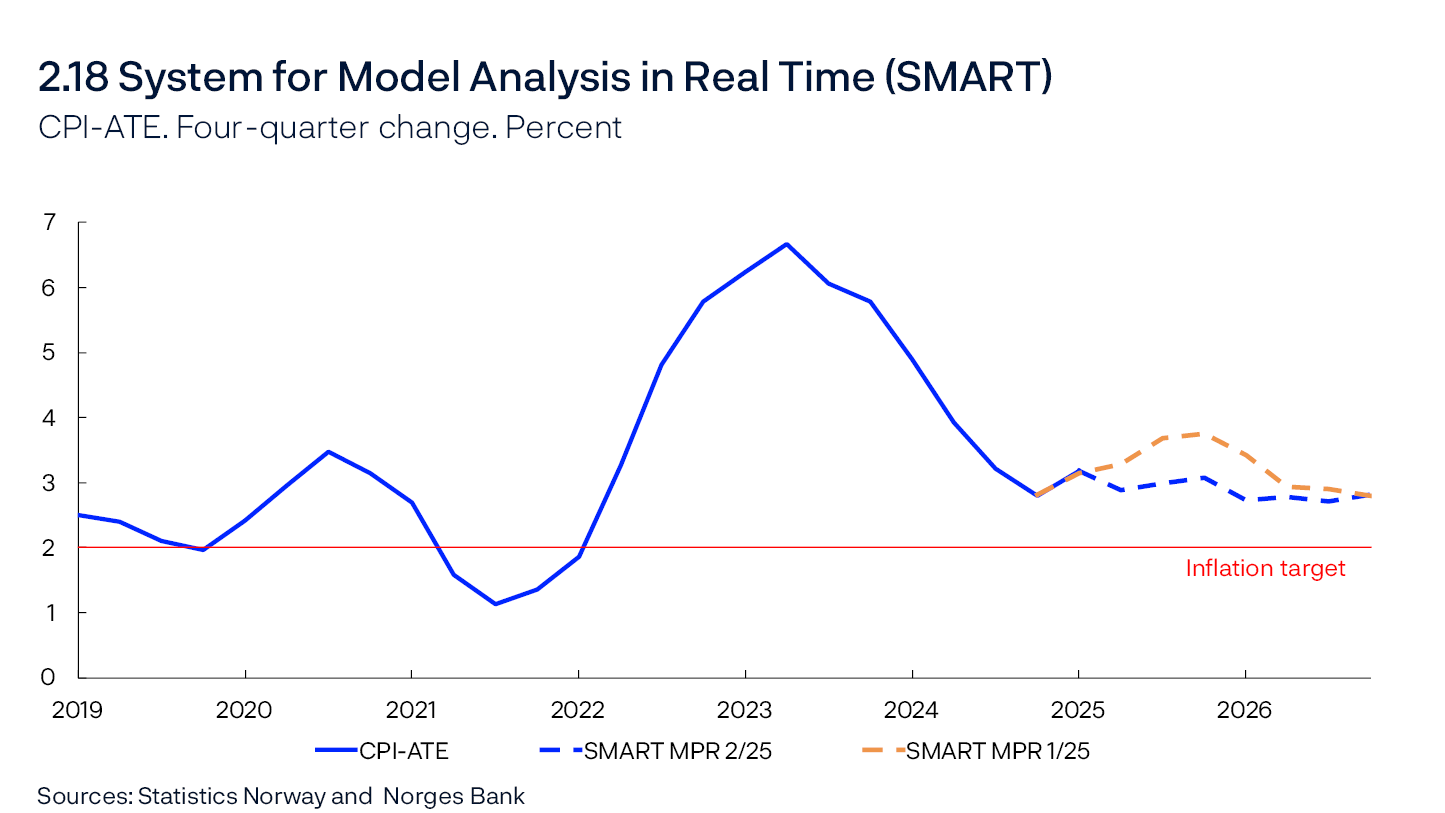
Inflation is projected to increase slightly in 2025 Q3, mainly due to the base effect stemming from the decline in childcare prices in August 2024 dropping out of four-quarter inflation. Further ahead, inflation is expected to gradually decline and approach 2%. The projections are lower for the coming year than in the March Report and are little changed further out in the projection period. The projections are based on the following:
- Inflation has been somewhat lower than projected in the March Report. In Norges Bank’s System for Model Analysis in Real Time (SMART), which weights forecasts from a broad set of models, the forecasts have been revised down since the March Report (Chart 2.18).
- High wage growth and the rapid rise in prices for other intermediate inputs in recent years have led to a rapid rise in business costs. Historically, labour cost increases appear to have passed through relatively slowly to selling prices (see “Pass-through from factor costs to consumer prices”). Norges Bank’s inflation projections are based on an expectation that firms will gradually pass on increased labour costs to final goods prices. The wage growth projection is little changed since the March Report.
- In recent years, productivity growth has been weak in most sectors, resulting in higher growth in business costs and thus higher inflation. Productivity growth in 2025 has been adjusted up slightly since the March Report.
- Growth in Norges Bank’s indicators of international price impulses to imported intermediate and consumer goods have fallen markedly from the peak and are now at a low level.
- The indicator of international price impulses to imported intermediate goods (IPI) has been revised down somewhat for the coming years compared with the March Report (Annex Table 1), which pulls in the direction of slightly lower inflation ahead. This is mainly due to lower commodity prices, which may be linked to the current trade conflict.
- The indicator of international price impulses to imported consumer goods (IPK) has also been revised down somewhat ahead compared with the March Report (Annex Table 1). This is due to the slow rise in in international consumer goods prices and a somewhat larger fall in freight rates than expected in the March Report. Overall, this pulls in the direction of slightly lower imported consumer goods inflation ahead.
- The import tariffs now imposed by the US are not expected to have a pronounced impact on inflation in Norway. However, the prices of some goods may be affected. Higher tariffs and any resulting supply chain disruptions may accelerate the rise in prices for US manufactured goods. At the same time, prices for goods imported from China may be lower if higher tariffs result in Chinese companies diverting more of their exports to Europe.
- While the krone exchange rate has strengthened somewhat since the March Report, the projections ahead are unchanged.
Domestically produced goods and services inflation has declined less than CPI-ATE inflation and remains at a high level (Chart 2.19). High wage growth and weak productivity growth are expected to keep inflation elevated for a period ahead. Imported consumer goods inflation has fallen substantially after a marked increase in the wake of the pandemic. Subdued international price impulses are expected to keep imported consumer goods inflation low ahead.
Overall inflation
While lower CPI-ATE inflation is expected, higher energy prices pull in the opposite direction. Annual CPI inflation is projected at 3.0% in 2025 and to decline towards 2% thereafter. The projections are based on the following:
- Projections for underlying inflation have been revised down since the March Report.
- Energy prices have been higher than projected through spring, and power futures prices are higher now than in March (see “Energy prices”).
- Energy price projections for 2026 have been revised up, but less than in 2025, pulling annual CPI inflation down.
- In the Revised National Budget, the government proposed lowering the electrical power tax and offering households a fixed electricity price contract. Norges Bank assumes that the proposed measures, or other measures with similar effects for households’ energy costs, will be introduced. This will, in isolation, pull down CPI projections by around 0.2 percentage point in 2025 and 0.3 percentage point in 2026, broadly in line with projections in the previous Report.
The krone exchange rate
The krone exchange rate, as measured by the import-weighted exchange rate index I-44, is now somewhat stronger than assumed in March (Chart 2.D), but has fluctuated widely throughout the period. The krone depreciated by around 5% in the days following the US announcement of new and higher import tariffs on 2 April. The krone depreciated more than many other currencies, such as the euro and Swedish krona. The krone strengthened through the following weeks, which coincided with increased market risk appetite and rising global equity markets. The interest rate differential against Norway’s main trading partners has been relatively stable since the previous Report, and there was little movement in the krone exchange rate following the May monetary policy meeting. The outbreak of military hostilities between Israel and Iran on 13 June led to higher oil prices and a stronger krone.
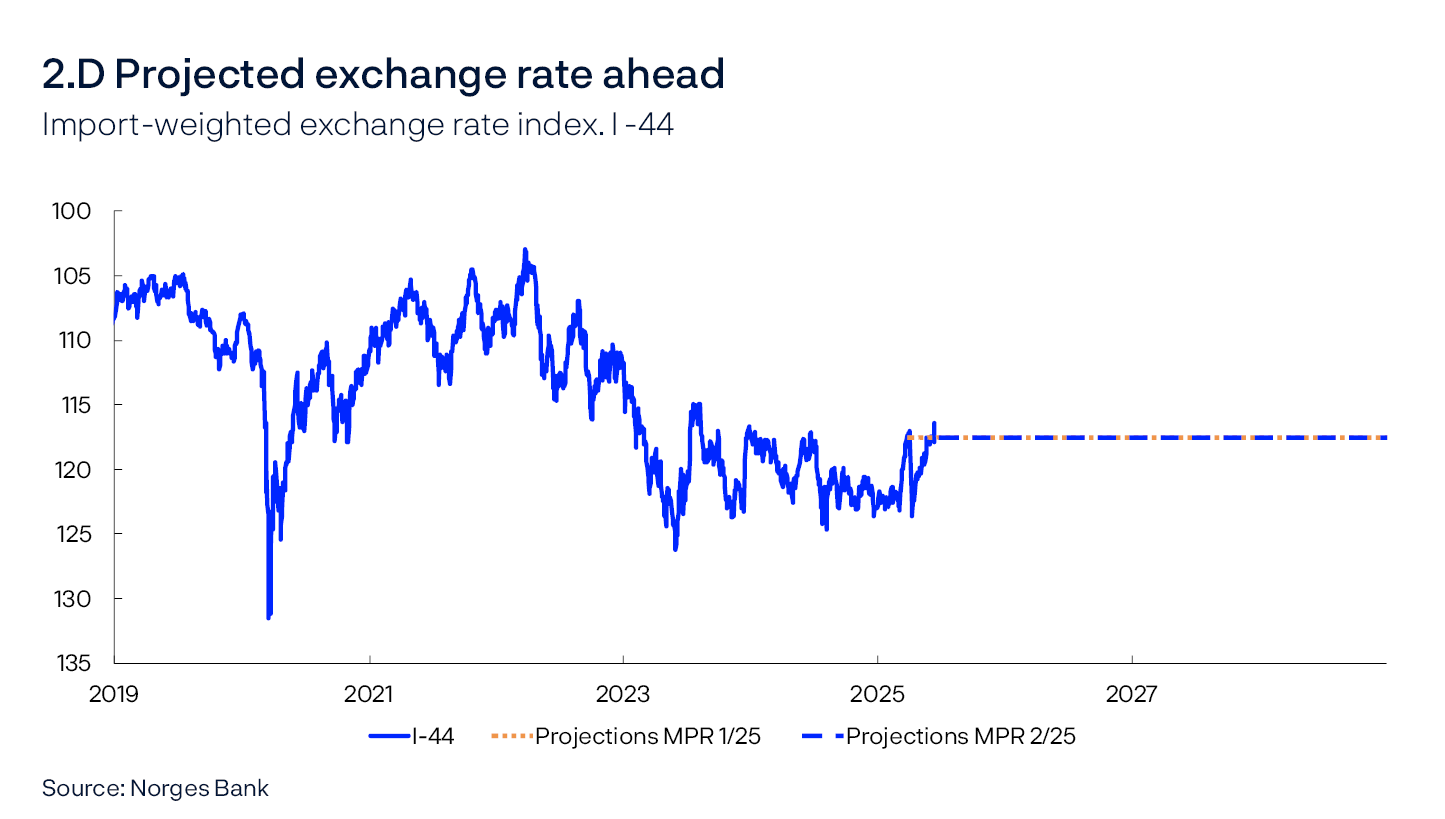
Although the I-44 is little changed since the previous Report, there are differences in exchange rate movements against various currencies (Chart 2.E). The krone is stronger against the US dollar, reflecting a broad weakening of the US dollar since the previous Report. At the same time, the krone is slightly weaker against the euro.

Norges Bank’s krone projections assume an effect of unexpected policy rate changes in the short term (see box “The effect of monetary policy on the krone exchange rate” in Monetary Policy Report 2/2025). The magnitude of the assumed effect depends on how Norges Bank expects market interest rates to move following a policy rate decision. Beyond policy rate developments, Norges Bank normally has no information other than what the market has already priced into the exchange rate, and as a rule, the krone exchange rate is therefore assumed to remain stable further ahead.
In this Report, a downward revision of market-implied policy rate expectations ahead is assumed to occur upon publication of the policy rate decision. The krone is projected to weaken slightly but is assumed to remain unchanged thereafter to the end of the projection period (Chart 2.D).
However, developments in the krone exchange rate are always uncertain. Chart 2.F illustrates uncertainty based on options prices in the foreign exchange market. These prices are used to calculate an implied probability distribution of the krone exchange rate at a given point in time. The distribution reflects market expectations when preferences are risk neutral. The chart shows such a distribution of EUR/NOK (left panel) and USD/NOK (right panel) three months ahead, expressed as a deviation from forward prices – ie the exchange rate agreed in the forward market.
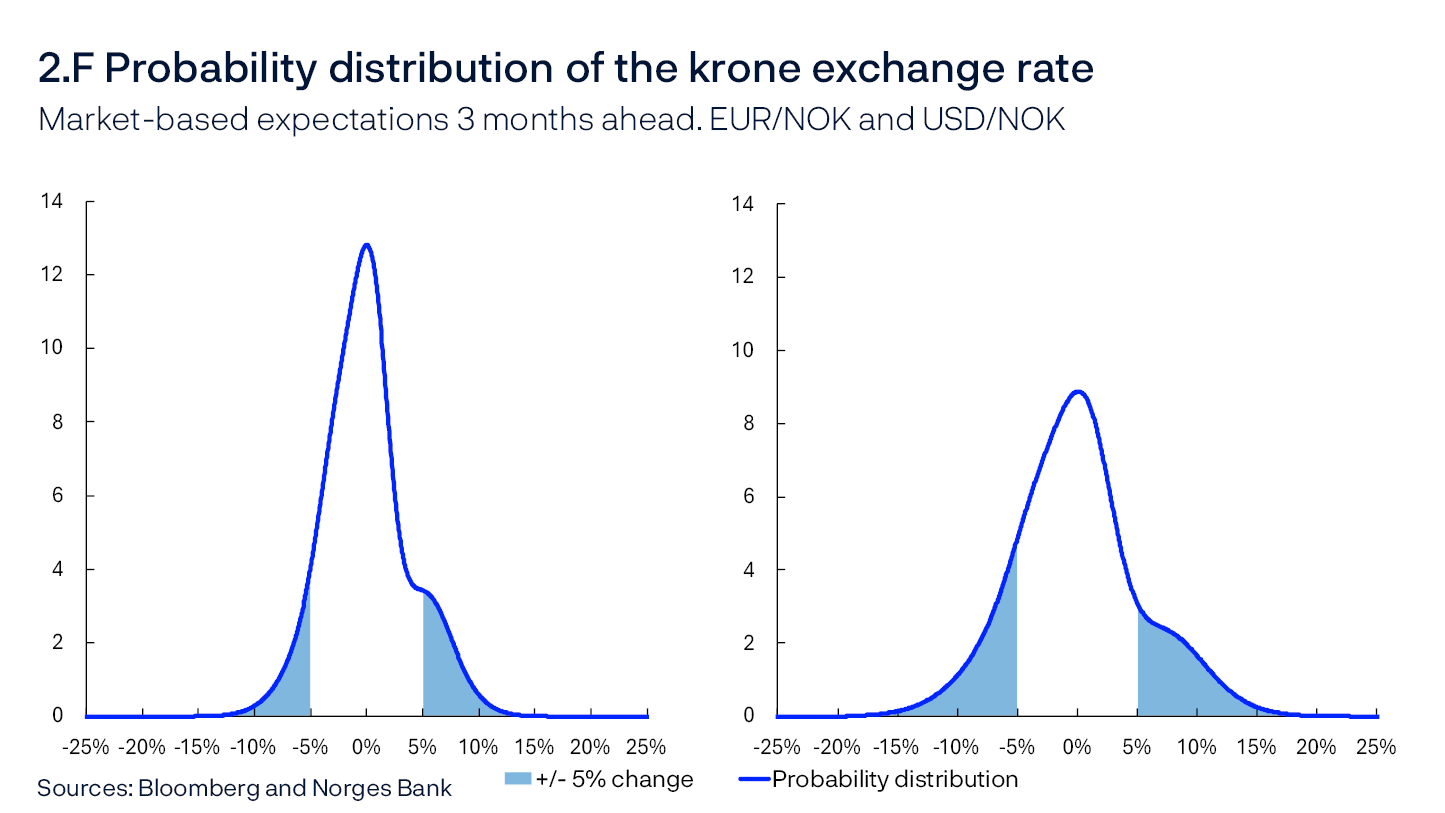
Normally, market-based distributions will be both asymmetrical and vary between individual currencies. Against the euro, and based on market pricing and relative to forward prices, the krone has a somewhat greater probability of weakening by more than 5% than it has of strengthening by 5% or more. Against the US dollar, the probabilities of the krone weakening or strengthening to the same degree are equal. Uncertainty regarding the krone exchange rate is more pronounced against the US dollar than against the euro. Overall, market-based uncertainty related to developments in the krone exchange rate is at approximately the same level as in March, albeit somewhat below the average for the period between 2007 and 2025.
3. Monetary policy analysis
Model implications of new information
This section describes the monetary policy analysis presented to Norges Bank’s Monetary Policy and Financial Stability Committee, which forms part of the basis for the policy rate decision. The policy rate forecast is described and explained in the Committee’s assessment.
New information
The analysis of the current economic situation in Norway, combined with assumptions regarding exogenous driving forces, forms the basis of the monetary policy analysis and the Bank’s forecasts.1 Examples of exogenous driving forces in the Bank’s macroeconomic model, NEMO, which is the main forecasting model, are petroleum prices, global economic developments and petroleum investment. Changes in the neutral real interest rate are also assessed outside the model and influence what the policy rate will converge towards in the model further out when the economy is no longer influenced by shocks. In the short-term horizon, which consists of the current and next quarter, the model is conditioned on the projections described in more detail in Section 2.
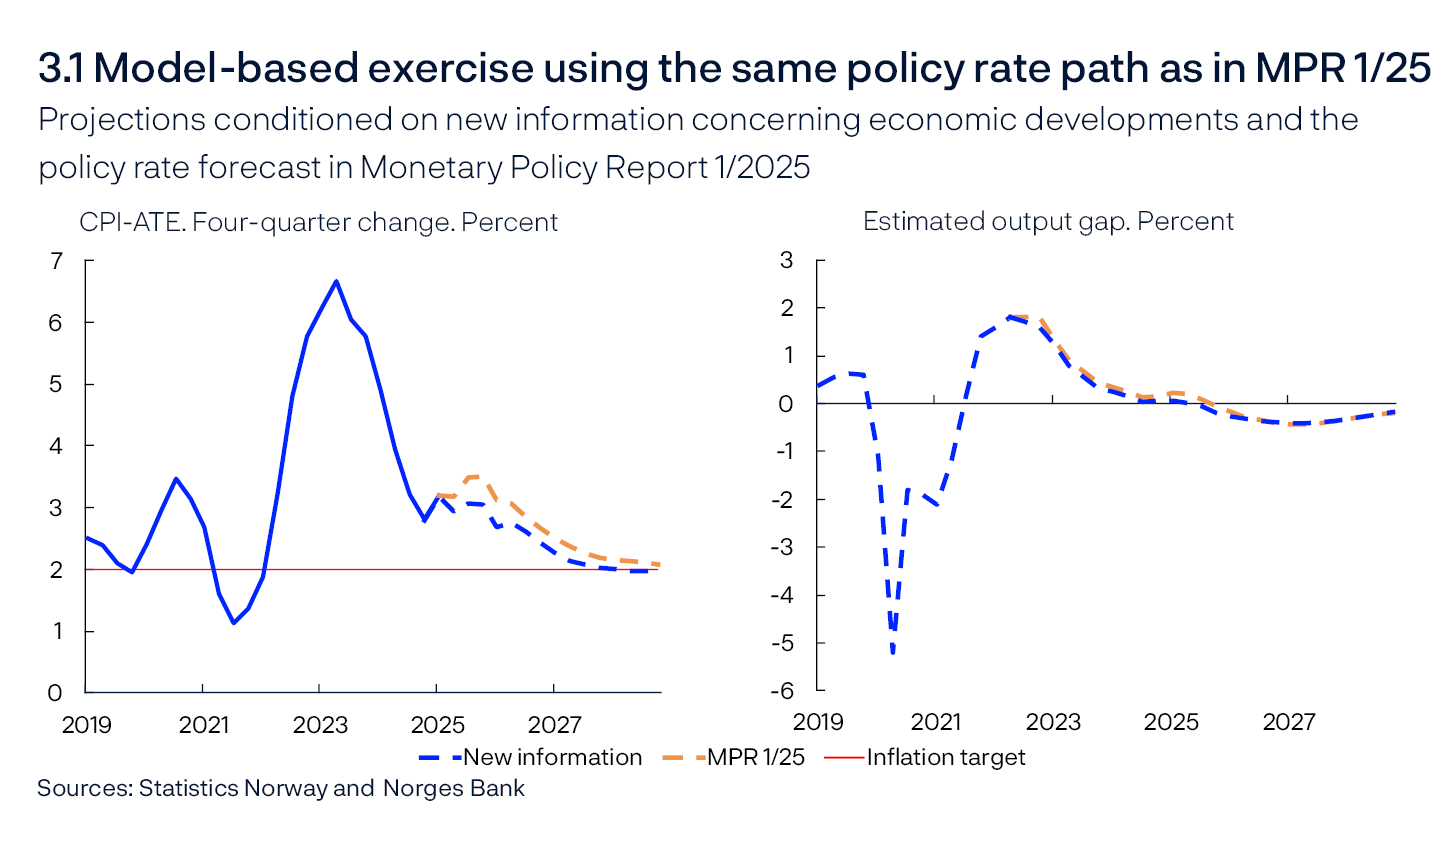
After conditioning on historical data, short-term forecasts and exogenous driving forces, NEMO provides forecasts for the remainder of the forecast horizon. To summarise how new information and assessments of the economic situation have affected the forecasts since the March Report, we present model-based forecasts of the output gap and core inflation (CPI-ATE) given the same policy rate path as in the previous Report.
Key premises for this exercise are:
- Inflation has been lower than projected in the March Report, and the near-term forecasts have been revised down.
- The krone exchange rate is somewhat stronger than assumed in the March Report. Given an unchanged policy rate path, the krone is assumed to remain somewhat stronger ahead than in the March Report throughout the projection period.
- The output gap has been revised down slightly in recent years and in the short-term horizon.
The exercise indicates that the output gap will be a little lower in the coming year than envisaged in March, but is broadly unchanged further out in the projection period (Chart 3.1). Inflation will be lower throughout the projection period.
The model’s policy rate path
Norges Bank’s main model, NEMO, generates a policy rate path. New information and new assessments will normally also generate changes in the model’s path.
Chart 3.2 uses the model to decompose the main driving forces behind changes in the model’s policy rate path since the March Report. In macroeconomic models like NEMO, economic fluctuations that bring inflation away from target and output away from potential are explained by shocks. This is the case for all the model variables, including the policy rate, as it is not possible to fully represent the Committee’s trade-offs in a technical reaction pattern. Changes in shocks arise when new data and projections differ from those implied by the driving forces in the model. The decomposition shows how changes in shocks since the March Report contribute to changes in the model-based policy rate path. The monetary policy shocks from the previous Report are held constant in order to isolate the effects of other shocks. The bars show contributions to changes in the model path from different types of shocks, and the broken line shows the sum of the bars. The solid line shows the actual change in the policy rate path.
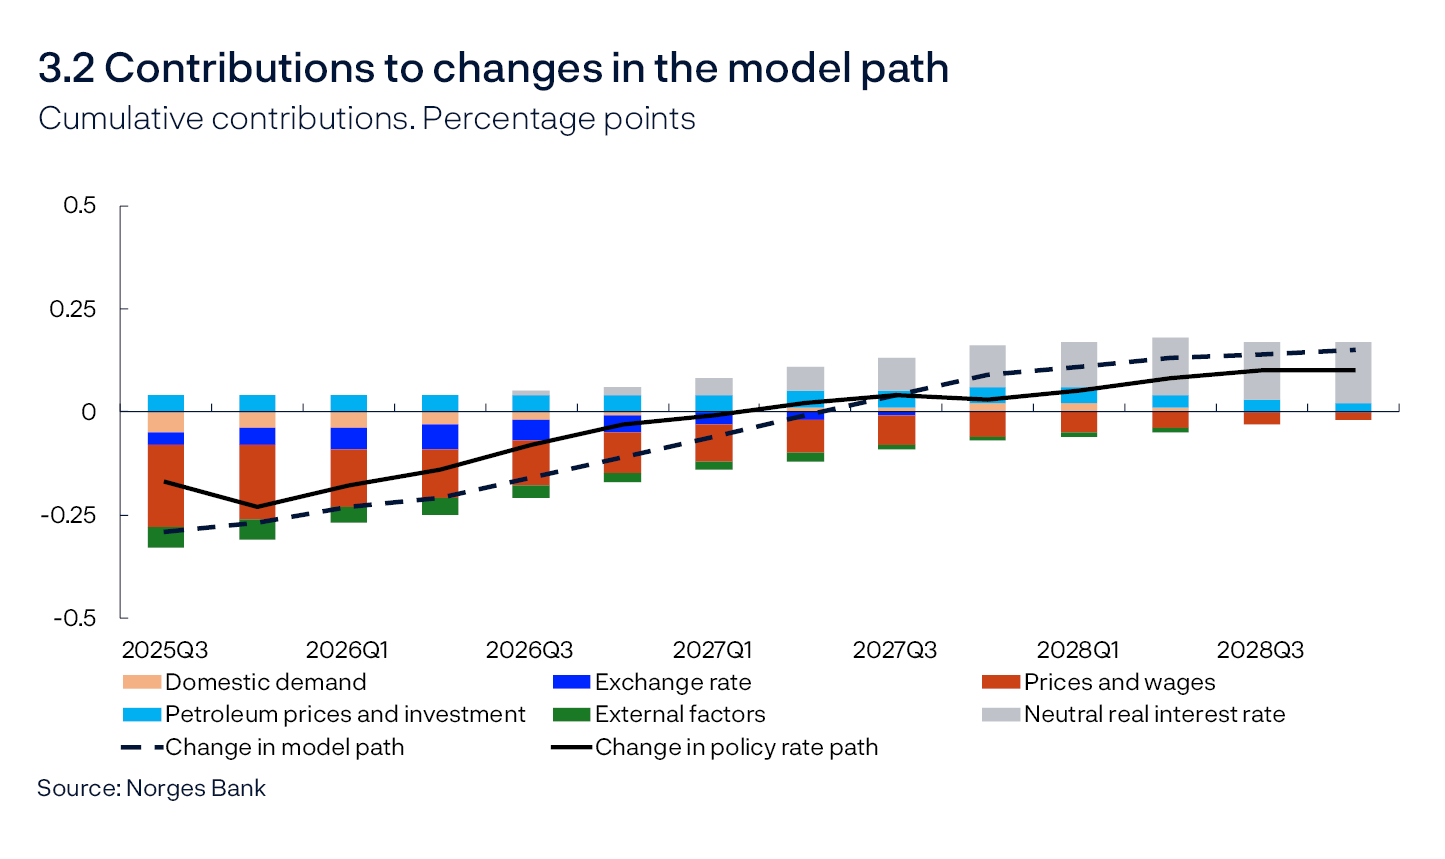
The main contributions to changes in the model path since the March Report are:
- Underlying inflation has been lower than projected in the previous Report and the near-term forecasts have also been revised down. Norges Bank’s indicators of international price impulses to imported intermediate goods (IPI) and international price impulses to imported consumer goods (IPK) have been revised down since the March Report. This suggests lower inflation ahead. Price and wage factors on the whole suggest a somewhat lower model-based path (red bars).
- There are prospects of slightly lower growth among Norway’s main trading partners than projected in the March Report, which in isolation dampens demand for Norwegian exports. Market interest rates abroad are somewhat lower than in the March Report in the coming year. Overall, external factors imply a slightly lower model-based path in the coming year (dark green bars).
- The krone exchange rate is somewhat stronger than assumed in the March Report and slightly stronger than indicated by the changes in the interest rate differential and the other driving forces in the model. The exchange rate is assumed to weaken a little upon publication of the policy rate path, but to remain at that level ahead (see “The krone exchange rate”). Overall, the krone exchange rate contributes to a slightly lower model-based policy rate path (dark blue bars).
- Overall, petroleum prices, as incorporated in the model, are as assumed in March. Projected petroleum investment have been revised up somewhat since the March Report. On the whole, petroleum prices and investment have pulled up the model path (light blue bars).
- Developments in housing investment and household consumption have been somewhat stronger than projected in the March Report and slightly stronger than implied by the model’s relationships. Somewhat higher power investment is also expected in the coming years. These factors contribute to a slightly higher model-based path. At the same time, public demand was somewhat weaker than assumed in March. Overall, GDP growth has been higher than projected, but potential output has been revised up somewhat more in the short-term horizon, resulting in a slight downward revision of the output gap. This implies a lower model-based path. Overall, domestic demand pulls the model-based path down slightly in the near term before pulling the path up slightly (orange bars).
- The interval for the neutral policy rate has been revised up (see “Estimates of the neutral real interest rate”), which will pull up the model-based path somewhat further out in the projection period (grey bars).
- The model-based path is somewhat lower than in the March Report over the next two years, but slightly higher over the remainder of the projection period.
- 1 See Section 3.2 in Norges Bank (2024) “Norges Bank’s Monetary Policy Handbook, Version 2.0”. Norges Bank Papers 3/2024 for a more detailed description of how the decision basis is drawn up.
Monetary policy indicators and trade-offs
Simple rule for the money market rate
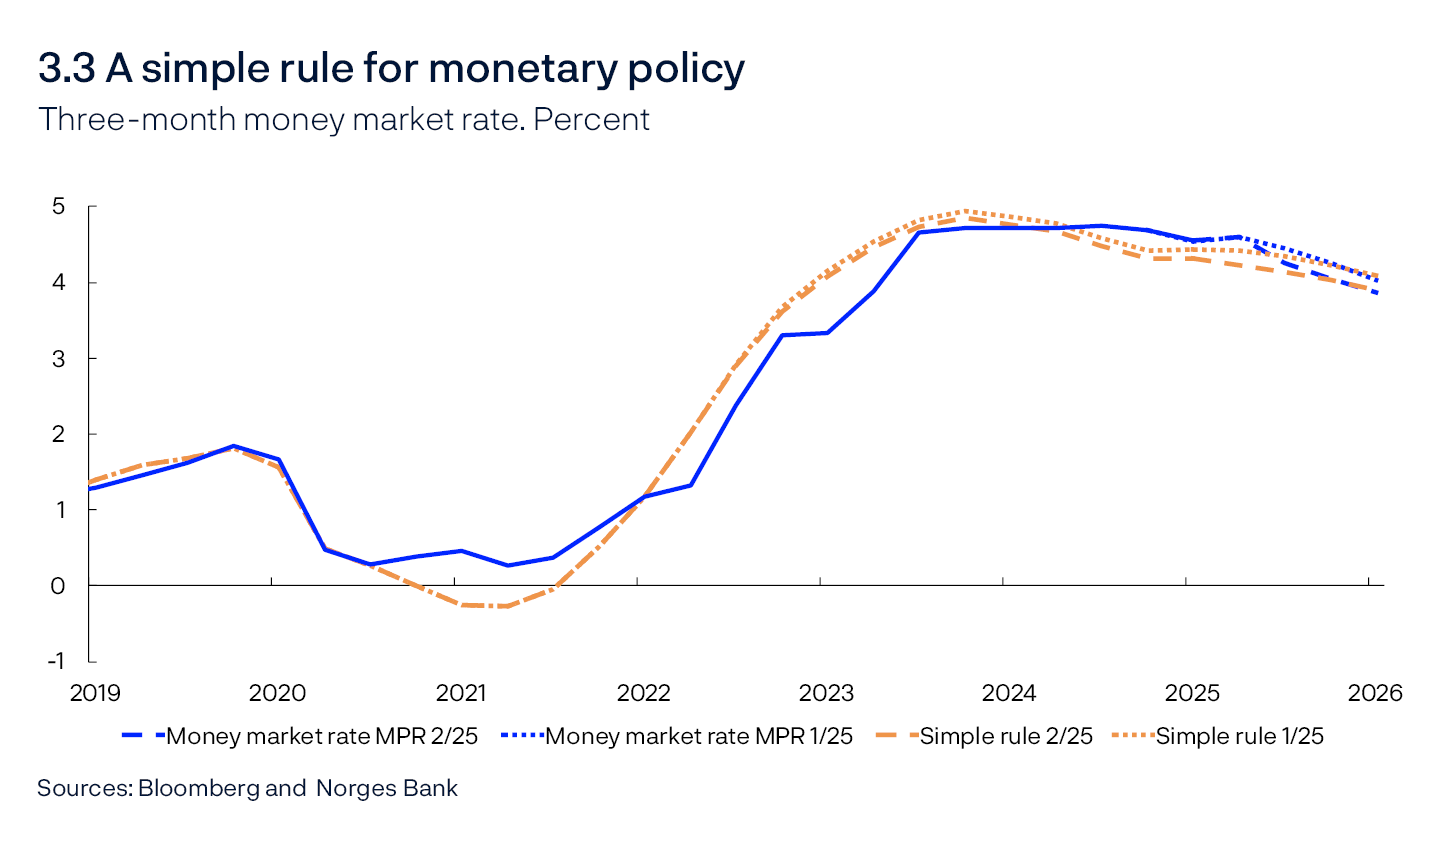
Simple estimated interest rate rules are often used to describe the average monetary policy reaction function. See Monetary Policy Report 1/25 for further information on Norges Bank’s simple monetary policy rule. Compared with the March Report, the simple rule for the money market rate now indicates a rate that is slightly lower than the corresponding rule provided in March (Chart 3.3). This is due to the downward revision of the output gap and inflation in the near term. At the beginning of 2026, the estimated rule indicates a money market rate that is broadly in line with the Bank’s projection.
Policy rate expectations
Market-implied policy rates further out can provide an indication of how market participants have interpreted new information and how they expect Norges Bank to react. Market rates for the coming quarters have been slightly higher than in March, but at the beginning of 2026 they are lower than in the March Report (Chart 3.4). Market rates are broadly in line with the Bank’s policy rate path from the March Report until mid-2026 but are thereafter higher than in the remainder of the projection period.
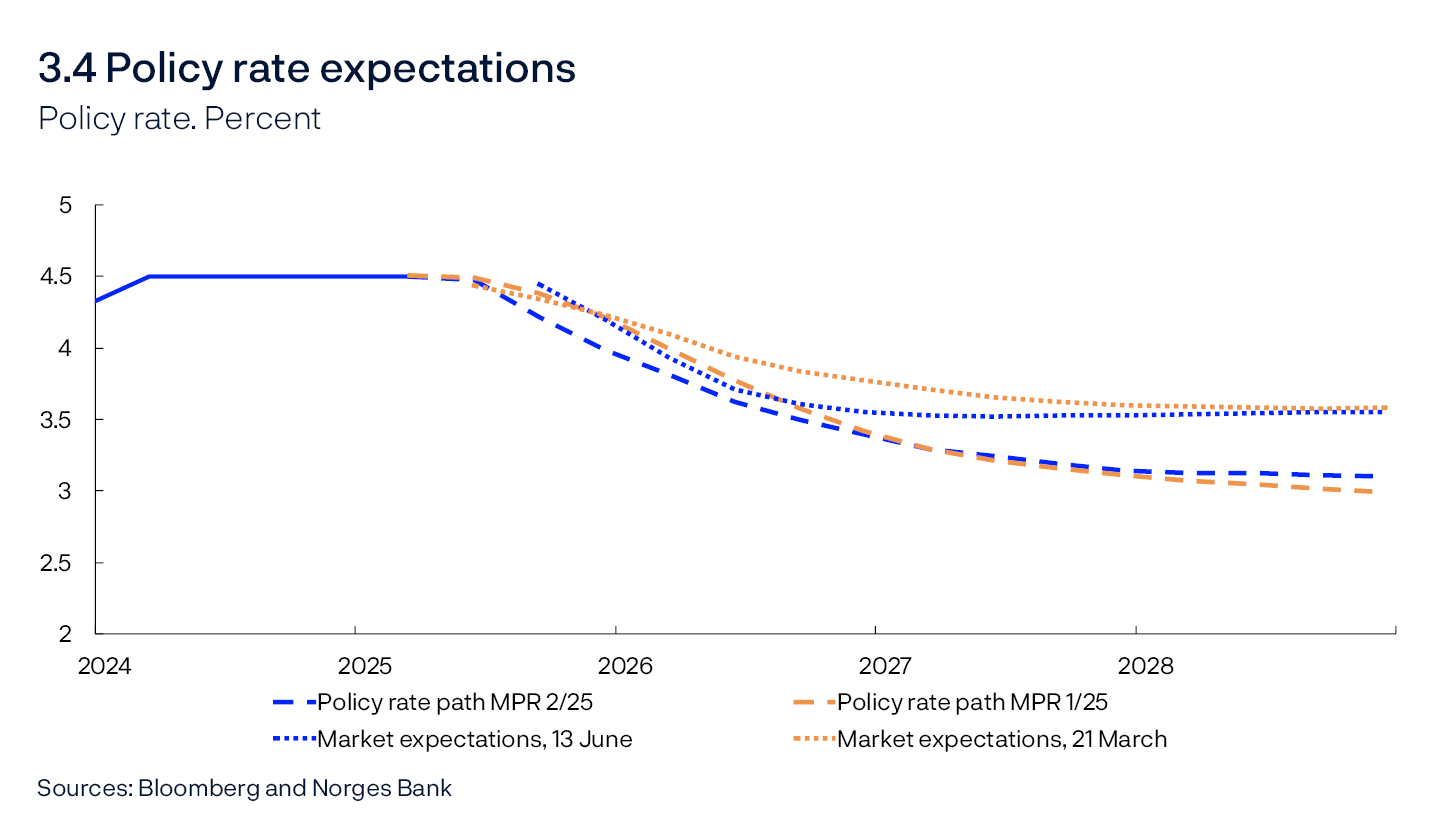
The difference between the market interest rate level and the Bank’s policy rate path further out in the projection period may reflect different policy rate expectations and the fact that term premiums rise with maturity, which means that the market’s actual policy rate expectations may deviate from market interest rates. The term premium is a risk premium that partly reflects the uncertainty relating to the future interest rate level and is the investor’s compensation for a higher risk level.
Market policy rate expectations among Norway’s trading partners
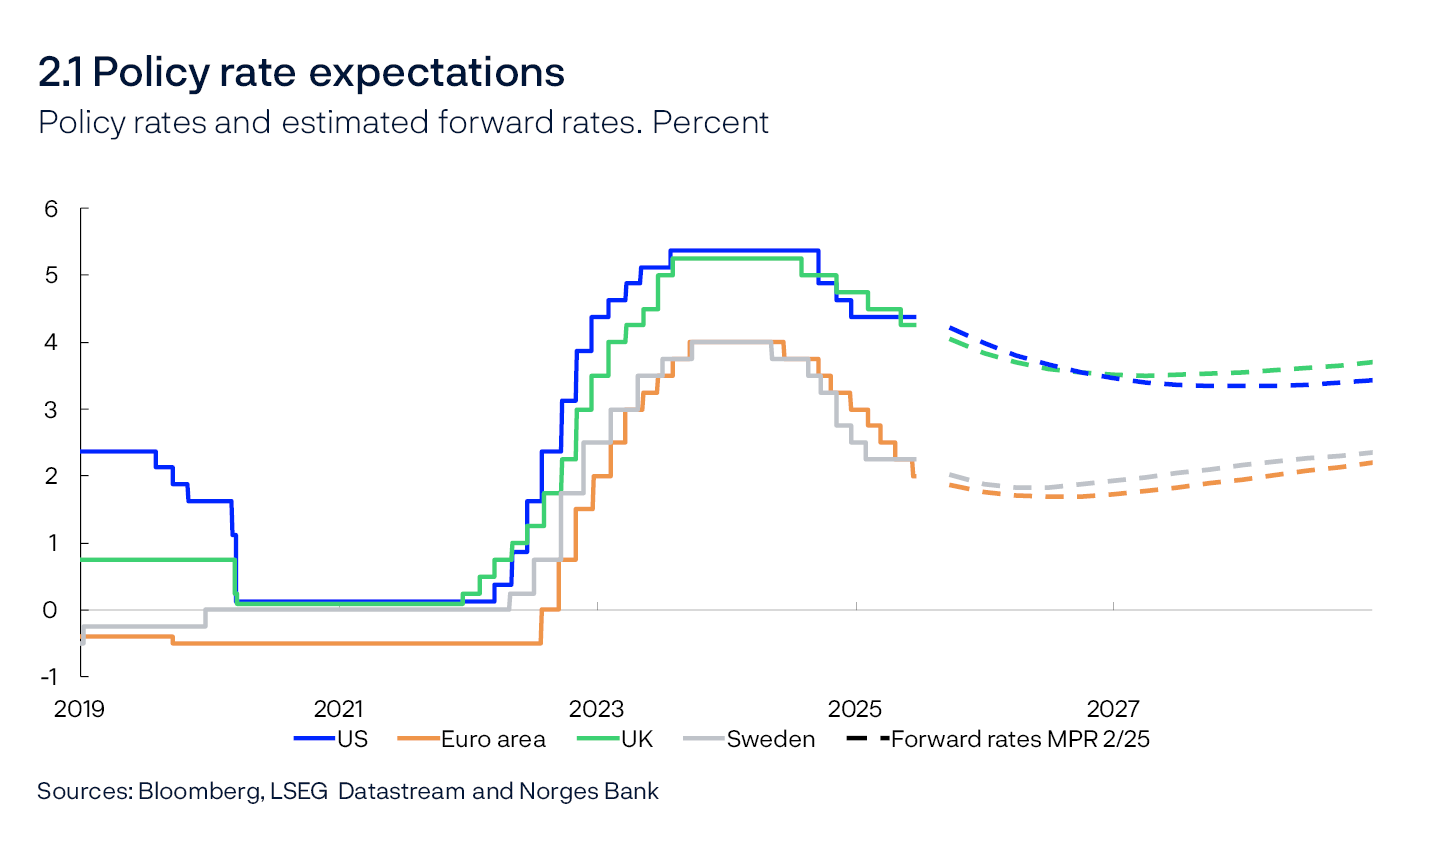
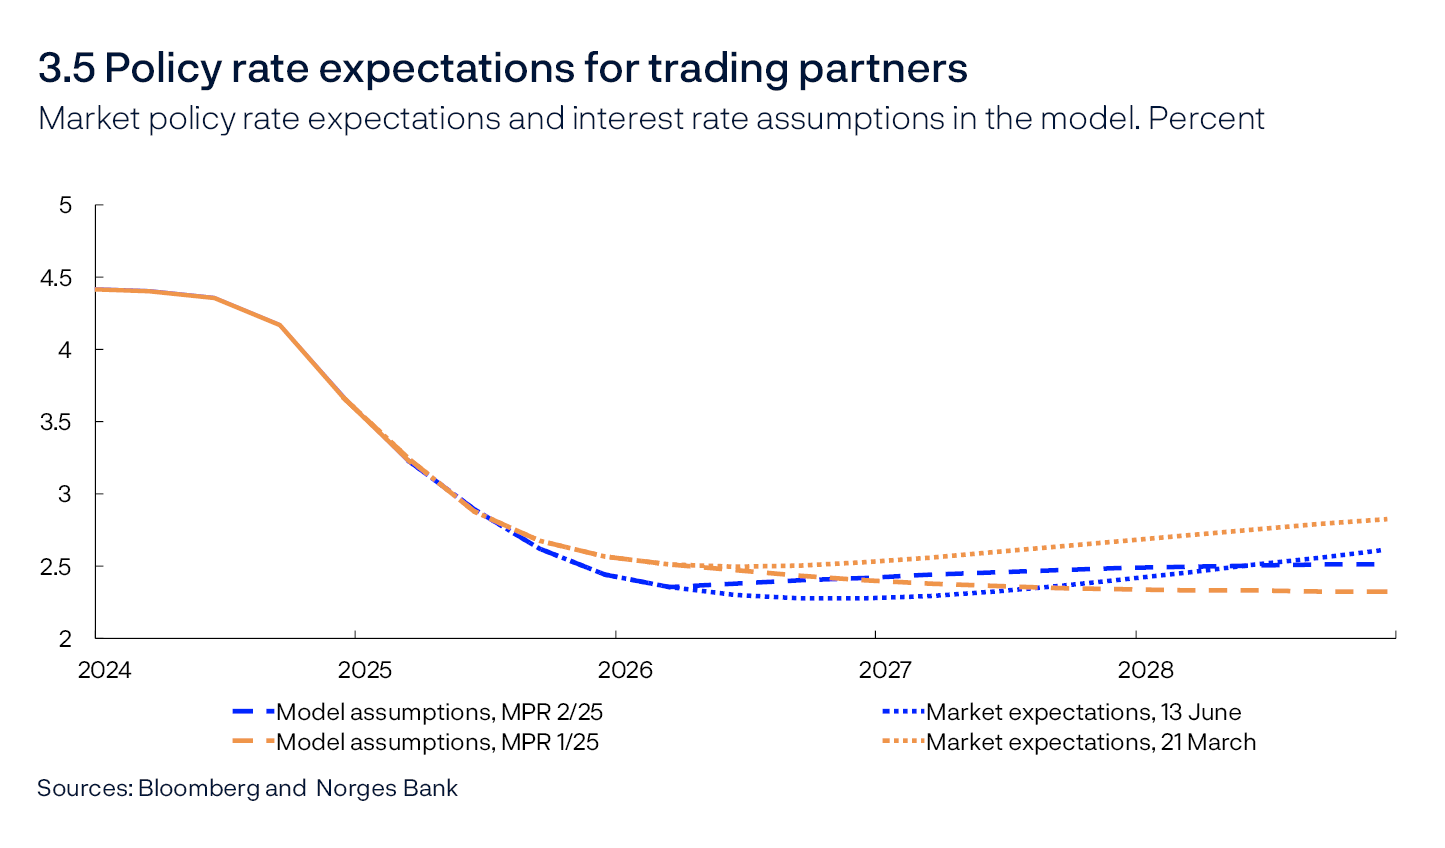
Norway is a small open economy, with financial markets closely intertwined with trading partner markets. Norway’s interest rate level therefore cannot deviate substantially from foreign rates over time. Changes in foreign interest rates can impact the krone exchange rate. Market pricing abroad indicates that Norway’s main trading partners will continue to reduce policy rates through 2025. Interest rates then level off and edge up towards the very end of the projection period (Chart 3.5). Market rates abroad are somewhat lower than in the March Report.
As there is considerable uncertainty as to whether market interest rates reflect future policy rate expectations, partly due to possible term premiums in market interest rates, the modelling system conditions on the foreign market interest rates only in the first year of the projection period (Chart 3.5). Thereafter, a technical assumption is applied of foreign interest rates moving towards a policy rate of around 0.5 percentage point lower than the Bank’s interval for the neutral policy rate in Norway.
Interest rate differential against other countries
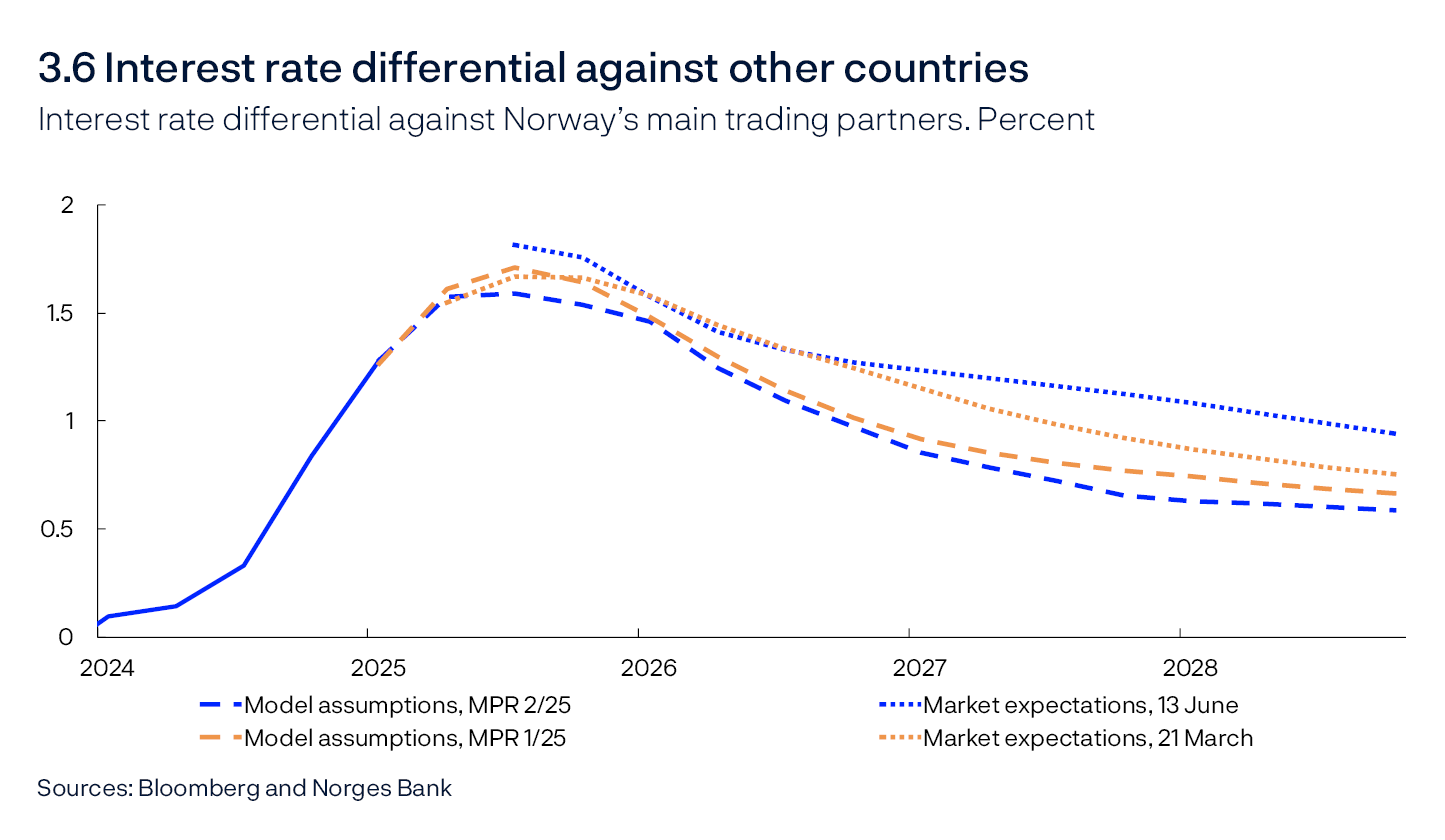
The interest rate differential against Norway’s trading partners has increased from a low level in recent years (Chart 3.6). The chart shows the interest rate differential measured both as the difference between market interest rates in Norway and abroad and between the interest rate forecast and the Bank’s assumptions for interest rates abroad. The interest rate differential based on market rates is slightly higher than in the March Report to the end of 2025 and from the beginning of 2027. At the end of the projection period, the market-based measure suggests an interest rate differential of around 0.9 percentage point. The differential based on projected policy rates and the Bank’s assumptions for interest rates abroad are on the whole slightly lower than in the March Report. At the end of the projection period, this measure suggests a differential of about 0.6 percentage point.
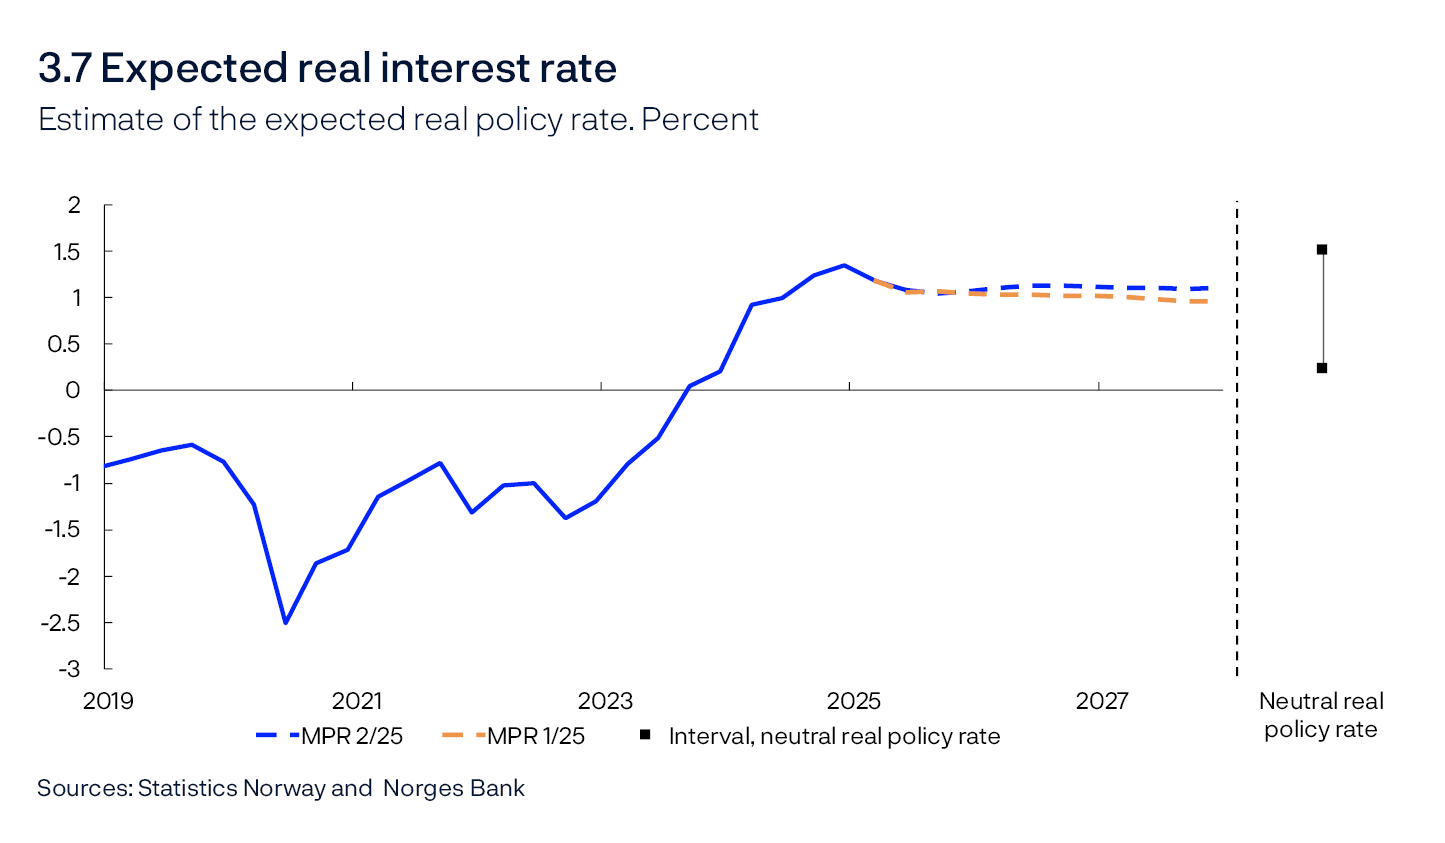
Expected real interest rate
The Bank’s estimate of the expected real policy rate is broadly unchanged from the March Report in the coming year, but slightly higher thereafter (Chart 3.7). Key factors determining developments ahead:
- The policy rate forecast is slightly lower in the near term but slightly higher towards the end of the projection period compared with the March Report, contributing to a somewhat lower expected real interest rate at the beginning of the projection period and a slightly higher rate towards the end.
- The inflation projections have been revised down throughout the projection period, pulling in the direction of a slightly higher expected real interest rate.
- The real policy rate lies in the interval between 0.25% and 1.5% (see “Estimates of the neutral real interest rate”).
- The expected real policy rate lies in the upper half of the interval of what we consider to be neutral in the longer term
Household and corporate interest rates
Household and corporate interest rates have been relatively stable since the beginning of 2024. Key factors in this Report are:
- The policy rate declines to just below 4% at the end of 2025 and to about 3% towards the end of the projection period (Chart 3.8).
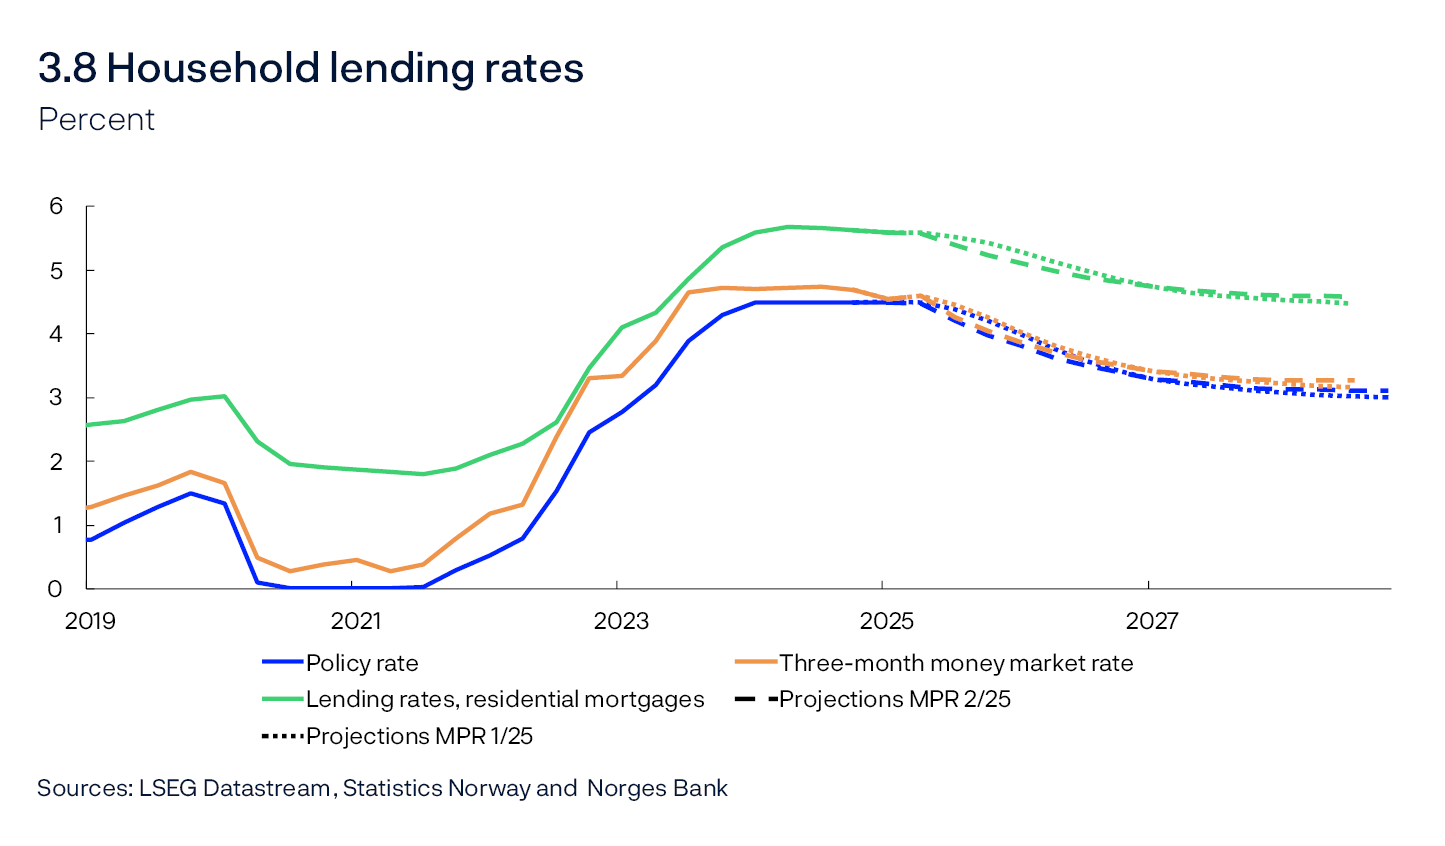
- The forecast indicates that the policy rate is slightly higher towards the end of the projection period than in the March Report.
- The money market premium is broadly as projected in the March Report, and futures prices indicate that the premium will remain at the current level ahead. The projection for the money market premium is unchanged from the March Report.
- Residential mortgage rates are projected to decline when the policy rate is reduced. The mortgage rate is projected at around 4.6% at the end of 2028.
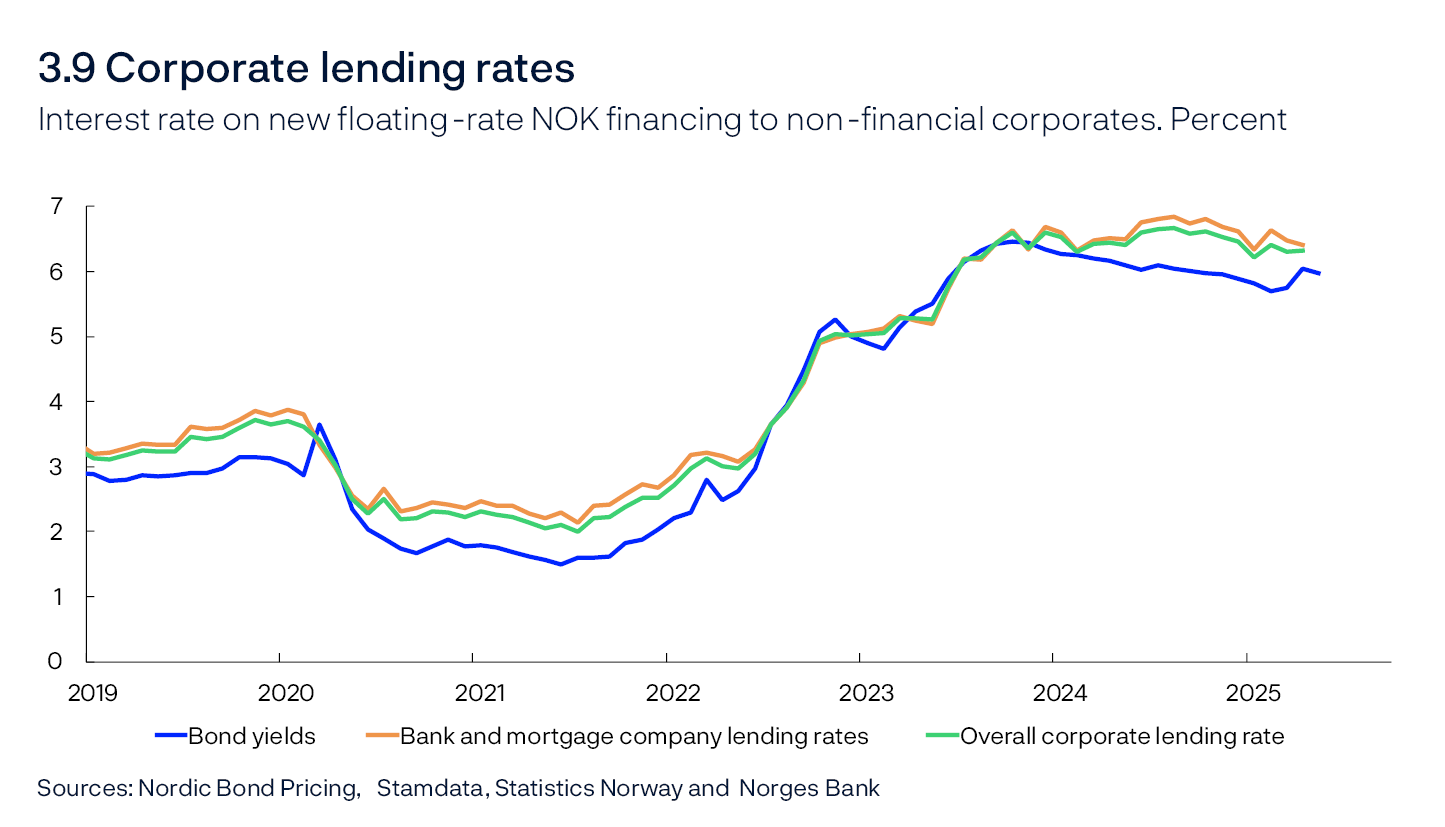
- The interest rate on new corporate loans, measured as a weighted average of bank loans and bonds, has fallen somewhat since the end of 2024 (Chart 3.9), mainly driven by lower interest rates on new bank loans.
Trade-offs between inflation, output and employment
The trade-offs between quickly returning inflation to target and contributing to high and stable output and employment are reflected in the Committee’s assessment and the inflation and output gap forecasts. The policy rate, inflation and output gap forecasts are shown in the chart in the Committee’s assessment. The points in Chart 3.10 show the average forecasts one to three years ahead for the output gap and inflation gap (the difference between inflation and the target) in different reports. The location of the points in the chart depends on the shocks to the economy and the monetary policy response.2
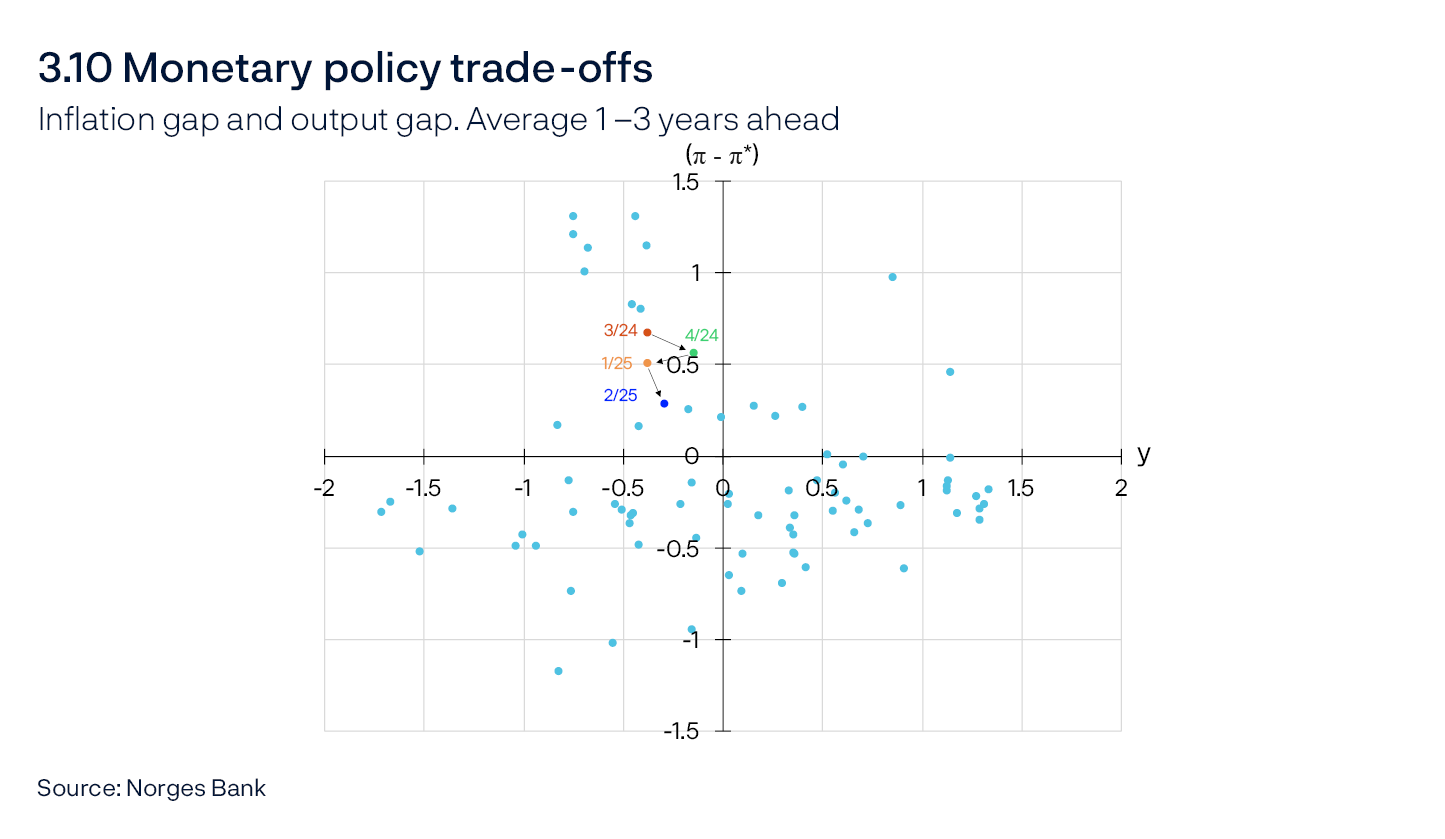
In this Report, there are prospects for somewhat lower inflation and a slightly less negative output gap than in the March Report one to three years ahead. The average gaps are somewhat smaller both due to the time interval moving one quarter ahead and changes to the economic conditions. A positive inflation gap and negative output gap in the forecasts mean that a higher policy rate path than in the forecast would bring inflation closer to target but also lead to a more negative output gap. On the other hand, a lower policy rate path would boost the activity level but bring inflation further away from target.
Historical forecasts
Forecasts are uncertain and uncertainty increases with the forecast horizon. The charts below show Norges Bank’s forecasts of the policy rate, the CPI-ATE, as a measure of underlying inflation, and the output gap over the past 20 years. In relation to each other, the three charts show how policy rate forecasts are adjusted when developments in inflation and the real economy differ from the Bank’s forecasts.
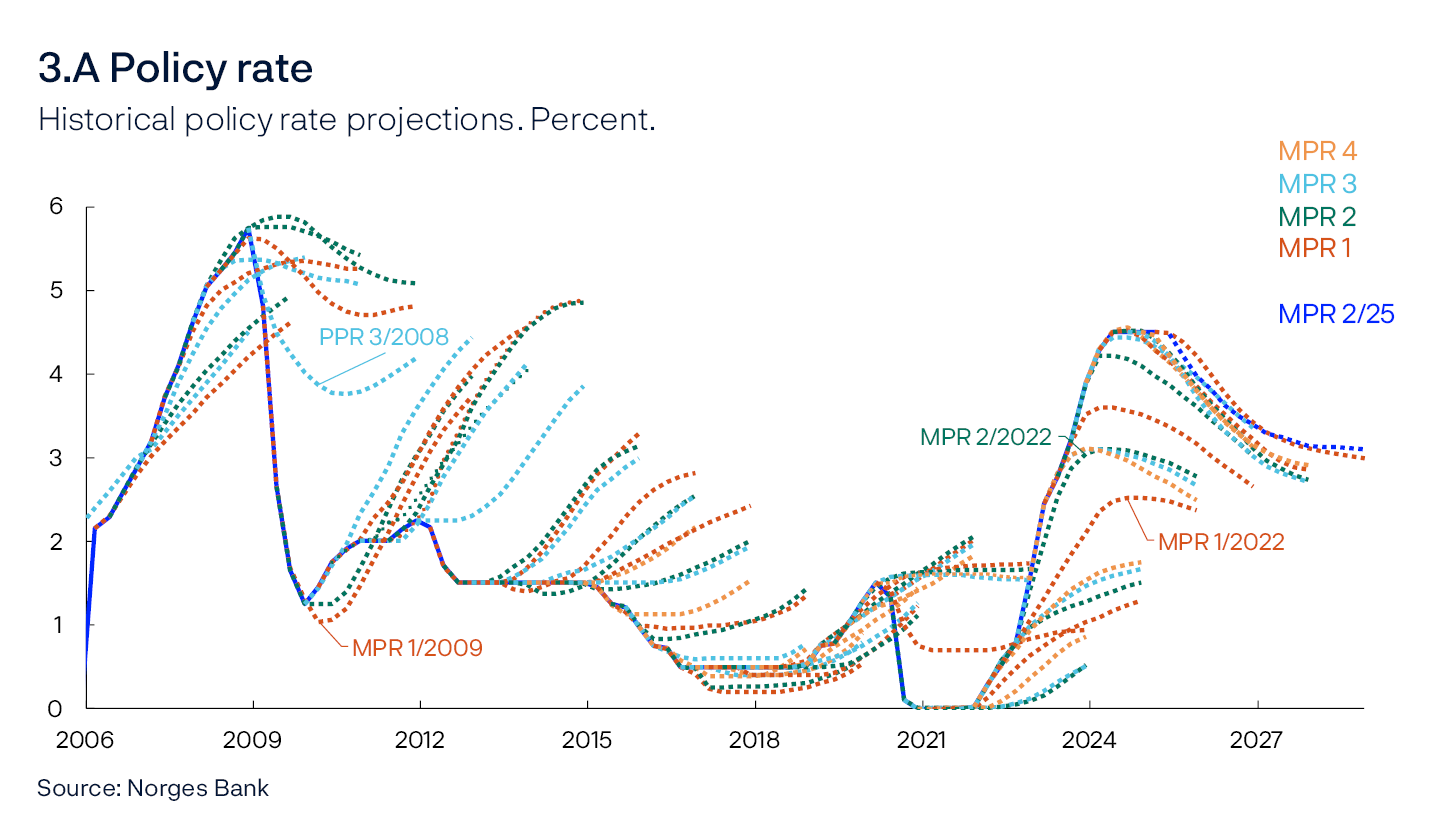
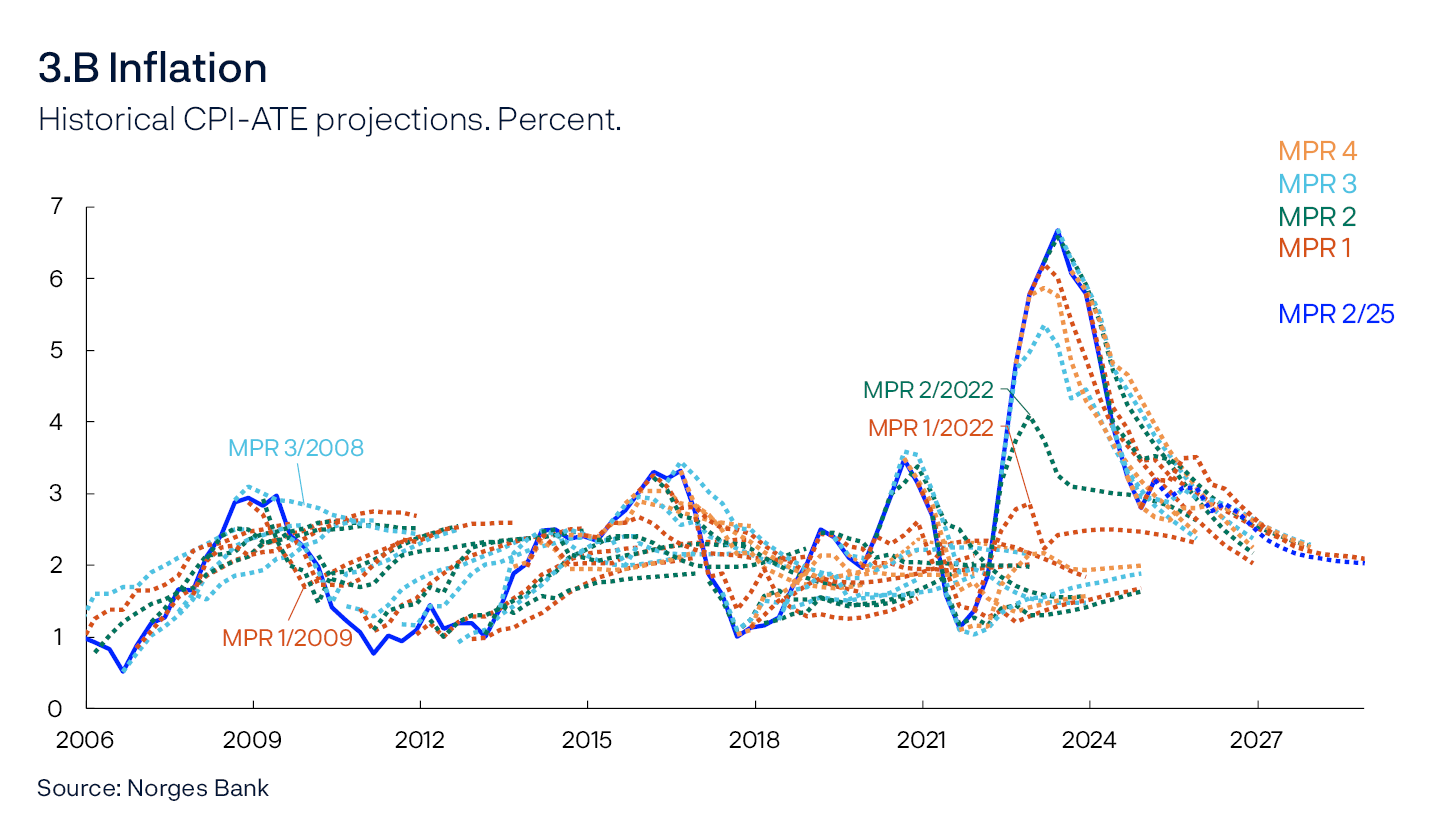
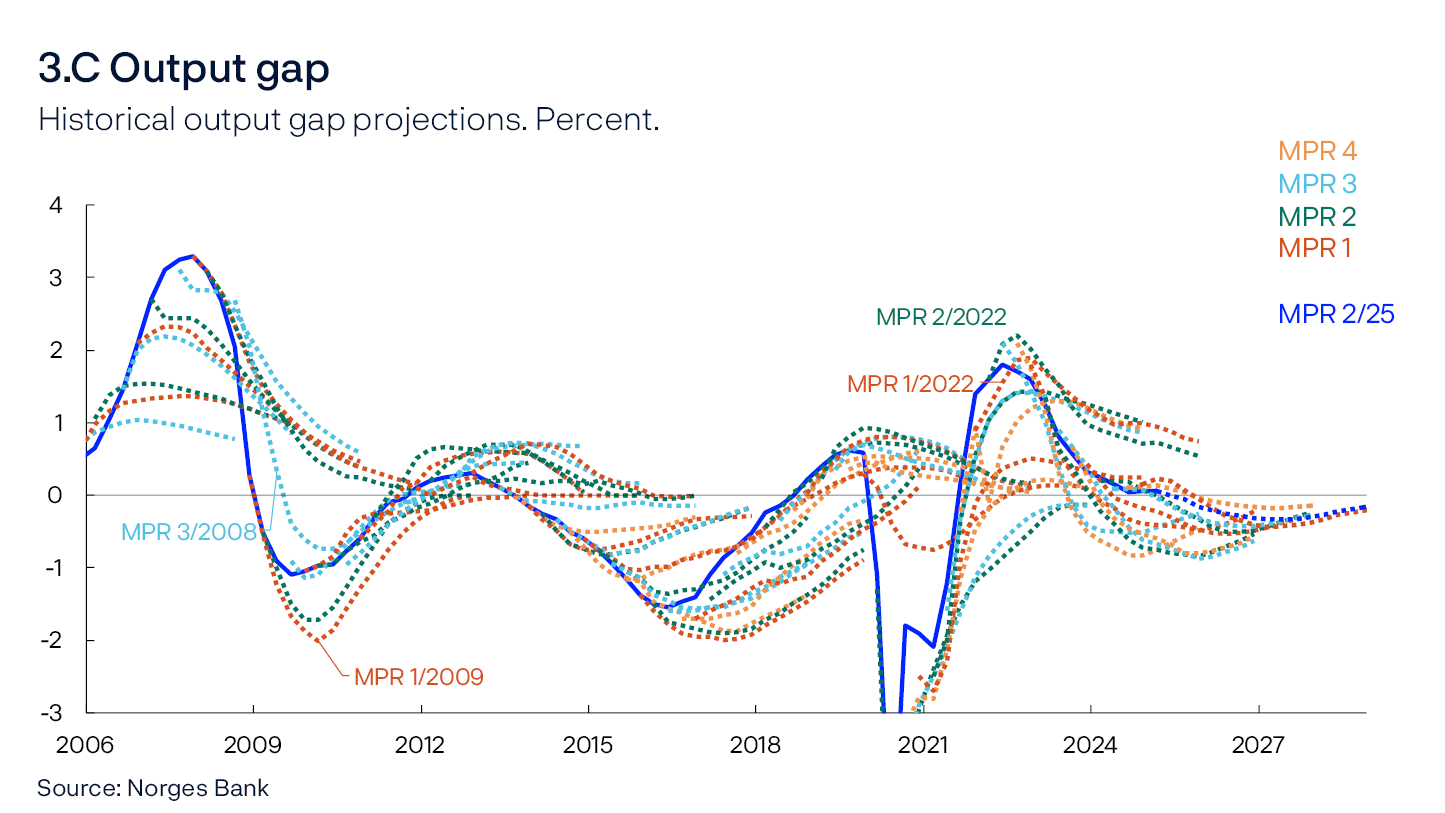
Each colour represents one of the Monetary Policy Reports published every year; dark orange represents the first Report, dark green the second Report, turquoise the third Report and yellow the fourth Report. Up until 2012, the Report was only published every four months. The blue line in the background shows actual developments in addition to the Bank’s forecasts presented in this Report. Forecasting errors occur when economic developments differ from those assumed. This may reflect new shocks or differences in the functioning of the economy from what was envisaged. For the policy rate, uncertainty about the long-term level of interest rates may have been of particular importance. For example, in the decade that followed the financial crisis, a clear downward trend in real interest rates was observed that was not as apparent when the forecasts were made.
In addition to the outbreak of the pandemic in 2020, there were two particular historical events that stand out, which are indicated in the charts. They help illustrate situations in which the policy rate path had to be changed considerably from one report to the next in order to achieve monetary policy objectives in the face of substantial disruptions. The first example is from the 2008 financial crisis. From the October 2008 Report to the March 2009 Report, Norges Bank reduced its policy rate forecast considerably so that the low point was adjusted from approximately 3.75% to about 1%. This must be viewed in the context of the Bank revising down its output gap forecasts substantially at the same time as it revised down its inflation forecasts.
The other example is from 2022 when inflation began to surge in the wake of the pandemic and Russia’s invasion of Ukraine. From the March 2022 Report to the June 2022 Report, the policy rate forecast was raised substantially, particularly in the near term. This must be viewed in the context of the Bank raising the output gap forecast to its highest level since the financial crisis at the same time as it revised up its inflation forecasts considerably.
- 2 For a more detailed explanation of the chart, see box in Section 2.4 in Norges Bank (2024) “Norges Bank’s Monetary Policy Handbook, Version 2.0”. Norges Bank Papers 3/2024.
Boxes
Developments in the mismatch between labour supply and demand
An index measuring the mismatch between labour supply and demand for different occupational groups remained at relatively high levels in the wake of the pandemic but is now close to a normal level. The index provides greater insight into labour market developments than aggregate figures for unemployed workers and job vacancies.
This box provides greater detail on how labour market developments can be better understood by using more detailed data on the number of unemployed workers and vacancies. Experience shows that there is a relationship between labour market pressures and wage growth. Low unemployment can put pressure on the labour market, which can in turn lead to higher wage growth.1 At the same time, unemployment can also decline without affecting labour market pressures, for example if there is a lower degree of mismatch between job seekers’ skills and employers’ needs.
The relationship between the number of vacancies and unemployed workers is influenced by both cyclical and more structural, long-term factors, such as matching efficiency between employers and relevant job seekers and the balance between labour supply and demand. During upturns, when there is little slack in the economy, the number of vacancies is often high and unemployment is low, while the effect is reversed in downturns.
High vacancy and unemployment rates at the same time may for example reflect an occupational mismatch between labour supply and demand or a geographical mismatch, which is when vacancies and job seekers are located in different parts of the country. This could in turn influence the relationship between unemployment and wage growth. For example, if the number of vacancies in a specific occupational group is high, then wages in that group could rise rapidly even if overall unemployment remains relatively elevated.
An illustrative example of a labour market mismatch could be a hypothetical labour market comprising nurses and construction workers. For nurses, there are 200 vacancies and 50 job seekers, and for construction workers, there are 50 vacancies and 200 job seekers. Overall, there are 250 vacancies and 250 job seekers, which can give the impression of a balanced labour market. However, a closer examination of the distribution reveals an occupational mismatch, since the majority of the vacancies require skills only held by a minority of job seekers.
To more accurately identify the determining factors of the changes in the number of vacancies and unemployed workers, an index is estimated that measures the mismatch between vacancies and unemployed workers in different labour market segments over time. This index has been developed by Sahin et al (2014)2:

Here, the number of vacancies in the labour market segment i at time t is vi,t, while the number of unemployed workers in the same period and segment is defined as ui,t. A labour market segment can for example be an occupational group or region. The index will vary with the degree of mismatch between unemployed workers and vacancies in different segments. Values close to zero indicate a low degree of mismatch, while values close to one indicate a high degree of mismatch.
In the example above with nurses and construction workers, the labour market is assumed to change in the subsequent period: For nurses, the number of vacancies decreases by 50, and for construction workers, the number increases by 50. The mismatch index would then move down from 0.2 to 0.09, while the aggregated figures for vacancies and unemployed workers remain unchanged. The index therefore captures an improved balance between unemployed workers and vacancies in the subsequent period.
At the same time, it is important to analyse developments in the index together with changes in vacancies and unemployment in the aggregate. If a factor improves the matching efficiency between unemployed workers and vacancies in all sectors simultaneously, the index will not be affected. New technology is an example of such a factor.
The index is calculated based on labour market data for 66 different occupational groups and seven regional labour markets3 (Chart A, left panel). The index’s absolute level is difficult to interpret, but by comparing with previous periods, the mismatch can be described as relatively high or low.
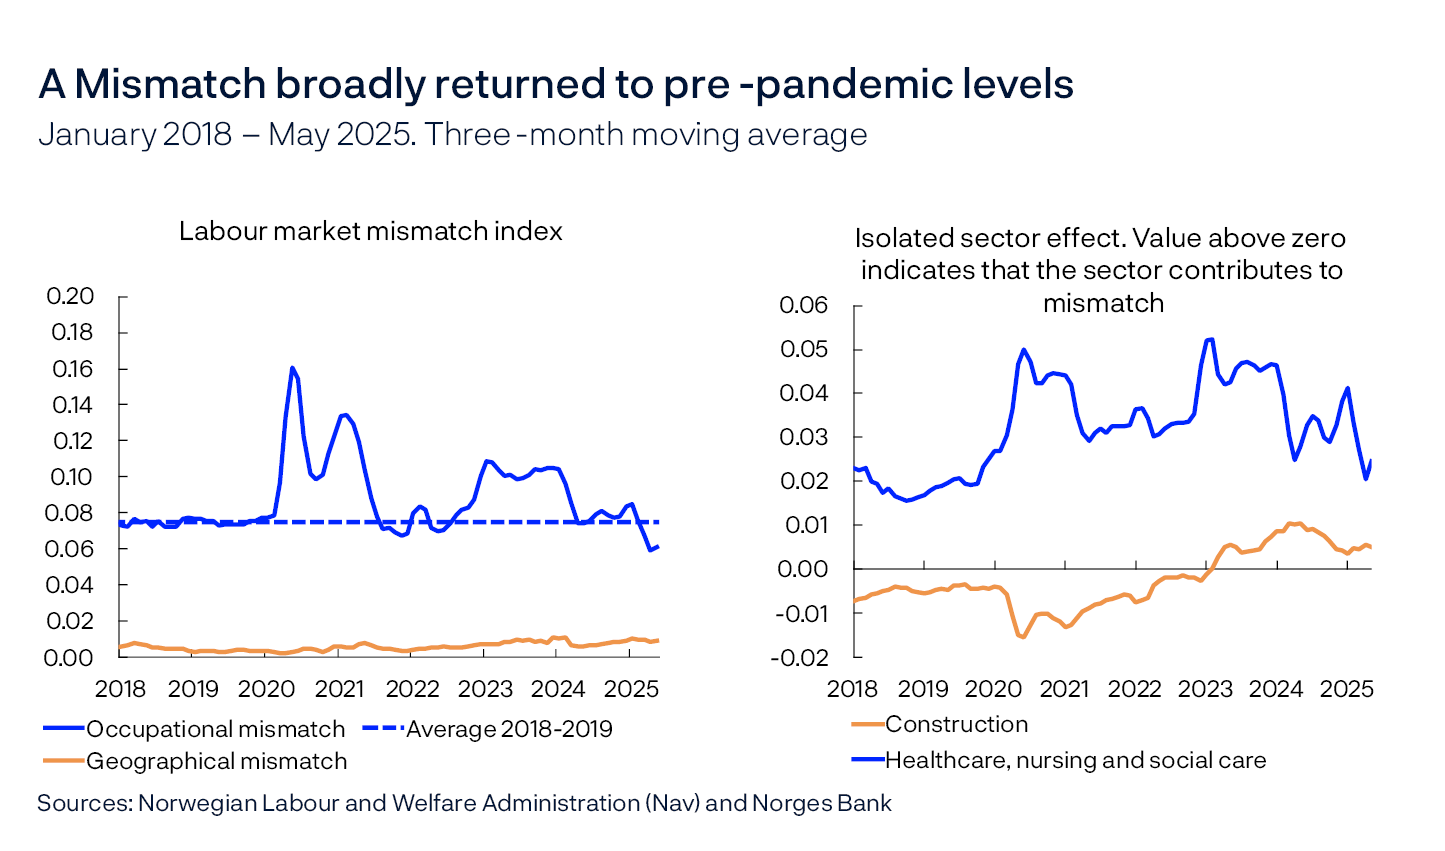
The blue line illustrates mismatch for different occupations, while the orange line shows mismatch in different regions. Results indicate a small degree of overall geographical labour market mismatch in Norway and small movements in the regional index. For the labour market as a whole, this means that the numbers of unemployed workers and vacancies in the different regions are generally well balanced. The occupational index is at a significantly higher level, suggesting a greater occupational mismatch between labour supply and demand. The analysis of the Norwegian labour market for the period between 2003 and 2013 in Kolsrud (2017)4 also finds that mismatch is more severe occupationally than geographically. It is nevertheless important to note that the degree of occupational mismatch can vary within the different regions.
According to the occupational index, mismatch was relatively stable prior to the pandemic. During the pandemic, the index spiked, primarily owing to a combination of high unemployment in food and beverage services and high demand for healthcare workers. The index remained at a relatively high level through 2023 and much of 2024 but has now returned to broadly pre-pandemic levels.
If the isolated contributions of the different sectors are estimated, the mismatch between the number of vacancies and unemployed workers is particularly pronounced in the healthcare sector (Chart A, right panel).5 This has pushed up the index value throughout the entire estimation period, particularly in the wake of the pandemic. The number of unemployed workers and vacancies in construction have long been well balanced, but this sector has in isolation also pushed up the index since the beginning of 2023.
Developments in the index are driven by movements in the number of unemployed workers or in the number of vacancies in different occupational groups. For the healthcare sector, the mismatch over time can be attributed to a high number of vacancies and few unemployed workers (Chart B, left panel). Labour demand in this sector has been substantial over time. Unlike in healthcare, recent developments in construction are attributable to the fact that unemployment has risen without a rise in demand (Chart B, right panel), likely reflecting the substantial decline in housing investment in recent years.
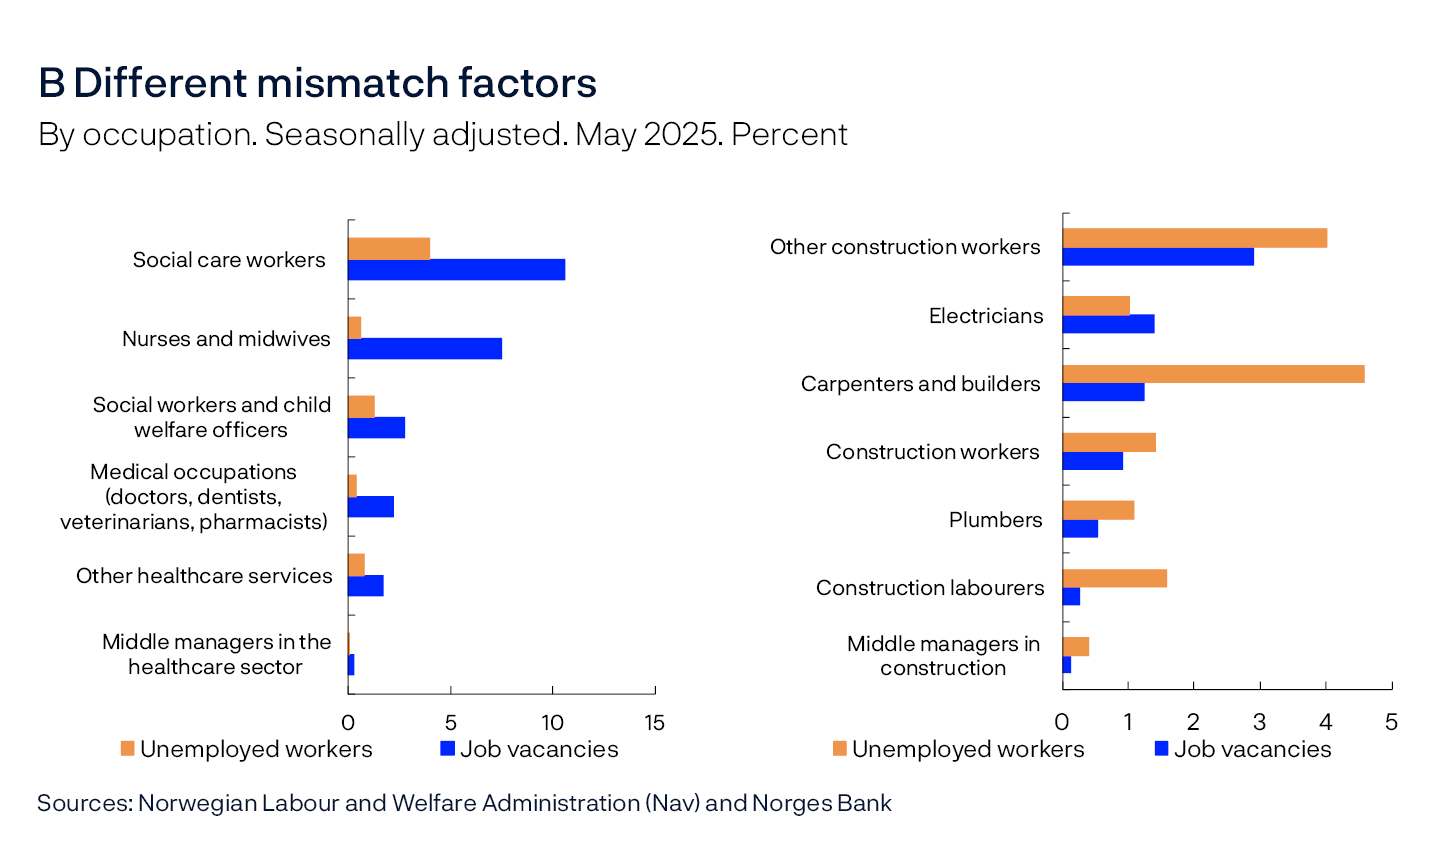
Examining occupational sub-indices over time helps in determining whether developments in the composite index reflect long-term factors or more transient shocks. High demand for labour in healthcare is a more persistent structural factor, while higher unemployment in construction is driven to a greater extent by cyclical developments.
Looking ahead, labour demand in construction is expected to pick up in line with higher housing investment, likely moderating the degree of mismatch between unemployment and vacancies. At the same time, it may seem as though demand for healthcare workers will remain elevated, which is also likely to continue pushing up the index ahead. Overall, it is assumed that the balance between unemployment and vacancies does not change substantially in the period ahead and remains close to pre-pandemic levels. Developments are in line with unchanged projections for the level of unemployment consistent with output at potential and do not suggest higher wage pressures at a given level of unemployment.
- 1 See eg Brubakk, L. and K. Hagelund (2022) “Frontfagets betydning for lønnsdannelsen i private tjenestnæringer” [Importance of the wage norm for wage determination in private services]. Staff Memo 5/2022. Norges Bank (in Norwegian only).
- 2 The method follows Şahin, A., J. Song, G. Topa. and G.L. Violante Mismatch Unemployment, American Economic Review, 104 (11), pages 3529–3564.
- 3 Based on Norges Bank’s Regional Network regions.
- 4 The same method as Sahin et al (2014) is also used here for annual Norwegian data for the period between 2003 and 2017. Kolsrud, D. (2017) “Har innvandrere bidratt til bedre balanse mellom tilbud av og etterspørsel etter arbeidskraft i det norske arbeidsmarkedet – hva kan en enkel indikator fortelle?” [Have immigrants improved the balance between Norwegian labour market supply and demand – what can a simple indicator explain?] Søkelys på arbeidslivet 34(3), pages 182–198 (in Norwegian only).
- 5 The isolated contribution is estimated by examining differences in each individual sector’s index value both with and without the vacancies and unemployed workers in the sector’s different occupations.
Pass-through from factor costs to consumer prices
Understanding the extent and speed of pass-through of changes in wages and other costs to consumer prices is important in assessing the inflation outlook. We find that increased labour costs contribute to a significant increase in consumer services prices over time, while consumer goods prices are affected less. An increase in intermediate input prices, however, becomes evident relatively quickly in both goods and consumer services prices.
High consumer price inflation in the wake of the pandemic was originally driven by higher energy prices and a marked increase in imported consumer and intermediate goods prices. In spite of softer imported inflation over the past year, consumer price inflation – as measured by the CPI – is still above target, partly reflecting high wage growth and weak productivity growth.
Over time, producer prices will to a large extent reflect developments in intermediate input costs, ie goods and services involved in production, as well as wages and capital costs. However, the extent to and the speed at which the higher factor costs1 pass through to producer prices and subsequently to consumer prices, is uncertain. In this box, we present an analysis where we estimate the pass-through from wages and intermediate input prices to consumer prices.
In many theoretical models, the pass-through from a given factor cost to producer prices reflects the factor share, ie the factor cost relative to the output value. For example, it is natural to suppose that changes in labour costs explain a large share of the price changes in many services, where the wage share is often relatively high. In goods-producing industries – such as manufacturing – intermediate input prices are relatively more important.
Producer prices are the prices firms receive for goods and services they sell, either to other domestic firms in the form of intermediate inputs or to satisfy final demand – including products for household consumption. If we disregard VAT and net product taxes, each individual consumer price included in the calculation of the consumer price index is at the same time the producer price of one individual firm. Consumer prices will therefore, like producer prices, depend on factor costs.
Normally, it will take some time for changes in factor costs to fully pass through to producer prices – and thus consumer prices. There may be a number of reasons why firms do not immediately pass on increased costs to their prices. One reason may be that they consider the cost increase to be temporary, and another is that they wish to maintain market shares. Some prices are also locked in by previous agreements and will therefore only be changed when the agreement expires.
To analyse the pass-through from intermediate input prices and wages to consumer prices, we quantify a set of regression equations. These equations postulate that changes in consumer prices from quarter t to t+h (h=1,…,16) depend on the change in intermediate input prices and labour costs per hour in quarter t, in addition to a set of control variables.2 The figures for wages and intermediate input prices are derived from quarterly national accounts data for the period 1995 Q1 to 2024 Q2.
To take into account to some extent that factor shares, and thereby the pass-through, can vary across sectors, we model developments in the consumer goods price index and the consumer services price index separately. In the equations for the consumer services price index, we use intermediate input prices and wages for services excluding retail trade as explanatory variables. In the equations for the consumer goods price index, we apply corresponding factor prices from retail trade and from the food, beverage and tobacco industry, which is the largest domestic producer of consumer goods. In addition, we control for the prices of imported consumer goods, as measured in Statistics Norway’s external trade statistics.3
The estimated impulse responses indicate that the pass-though from wages to services prices is significant, but slow (Chart C). In isolation, a wage increase of 1% in a given quarter lifts consumer services prices by approximately 0.5% after three to four years. The long-term pass-through roughly reflects the wage share in services. The effects of intermediate input prices are more muted, but appear sooner. The pass-through is slightly weaker than implied by the intermediate input share.
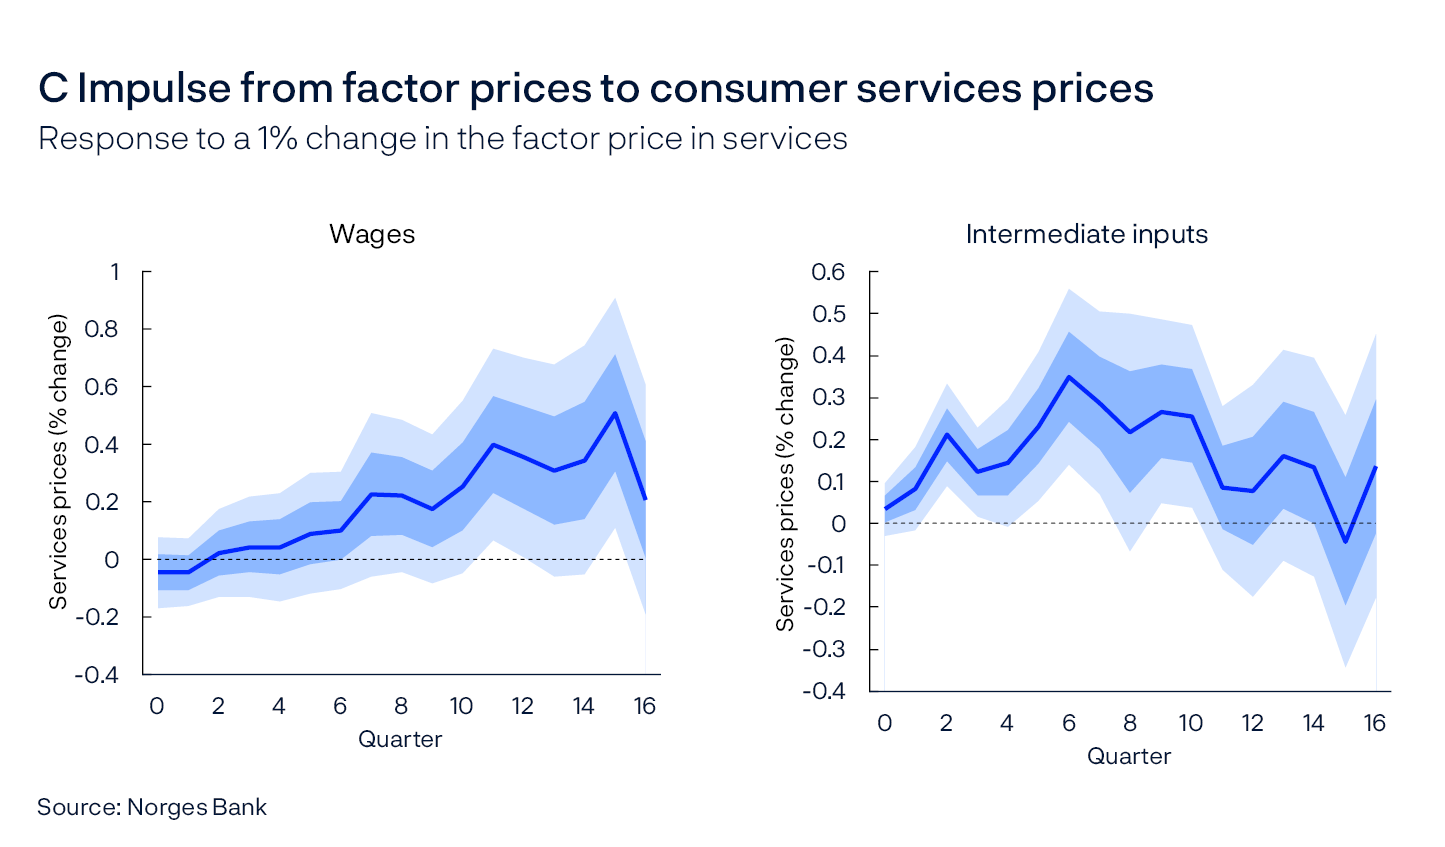
The situation is different for consumer goods prices (Chart D). Although estimates indicate a positive correlation between changes in hourly labour costs in quarter t and accumulated changes in consumer goods prices further out, the estimates are not significantly different from zero for any of the horizons. On the other hand, we find a significant and rapid pass-through from intermediate input prices to consumer goods prices.4 The estimates are well in line with intermediate input content in consumer goods prices.
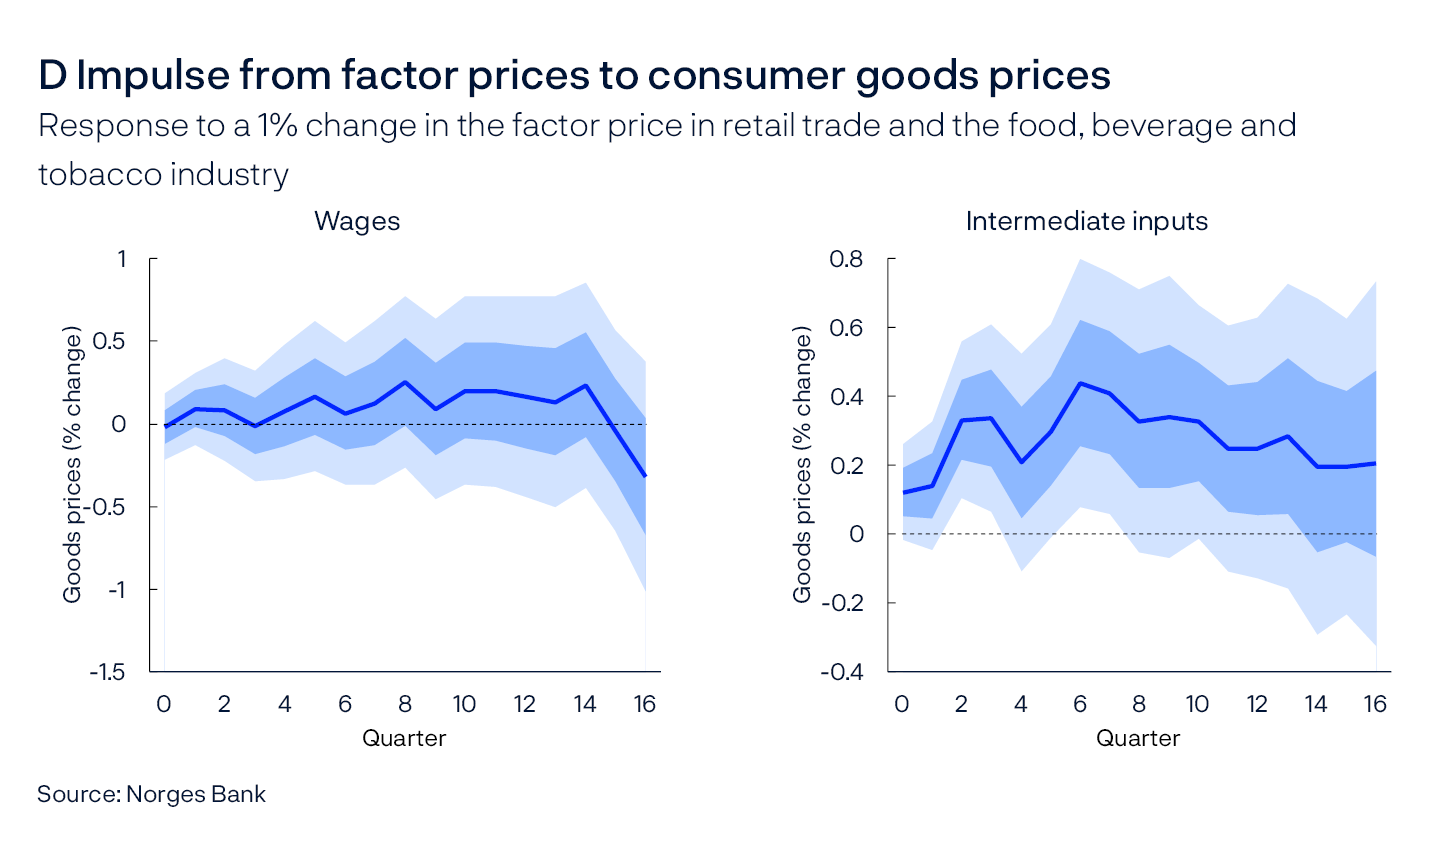
Intermediate inputs in a given industry are either imported or domestically produced. Intermediate input prices therefore also to some extent reflect accumulated domestic wage growth, but most of the variation appears to be external. Not least, there is a close correlation between growth in intermediate input prices for mainland Norway and Norges Bank’s indicator of international price impulses to imported intermediate goods (IPI) (Chart E).
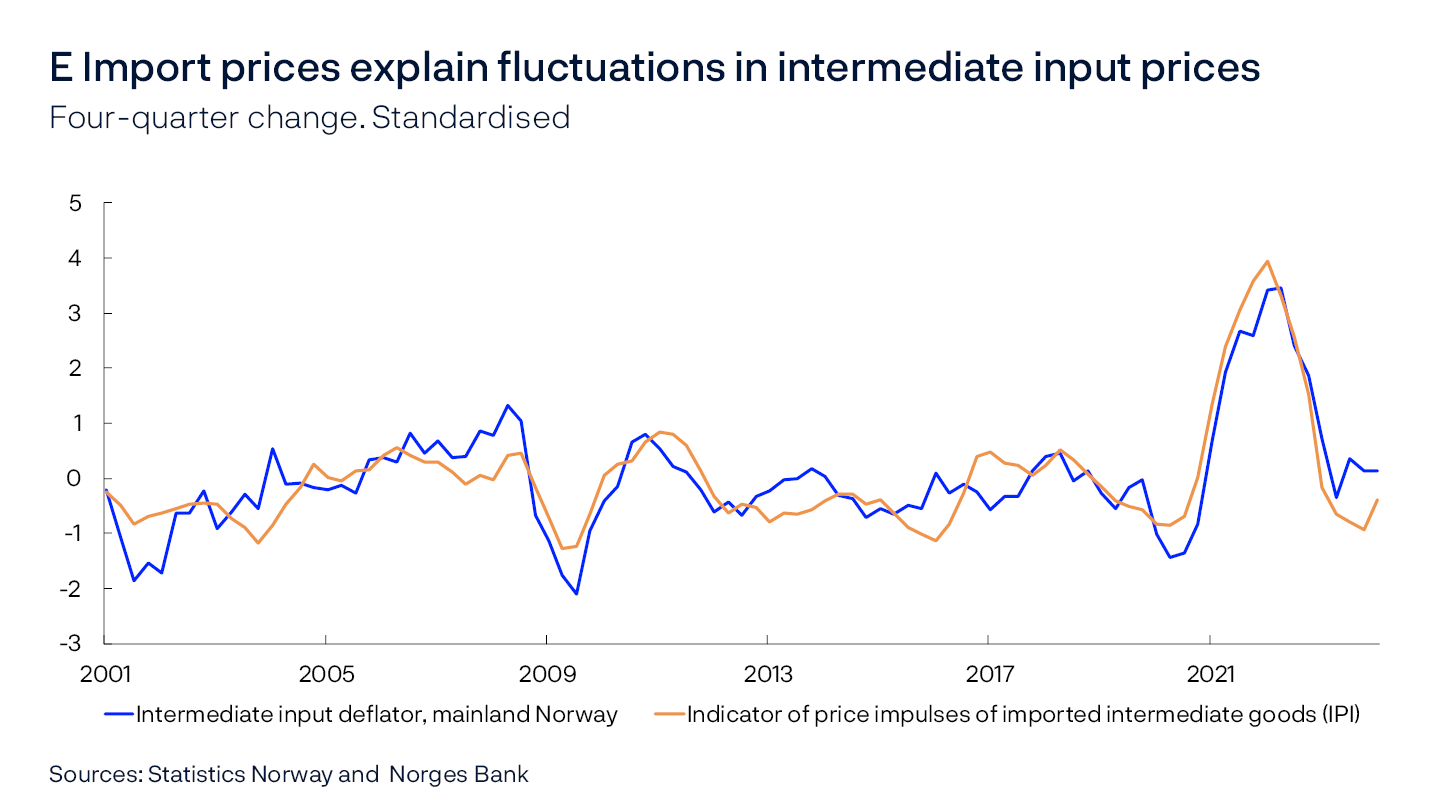
Our estimates are line with the findings of two recent studies based on US data. Chin and Li (2023)5 report positive pass-through from wages to consumer services prices but do not find any significant effect for consumer goods prices. Heise et al (2022)6 look at wage pass-through to producer prices in services and goods-producing industries, respectively. They find clear effects of wages on producer prices in services but little impact on producer prices in goods-producing industries.
Strong rent and consumer services inflation currently contribute to holding consumer price inflation elevated. Given the high wage growth over the past couple of years, the results of this analysis indicate that it may take time for consumer services inflation to decline. The analysis also confirms the importance of monitoring intermediate input prices in addition to wage developments.
In this box, we quantify a relationship between changes in a given factor price from quarter t-1 to t and subsequent changes in consumer prices h quarters further out. However, the correlation cannot necessarily be interpreted as causal. One possibility is that there are other underlying drivers influencing both consumer prices and factor prices. Nevertheless, for forecasting purposes, it may be sufficient that a significant correlation exists between historical factor prices and changes in consumer prices further out. Moreover, empirical analyses are subject to uncertainty. Some of this uncertainty is reflected in the relatively wide confidence bands in Charts C and D. Alternative specifications may, however, yield different conclusions and the results must therefore be interpreted with caution.
- 1 In this box, costs related to firms’ intermediate inputs are defined as part of the factor costs.
- 2 The analysis is based on Heise, S., F. Karahan and S. Ayşegül (2022) “The Missing Inflation Puzzle: The Role of the Wage-Price Pass-Through”. Journal of Money, Credit and Banking, 54 (S1), page 7-51, February, and Chin, M. and L. Lin (2023) “The Pass-through of Wages to Consumer Prices in the COVID-19 Pandemic: Evidence from Sectoral Data in the U.S”. IMF Working Papers 233/2023. International Monetary Fund. Control variables include productivity growth and lagged values of changes in consumer prices and factor prices. See Documentation Note 3/2025 “Pass-through from factor costs to consumer prices” (forthcoming Friday, 21 June) for more details.
- 3 Consumer goods prices reflect both the costs related to the intermediation services produced in retail trade and the producer prices of the consumer good itself. The latter is determined by the factor costs in goods-producing industries– of which the food, beverage and tobacco industry is the largest – in addition to the prices of imported consumer goods. The wage share in goods-producing industries is, however, generally low. There is therefore reason to expect that the wage pass-through to consumer goods prices is less than the pass-through to consumer services prices.
- 4 The results also show – perhaps unsurprisingly – a significant positive contribution from imported consumer goods prices (not shown).
- 5 See reference in footnote 2.
- 6 See reference in footnote 2.
Estimates of the neutral real interest rate
The neutral real policy rate (r*) has been revised up and currently lies in the interval between 0.25% and 1.5%. r* is unobservable and estimates will be subject to considerable uncertainty. In light of this uncertainty, we have widened the interval.
As an aid in assessing what the policy rate will converge towards when the economy is no longer influenced by disturbances1, we estimate the neutral real policy rate (r*).2 r* is the real interest rate consistent with output at its potential level and inflation at target. Developments in r* are determined by structural factors that affect overall saving and investment in the economy. Norway is a small open economy, and with free capital movements between countries, there is reason to assume that developments in r* in Norway will not be substantially different from developments abroad.
Over the past 20 years, there have been a number of explanations for developments in r* among central banks and in academia. The developments can be divided into two periods: one from the global financial crisis in 2008 up to 2020, and one from 2020 to the present.
In the period after the financial crisis, r* estimates declined markedly in many countries. The research literature highlights that global trends such as lower productivity growth, demographic changes and rising inequality may have contributed to this decline. In addition, it is pointed out that the recovery following the financial crisis, with more risk aversion and the desire to reduce debt, may have also been a contributing factor. Overall, these factors pull in the direction of lower investment demand and higher saving ratios that may collectively explain why r* estimates have declined in this period.
New estimates may suggest that r* has begun to rise again since 2020. Many of the global trends mentioned above contribute to keeping r* low, but likely to a lesser extent than previously. The Bank for International Settlements (BIS) emphasises that the current tendency is a gradual rising dependency burden compared with the first period and that large pension obligations push up investment and borrowing needs in the long term. A number of central banks highlight that expansive fiscal policies have resulted in higher government borrowing needs. Furthermore, higher global investment related to the green transition, infrastructure and defence spending may have boosted demand for capital. Looking ahead, technological advances, for example related to artificial intelligence, may result in higher productivity growth.
r* is unobservable and must be estimated. The relationship between individual factors and estimates of r* can be unstable and difficult to identify. A number of central banks have recently published new estimations of the neutral real interest rate (see Chart F for new intervals).3 The Bank of England (BoE) previously operated with an interval of between 0% and 1% but has revised up its estimate to an interval of between 0.25% and 1.75%. Sveriges Riksbank assumes a neutral real interest rate with an interval of between −0.5% and 1%. The European Central Bank (ECB) has estimated a level at around 0%, with an interval of between −0.5% and 0.5%, while the Federal Reserve (FED) has recently indicated an increase to around 1%, with an interval of between 0.5% and 1.9%. Norway’s trading partners operate with an average interval of between around -0.2% and 1%.4 Market-based measures of expected real interest rates5 have risen from very low levels both internationally and in Norway (Chart G).


We examine both market interest rates and model-based estimates when assessing r*. So far in 2025, five-year rates, five years ahead adjusted for inflation expectations, have been around 1.7% in Norway (Chart G). It is likely that this measure cannot be assumed to be a direct indication of market expectations of future policy rates, partly because long-term rates reflect more than just expectations of future policy rates – they are also influenced by term premiums that can vary over time. The term premium is a risk premium that partly reflects uncertainty about future interest rate levels and is the investor’s compensation for assuming higher risk. Norges Bank has therefore expanded its model portfolio to include models that will control for term premiums in the estimate of r*. In the models, the term premium is estimated to have increased in recent years,6 in line with estimates from other countries.7 Chart H shows the average of our model-based estimates of the neutral real money market rate, together with an uncertainty interval around this estimate.8 In Monetary Policy Report 2/2024, the average model estimate for 2024 was 0.1. With the expanded model portfolio, the estimate for 2025 now stands at 0.4. The uncertainty interval for the estimate in 2025 lies between -0.5% and 1.85%.
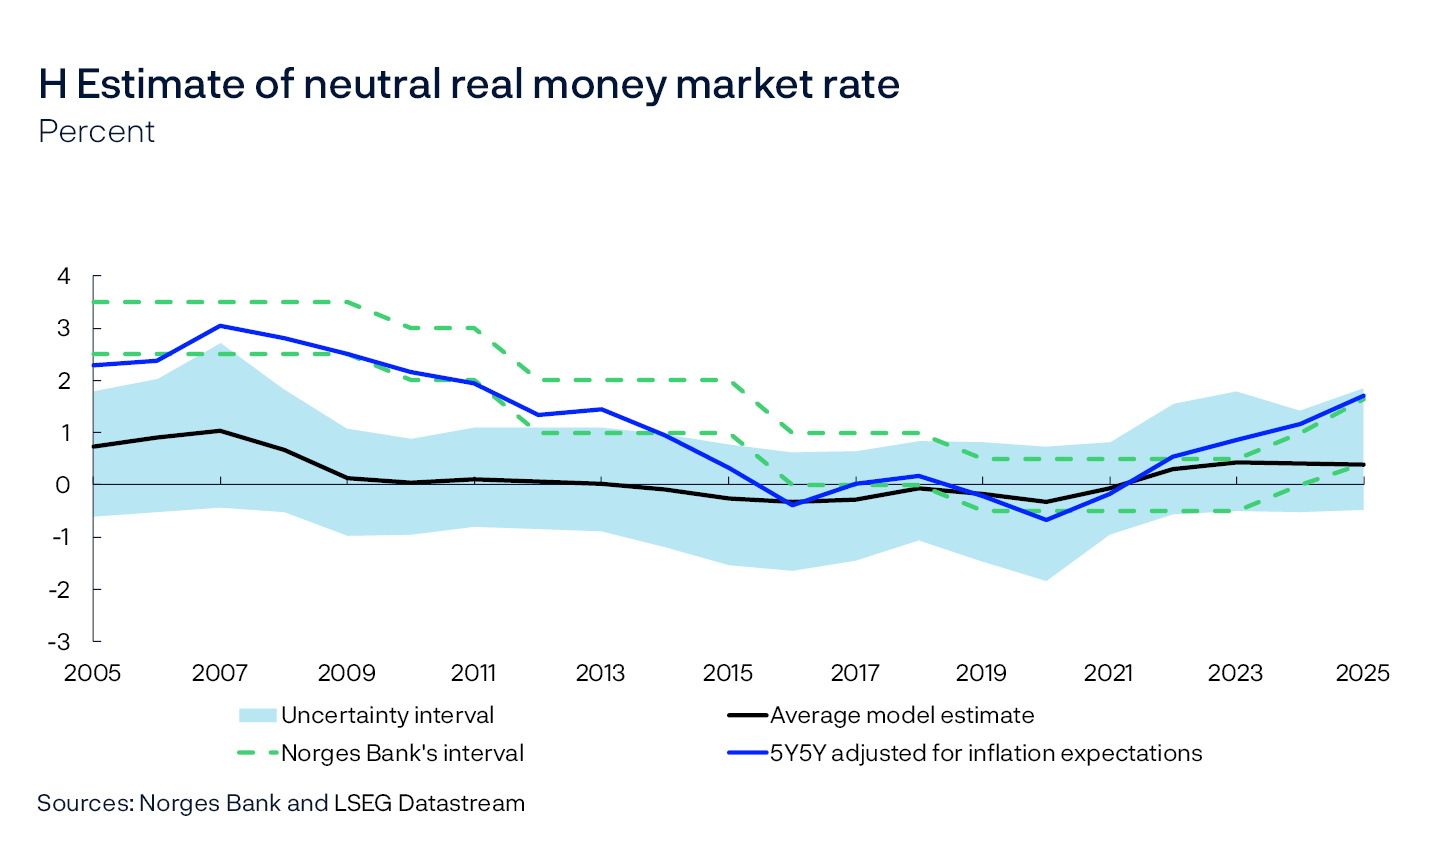
In line with the increase in the model estimates and market rates, we have revised up the interval for r*. In light of the considerable uncertainty, we are widening the interval somewhat. In Monetary Policy Report 2/2024, we assumed that r* was in the interval between -0.3% and 0.7%. In the March Report this year, the interval was between -0.15% and 0.85% owing to a lower money market premium. Based on the updated model portfolio and new information, r* is now assessed to lie in the interval between 0.25% and 1.5%. This implies an interval for the expected nominal policy rate of between 2.25% and 3.5% somewhat further ahead given an inflation target of 2%. The broken green lines represent Norges Bank’s interval for the neutral real money market rate.
- 1 In practice, the time it takes the effect of different disturbances to fade will vary. See “Norges Bank’s Monetary Policy Handbook, Version 2.0”. Norges Bank Papers 3/2024.
- 2 For a more detailed review of r*, and the literature this box builds on, see Almlid, E., S. Asshoff (2025) “Estimating the Neutral Rate of Interest in Norway”. Staff Memo 8/2025. Norges Bank. This Staff Memo will be published on Friday 20 June.
- 3 See Monetary Policy Report, February 2025. Bank of England. Seim, A (2024). Neutral Interest Rate – Meaning, Limitations and Assessment. Sveriges Riksbank, 26 November. Brand, C., N. Lisack, and F. Mazelis(2025) “Estimates of the Natural Interest Rate for the Euro Area: An Update”, ECB Economic Bulletin 1/2025. Federal Open Market Committee (2025) “FOMC Economic Projections March 2025”. Board of Governors of the Federal Reserve Bank, 19 March 2025.
- 4 The average is import-weighted, weighted by the four countries’ relative I-44 weights. To estimate the relative weights for these four trading partners, we use each country’s share of the sum of the four countries’ share in I-44. This results in relative weights whose total is summed up to 1. The most recent weights available: Euro area countries (0.58), Sweden (0.11), US (0.26), UK (0.05).
- 5 The focus here is five-year rates five years ahead. Adjusted for inflation expectations, these can serve as the basis of a market-based measure of a neutral real interest rate.
- 6 For example, one of the models in our model portfolio for the neutral real interest rate estimates that the term premium on Norwegian 10-year government bonds has increased by 0.45 percentage point over the past year, and slightly more than 2.2 percentage points since their lowest level in 2020.
- 7 See “OECD Economic Outlook, Volume 2025 Issue 1.” OECD (2025). “Term structures in economic analysis”. Deutsche Bundesbank (2023). Deutsche Bundesbank Monthly Report January 2023.
- 8 The uncertainty interval reflects the endpoints of the models’ confidence intervals and provides a measure of total model uncertainty. The models’ confidence intervals are estimated based on one standard deviation.
Annex
Detailed tables of projections
Table 1 International projections
|
Change from projections in Monetary Policy Report 1/2025 in brackets |
Weights1 Percent |
Percentage change from previous year |
||||
|---|---|---|---|---|---|---|
|
2024 |
2025 |
2026 |
2027 |
2028 |
||
|
GDP |
||||||
|
US |
12 |
2.8 (0) |
1.6 (-0.3) |
1.4 (-0.3) |
1.8 (0) |
1.7 (0.1) |
|
Euro area |
47 |
0.8 (0) |
1 (0.1) |
1.2 (-0.2) |
1.4 (-0.1) |
1.3 (-0.1) |
|
UK |
15 |
1.1 (0.2) |
1.1 (0.1) |
1.1 (-0.4) |
1.3 (-0.1) |
1.2 (-0.1) |
|
Sweden |
18 |
1 (0) |
1.3 (-0.5) |
2.2 (-0.1) |
2.1 (-0.1) |
2.1 (0.5) |
|
China |
8 |
5 (0) |
4.5 (0) |
3.8 (0) |
4.1 (0.1) |
3.8 (0.1) |
|
5 trading partners1 |
100 |
1.5 (0.1) |
1.4 (-0.1) |
1.6 (-0.2) |
1.8 (-0.1) |
1.7 (0.1) |
|
Prices |
||||||
|
Underlying inflation2 |
3 (0) |
2.6 (0) |
2.3 (0.1) |
2.2 (0.1) |
2.1 (0) |
|
|
Wage growth2 |
4.4 (0) |
3.4 (0) |
3.2 (0) |
3 (0) |
2.9 (0) |
|
|
Prices for consumer goods imported to Norway,including freight rates3 |
2.7 (0) |
0.2 (-0.8) |
0.5 (-0.2) |
0.7 (0) |
0.9 (0) |
|
|
Prices for intermediate goods imported to Norway4 |
0.1 (0) |
0.7 (-1.1) |
0.8 (-0.9) |
1.5 (0) |
1.5 (0) |
|
Table 2a Consumer prices. Twelve-month change. Percent
|
2025 |
|||||||
|---|---|---|---|---|---|---|---|
|
Mar |
Apr |
May |
Jun |
Jul |
Aug |
Sep |
|
|
Consumer price index (CPI) |
|||||||
|
Actual |
2.6 |
2.5 |
3.0 |
||||
|
Projections MPR 1/25 |
2.7 |
2.7 |
2.7 |
2.9 |
|||
|
Projections MPR 2/25 |
3.1 |
3.1 |
3.5 |
3.7 |
|||
|
CPI-ATE |
|||||||
|
Actual |
3.4 |
3.0 |
2.8 |
||||
|
Projections MPR 1/25 |
3.4 |
3.2 |
3.1 |
3.2 |
|||
|
Projections MPR 2/25 |
3.1 |
3.1 |
3.1 |
3.1 |
|||
Sources: Statistics Norway and Norges Bank
Table 2b House prices. Monthly change. Seasonally adjusted. Percent
|
2025 |
|||||||
|---|---|---|---|---|---|---|---|
|
Mar |
Apr |
May |
Jun |
Jul |
Aug |
Sep |
|
|
Actual |
0.1 |
-0.2 |
0.0 |
||||
|
Projections MPR 1/25 |
0.7 |
0.6 |
0.5 |
0.5 |
|||
|
Projections MPR 2/25 |
0.2 |
0.4 |
0.5 |
0.6 |
|||
Sources: Eiendomsverdi, Finn.no, Real Estate Norway and Norges Bank
Table 2c Registered unemployment (rate). Percent of labour force. Seasonally adjusted
|
2025 |
|||||||
|---|---|---|---|---|---|---|---|
|
Mar |
Apr |
May |
Jun |
Jul |
Aug |
Sep |
|
|
Actual |
2.0 |
2.0 |
2.1 |
||||
|
Projections MPR 1/25 |
2.0 |
2.0 |
2.0 |
2.0 |
|||
|
Projections MPR 2/25 |
2.1 |
2.1 |
2.1 |
2.1 |
|||
Sources: Nav and Norges Bank
Table 2d GDP for mainland Norway. Quarterly change.1 Seasonally adjusted. Percent
|
2024 |
2025 |
|||
|---|---|---|---|---|
|
Q4 |
Q1 |
Q2 |
Q3 |
|
|
Actual |
-0.4 |
1.0 |
||
|
Projections MPR 1/25 |
0.6 |
0.4 |
||
|
Projections MPR 2/25 |
0.3 |
0.4 |
||
- 1 Quarterly figures based on monthly national accounts.
Sources: Statistics Norway and Norges Bank
Table 3 Projections of main economic aggregates
|
Change from projections in Monetary Policy Report 1/2025 in brackets |
Percentage change from previous year (unless otherwise stated) |
|||||
|---|---|---|---|---|---|---|
|
Constant 2022 prices (NOK bn) 2024 |
2024 |
Projections |
||||
|
2025 |
2026 |
2027 |
2028 |
|||
|
Prices and wages |
||||||
|
CPI |
3.1 |
3.0 (0.0) |
2.2 (-0.5) |
2.3 (-0.2) |
2.1 (0.0) |
|
|
CPI-ATE |
3.7 |
3.1 (-0.3) |
2.7 (-0.2) |
2.2 (-0.1) |
2.1 (0.0) |
|
|
Annual wages |
5.6 |
4.5 (0.0) |
4.1 (0.1) |
3.6 (0.0) |
3.3 (0.0) |
|
|
GDP deflator, mainland Norway |
3.5 |
3.6 (-0.7) |
3.8 (0.0) |
3.1 (-0.2) |
2.7 (-0.2) |
|
|
Real economy1 |
||||||
|
Gross domestic product (GDP) |
5858 |
2.1 |
0.1 (-2.2) |
1.0 (1.0) |
0.3 (0.3) |
-0.2 (0.1) |
|
GDP, mainland Norway2 |
3729 |
0.6 |
1.6 (0.4) |
1.4 (0.2) |
1.4 (0.0) |
1.4 (0.0) |
|
Output gap, mainland Norway (level) |
0.1 |
0.0 (-0.1) |
-0.3 (0.0) |
-0.3 (0.1) |
-0.2 (0.1) |
|
|
Employment, persons, QNA |
0.5 |
0.9 (0.1) |
0.7 (0.2) |
0.7 (0.0) |
0.7 (0.0) |
|
|
Registered unemployment (rate, level) |
2.0 |
2.1 (0.1) |
2.2 (0.0) |
2.2 (0.0) |
2.1 (0.0) |
|
|
Demand1 |
||||||
|
Mainland demand2 |
3755 |
0.3 |
2.0 (0.3) |
2.8 (0.2) |
2.4 (0.1) |
1.9 (0.0) |
|
– Household consumption |
1861 |
1.3 |
2.9 (0.7) |
2.2 (-0.3) |
1.9 (0.0) |
1.6 (0.0) |
|
– Business investment |
383 |
-2.9 |
1.3 (-0.4) |
3.6 (0.8) |
3.2 (0.8) |
1.9 (-0.6) |
|
– Housing investment |
157 |
-19.1 |
-6.4 (5.0) |
9.9 (1.5) |
10.3 (-0.3) |
7.4 (-0.8) |
|
– Public demand |
1354 |
2.7 |
2.0 (-0.4) |
2.8 (0.7) |
2.0 (0.1) |
1.6 (0.1) |
|
Petroleum investment2 |
216 |
9.8 |
5.0 (1.0) |
-6.0 (2.0) |
-5.0 (-1.0) |
-4.0 (0.0) |
|
Mainland exports2 |
1072 |
3.9 |
3.4 (0.2) |
1.2 (-0.2) |
1.9 (0.0) |
2.3 (-0.1) |
|
Mainland imports2 |
1503 |
4.3 |
2.4 (0.2) |
3.0 (-0.1) |
3.2 (0.1) |
2.8 (0.0) |
|
House prices and debt |
||||||
|
House prices |
3.0 |
6.3 (-1.8) |
8.0 (0.2) |
6.4 (-0.1) |
4.8 (-0.3) |
|
|
Household credit (C2) |
3.5 |
4.1 (0.3) |
4.2 (0.2) |
4.3 (0.3) |
4.5 (0.3) |
|
|
Interest rate, exchange rate and oil price |
||||||
|
Policy rate (level) |
4.5 |
4.3 (-0.1) |
3.6 (-0.1) |
3.2 (0.0) |
3.1 (0.1) |
|
|
Import-weighted exchange rate (I-44) (level) |
120.3 |
118.8 (0.3) |
117.5 (0.0) |
117.5 (0.0) |
117.5 (0.0) |
|
|
Policy rate, trading partners (level)3 |
4.1 |
2.8 (0.0) |
2.3 (-0.2) |
2.3 (-0.3) |
2.5 (-0.3) |
|
|
Oil price, Brent Blend. USD per barrel |
80.5 |
71.6 (0.8) |
68.6 (1.7) |
67.8 (1.4) |
68.0 (1.5) |
|
|
Household income and saving1 |
||||||
|
Real disposable income excl. dividend income |
3.6 |
3.9 (0.6) |
3.4 (0.6) |
2.8 (0.3) |
2.2 (-0.1) |
|
|
Saving ratio excl. dividend income (rate, level) |
2.6 |
2.1 (-0.5) |
2.6 (-0.1) |
3.0 (0.0) |
3.2 (0.2) |
|
|
Fiscal policy |
||||||
|
Structural non-oil deficit as a percentage of GPFG4 |
2.6 |
2.7 (0.0) |
2.9 (0.0) |
2.8 (0.0) |
2.8 (0.0) |
|
- 1 All figures are working-day adjusted.
- 2 Annual figures based on monthly national accounts.
- 3 Overnight Index Swap.
- 4 Government Pension Fund Global measured at the beginning of the year.
Sources: Eiendomsverdi, Finn.no, LSEG Datastream, Ministry of Finance, Norwegian Labour and Welfare Administration (Nav), Real Estate Norway, Statistics Norway and Norges Bank