
Norges Bank’s Monetary and Financial Stability Committee unanimously decided to keep the policy rate unchanged at 4 percent at its meeting on 17 December. The outlook is uncertain, but if the economy evolves broadly as currently projected, the policy rate will be reduced further in the course of the coming year.
The Committee’s assessment summarises the Monetary Policy and Financial Stability Committee members’ assessments that led to the monetary policy decision at the meeting on 17 December 2025. The analyses in Monetary Policy Report 4/2025 form the basis for the assessment.
The operational target of monetary policy is annual consumer price inflation of close to 2 percent over time. Inflation targeting shall be forward-looking and flexible so that it can contribute to high and stable output and employment and to counteracting the build-up of financial imbalances.
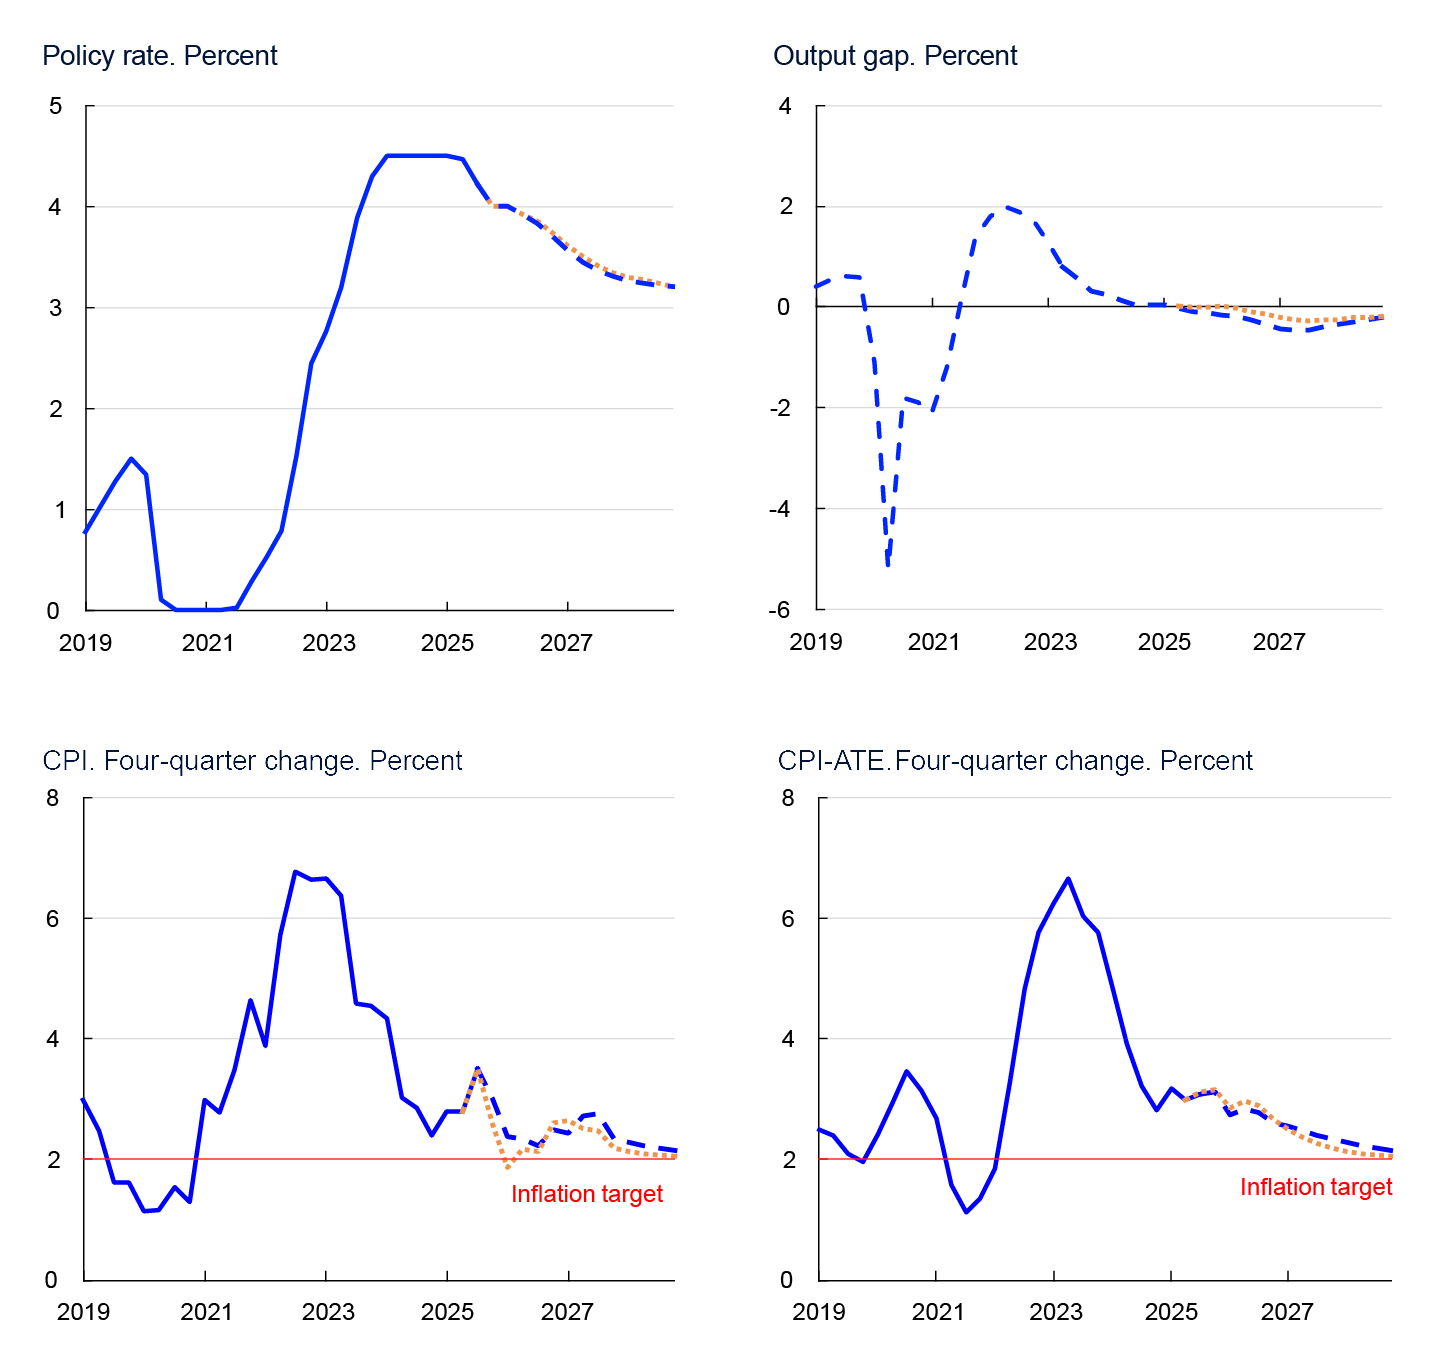
The tightening of monetary policy has contributed to cooling down the Norwegian economy and to dampening inflation in recent years. Inflation is still above target, and underlying inflation has been close to 3 percent for some time. At the same time, unemployment has increased somewhat. Capacity utilisation in the economy has declined and is close to a normal level. The policy rate was reduced earlier this year from 4.5 percent to 4 percent.
The outlook for the international economy remains highly uncertain, but trade policy uncertainty has diminished since spring. US import tariffs were raised substantially earlier this year but are little changed since the September Report. Economic growth among our main trading partners has been a little higher than expected, and the growth forecasts for next year have been revised up slightly since September. Consumer price inflation in Sweden and the euro area is close to target, while inflation is still somewhat higher among other main trading partners.
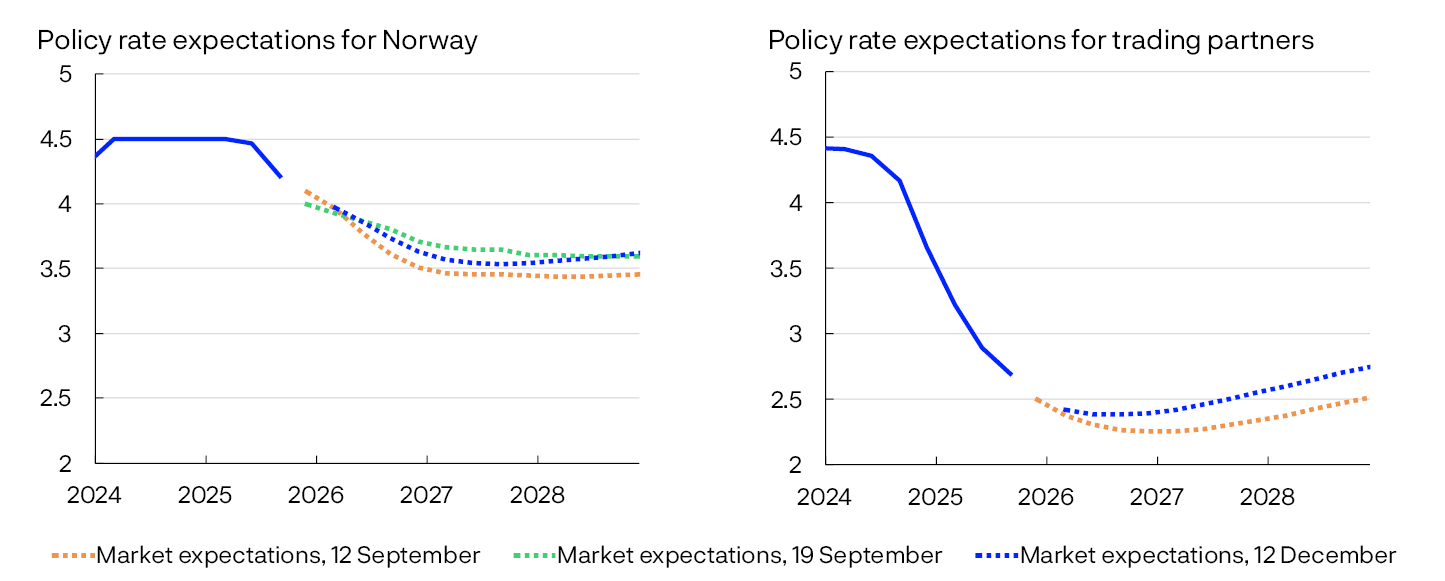
International policy rate expectations have increased somewhat since the September Report. The market expects the Norwegian policy rate to be reduced in June 2026. The money market is pricing in a slightly higher money market spread ahead than assumed in the September Report. Oil and gas prices are lower than at the time of the September Report. The krone exchange rate has depreciated and is weaker than projected.
The Committee notes that there are several indicators pointing to slightly weaker developments in the economy. Since September, employment growth has been a little lower and registered unemployment a little higher than expected. At the same time, Norges Bank’s Regional Network contacts report that it has become slightly easier to recruit labour. Growth in the Norwegian economy has been a little lower than expected. Overall, new information indicates that capacity utilisation in the Norwegian economy appears to be slightly lower than previously assumed.
Regional Network contacts expect growth to soften a bit in winter, but overall, the moderate upswing in activity is expected to continue. Growth in household consumption has picked up this year, and towards the end of the year growth was lifted in particular by an increase in car sales. New home sales are still low, and housing investment prospects are slightly weaker than in September. Growth in public demand has been lower than assumed, while the approved budget for 2026 implies slightly higher public spending next year than assumed in the September Report.
Underlying inflation has been broadly as projected. Twelve-month CPI inflation adjusted for tax changes and excluding energy products (CPI-ATE) was 3.0 percent in November. CPI inflation was also 3.0 percent, which was higher than projected in the September Report. The rise in prices for food and many services remains elevated. According to Norges Bank’s Expectations Survey, long-term inflation expectations remain slightly above 2 percent.
The rapid rise in business costs over the past years will likely restrain disinflation ahead. The Committee noted that wage growth appears to be higher this year than previously assumed and higher than the wage norm for manufacturing. At the same time, new national accounts figures may indicate that manufacturing’s ability to pay wages has fallen in recent years and is weaker than previously assumed, which may suggest lower wage growth ahead.
The Committee judges that a restrictive monetary policy is still needed. Inflation is still too high. The krone exchange rate has depreciated since the September Report and contributes to raising inflation prospects somewhat going forward. If the policy rate is lowered too quickly, inflation could remain above target for too long. On the other hand, there seems to be a little more spare capacity in the economy than projected in the September Report. The Committee does not want to restrain the economy more than needed to bring inflation down to target. The Committee’s overall assessment is that the monetary policy outlook is little changed since September. The Committee judges that it is appropriate to keep the policy rate unchanged at this meeting but still envisages a cautious normalisation of the policy rate in the next years.
The policy rate forecast in this Report is little changed. The forecast is consistent with 1-2 rate cuts next year and a further reduction to somewhat above 3 percent towards the end of 2028.The number of registered unemployed is expected to increase a little over the next couple of years, but the unemployment rate will likely remain close to the current level. With a gradual decline in wage growth ahead, inflation is projected to move down and be close to 2 percent in 2028.
If the economy takes a different path than currently projected, the policy rate path may also differ from that implied by the forecast. In its discussion of the risk outlook, the Committee paid special attention to the fact that unpredictable conditions for international cooperation and trade are creating uncertainty about the outlook for inflation and growth both internationally and in Norway. If labour market conditions weaken more than expected or the outlook indicates that inflation will return to target faster, the policy rate may be lowered faster. On the other hand, if growth in business costs remains elevated for longer, or the krone proves weaker than projected, inflation could remain elevated for longer than currently projected. A higher policy rate than currently envisaged may then be required.
- 1 The output gap measures the percentage deviation between mainland GDP and estimated potential mainland GDP. CPI-ATE: the CPI adjusted for tax changes and excluding energy products.
Ida Wolden Bache
Pål Longva
Øystein Børsum
Ingvild Almås
Steinar Holden
17 December 2025
1 Overall picture
This section presents the overall picture of the Norwegian economy and discusses our assessment of economic developments, with particular emphasis on the current economic situation, the policy rate decision and forecast, and finally the economic outlook. In the box at the end of the Report, key uncertainty and risk factors are described that may result in different economic developments than projected in this Report.
Economic growth both in Norway and among our main trading partners appears to be higher in 2025 than in 2024. Inflation fell rapidly from its post-pandemic high but the pace of disinflation has slowed over the past year. In Norway, inflation is still above the 2% target. In recent years, unemployment has risen somewhat. The policy rate forecast is consistent with 1–2 rate cuts next year and a further reduction to somewhat above 3% towards the end of 2028. Inflation is projected to return to target further out, while the registered unemployment rate remains close to the current level in the years ahead.
Sustained international activity despite trade tensions
Over the past year, there have been substantial changes in global trade policies. Trade policy uncertainty has eased since spring but remains elevated. Economic activity among our main trading partners nevertheless remains sustained. Economic growth among trading partners appears to have picked up somewhat from 2024. One important reason for this is the marked decline in inflation. This has contributed to real wage growth for households and given central banks room to reduce policy rates.
Economic growth among trading partners appears to have picked up somewhat from 2024.
Inflation among trading partners reached high levels in the wake of the pandemic but fell rapidly thereafter in the period to summer 2024 (Chart 1.1). Inflation in Sweden and the euro area is close to target but still somewhat higher among other main trading partners. The rise in services prices is underpinning inflation. High services inflation reflects the strong growth in wages in recent years, but wage growth abroad in now slowing.
CPI. Twelve-month change. Percent
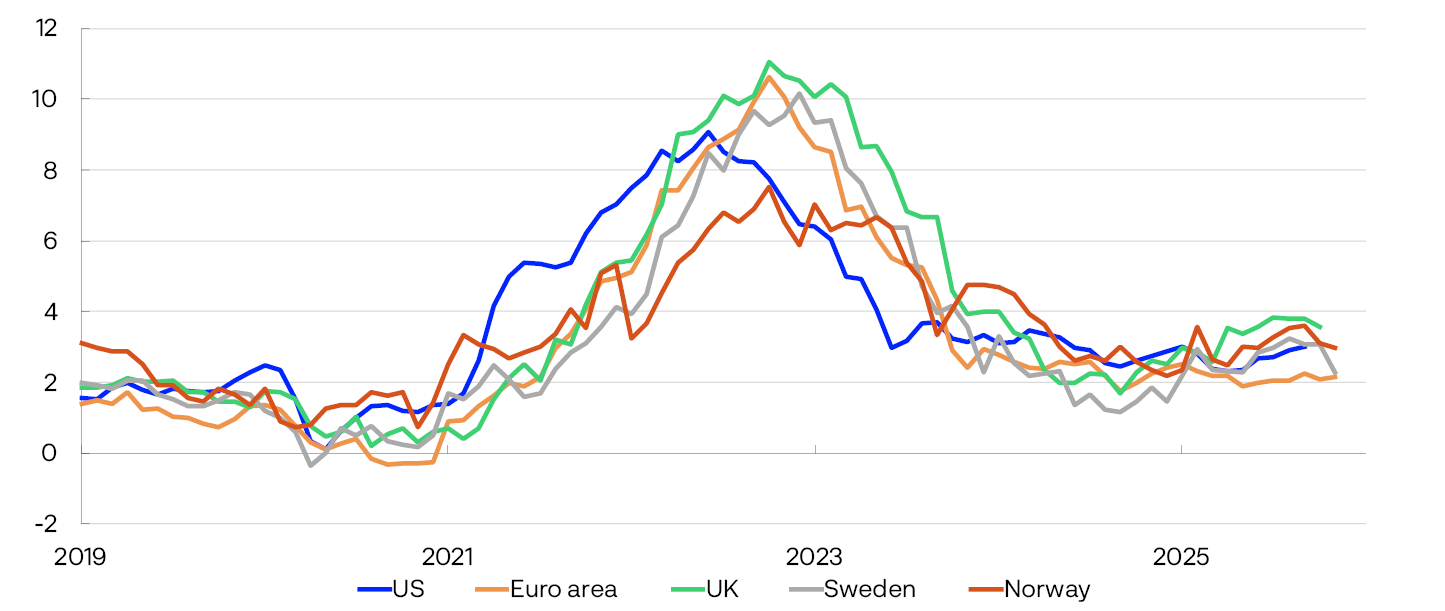
- 1 Figures for Sweden are CPIF (Consumer price index with a fixed interest rate).
Inflation in Norway is still above the 2% target
Inflation slowed markedly in Norway through 2023 and 2024 but has changed little over the past year. Excluding energy prices, which can fluctuate widely from month to month, inflation has been close to 3% over the past year. Twelve-month CPI inflation was 3.0% in November, as was CPI inflation adjusted for tax changes and excluding energy products (CPI-ATE).
Inflation slowed markedly in Norway through 2023 and 2024 but has changed little over the past year.
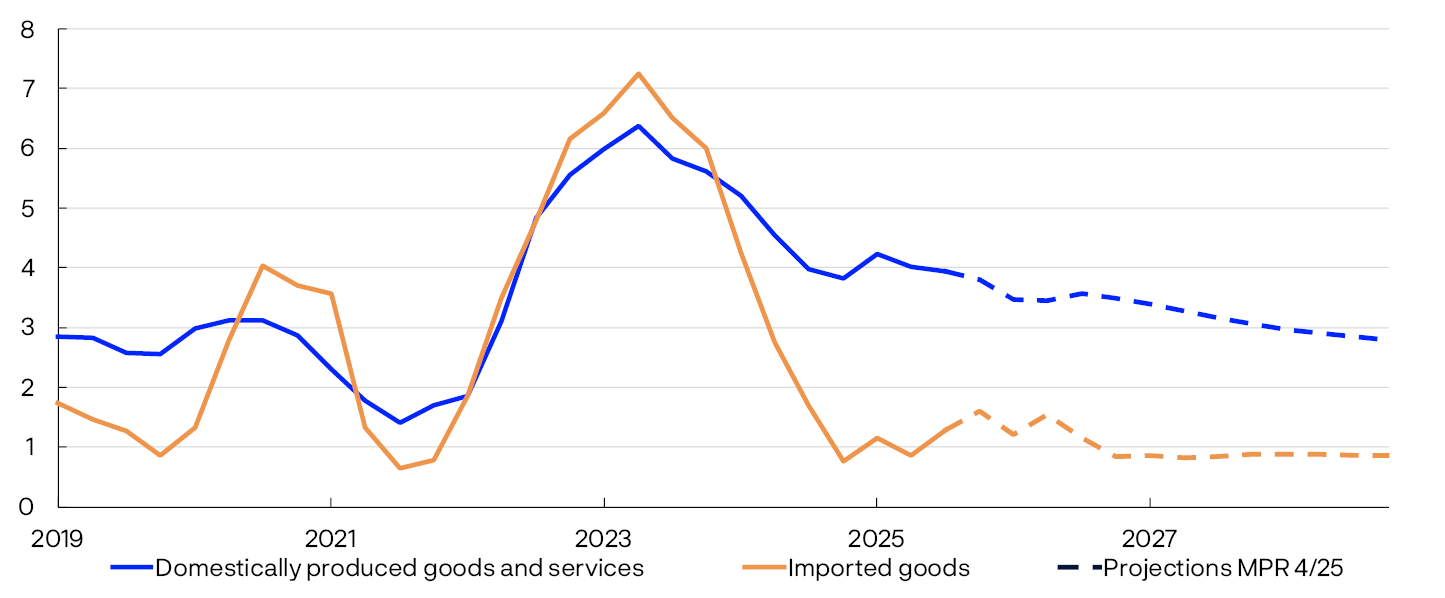
The post-pandemic inflation surge was triggered by an import price shock. Since then, external price pressures have eased substantially, and imported goods inflation moved down to a low level during 2024 (Chart 1.2).
CPI-ATE. Four-quarter change. Percent
The rise in prices for domestically produced goods and services is being driven by the rapid growth in business costs. Annual wage growth was 5.6% in 2024 and is projected to slow to 4.9% in 2025, which is somewhat higher than projected in the September Report and higher than the norm for the wage settlement in manufacturing.
- 2 CPI-ATE: the CPI adjusted for tax changes and excluding energy products.
Stronger growth in household consumption
High inflation and higher interest rates contributed to restraining the economy in the wake of the pandemic. Through 2023 and 2024, mainland GDP growth was low. Developments have been particularly weak in the most interest sensitive segments of the economy. Housing investment has fallen considerably, and household consumption growth has been slow. Growth in business investment has also been weak. At the same time, public demand, exports and petroleum investment have contributed to underpinning economic activity.
The demand picture has changed in 2025. Household consumption growth has picked up, and housing investment has risen slightly from a low level. At the same time, the rise in petroleum investment has likely passed.
In 2025 Q3, mainland economic growth was weaker than projected in the September Report, partly reflecting extraordinary conditions that are expected to normalise ahead. Norges Bank’s Regional Network contacts have reported steady growth through 2025 and expect slightly slower growth through winter. Mainland GDP is projected to rise by 1.6% in 2025, which is markedly higher than in 2024, but somewhat lower than projected in the September Report.
Slightly higher unemployment
In recent years, unemployment has risen from a low level. In November, 2.2% of the labour force was registered as fully unemployed by the Norwegian Labour and Welfare Administration (Nav), adjusted for normal seasonal variations, which is broadly in line with pre-pandemic levels, but slightly higher than projected in the September Report. The Labour Force Survey (LFS) indicates that unemployment has risen somewhat more. LFS unemployment has increased particularly among those aged less than 25, reflecting an increase in the number of young job seekers.
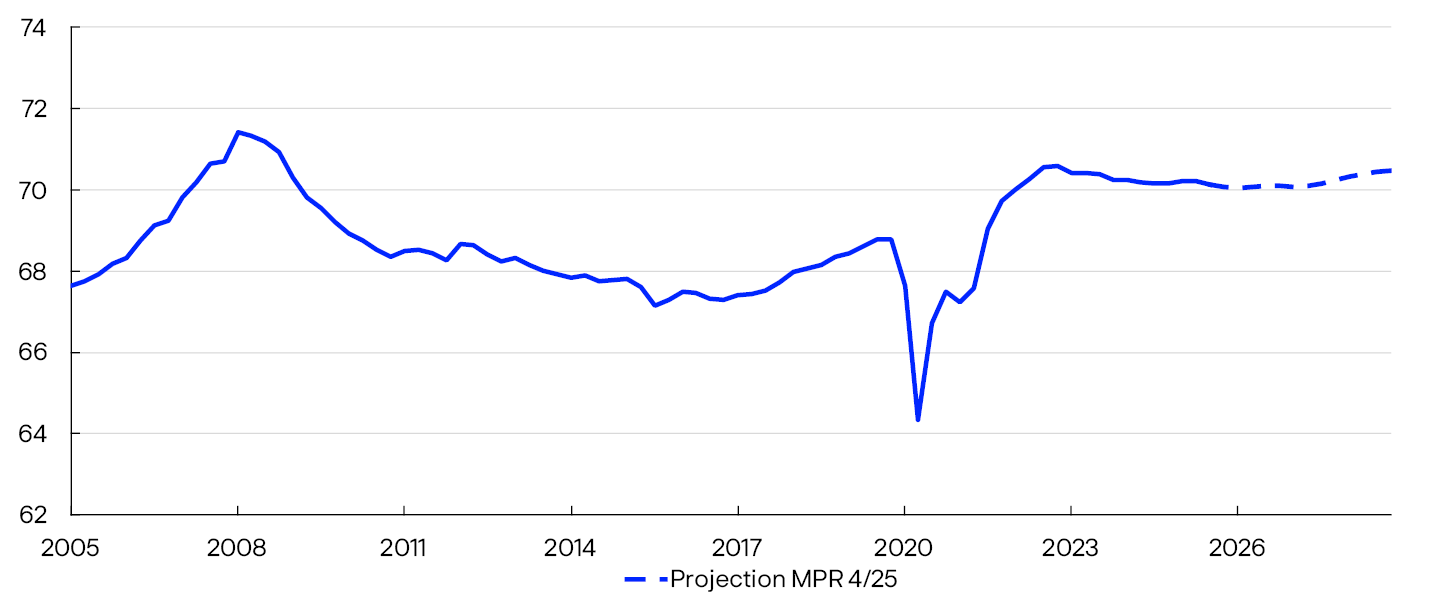
At the same time, the number of employed has increased. The employment to population ratio is slightly lower than it was a couple of years ago but is nevertheless markedly higher now than it was in the pre-pandemic period (Chart 1.3). Capacity utilisation in the economy is assessed to have declined through 2023 and reached a normal level in the course of 2024. In 2025, capacity utilisation has likely declined a little but is still close to a normal level. Spare capacity in the economy is now estimated to be a little higher than projected in September.
Employment to population ratio. Aged 15–74. Percent
Spare capacity in the economy is now estimated to be a little higher than projected in September.
- 3 Employment is the number of employed workers according to the quarterly national accounts (QNA) less non-resident workers (from the statistics on the number of jobs and wages).
The policy rate is likely to be reduced further in 2026
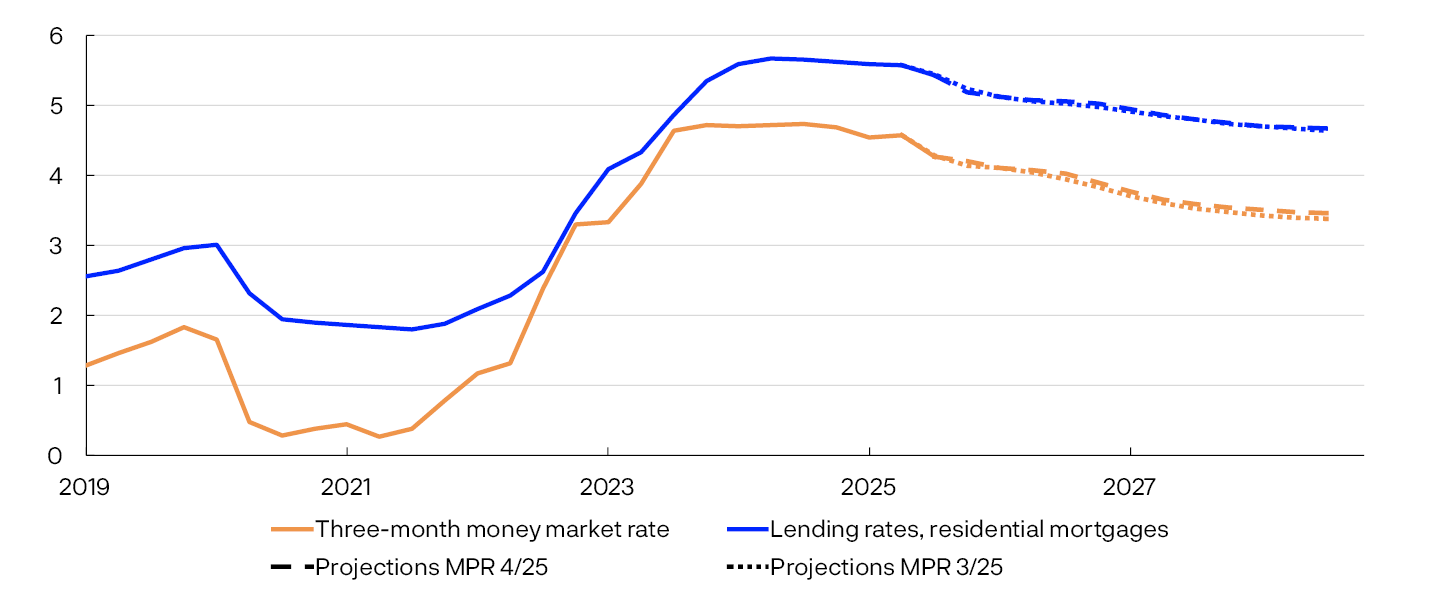
The Monetary Policy and Financial Stability Committee’s discussions on the monetary policy stance were based on the assessments of economic developments as described in the paragraphs above. Inflation is still high, and the rapid rise in business costs will likely restrain further disinflation ahead. At the same time, capacity utilisation appears to be slightly lower than anticipated. The Committee judges that a restrictive monetary policy is still needed. At this monetary policy meeting, the Committee decided to keep the policy rate unchanged at 4%. The policy rate forecast is consistent with 1–2 rate cuts next year and a further reduction to somewhat above 3 percent towards the end of 2028. If the economy evolves as projected in this Report, and the policy rate is reduced in line with the forecast, the average residential mortgage rate is expected to decline to about 4.7% in 2028 (Chart 1.4).
Percent
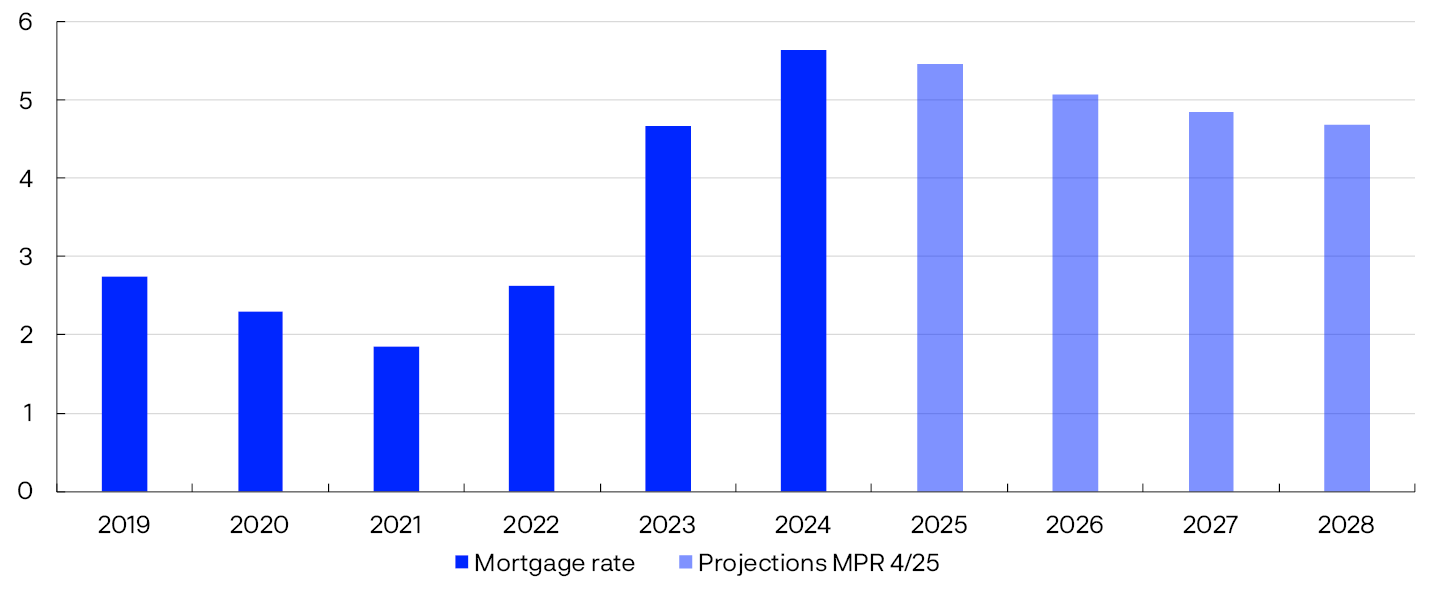
- 4 The residential mortgage rate is the average rate on outstanding mortgage loans to households from the sample of banks and mortgage companies included in Statistics Norway’s monthly interest rate statistics. The value for 2028 is the average of projections for 2028 Q1-Q3.
Prospects for lower inflation and higher employment
Economic growth among trading partners is projected to remain broadly unchanged in the years ahead. At the same time, the outlook suggests that price and wage inflation among trading partners will decline further and that inflation among our European trading partners will move down towards 2% in the course of 2026. In the US, inflation is expected to approach the target towards the end of 2027.
Norwegian mainland GDP growth is projected to be somewhat lower in the years ahead than in 2025 but higher than in 2024. With prospects for a faster rise in wages than prices ahead and somewhat lower interest rates, household purchasing power will continue to strengthen in the coming years. This will likely contribute to a further increase in private consumption. Housing investment is also projected to rise in the years ahead, but the level of investment at the end of 2028 is still expected to be markedly lower than before it started to fall in 2022.
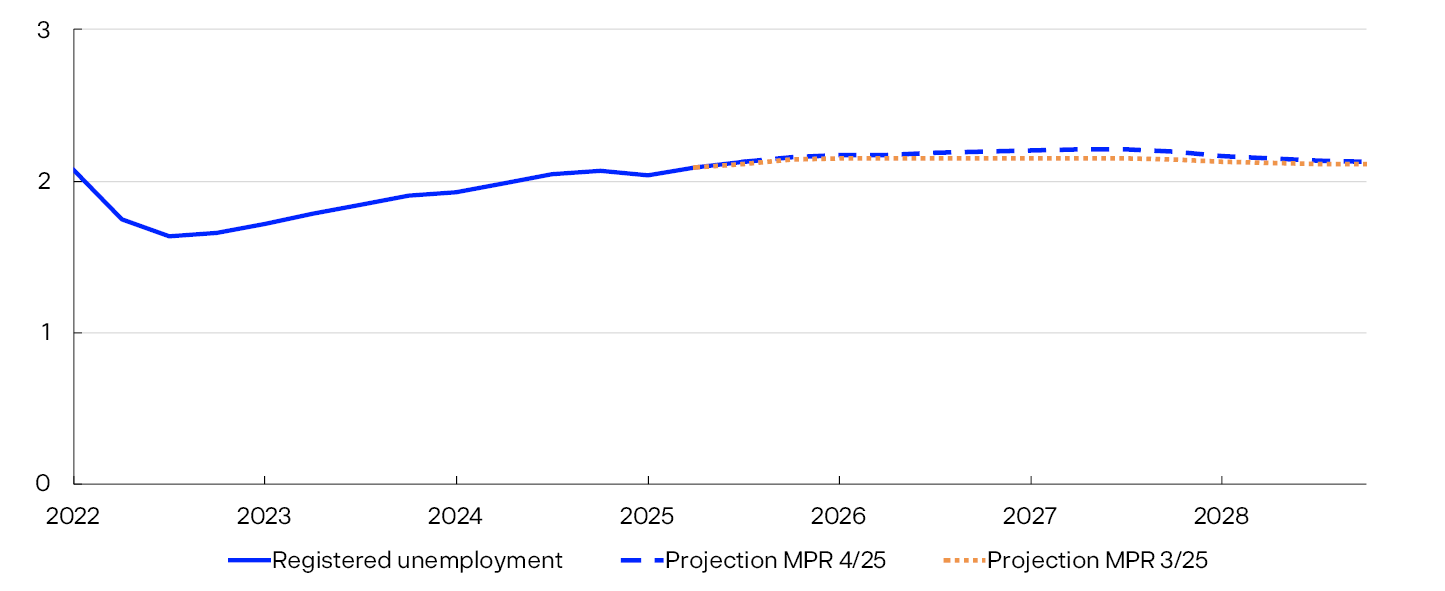
Employment is projected to increase in the years ahead. Measured as a share of the population, employment is expected to remain stable in the coming year, before rising slightly through 2027 and 2028. At the same time, the number of unemployed is expected to rise somewhat, but the number of unemployed measured as a share of the labour force is not expected to increase from the current level.
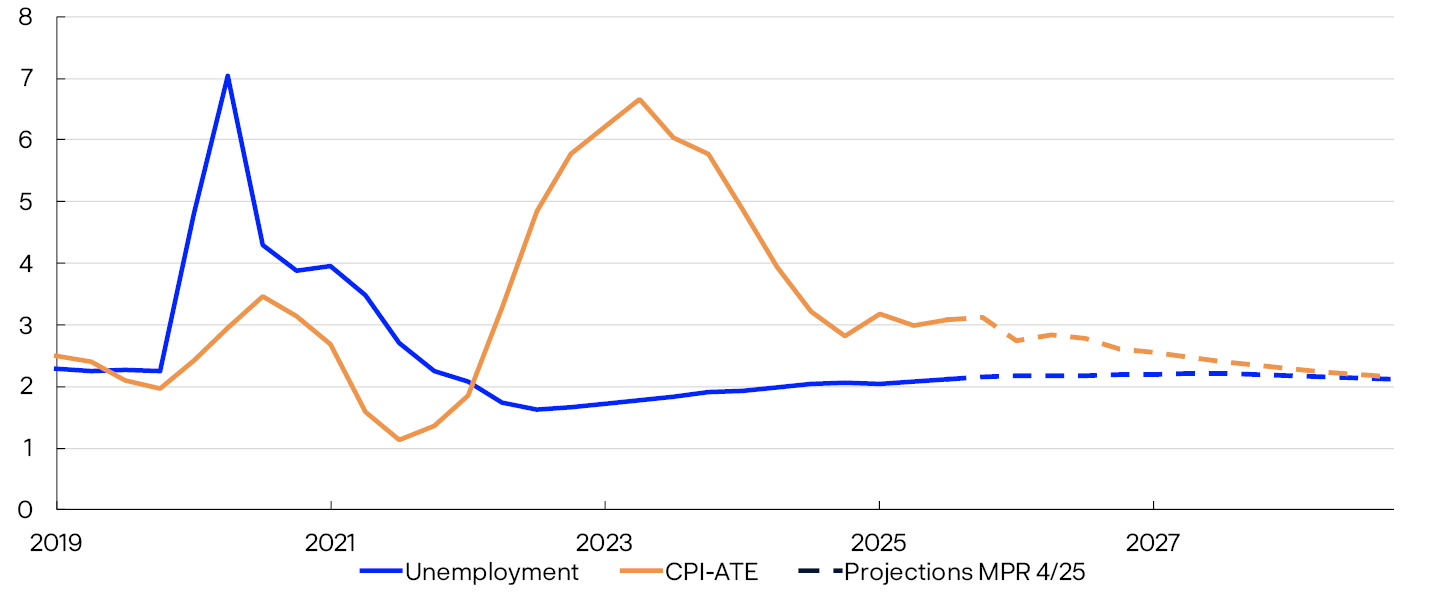
Looking ahead, there are prospects that wage growth will slow and dampen inflation. Inflation is projected to decline gradually towards the 2% target (Chart 1.5).
Inflation is projected to decline gradually towards the 2% target.
CPI-ATE. Four-quarter change. Registered unemployment. Percent
Uncertainty and risk
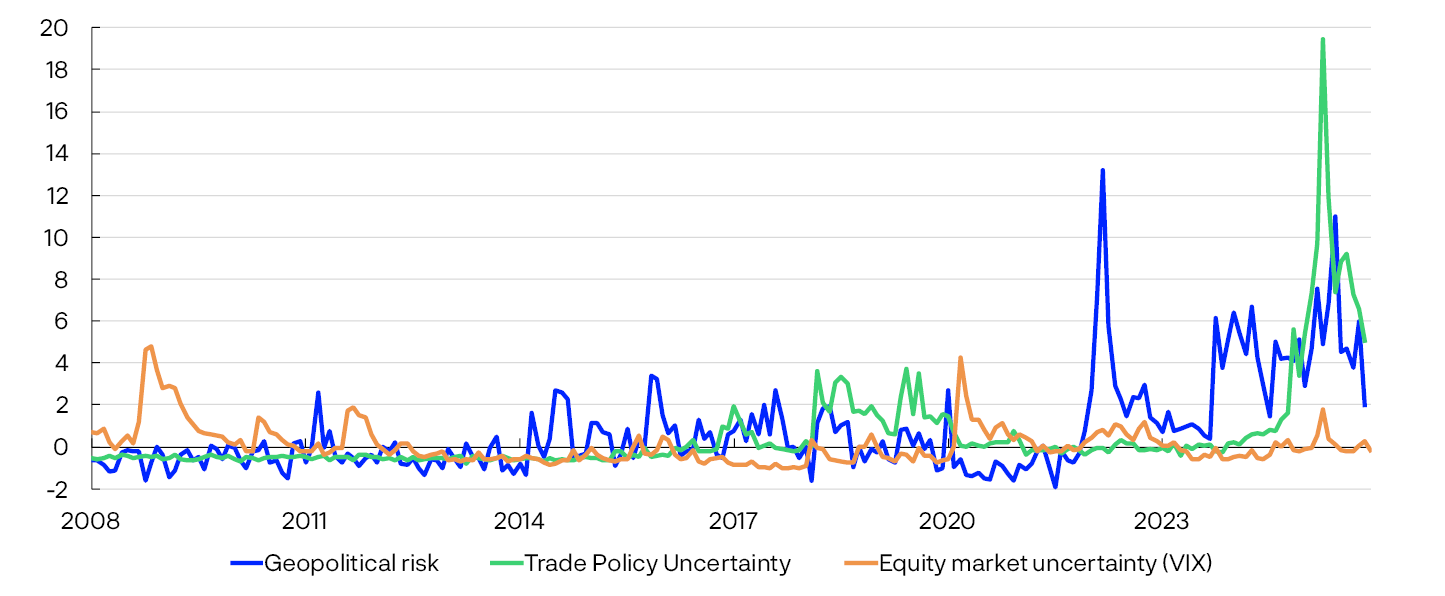
There is still uncertainty from higher tariffs and geopolitical tensions related to both the war in Ukraine and conflicts in the Middle East. Various text-based measures of geopolitical uncertainty have fallen from spring 2025 but are still high (Chart 1A). So far, higher tariffs appear to have had little impact on inflation and economic activity in Norway and abroad, but it will take time for the effects to become fully evident. Supply chain disruptions owing to higher tariffs may result in higher inflation. At the same time, firms that face higher tariffs can redirect exports to other markets. This may contribute to increased competition and lower inflation. A number of export firms in Norges Bank’s Regional Network point out that tariffs between the US and China are intensifying competition in the European market, which is dampening their growth expectations.
Uncertainty indicators
In the US, investment in technology and infrastructure related to artificial intelligence has pushed up economic growth in recent years. US big tech shares have risen to high levels and now account for a substantial share of the US equity market. This increases the risk of a steep stock market decline that could affect risk appetite in financial markets and growth in the US economy. In turn, this could affect the Norwegian economy.
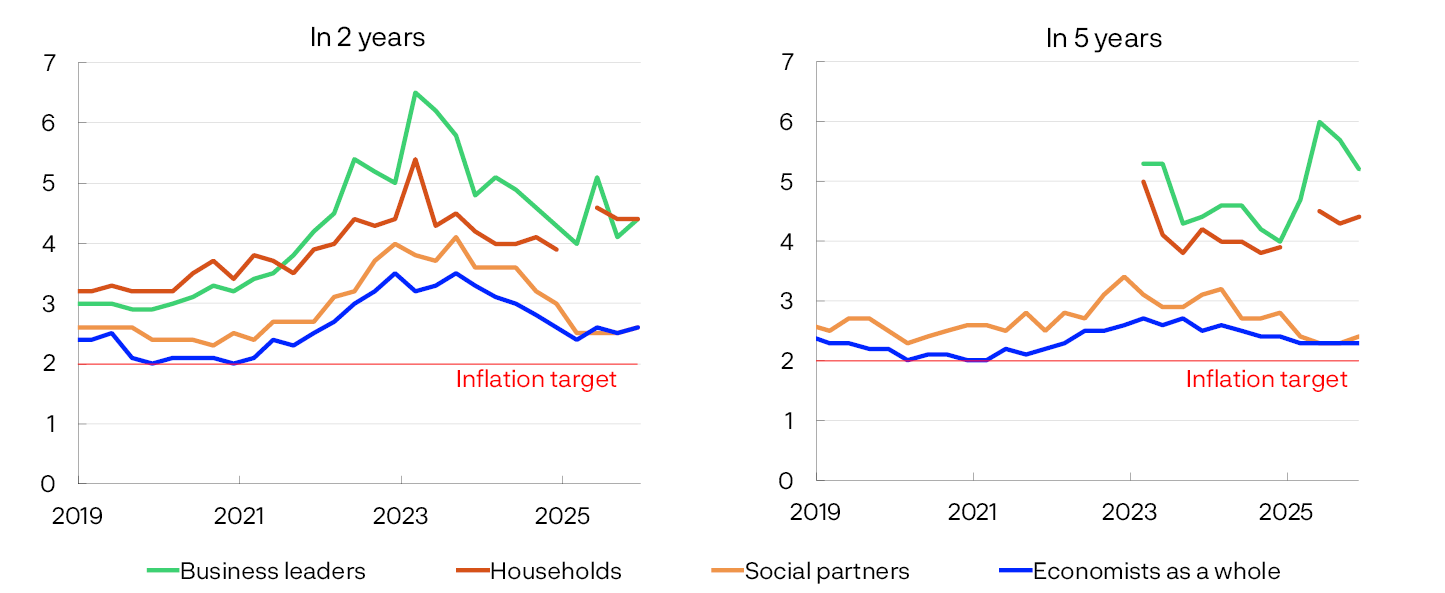
Norway’s inflation outlook is also uncertain. After inflation declined rapidly through the second half of 2023 and much of 2024, underlying inflation measured by the CPI-ATE has been around 3% over the past year. Inflation expectations have come down but are still above the inflation target both two and five years ahead (Chart 1B). Long-term expectations of economists and the social partners are close to pre-pandemic levels, while household and business expectations are still high. Expectations of high inflation could make it more difficult to bring inflation back to target.
Twelve-month change. Percent
An important reason why inflation moves down to 2% in the Bank’s projections is that wage growth is assumed to decline from 5.6% in 2024 to 3.3% in 2028. In the years preceding the pandemic, actual annual wage growth was close to the norm for the wage settlement in manufacturing, but higher than the norm after the pandemic. This is expected to also be the case in 2025 and may indicate that the historical relationships upon which the Bank’s wage projections are based are changing. If so, wage growth ahead may be higher than Norges Bank now expects.
On the other hand, the labour market has weakened through 2025. Since the September Report, unemployment has risen slightly faster than expected and Regional Network contacts report a that it has become slightly easier to recruit labour. If these developments indicate a weaker labour market than currently assumed, wage growth could decline faster than projected in this Report. In addition, revised national accounts figures indicate slightly lower profitability in manufacturing, which also pulls in the direction of lower wage growth. At the same time, the figures for profitability in manufacturing are highly uncertain and subject to extensive revision.
- 1 The geopolotical risk index builds upon Caldara, D. og M. Iacoviello (2022), “Measuring Geopolitical Risk”, American Economic Review. 112 (4), pp 1194–1225. The uncertainty index builds upon Caldara, D., M. Iacoviello and P. Molligo, A. Prestipino and A Raffo (2020), “The economic effects of trade policy uncertainty”, Journal of Monetary Economics. 109, pp 38–59. Data for both indices are available in the Economic Policy Uncertainty Index. The numbers have been normalised by subtracting the average value and dividing by the standard deviation. The average and the standard deviation are calculated over the period 2008–2019. VIX is a measure of the market’s expectations for future fluctuations in US equity prices (S&P 500).
- 2 In 2023 Q1, households and business leaders were asked for the first time about expected inflation 5 years ahead. The observation for households for 2025 Q1 is omitted due to a different set of questions in the survey for 2025 Q1.
- 5 CPI-ATE: the CPI adjusted for tax changes and excluding energy products.
2. Assumptions and projections
This section presents the key assumptions and projections underlying the policy rate decision and the monetary policy analysis. It also describes how new data, analyses and assessments have influenced the projections since the previous Report. The projection period in this Report is between 2025 Q4 and 2028 Q4. The underlying data is available in an independent dataset that is published separately.
International economy
Economic activity rose rapidly among Norway’s main trading partners in the initial post-pandemic years, but growth has been lower over the past couple of years (Chart 2.1). Wages lagged behind when inflation first surged, and central banks increased policy rates.
Annual change. Percent
However, activity growth was somewhat faster in 2024 than in 2023, and is set to pick up slightly in 2025. One important reason for this is the marked decline in inflation. This has contributed to real wage growth and allowed central banks to reduce policy rates.
There are expectations of further policy rate cuts in the UK and the US, whereas market pricing in Sweden implies an increase in the course of 2026. A rate hike is also somewhat likely in the euro area next year (Chart 2.2). Overall, policy rate expectations abroad are a little higher than in the September Report. Government bond yields have also risen somewhat since September.
Policy rates and estimated forward rates. Percent

The announcement of higher tariffs on imports to the US this spring caused some financial market stress. Equity markets retreated appreciably but have since regained lost ground. Uncertainty surrounding the valuation of US technology companies has recently caused volatility, but equity markets overall have advanced further since the September Report. Credit spreads have widened slightly for some technology companies but are otherwise little changed since the September Report.
Norges Bank’s trading partner growth projections were revised down somewhat in the first two Reports in 2025. However, growth among trading partners was somewhat higher than projected in 2025 Q2 and also appears to be stronger in Q3.
GDP growth among trading partners as a whole is projected to be approximately as strong in the coming years as in 2025. The projections are based on the tariffs in effect on 12 December. The Bank’s projections are close to an average of other forecasters’ projections. The projections for the different economies are based on the following:
- In both Sweden and the euro area, the outlook suggests a more expansionary fiscal policy in the coming years, partly reflecting increased defence spending. This contributes to lifting growth in the projections. The upturn is most pronounced in Sweden, where developments have been weak in recent years, and unemployment has increased markedly. Unemployment in the euro area remains close to historically low levels.
- The UK budget proposal from November indicates significantly tighter fiscal policy ahead, and GDP growth is projected to be slightly slower ahead than in 2025.
- US growth is projected to decline following strong developments in recent years. Investment in software and IT equipment has risen substantially in 2025, and the increase in US household equity wealth has likely helped push up consumption. However, the implemented US tariffs will continue to pull down growth, and stricter immigration policies will reduce labour supply.
- In China, growth appears to have remained steady from 2024 to 2025. Chinese exports to the US have declined markedly, but exports to other countries have increased. The Chinese government has a clear objective to strengthen their high-tech industry, but weak private consumption, low residential construction and labour force contraction are expected to dampen growth somewhat.
Consumer price inflation among Norway’s main trading partners slowed substantially through 2023 and 2024. Inflation outside the euro area and in Sweden, however, is still somewhat higher than the 2% targets. This is mainly driven by services prices, reflecting higher wage increases in recent years. However, wage growth abroad is declining. Overall, wage growth slowed between 2023 and 2024, and the latest available figures indicate a further decline in 2025.
The projections for core inflation are based on the following:
- There are prospects that wage growth will continue to moderate, which also reduces services inflation. Core inflation among Norway’s European trading partners is projected to move down to 2% in the course of 2026.
- In Sweden, the halving of VAT on food in 2026 will also contribute to bringing core inflation markedly below 2% for a period. The preferred measure of core inflation in Sweden is not adjusted for tax changes.
- Gradual adjustments to the implemented tariffs are keeping US inflation elevated, but US inflation is also projected to be close to target at the end of 2027.
Oil prices and European gas prices
So far in December, oil prices have hovered between USD 60 and 65 per barrel, somewhat lower than in September. Oil prices exceeded USD 100 per barrel in summer 2022, following Russia’s invasion of Ukraine. The price fall in recent years primarily reflects higher OPEC and non-OPEC oil production and lower global economic growth. The oil risk premium has fallen since last summer as tensions in the Middle East have eased, with recent talks over a potential ceasefire in Ukraine pulling in the same direction. Futures prices indicate that oil prices will remain around current levels (see Table 2.A).
European gas prices have also fallen since September, as part of a gradual normalisation following the record levels that followed the cuts in Russian gas supply in autumn 2021. Over time, a higher supply of liquefied natural gas (LNG) to Europe and weak growth in energy-intensive manufacturing have pulled down prices. Higher solar and wind power production has also pulled down gas demand. In addition, a mild start to winter in 2025 has reduced gas consumption. A ceasefire in Ukraine could lead to somewhat higher gas supplies from Russia. Futures prices indicate a further decline in natural gas prices, reflecting expectations of even higher global LNG supply, particularly from the US and Qatar.
Table 2.A Energy prices
|
Percentage change from projectionsin Monetary Policy Report 3/2025 in parentheses |
Average price (2010–2019) |
Realised prices and futures prices1 |
||||
|---|---|---|---|---|---|---|
|
2024 |
2025 |
2026 |
2027 |
2028 |
||
|
Oil, USD/barrel |
80 |
80 |
69 (-1) |
61 (-8) |
61 (-7) |
63 (-6) |
|
Dutch gas, EUR/MWh |
20 |
34 |
36 (-2) |
27 (-17) |
25 (-15) |
24 (-12) |
- 1 Futures prices at 12 December 2025.
Sources: LSEG Datastream and Norges Bank
Norwegian mainland GDP
Statistics Norway has published a main revision of the national accounts (see box on “Main revision of national accounts”). Mainland GDP has been revised up over a number of years (Chart 2.3). Household services consumption in particular has been revised up. The revised figures do not materially change the overall picture of developments in the Norwegian economy.
Constant 2023 prices. In billions of NOK

Mainland economic growth has slowed in recent years and was weak in 2024. Higher interest rates and high price and cost inflation have contributed to reducing investment and dampening household consumption growth. On the other hand, the krone depreciation in the period to summer 2023 fuelled a sharp rise in exports. An expansionary fiscal policy and high petroleum investment have also lifted activity.
Mainland activity has picked up in 2025. Household consumption growth was solid, but public demand has declined. Developments in Q3 were weaker than projected, partly due to a decline in activity in a number of sectors where output typically fluctuates somewhat. Fishery and aquaculture activity declined, and there were periods of stoppages in some manufacturing segments.
Mainland GDP growth is expected to pick up in 2025 Q4 and be slightly higher than projected in the September Report. Growth projections through 2026 are little changed since the September Report. The projections are based on the following:
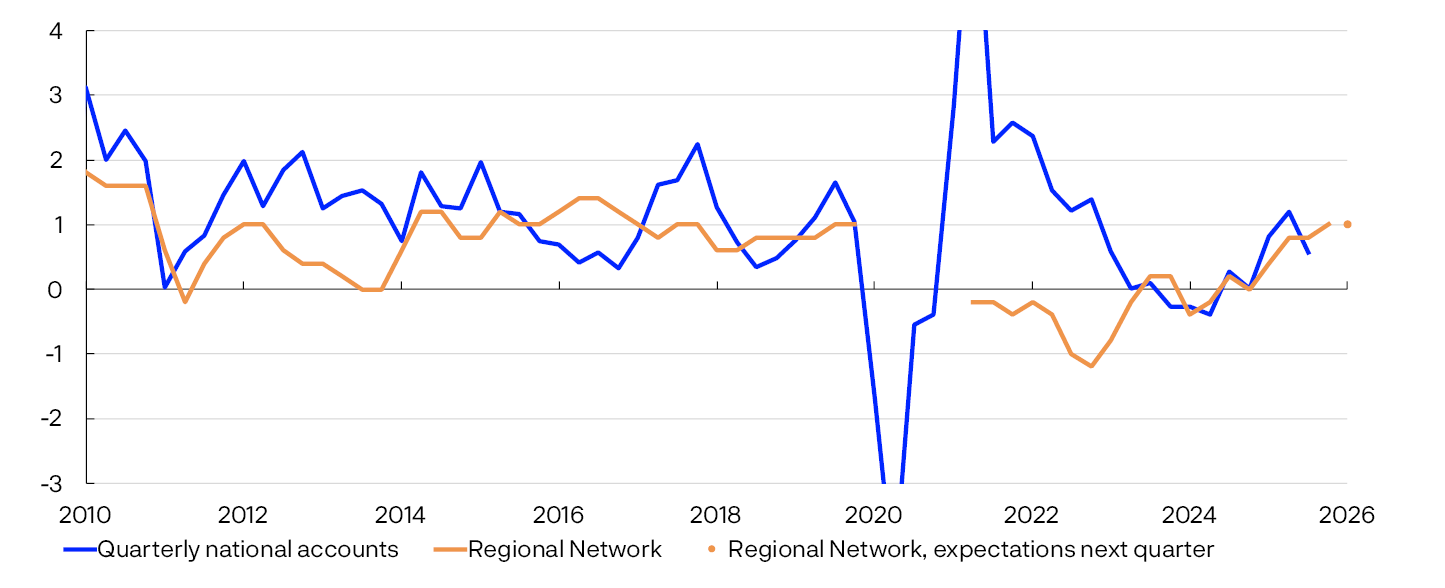
- Overall, Regional Network contacts expect the same activity growth in Q4 as in the previous survey and a slight decline in 2026 Q1 (Chart 2.4, left panel). Contacts expect higher household purchasing power to boost demand for goods and services, while low residential construction, weak local government sector demand, global trade tensions and completion of oil-related projects are likely to dampen growth.
- According to Norges Bank’s System for Model Analysis in Real Time (SMART), which weights forecasts from a broad set of models, mainland GDP growth will pick up in the coming quarters (Chart 2.4, right panel).
Expected output. Quarterly change. Percent

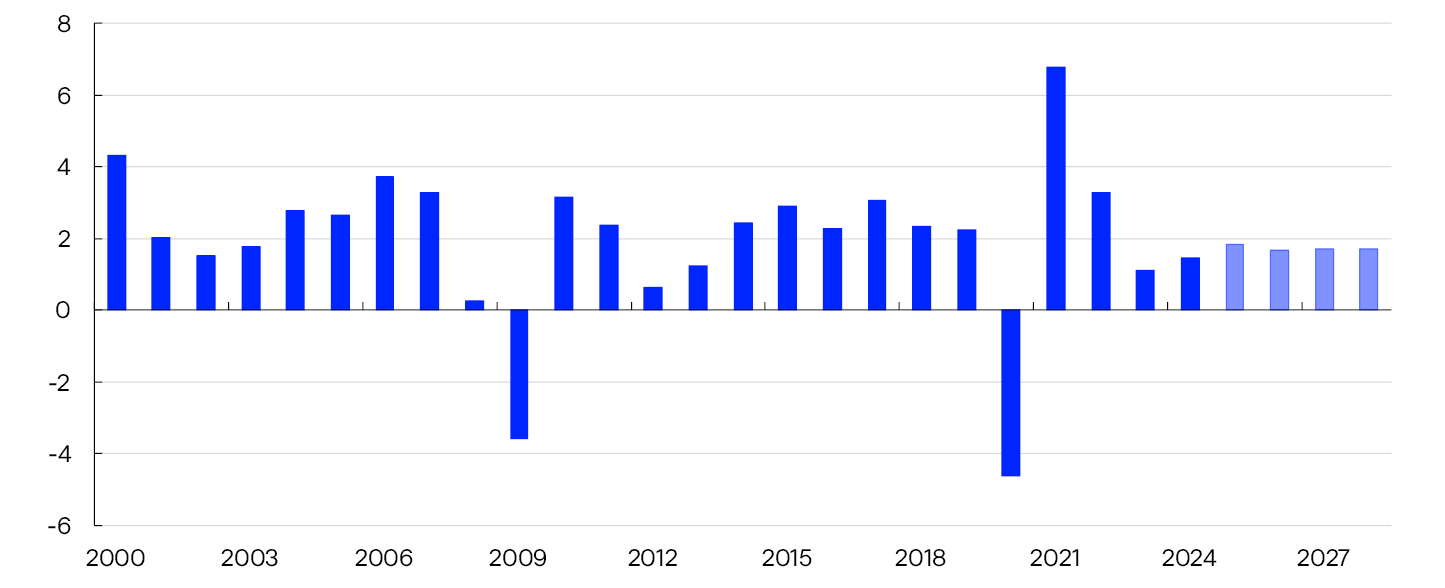
Mainland GDP growth is projected at 1.6% in 2025 and somewhat lower in subsequent years (Chart 2.5). The projections for 2025 and 2026 have been revised down since the September Report.
Annual change. Contribution to annual change. Percentage points
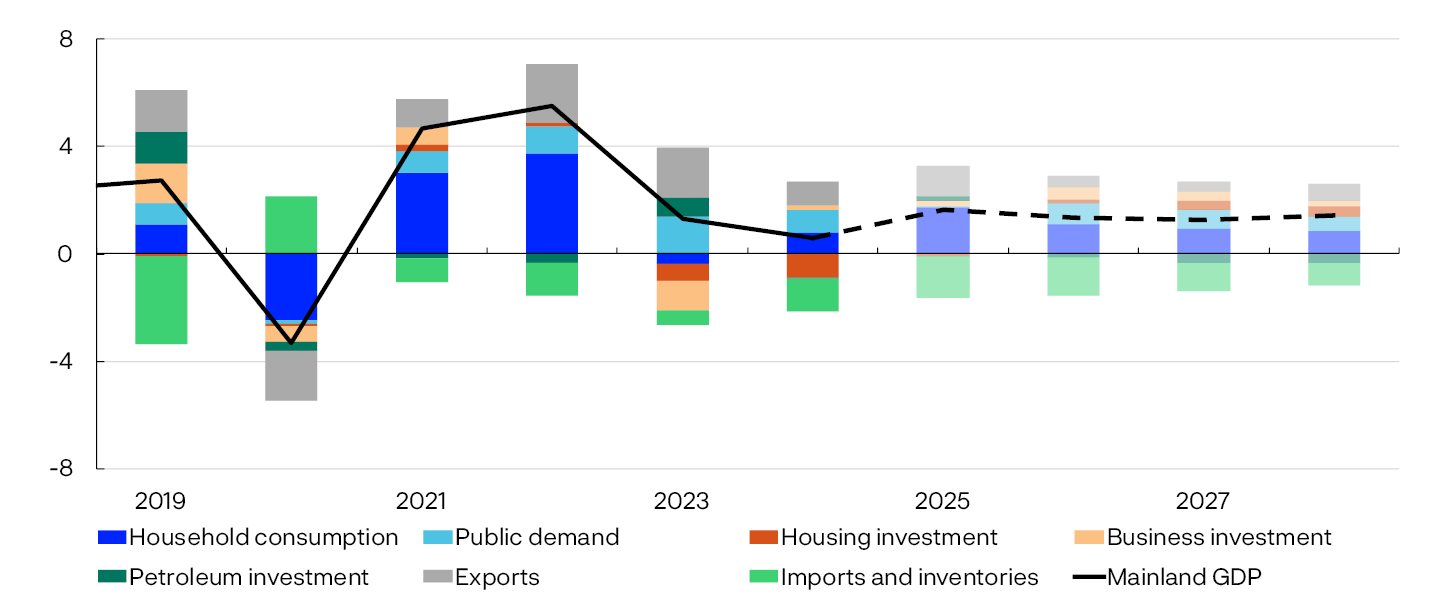
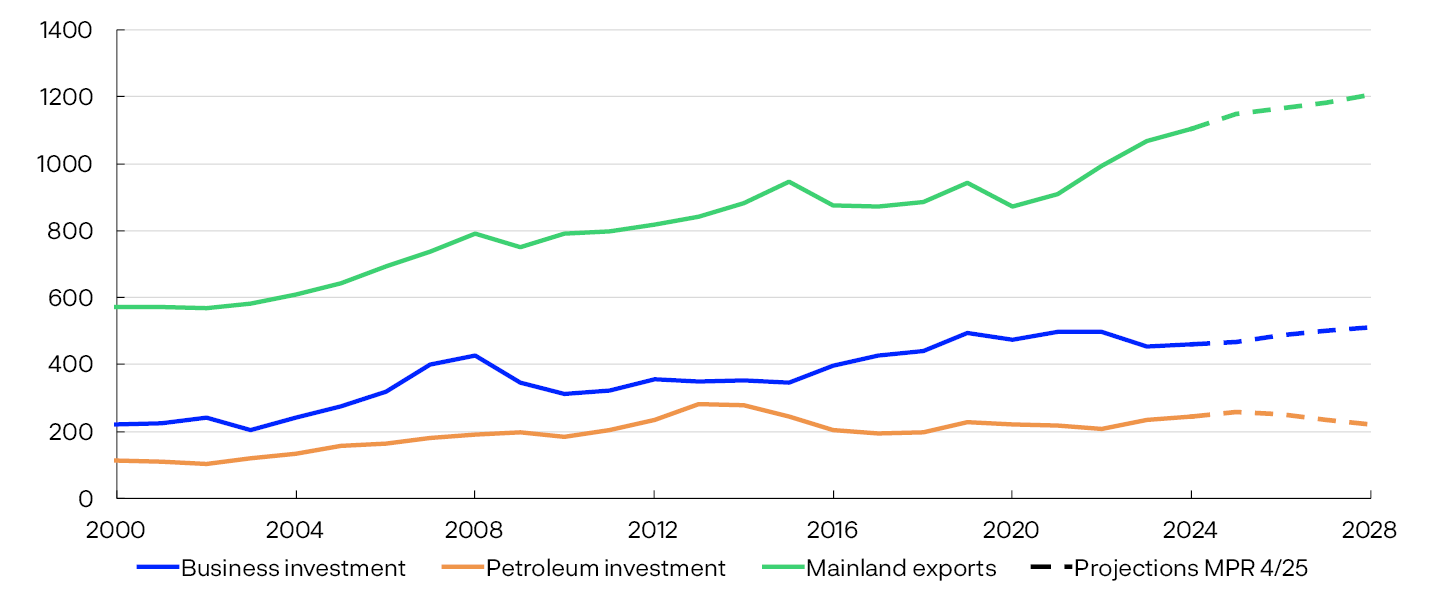
Household consumption is the main driver of GDP growth in the years ahead. Export growth remains firm in 2025 but is expected to slow ahead. Housing and business investment are expected to pick up further out in the projection period. Petroleum sector investment is expected to decline ahead as ongoing development projects reach completion. Growth in public sector demand is projected to increase in 2026, before gradually drifting down. For detailed projections and changes from the previous Report, see Annex Tables 2 and 3.
Main revision of national accounts
Statistics Norway publishes a main revision of national accounts approximately every five years. The purpose of the revision is to incorporate significant level changes resulting from new methods, new statistics or new principles to ensure consistent developments without breaks in the time series.
The most recent main revision was published in November 2025, with the key change being the introduction of a new and improved method for calculating the value of owner-occupied housing. An updated and enhanced quality-assured data set on home addresses from the Property Register is now used. In addition, calculations relating to holiday homes have been enhanced. The change in method results in a marked upward revision of household consumption going back 15–20 years and is the main reason why mainland GDP, at current prices, is around 5% higher in 2022 than in the previous publication of the national accounts. After 2022, annual growth in dwelling services has been subject to less revision, resulting in a considerably lower annual rate of growth than in the preceding years (see Table 2.B). This may indicate that the rapid growth in dwelling services has passed and should not be interpreted as a permanent shift in trend household consumption growth.
Employment is little changed in the main revision, and given the upward revision of GDP, this results in higher historical productivity growth for mainland Norway as a whole. Excluding value added of dwelling services, changes in productivity since 2010 are small. Norges Bank’s estimate for mainland trend productivity has therefore not been adjusted on the basis of new national accounts data.
Table 2.B Main revision of national accounts
|
Average annual growth. Changes from previous publication of the national accounts in parenthesis |
GDP, mainland Norway |
Household consumption |
Dwelling services |
|---|---|---|---|
|
2000–2009 |
3.1 (0.3) |
4.0 (0.6) |
4.8 (2) |
|
2010–2019 |
2.3 (0.2) |
3.2 (0.8) |
4.8 (2) |
|
2022–2024 |
2.5 (0.5) |
2.6 (-0.1) |
2.4 (-0.7) |
- 1 Regional Network surveys 3/25 and 4/25. The SMART modelling system for short-term forecasting is based on historical relationships. It weights empirical models based on previous forecasting properties.
- 2 The data for petroleum investment in this chart include investment in international shipping. Public demand = public consumption + public investment.
Households
Higher interest rates and high inflation reduced household purchasing power in 2023 and contributed to a fall in consumption. However, households limited the decline in consumption by reducing saving. In 2024, the rise in household real disposable income was the sharpest in over a decade. Consumption picked up, but less than income, and together with higher pension saving, this has boosted the saving ratio.
Constant 2023 prices. In billions of NOK

So far in 2025, consumption growth has been strong, reflecting a broad-based increase in goods consumption. The level of household services consumption was revised up significantly in the main revision of the national accounts. Services consumption has risen little in recent quarters (Chart 2.6). From Q2 to Q3, household consumption growth was as projected in the September Report. Consumption is expected to grow by 3.3% in 2025, with annual growth slowing further out in the projection period. The consumption growth projection for 2025 is above the average for the past 15 years. Compared with the September Report, consumption growth projections have been revised up for 2025 and down for the next two years. The projections are based on the following:
- Regional Network retail trade contacts have revised up their activity level expectations for 2025 Q4, in particular owing to the government’s tax changes for electric vehicles. Figures for household car purchases indicate brisk growth in goods consumption in Q4, while retail trade figures showed only a slight increase from September to October.
- Regional Network contacts expect that sales of consumer durables will increase further this winter. Some contacts in both retail trade and household services expect increased purchasing power to push up household demand further.
- Publication of quarterly household income accounts has been postponed until January. The main revision of the national accounts is expected to result in revised figures for household income and saving. The income and saving projections in this Report are based on data published prior to the main revision. Growth in household real disposable income is projected at 4% in 2025. Further ahead, lower wage growth is expected to weigh on income growth, but lower interest rates are expected to cushion the decline. Lower income growth will likely dampen consumption growth.
- Pension saving is assumed to remain elevated ahead and consumption to increase less than household disposable income in the coming years. The saving ratio is projected to increase and reach its average level from the 2010s towards the end of the projection period.
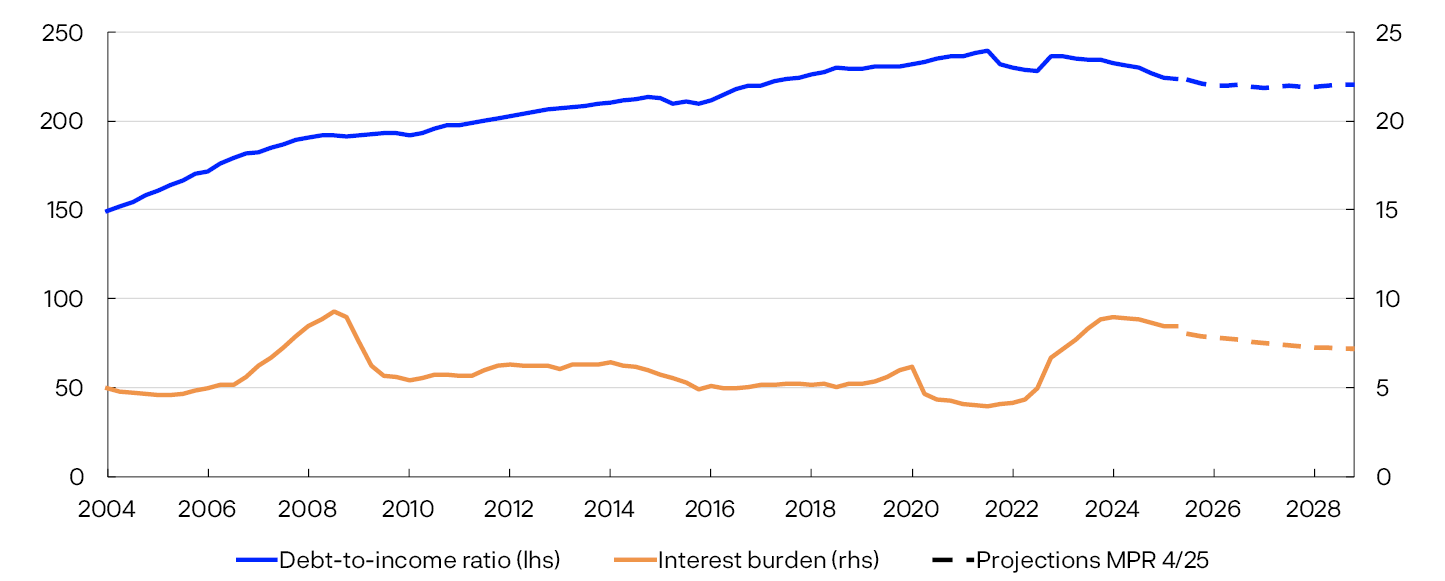
- Households are highly indebted, and the interest burden has increased in recent years (Chart 2.7). Debt levels are expected to rise broadly in pace with household income, resulting in minor changes in debt-to-income (DTI) ratios ahead. DTI ratios are projected to be lower ahead than in recent years. Lower interest rates will reduce household interest burdens in the coming years.
Percent
Housing market
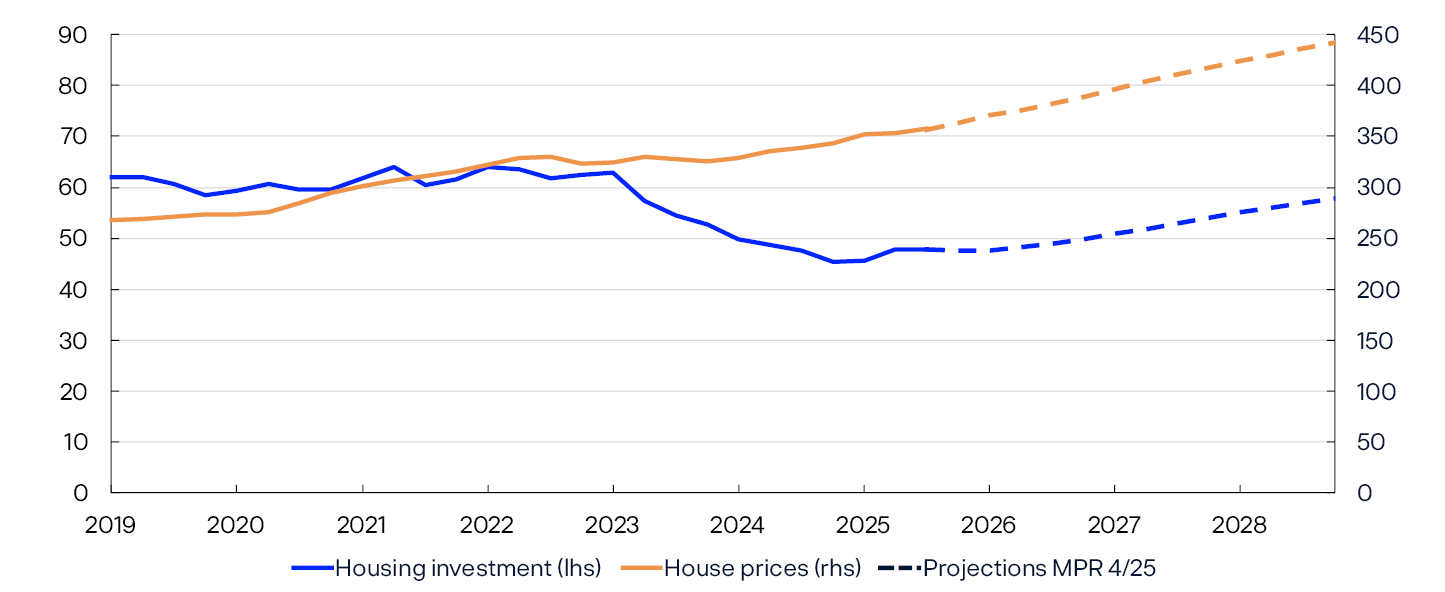
Even though housing investment figures have been revised up considerably, they still show a marked decline. New figures show that housing investment fell by around 30% between the beginning of 2022 and the end of 2024, partly reflecting a marked increase in material costs and higher interest rates. Annual housing investment growth is expected to pick up from 2026, but less than projected in the September Report. The projected level in 2028 is still lower than in 2022 (Chart 2.8).
Constant 2023 prices. In billions of NOK (investment). Index. January 2003 = 100 (prices)
The projections are based on the following:
- Regional Network contacts in construction expect activity levels to decline in the next quarters. Expectations are more muted than in September, but some contacts are planning to launch new housing construction projects this winter.
- Figures for housing starts and new home sales indicate weak developments in housing investment in the coming quarters.
- Increased household purchasing power is expected to lead to higher demand for both new and existing homes ahead.
- Lower interest rates and higher house prices improve profitability in construction and may lead to more projects coming to fruition.
In 2024, prices in the secondary housing market increased by 3%. Regulatory easing of equity requirements for house purchases and expectations of lower interest rates likely contributed to a steep rise in house prices at the beginning of 2025. Following nearly unchanged house prices this spring, activity in the secondary housing market has picked up, and the rise in house prices has picked up through summer and autumn. Developments have been broadly as projected in the September Report. The annual rise in prices in the secondary housing market is expected to increase in 2025 and remain firm to the end of the projection period. The projections are based on the following:
- Lower interest rates pull in the direction of higher house prices.
- Continued household income growth and high employment are expected to boost housing demand in the coming years.
- A low supply of new homes suggests higher house prices.
Firms
Mainland business investment has been sluggish in recent years, partly reflecting higher interest rates and other costs since 2021. Growth in business investment is expected to pick up in 2026 (Chart 2.9).
Constant 2023 prices. In billions of NOK
The projections are based on the following:
- Lower interest rates are expected to boost investment somewhat in the projection period.
- Information from the Regional Network indicates an upswing in services investment in 2026.
- According to the most recent investment intentions survey from Statistics Norway, power sector investment will increase substantially in 2025 and 2026.
- The survey also indicates that investment in manufacturing and mining and quarrying is likely to increase somewhat in 2026.
Petroleum investment has increased markedly over the past two years, reflecting the launch of a number of development projects in 2022 in response to the petroleum tax package and high oil and gas prices. Petroleum investment is expected to increase further in the period between 2024 and 2025, and then to decline somewhat over the next three years. The projections are based on the following:
- Investment in ongoing development projects will fall from around NOK 110bn in 2025 to close to zero in 2028.
- Oil companies have announced a host of new development projects ahead that will generate substantial investment, but not enough to fully compensate for the decline in ongoing development projects.
- According to the investment intentions survey, petroleum sector investment will fall in 2026.
- Oil and gas prices have fallen since the September Report, which will likely dampen investment ahead.
Mainland exports have expanded markedly since 2021, largely driven by the krone depreciation in the period to summer 2023, increased tourism and higher investment in oil, gas and green technology abroad.
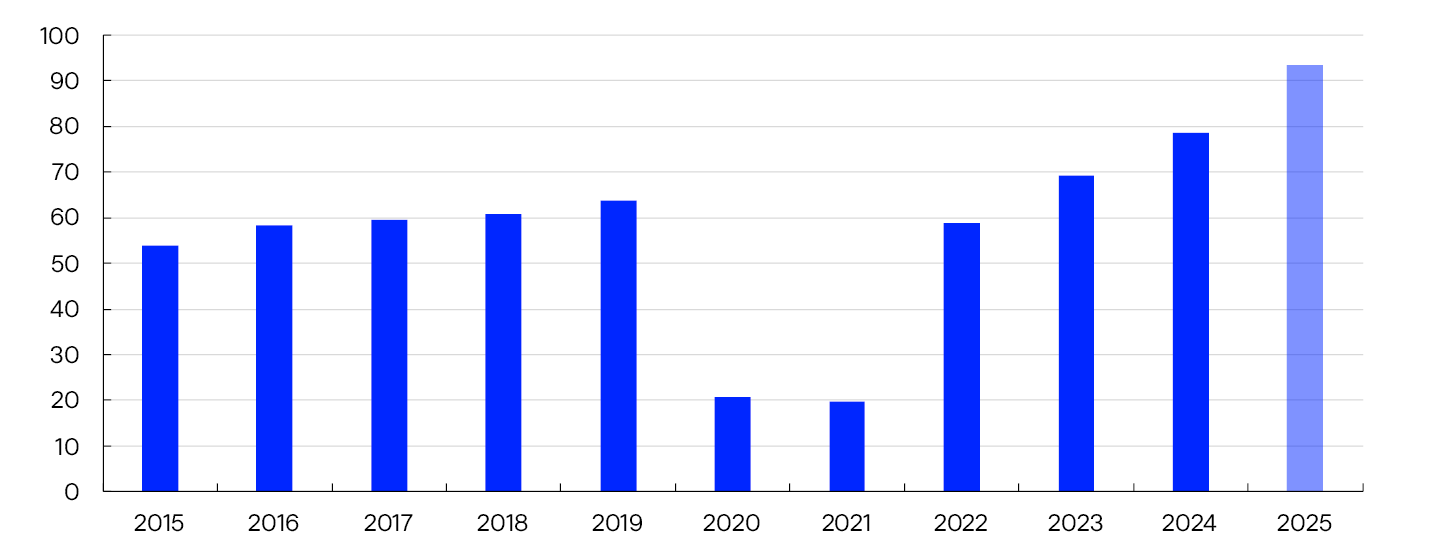
A number of the same factors are helping sustain export growth in 2025. Foreign tourism in Norway appears to be rising substantially (Chart 2.10). In addition, there is a very high level of activity in aquaculture. Following the introduction of tariffs, growth in Norwegian salmon exports to the US has declined, but Norwegian seafood exports to Asia have increased.
Constant 2023 prices. In billions of NOK
Moderate export growth is projected from 2026 to the end of the projection period. The projections are based on the following:
- According to the Regional Network, Norwegian exporters expect growth to soften from Q3 to Q4 and envisage a slight pickup in growth through winter.
- The EU’s safeguard measures on ferroalloys and other tariff increases implemented so far will likely have little effect on overall mainland exports.
- Trading-partner GDP growth is expected to remain firm over the coming years.
- Developments in global petroleum investment are likely to be far weaker ahead than in the period between 2022 and 2024 and thereby dampen Norwegian export growth. Some of the decline may be offset by increased investment in global green technology.
Fiscal policy
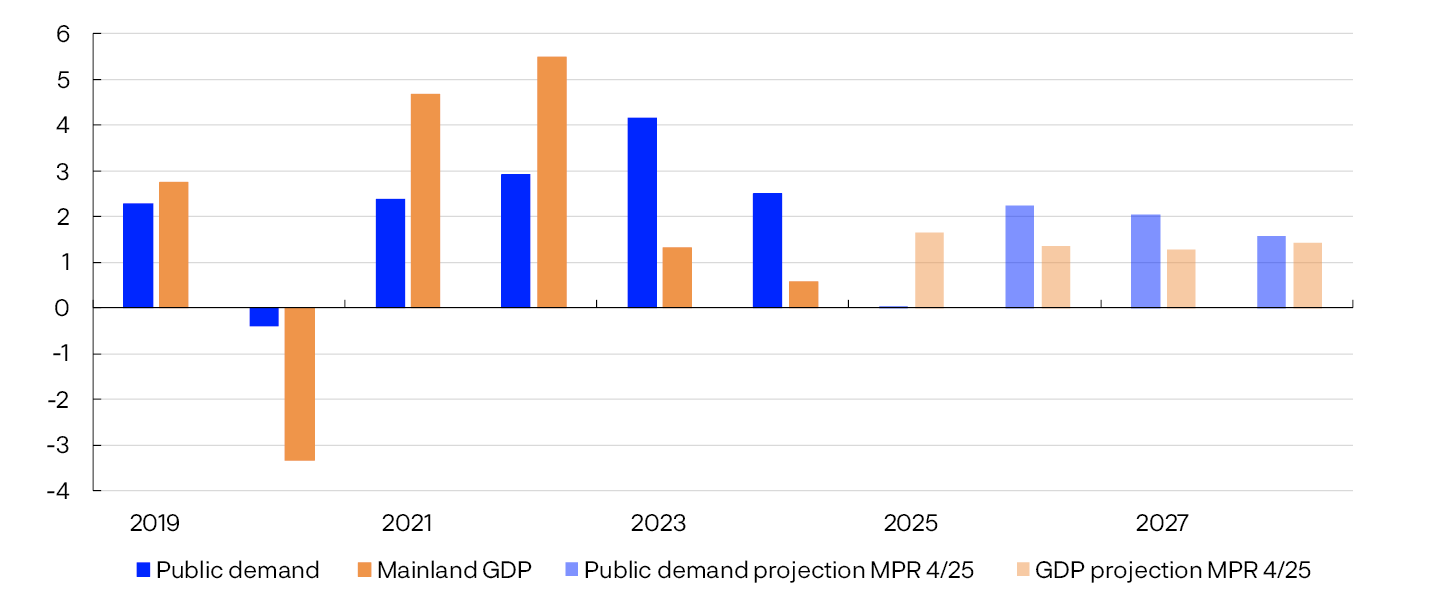
After rising sharply in 2023, growth in public demand weakened somewhat in 2024. So far in 2025, the level of public demand has declined, particularly due to lower public investment. The growth projection for 2025 has therefore been adjusted down from the September Report. From 2026, growth in public demand is projected to be somewhat higher than growth in mainland GDP (Chart 2.11). The projections for public demand growth are little changed from the September Report for the years 2026–2028.
Annual change. Percent
The projections are based on the following:
- The structural non-oil budget deficit as a share of the Government Pension Fund Global (GPFG) is assumed to be in line with the approved fiscal budget for 2026. This implies that government spending in 2026 will be a little higher than assumed in the September Report. As a share of the GPFG, the deficit is still estimated at 2.8%. At the same time, the final budget for 2025 indicates that government spending has been slightly lower than expected.
- Support for Ukraine accounts for some of the growth in government spending in 2025 and 2026. This is expected to have little effect on domestic demand but will contribute to increasing the budget deficit.
- Defence spending is expected to boost growth in public demand through the projection period. Developments are assumed to be in line with the long-term plan for the Norwegian defence sector adopted in 2024.
According to the estimates from the Ministry of Finance, the fiscal stance, as set out in the budget bill for 2026, will have a slight expansionary effect on the level of activity in 2026. The budget compromise in the Storting (Norwegian parliament) implies slightly higher government spending than in the proposed budget, which in isolation contributes to slightly higher activity in the Norwegian economy.
- 7 Public demand = public consumption + public investment.
Labour market and the output gap
Capacity utilisation, or the output gap, is a measure of the difference between actual output in the mainland economy and potential output. The output gap and potential output cannot be observed and must therefore be estimated. In the near term, the output gap is estimated based on a number of indicators and models, with particular weight given to labour market developments. The potential output estimate follows from the output gap and GDP estimates. In the longer-term, the potential output and output gap estimates are based on estimated trend productivity and on the Bank’s assessment of the highest sustainable level of employment over time consistent with stable wage and price inflation (trend employment, N*).
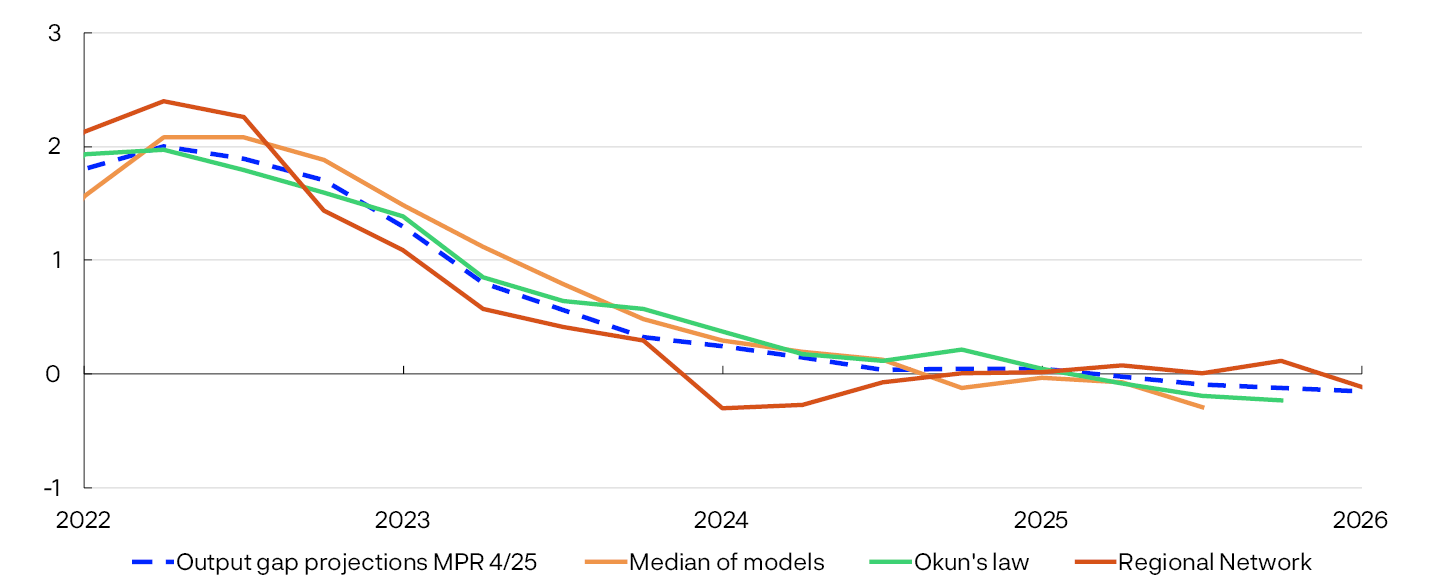
Output in the Norwegian economy is assessed to have declined relative to potential through 2023 and to have reached potential in 2024 (Chart 2.12). In recent quarters, output has likely declined slightly relative to potential, and there is now slightly more spare capacity in the economy than projected in September. In the projections, output relative to potential is slightly lower over the coming years than envisaged in the September Report.
Percent
This assessment is based on the following:
- Registered unemployment has increased somewhat through 2025. The break in Nav’s (Norwegian Labour and Welfare Administration) registered unemployment statistics in spring adds to uncertainty about developments in unemployment through spring and summer. Unaffected by the break, the number of fully unemployed benefit recipients increased in this period, indicating somewhat higher registered unemployment. Adjusted for normal seasonal variations, registered unemployment has risen to 2.2% since the September Report. This is slightly higher than projected and slightly above the level consistent with output at potential.
- Over time, the Labour Force Survey (LFS) indicates that unemployment has risen more than registered unemployment, partly reflecting an increase in the number of job seekers.
- In 2025 Q3, employment edged up, but less than projected in the September Report. The employment to population ratio declined slightly but remains close to trend employment. Preliminary data indicate that employment rose further in October. Regional Network contacts expect weak employment growth in 2025 Q4 and 2026 Q1.
- The share of Regional Network contacts reporting capacity constraints and labour shortages has declined somewhat since the previous survey, suggesting slightly lower output relative to potential in the near term than envisaged in September.
- The stock of vacancies in Statistics Norway’s sample survey from 2025 Q3 was lower than in the same period in 2024. The inflow of new vacancies has also declined somewhat and is at a slightly lower level than in 2024, indicating a slight decline in labour demand.
- Norges Bank’s modelling system for capacity utilisation incorporates variables such as mainland GDP, employment, unemployment, wage growth and inflation. The models indicate that capacity utilisation has declined from a normal level through 2025 (Chart 2.12).
- The modelling system now indicates that the cyclical peak in 2022 was somewhat higher than previously projected, and as a result, estimated capacity utilisation has been revised up for this period.
Capacity utilisation is expected to decline somewhat ahead and bottom out in 2027. Capacity utilisation is estimated to remain below a normal level throughout the projection period. In the projections, the number of unemployed rises slightly, but the unemployment rate remains steady at 2.2% in the coming years (Chart 2.13).
Percent
Employment is projected to rise in pace with the working-age population through 2026, until the employment to population ratio picks up somewhat in subsequent years.
Table 2.1 Output and potential output3
|
Change from projections in Monetary Policy Report 3/2025 in parentheses |
Percentage change from previous year |
|||||
|---|---|---|---|---|---|---|
|
2005–2014 |
2015–2024 |
2025 |
2026 |
2027 |
2028 |
|
|
GDP, mainland Norway |
3.1 |
1.9 |
1.6 (-0.4) |
1.3 (-0.2) |
1.3 (0) |
1.4 (0.1) |
|
Potential output |
3 |
1.9 |
1.8 (-0.3) |
1.5 (-0.1) |
1.5 (0) |
1.3 (0.1) |
|
Trend employment (N*) |
1.5 |
0.9 |
1.1 (0.1) |
0.9 (0) |
0.8 (0) |
0.6 (0) |
|
Underlying productivity growth |
1.5 |
1 |
0.7 (-0.3) |
0.7 (0) |
0.7 (0) |
0.7 (0) |
Potential output growth is assessed to have slowed over the past decade compared with the preceding decade (see Table 2.1). Potential output growth is projected to be underpinned by temporary factors in 2025 and to slow gradually thereafter through the projection period. The projection for 2025 is somewhat lower than in the September Report and is little changed further out in the projection period. These assessments are based on the following:
- In recent years, productivity growth has been low (Chart 2.14). So far in 2025, productivity growth has picked up, albeit somewhat less than projected in the September Report.
Percent
- In connection with the main revision of the national accounts, historical mainland productivity growth has been revised up in the period 2000–2022, primarily reflecting changes in methodology, which are not expected to affect productivity growth ahead (see box on “Main revision of national accounts”). Further out in the projection period, productivity growth is broadly as projected in the September Report.
- Population growth has picked up in recent years, primarily reflecting the large inflow of Ukrainian refugees. This has pushed up trend employment, which has also been lifted somewhat by higher employment among the youngest and oldest cohorts (see Monetary Policy Report 3/2025 for further details). Looking ahead, trend employment growth is expected to gradually slow, reflecting prospects for a decline in population growth, in line with Statistics Norway’s population projections
- Trend employment will also be affected by developments in the number of temporary foreign workers. This number has risen since end-2024 and is expected to continue to rise in the coming years in pace with a pickup in construction activity.
- 1 Regional Network is a direct estimate of the output gap based on the average of the capacity utilisation indicators in the Regional Network and the historical correlation with Norges Bank’s output gap estimate where the Regional Network indicator leads by one quarter. “Okun’s law” is based on an estimated deviation from the trend in registered unemployment as a percentage of the labour force.
- 2 Registered unemployed as share of the labour force. Seasonally adjusted.
- 3 The contributions from the growth in N* and trend productivity do not necessarily sum exactly to the annual change in potential output due to rounding.
- 4 Annualised quarterly changes. Productivity growth in the Regional Network is calculated as contacts’ reported output growth less employment growth. The observation for Q1 2026 is based on contacts’ expectations. A two-quarter moving average is calculated. Observations from the Regional Network for 2020 have been removed due to scaling difficulties during the pandemic. Productivity growth in the quarterly national accounts is given as mainland GDP per employed person. A four-quarter moving average is then calculated.
Wages
In recent years, high inflation, a tight labour market and strong manufacturing profitability have pushed up wage growth. In 2024, wage growth reached 5.6%. In 2025, wage growth is expected to decline to 4.9%, which is somewhat higher than projected in September (Chart 2.15).
Percent

The projection is based on the following:
- In the 2025 wage negotiations, the wage norm for manufacturing was set at 4.4%.
- According to Norges Bank’s Expectations Survey, Regional Network contacts and the social partners expect wage growth of 4.4% in 2025. On balance, expectations are little changed compared with Q3.
- Quarterly register-based data for wage earners normally provide a reliable indication of annual wage growth as measured in the national accounts, which is the variable used in the projections. Register-based data show that wage growth has remained higher than the wage norm so far in 2025. In Q3, wage growth was slightly stronger than assumed in September and was broad-based. Some of the increase in the register-based figures is linked to retroactive payments for 2024, which are recognised in the national accounts under annual wage for 2024. The extent to which bonuses and various wage settlements in 2025 are captured in the statistics is uncertain, and the figures fluctuate widely. Overall, these data show higher wage growth in 2025 than projected in the September Report. Historically, third-quarter register-based data have provided a more reliable indication of wage growth than fourth-quarter survey-based wage expectations.
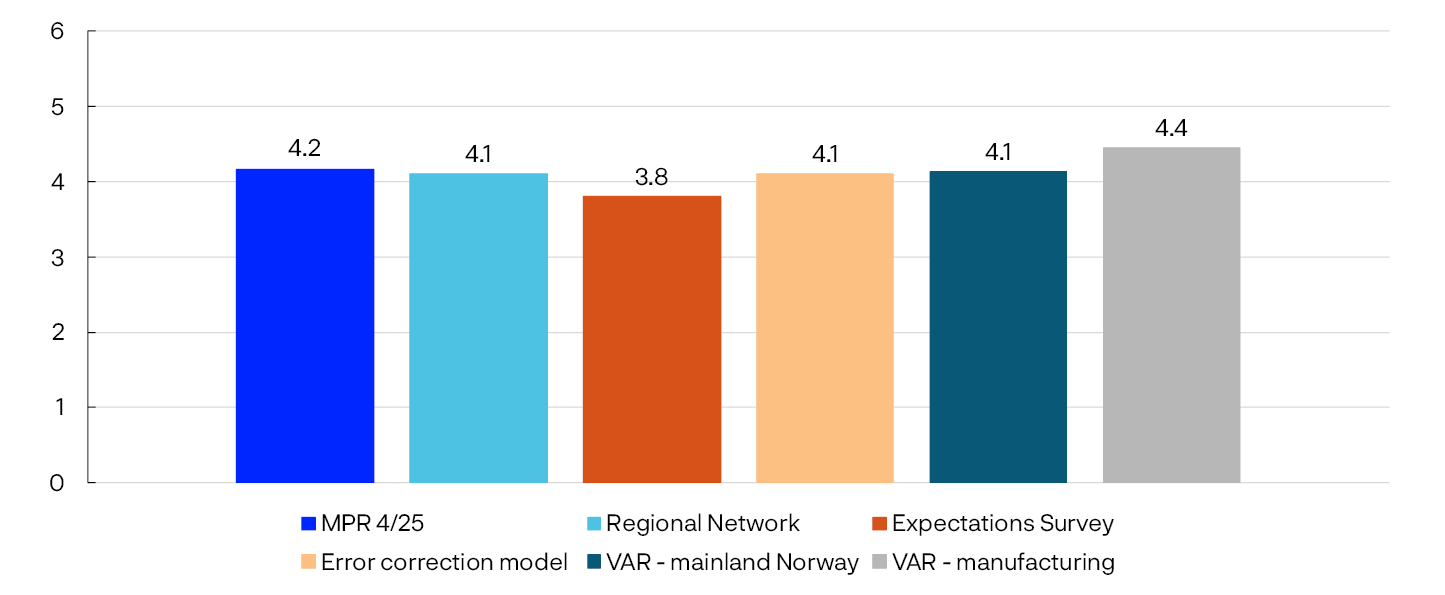
In 2026, wage growth is expected to decline to 4.2%. The projection is unchanged from September. Owing to lower inflation in 2026, real wage growth is projected to show little change. The assessment is based on the following:
- In the projections, lower capacity utilisation and inflation ahead pull down wage growth in the coming years.
- According to revised national accounts figures, the overall wage share in the business sector was close to its historical average in 2023, which is the latest published figure for factor income. In manufacturing, the wage share picked up and was higher than assumed prior to the revision, albeit still somewhat lower than its historical average. Other statistics indicate that the wage share has since increased further. However, there is uncertainty about both the level of the wage share and the effect of changes in wage share on wage growth. In isolation, a higher wage share in manufacturing pulls in the direction of slightly lower wage growth ahead than previously envisaged.
- Producer price inflation, measured by the Norwegian mainland GDP deflator, is expected to outpace consumer price inflation throughout the projection period. This allows real wages deflated by consumer prices to increase more than productivity without weakening firms’ overall profitability. Growth in the GDP deflator in 2025 and 2026 is projected to be slightly weaker than in the September Report. The revision of actual data, together with prospects of lower oil prices and domestic inflation contributes to the downward revision.
- Wage growth projections for 2025 have been revised up. In Norges Bank’s empirical models, higher wage growth in isolation indicates higher wage growth in the subsequent year. The model estimates indicate slower wage growth in 2026 (Chart 2.16). The wage growth projection for 2026 is close to the model estimates.
Annual change. 2026. Percent
Prices
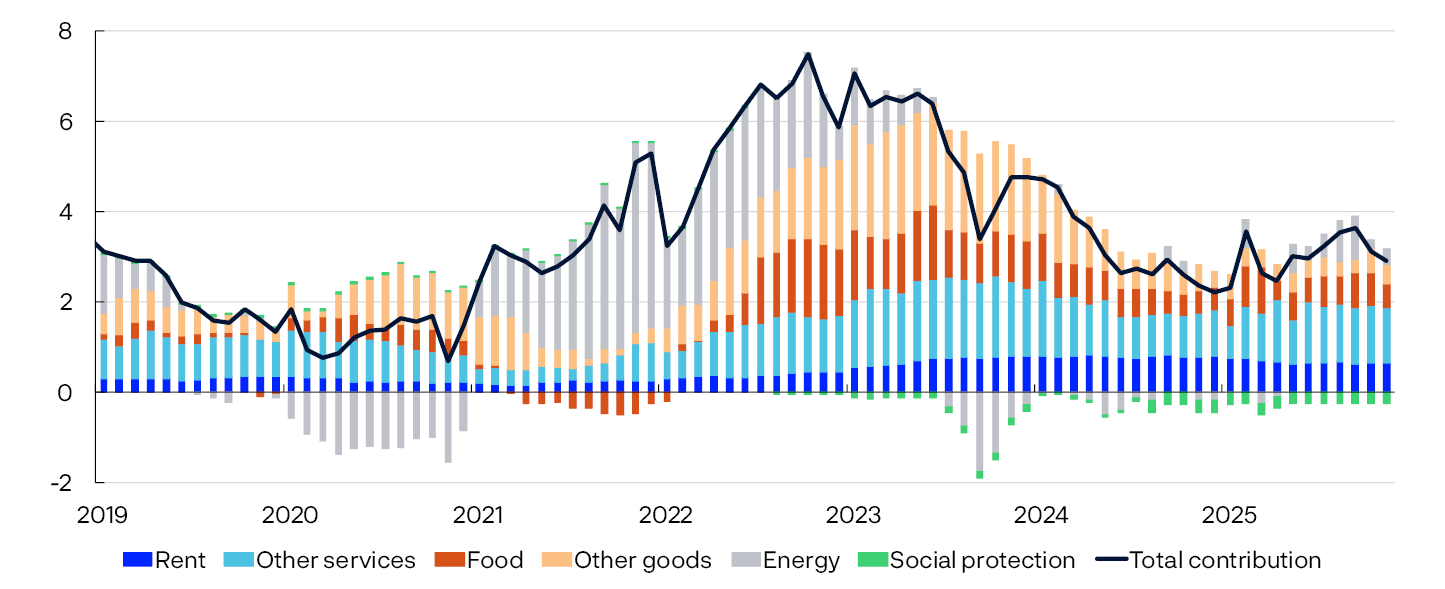
The post-pandemic inflation surge was triggered by an import price shock. Together with a krone depreciation, this pushed up imported goods prices. The 12-month rise in the consumer price index (CPI) peaked at 7.5% at the end of 2022. Since then, imported consumer goods inflation has slowed considerably and is now at a low level. In recent years, high wage growth combined with low productivity growth has pushed up business costs, and domestically produced goods and services inflation remains elevated.
The rise in prices has shown little change over the past year. High services, rent and food inflation is keeping inflation elevated (Chart 2.17).
CPI subcomponents. Contribution to twelve-month change. Percent
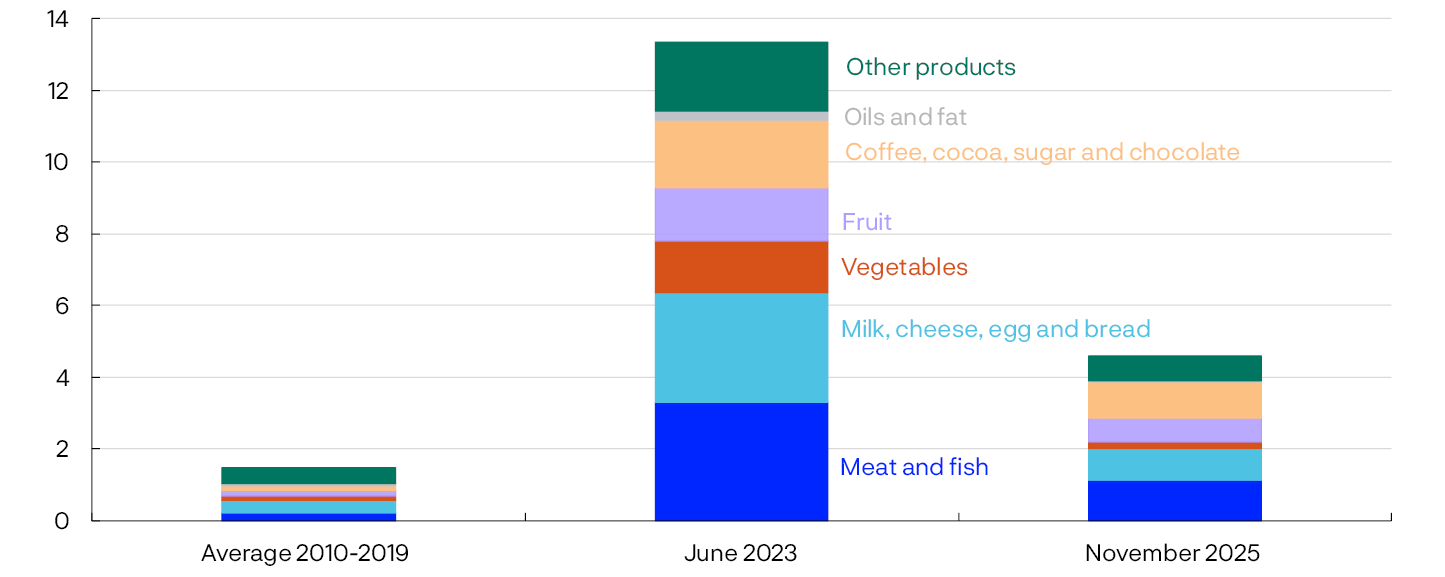
Food and beverage inflation rose sharply through 2022 and peaked in mid-2023. This rise was broad-based but the rise in prices for food products produced in Norway, such as meat, fish and dairy products was particularly sharp (Chart 2.18). Price inflation for these product groups has declined considerably in recent years but is still higher than in the decade preceding the pandemic. Price inflation for smaller imported product groups, such as coffee and cocoa, also increased substantially when food inflation rose. However, inflation for these product groups has remained high and is now contributing to keeping inflation elevated.
Food and beverage products by subcomponent. Contribution to twelve-month change. Percent
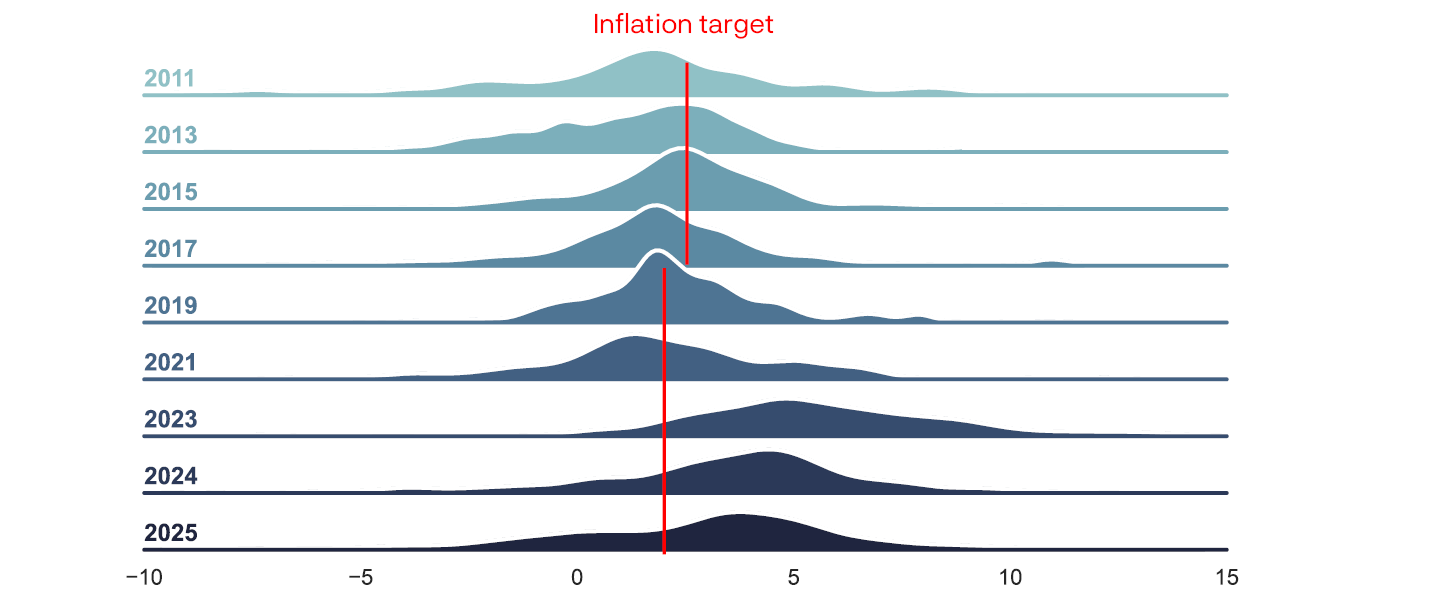
Inflation remains broad-based, and inflation for a majority of the subcomponents in the CPI adjusted for tax changes and excluding energy products (CPI-ATE) is clearly above the 2% target (Chart 2.19). Compared with the period before the inflation surge, inflation is now high for a higher number of subcomponents. At the same time, inflation has declined for many of the subcomponents and is now low for a number of them.
Twelve-month change
Underlying inflation
In November, the 12-month rise in CPI-ATE inflation was 3.0%, broadly as projected in the September Report. Underlying inflation is expected to remain slightly below 3% in 2026 before declining towards 2% towards the end of the projection period. Compared with the September Report, the projections for underlying inflation have shown little change in the near term and have been revised up slightly for the coming years. The projections are based on the following:
- According to the forecast from Norges Bank’s System for Model Analysis in Real Time (SMART), which weights forecasts from a broad set of models, inflation is now somewhat higher inflation compared with the September Report (Chart 2.20). The forecasts for underlying inflation in the next quarters are closely aligned with the SMART
CPI-ATE. Four-quarter change. Percent
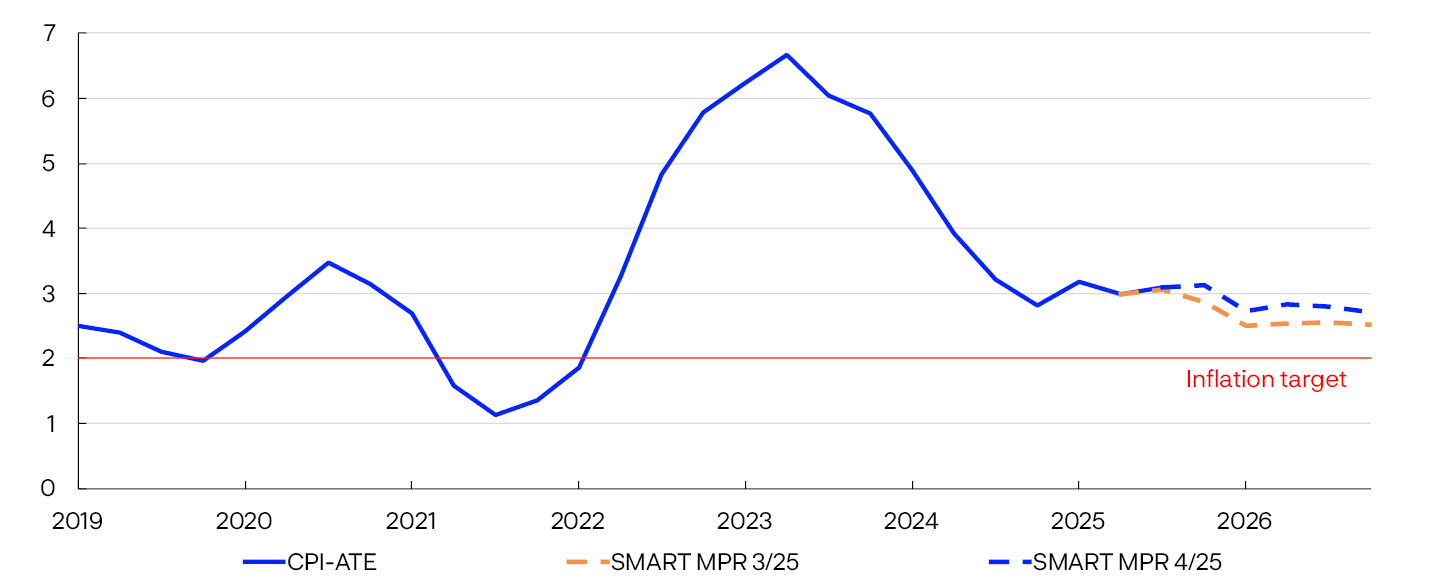
- forecasts.
- Wage growth has been high in recent years and is projected to come down after some time. The wage growth projections have been revised up somewhat for 2025, and productivity growth has been somewhat lower than expected in the September Report. Growth in labour costs is expected to moderate in the next years and contribute to a gradual decline in the rise in prices for domestically produced goods and services.
- Capacity utilisation is expected to decline somewhat in the coming years. Lower capacity utilisation dampens inflation through lower demand for labour, goods and services. Compared with the September Report, the output gap forecast has been revised down slightly.
- Rent inflation has recently shown little movement. In connection with the main revision of the national accounts, dwelling services are weighted more heavily in overall household consumption (see box on “Main revision of national accounts” for details). When the CPI weights are updated in conjunction with the main revision as from January 2026, rent is assigned a higher weight. Norges Bank’s projections for further rent inflation largely track the rise in underlying inflation in the coming years.
- The krone exchange rate has been weaker than projected in the September Report (see box on “The krone exchange rate”), pulling in the direction of somewhat higher imported consumer goods inflation ahead.
- The rise in Norges Bank’s indicators of international price impulses to imported intermediate goods (IPI) and international price impulses to imported consumer goods (IPK) has has become less pronounced since the peak and is now at a low level (Annex Table 1). Subdued international price impulses are expected to keep imported consumer goods inflation low ahead.
Overall inflation
In November, the 12-month rise in the CPI was 3.0%, higher than projected in the September Report. Energy prices lead to wide fluctuations in overall CPI inflation, but the introduction of a state-funded fixed electricity price scheme, “Norgespris”, is expected to make the energy subcomponent of the CPI more stable ahead. The scheme was launched in October, and so far, around half of households in southern Norway have opted in. The effect of “Norgespris” has been less pronounced than assumed in the September Report due to a lower-than-assumed share of households opting in.
Overall inflation is expected to decline in 2026 and then to edge up towards 2027. Compared with the September Report, the projections for overall inflation have been revised up slightly. The projections are based on the following:
- Underlying inflation is expected to decline and gradually approach 2%.
- The rate of increase in the energy subcomponent of the CPI has been higher than expected. The share of households opting for “Norgespris” is expected to increase somewhat ahead. At the same time, energy futures prices, as assumed in Norges Bank’s projections, are somewhat lower for the coming years than they were in September.
- Norges Bank’s projections are based on the fiscal changes in the central government budget for 2026. From 1 January 2026, the VAT exemption threshold for electric vehicles will be lowered to NOK 300 000. This is projected to push up overall CPI inflation by approximately 0.3 percentage point in 2026. In the projections, this is assumed not to change CPI-ATE inflation. A further cut in electricity taxes will take effect from 1 January 2026, which will contribute to pulling down overall inflation in 2026.
- 1 Contributions estimated based on the CPI by consumption categories (group level). “Social protection” mainly refers to daycare and after school programs. In the statistics, some differences occur between the sum of the components and overall inflation.
- 2 Contributions from the CPI subcomponent “food and non-alcoholic beverages” based on subcomponent 1. Inconsistencies in the data occur between the sum of the components and total food and beverage inflation.
- 3 Distribution of 12-month change in inflation across 38 CPI subcomponents each month, per year. Subcomponents with energy prices, 04.5 (electricity, gas and other fuels) and 07.2 (operation of personal transport equipment), are excluded.
- 4 The SMART modelling system for short-term forecasting is based on historical relationships. It weights empirical models based on previous forecasting properties.
The krone exchange rate
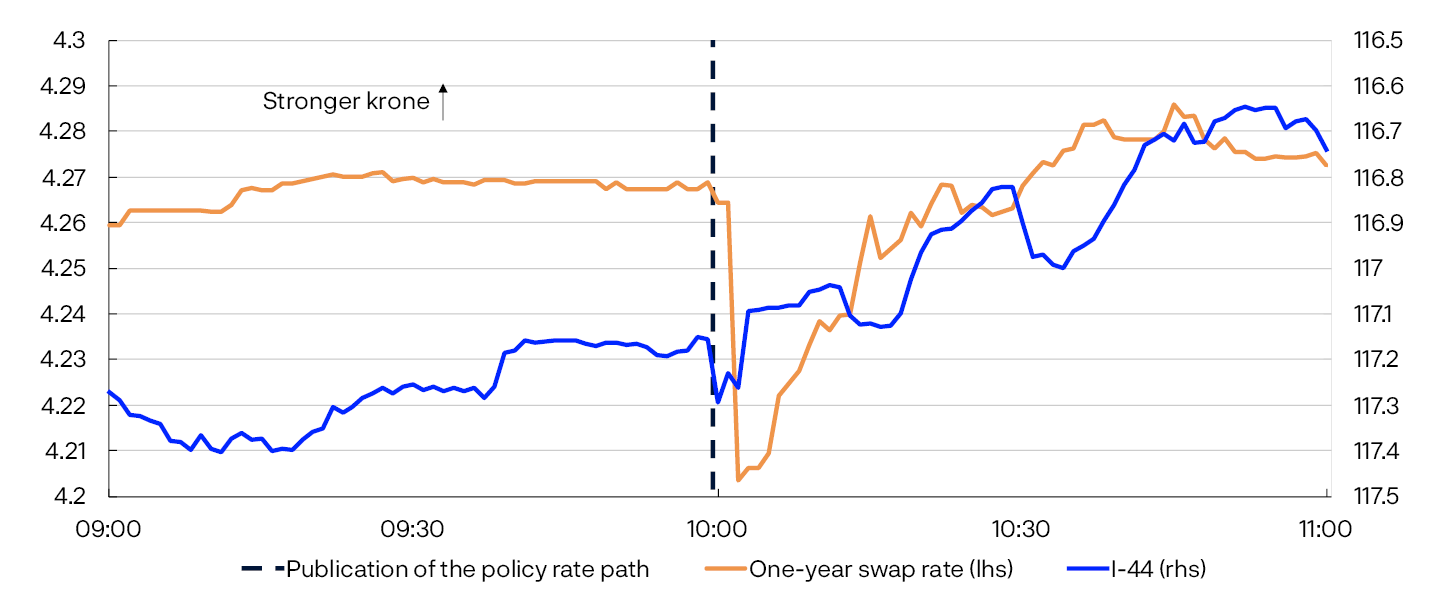
The krone exchange rate, as measured by the import-weighted exchange rate index I-44, changed little upon publication of the September 2025 Monetary Policy Report (Chart 2.A), as projected. Since September, the exchange rate has weakened by a little more than 2% and is weaker than projected in the September Report. The change in the krone exchange rate coincides with lower oil prices and a somewhat lower policy rate differential against other countries (Chart 2.B). The change in the policy rate differential is partly due to the fact that the market now expects slightly higher policy rates abroad and a slightly lower policy rate in Norway.
I-44 and one-year Norwegian swap rate. 9am to 11am on 18 September 2025
Policy rate differential against Norway’s main trading partners. Percent
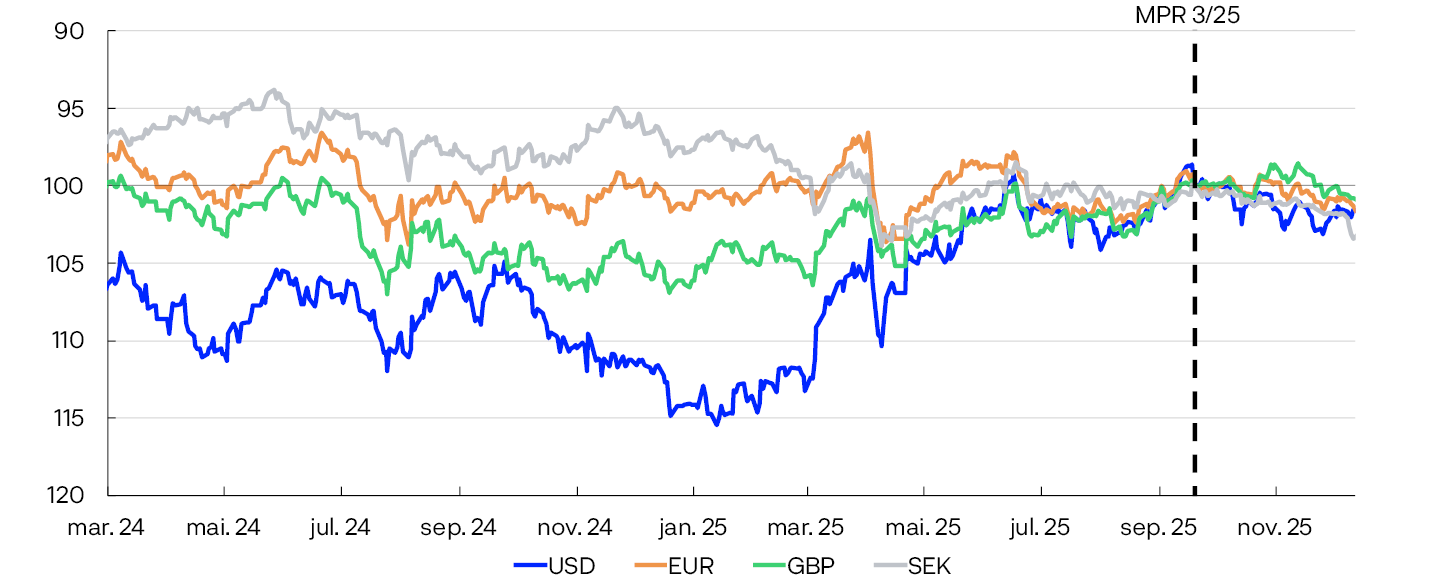
The krone is weaker against a basket of our main trading partner currencies (Chart 2.C). The US dollar appreciation pressures through autumn have subsided, but the krone is still 2% weaker against the US dollar and has depreciated by approximately the same against the euro. The depreciation against the Swedish krona was somewhat more pronounced, but less so against pound sterling.
Index. 19 September 2025 = 100
Norges Bank’s krone projections assume an effect of unexpected near-term policy rate changes (see box “The effect of monetary policy on the krone exchange rate” in Monetary Policy Report 1/2025). The magnitude of the assumed effect depends on how Norges Bank expects market interest rates to move following a policy rate decision. Beyond policy rate developments, Norges Bank normally has no information other than what the market has already priced into the exchange rate, and the krone exchange rate is therefore normally assumed to remain stable further ahead.
In this Report, the krone exchange rate is expected to remain broadly unchanged upon publication of the policy rate forecast (Chart 2.D). This can be viewed in the context of the fact that the change in the policy rate forecast is broadly consistent with the change in policy rate expectations. The krone exchange rate is thereafter assumed to remain unchanged to the end of the projection period.
Import-weighted exchange rate index. I-44

- 1 Intraday movements in the krone exchange rate and one-year swap rate. An increase in the series means a stronger krone and a rise in interest rates.
- 2 Policy rates abroad are trade-weighted averages of the policy rates of the Bank of England, Sveriges Riksbank, the Federal Reserve and the European Central Bank.
- 3 For all currencies in the chart, the exchange rate is against NOK. 19 September 2025 = 100. An increase in the series means that NOK has appreciated against the foreign currency.
- 4 An increase in the series means that NOK has appreciated against the import-weighted index I-44.
3. Monetary policy analysis
This section describes the monetary policy analysis presented to Norges Bank’s Monetary Policy and Financial Stability Committee, forming part of the basis for the policy rate decision. The policy rate forecast is described and explained in the Committee’s assessment.
Model implications of new information
New information
The forecasts and the monetary policy analysis are based on the macroeconomic model NEMO and other economic models, as well as on analyses of the current economic situation and assumptions regarding key driving forces. For 2025 Q4 and 2026 Q1, NEMO is conditioned on the near-term projections further described in Section 2. Beyond the first two quarters, the model is conditioned on various exogenous driving forces, such as petroleum prices, global economic developments and petroleum investment. After conditioning on historical data, short-term forecasts and exogenous driving forces, NEMO provides forecasts for the remainder of the forecast horizon. The forecasts are cross-checked against other models.
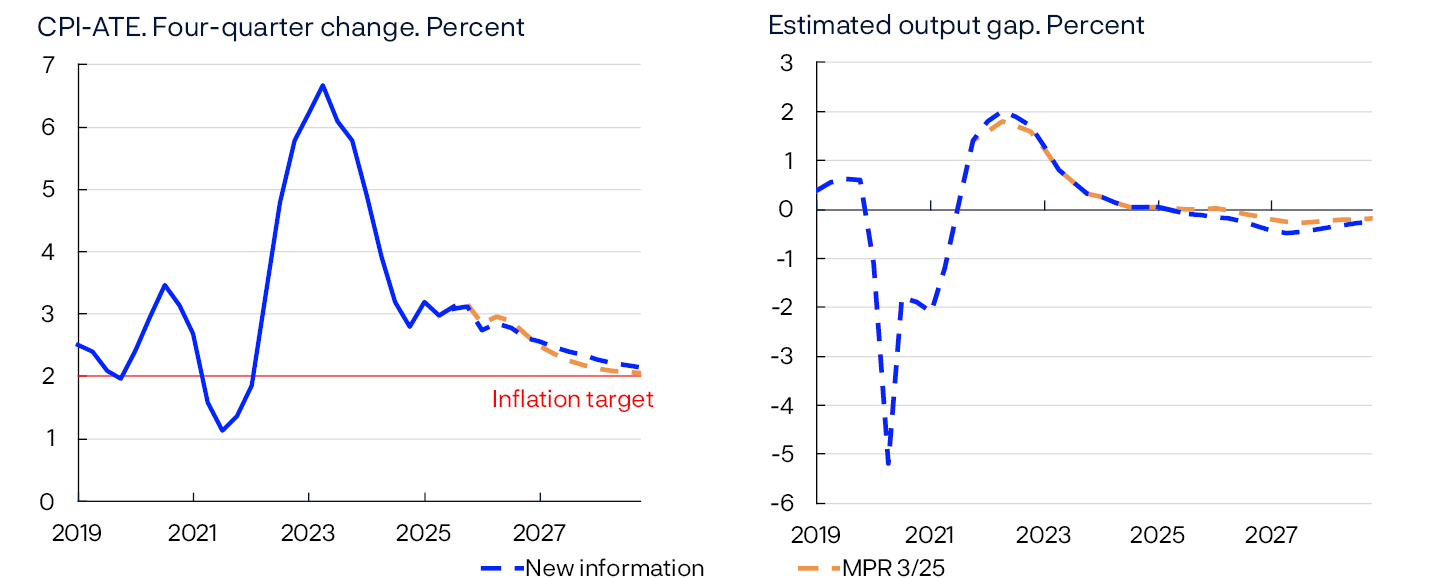
To summarise how new information and new assessments of the economic situation have affected the forecasts since the September Report, this section presents forecasts of the output gap and underlying inflation (CPI-ATE) given the same policy rate path as in the previous Report. Key premises for this exercise are:
- The output gap projection has been revised down slightly for the near term, partly owing to weaker developments in the labour market and in indicators of capacity utilisation from the Regional Network.
- The rise in the consumer price index adjusted for tax changes and excluding energy products (CPI-ATE) has been broadly as projected in the September Report. Lower capacity utilisation dampens inflation, but a weaker krone exchange rate contributes to slightly higher underlying inflation further out.
- The money market spread has been revised up. This indicates that the spread is wider for an unchanged policy rate path.
The exercise indicates that given an unchanged policy rate path, capacity utilisation will be slightly lower compared with the September Report throughout the projection period (Chart 3.1). Inflation will be broadly as projected in the coming period, albeit slightly higher further out.
The model’s policy rate path
NEMO generates a policy rate path aimed at achieving the best possible trade-off between the outlook for inflation and the output gap given the structure of the model. New information and new assessments will normally generate changes in the model-based policy rate path (model path).
Cumulative contribution. Percentage points

In the decomposition in Chart 3.2, NEMO is used to decompose the changes in the model path since the September Report into the main exogenous driving forces. In models like NEMO, disruptions that move inflation away from target and output away from potential are explained by structural shocks. When data and projections differ from that envisaged, the shocks change. The decomposition shows how such changes contribute to changes in the model path, and the broken line shows the sum of the bars. The solid line shows the changes in the policy rate forecast. The model path is little changed since the September Report.
The main contributions to changes in the model path since the September Report are:
- The krone exchange rate is weaker than assumed in the September Report and a weaker krone is also projected ahead. A weaker exchange rate contributes to higher inflation and an increased output gap. In the model, while lower oil prices and a lower interest rate differential against other countries imply a weaker krone exchange rate, the rate is weaker than these factors indicate in the model. The exchange rate therefore pushes up the model-based path (dark blue bars).
- Underlying inflation has been broadly as projected in the September Report, and the projections for 2026 are little changed. In the model, inflation in the coming quarters is lower than implied by other driving forces, while somewhat higher-than-expected wage growth in 2025, in isolation, results in slightly higher inflationary pressures at the beginning of the forecast horizon. On the whole, prices and wages pull down the model-based path in the first half of the forecast horizon (red bars).
- The output gap projection has been revised down, partly owing to developments in the labour market and in the capacity utilisation indicators reported by the Regional Network that were weaker than previously assumed. The near-term housing investment projection is also lower than other model factors can explain. Domestic demand pulls down the model path (orange bars).
- Compared with the September Report, a wider money market spread is assumed from 2026 Q2 (see box “The money market spread”). A wider spread indicates higher market rates for a given policy rate path. The money market spread therefore suggests a lower model path (grey bars).
- Norges Bank now projects slightly higher growth in demand from Norway’s trading partners in the near term. Market expectations of policy rates abroad have also risen. External factors therefore push up the model path (green bars).
- Projections for petroleum investment in 2026 are slightly higher than previously assumed, while oil and gas futures prices are lower. Overall, petroleum prices and investment have little effect on the model path (light blue bars).
The box “A monetary policy rule for understanding changes in the policy rate path” shows an alternative method of presenting the contributions to changes in the model’s policy rate path. The alternative method provides a direct link between changes in the forecasts for endogenous model variables and changes in the model-based path. The aim is to apply this new presentation of the decomposition in future monetary policy reports.
Other relevant indicators for the monetary policy analysis
Other indicators relevant to the conduct of monetary policy have also been presented to the Committee:
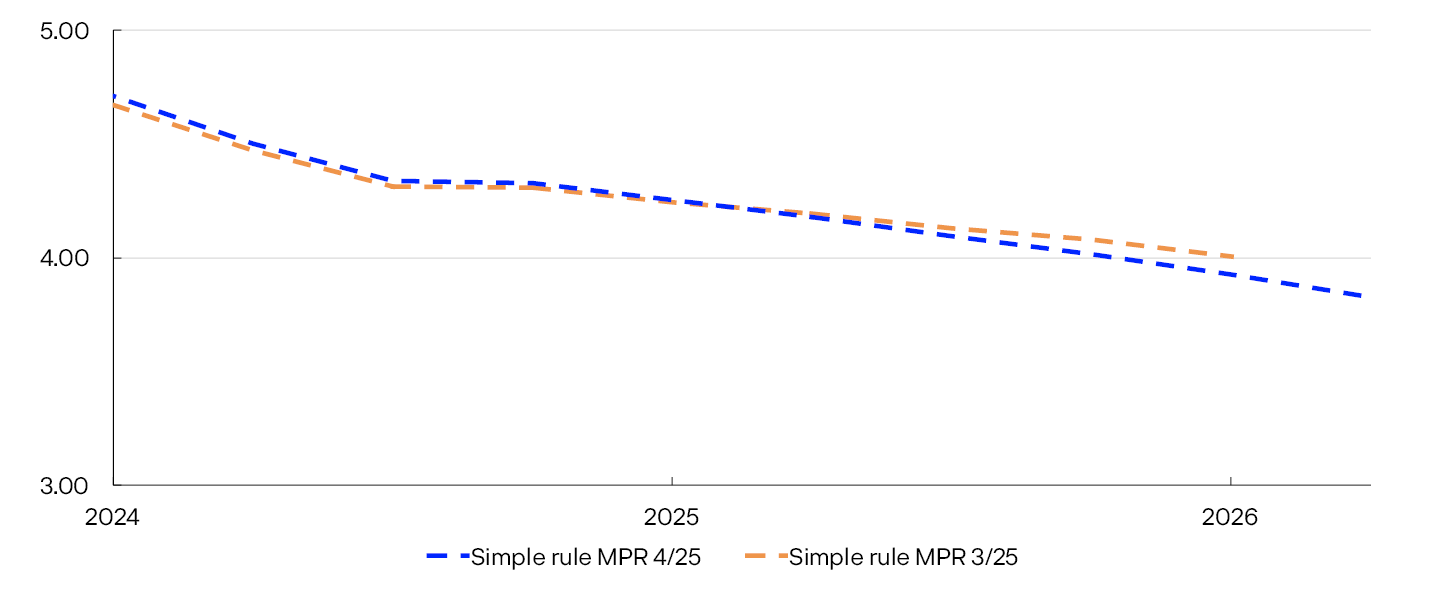
- Norges Bank’s simple monetary policy Taylor rule describes the average monetary policy reaction function. The rule provides an estimated relationship between the policy rate on the one hand and the policy rate in the previous quarter, the long-term interest rate level and the projections for inflation and the output gap on the other (see Monetary Policy Report 1/2025). The rule now indicates a slightly lower money market rate in the coming quarters than the rule indicated in the September Report (Chart 3.3). This is due to a slight downward revision of the output gap, while the inflation projection for 2026 is little changed.
Three-month money market rate. Percent
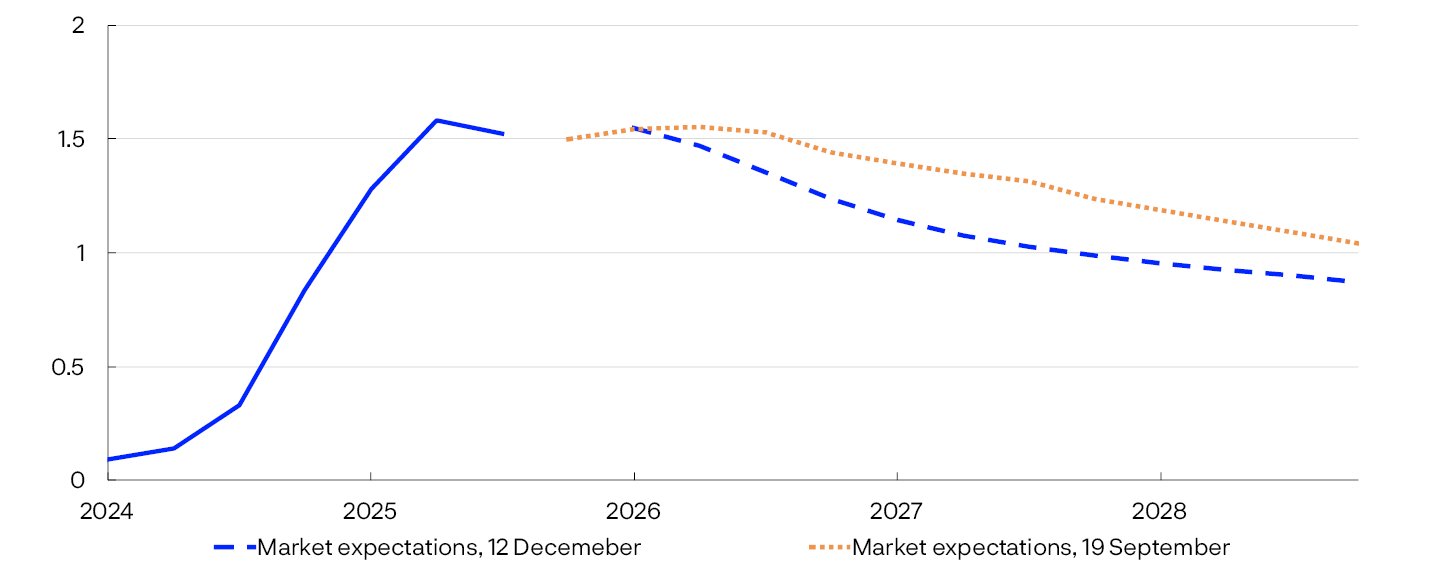
- Market-implied policy rates ahead can provide an indication of how market participants have interpreted new information since September and how they expect monetary policy to respond. Market policy rate expectations ahead rose upon publication of the September Report (Chart 3.4, left panel) but are little changed since then. Market pricing indicates that the next policy rate reduction is expected in June.
- Norway is a small and open economy, with financial markets closely intertwined with those of its trading partners. Changes in foreign market rates can affect the krone exchange rate and provide an indication of market expectations for the economic outlook among trading partners. Market policy rate expectations among Norway’s main trading partners are somewhat higher than in the September Report (Chart 3.4, right panel).
Policy rates. Percent
- 1 CPI-ATE: CPI adjusted for tax changes and excluding energy products. The output gap measures the percentage deviation between mainland GDP and estimated potential mainland GDP.
- 2 The contributions are based on model estimates from the NEMO model, but there is no mechanistic link between news and changes in the bars. The effect of news feeds through with a lag, and the interaction between economic variables may result in a reversal of the effect over time. In addition, projections for the near term may entail news with different signs at different times. The effect on the rate path is therefore shown most clearly by the cumulative contribution.
- 3 The rule uses projections three quarters ahead for inflation and projections for the current quarter for the output gap. Since the output gap has been adjusted in previous quarters, the simple rule also indicates a slightly different rate before the current quarter.
- 4 12 September: cutoff for the MPR 3/25 projections.
19 September: day after MPR 3/25 publication.
12 December: cutoff for the MPR 4/25 projections.
The policy rate abroad is a trade-weighted average of the policy rates of the Bank of England, the European Central Bank, the Federal Reserve and Sveriges Riksbank. Owing to substantial uncertainty related to the level of policy rate expectations ahead, partly due to possible term premiums in market interest rates, the modeling system conditions on the foreign market interest rates only in the first year (see Monetary Policy Report 1/2025).
The monetary policy stance
Description of the policy rate path
The policy rate forecast (policy rate path) is little changed from the September Report. The policy rate path is consistent with one to two 0.25 percentage point reductions in 2026 and a total of three reductions by the end of the forecast horizon. The policy rate forecast at the end of 2028 is 3.2%.
Market rates and measures of monetary policy restrictiveness
How the policy rate affects the economy depends on both the pass-through to market rates and how high these rates are compared with inflation and the long-term neutral level of interest rates in the economy. Key developments in this Report are:
- In line with market pricing, a somewhat wider money market spread is now assumed from 2026 Q2 (see box “The money market spread”). A wider spread increases the difference between the policy rate and the money market rate, which is important for banks’ funding costs and thereby for household and corporate interest rates. The policy rate forecast is little changed. The money market rate forecast is slightly higher than in the September Report owing to a wider money market spread (Chart 3.5).
Percent
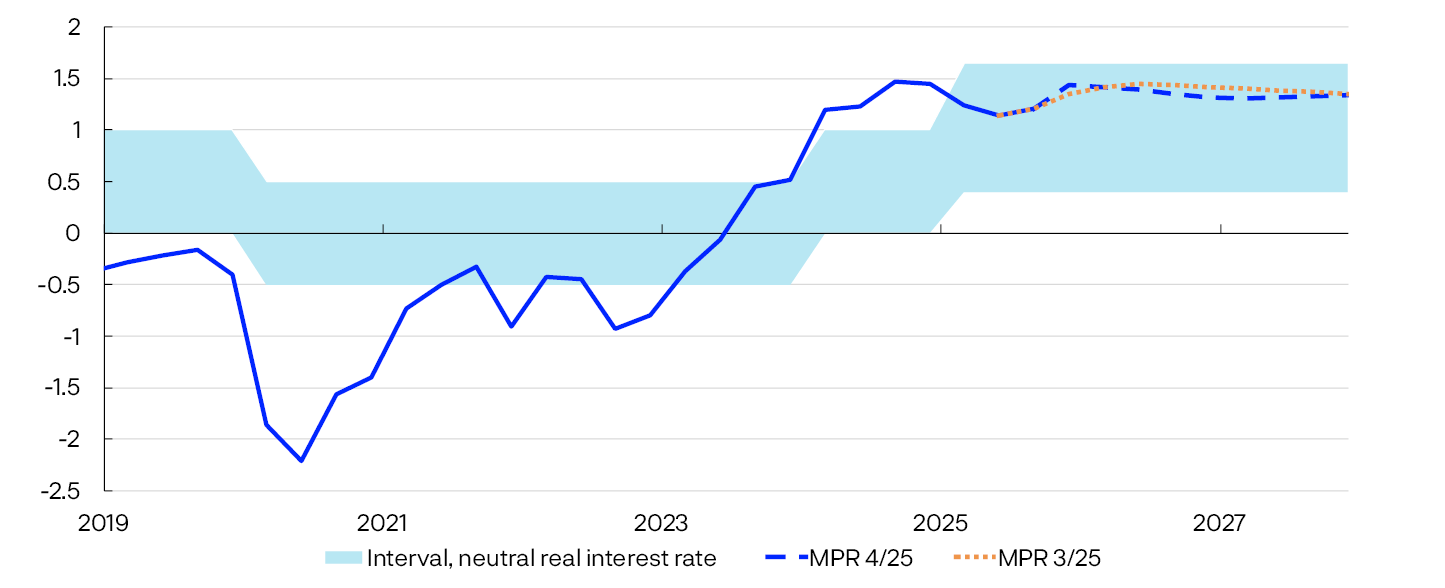
- The expected real interest rate relative to the neutral level is one measure of monetary policy restrictiveness. The neutral real interest rate is the real interest rate level that is consistent with a balanced economy over time. Here, the expected real interest rate is defined as Norges Bank’s money market rate forecast less the Bank’s inflation forecast. The expected real interest rate is little changed from the September Report (Chart 3.6). From the beginning of 2026 H2, the real interest rate is slightly lower, reflecting a slightly higher underlying inflation forecast. The expected real interest rate is still in the upper half of the interval of the Bank’s estimate of the neutral real interest rate.
Estimate of the expected real money market rate. Percent
- The residential mortgage rate has been in line with projections from the September Report, and the forecast is little changed. The forecast implies that the mortgage rate falls from 5.4% in 2025 Q3 to 4.7% at the end of the forecast horizon (Chart 3.5).
The money market spread
The money market rate is a measure of the interest rate on unsecured interbank loans in NOK. Three-month Nibor, which is the three-month money market rate, is an important reference rate in the Norwegian money market. The level is determined by market expectations of the average policy rate over the next three months and by a risk premium, referred to as the money market spread. Changes in this spread over time affect the spread between the policy rate and household and corporate interest rates.
Since the September Report, the forward-implied pricing of the money market spread has risen somewhat from 2026 Q2. The increase in the forward-implied pricing coincided with the announcement that Norges Bank will issue central bank certificates in 2026. The design, volume and launch date for the central bank certificates have not yet been decided. The projection for the money market spread has been changed in line with market pricing. In the model framework, the spread widens from 0.15 percentage point in 2026 Q1 to 0.20 percentage point in Q2 and to 0.25 percentage point from Q3.
Monetary policy trade-offs
The trade-offs between low and stable inflation and high and stable output and employment are reflected in the Committee’s assessment and the inflation and output gap forecasts. The policy rate, inflation and output gap forecasts are shown in the chart in the Committee’s assessment. The points in Chart 3.7 show the average forecasts one to three years ahead for the output gap and the inflation gap (difference between inflation and the target) in different reports. The location of the points in the chart depends on the shocks to the economy and the monetary policy response.
Inflation gap and output gap. Average 1–3 years ahead

In this Report, the output gap is slightly lower one to three years ahead compared with the September Report. Inflation is a little higher.
- 5 The residential mortgage rate is the average rate on outstanding mortgage loans to households from the sample of banks and mortgage companies included in Statistics Norway’s monthly interest rate statistics.
- 6 The expected real interest rate is the projected policy rate over the next four quarters less projected CPI-ATE inflation over the same period. For 2025 Q4 and in the projection period, the expected real interest rate is estimated based on the projections in this Report. For all previous periods, the expected real interest rate is based on the most up-to-date Monetary Policy Report at the time in question. Norges Bank’s estimated interval for the neutral real interest rate has been adjusted over time (see Monetary Policy Report 2/2025). The interval for the neutral real money market rate is now between 0.4% and 1.65%.
- 7 The chart shows combinations of forecasts for the output gap (y) and inflation (Π) as deviations from the target (Π*) on average one to three years ahead. Each point represents the forecasts in a specific Monetary Policy Report. There are prospects for near-optimal attainment of objectives if the points are close to the origin. However, the points will typically be some distance from the origin following major shocks.
Historical forecast errors and uncertainty indicators
Forecast errors from recent Reports have been close to a normal level. Fan charts of historical forecast errors provide an indication of the magnitude of uncertainty in general. Uncertainty indicators show that the uncertainty surrounding GDP and underlying inflation forecasts has been close to historical levels. The analyses outlined in this box form part of the assessment basis for forecast uncertainty.
Historical forecast errors
Historical forecast errors are deviations between forecasts and actual developments (see box “Historical forecast errors” in Monetary Policy Report 3/2025). Chart 3.A shows the uncertainty of forecasts in this Report based on historical forecast errors. The fan charts are constructed using forecast errors from the past 20 years, and the distribution is placed around the forecasts in this Report such that they form the median of the distribution. If future forecast errors follow the same pattern as the historical errors, 70% of outcomes are expected to lie within the light shaded area. The distributions of inflation and output gap forecasts are fairly balanced, while the distribution for the policy rate is somewhat biased towards the downside. This reflects the clear downward trend in the decade following the financial crisis, which was not captured early enough when the forecasts were made. The distributions will change little from report to report.
Historical forecast errors centred on inflation, policy rate and output gap forecasts. Percent
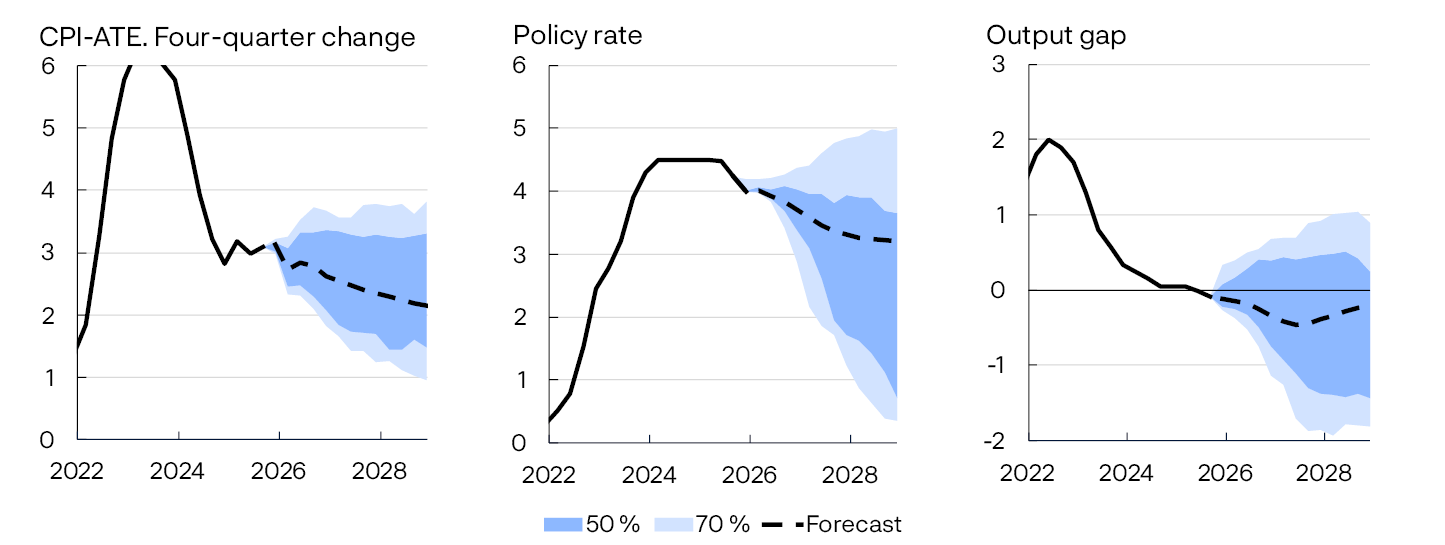
In addition to examining the forecast error distributions, the magnitude of the forecast errors can be tracked over time. Chart 3.B shows the absolute value of forecast errors for inflation and the output gap one quarter ahead for each Report compared with the historical average of the decade preceding the pandemic. The output gap cannot be measured directly, and forecast errors will therefore reflect Norges Bank’s assessment of new information. The chart shows that the forecast errors in recent Reports have moved down somewhat since the pandemic and are now closer to the historical average. Forecast errors in recent Reports have been below the historical average. Overall, this may reflect the fact that recent shocks to the Norwegian economy were relatively minor.
Absolute forecast errors per Report. Average for the past 4 reports and 2010–2019. Percent
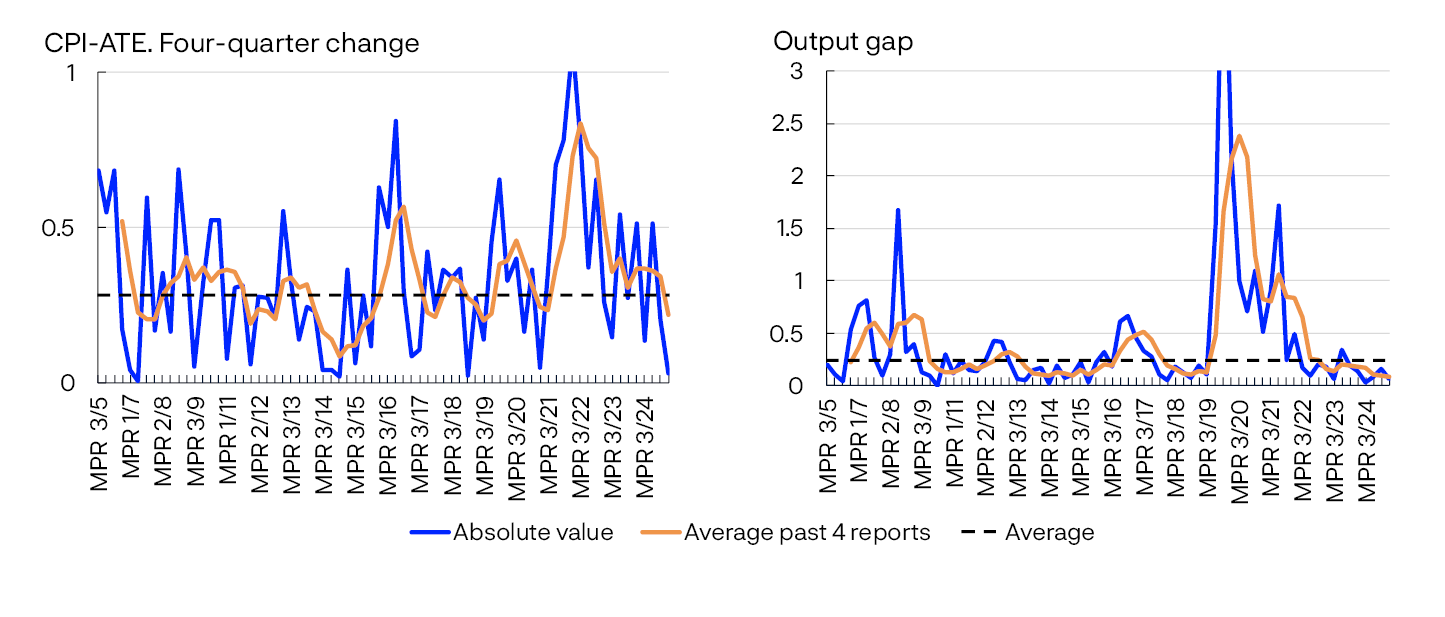
Uncertainty indicators
Historical forecast errors provide an indication of the uncertainty normally surrounding Norges Bank’s forecasts but give little information regarding changes in uncertainty ahead. Uncertainty indicators from an estimated model framework are used to show how uncertainty has changed since the previous Report and how the range of possible outcomes is expected to look ahead.3
The models indicate that near-term uncertainty surrounding mainland GDP is at a normal level (Chart 3.C, left panel). In the longer term, somewhat higher credit growth lifts the distribution somewhat (Chart 3.C, right panel).
Spread between different percentiles and median from quantile regressions. Four-quarter change in Norwegian mainland GDP. Percentage points
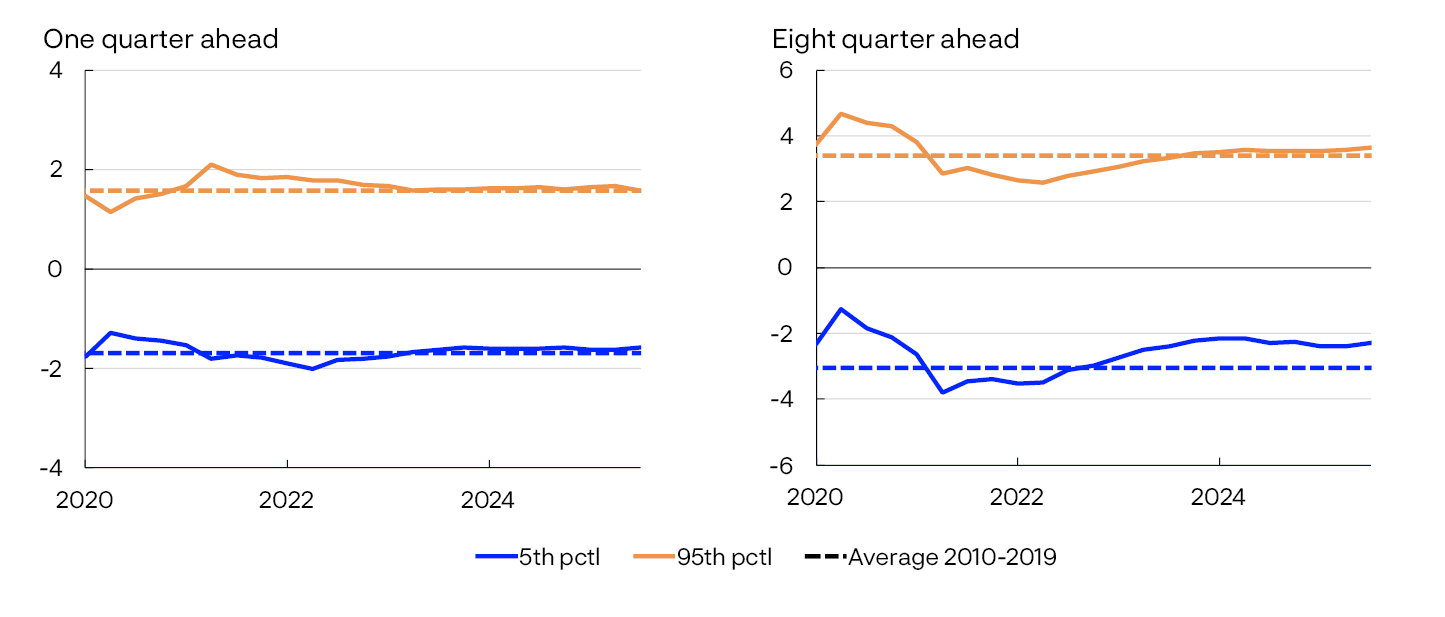
Changes in the uncertainty related to underlying inflation in the near term are minor (Chart 3.D, left panel). In the longer term, the distribution is slightly biased towards the downside but has moved somewhat closer to its historical average since the September Report (Chart 3.D).
Spread between percentiles and median from quantile regressions. Four-quarter change in CPI-ATE. Percentage points
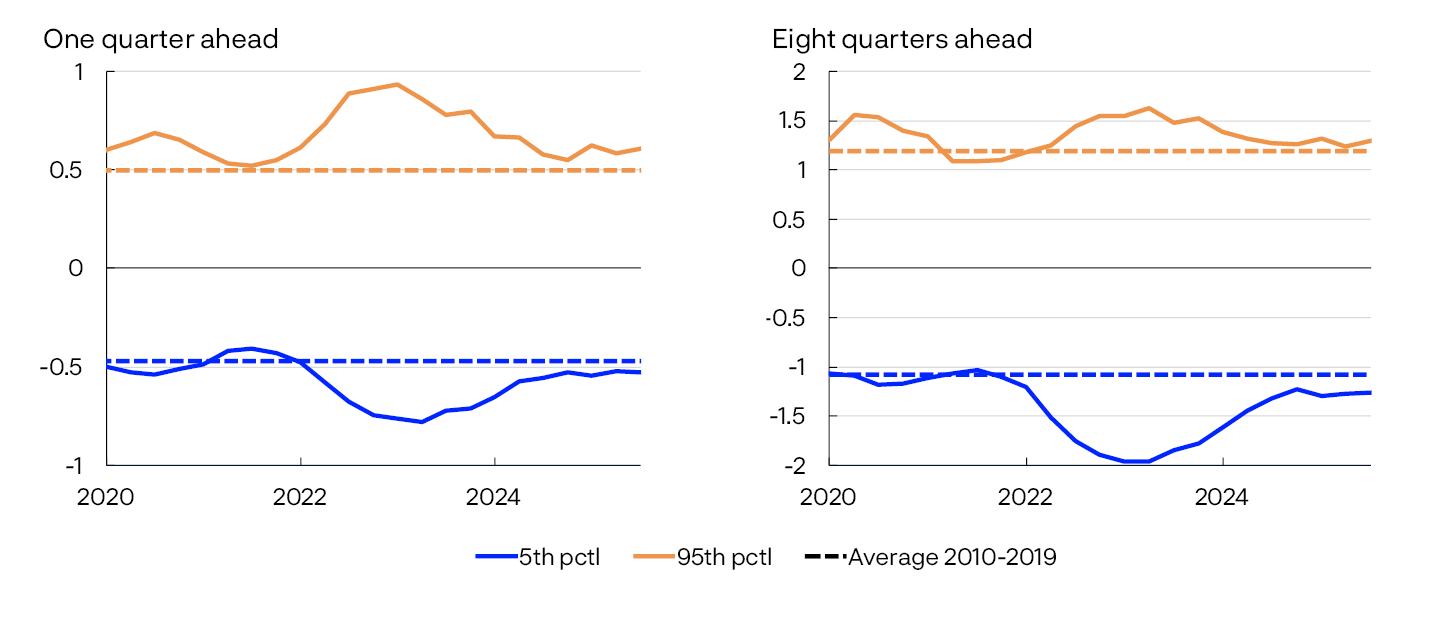
- 1 The range of possible outcomes for underlying inflaiton (CPI-ATE), the policy rate and the output gap are based on forecast errors from the past 20 years.
- 2 Absolute forecast errors for each report back to MPR 3/2005 for underlying inflation and the output gap. Deviations between forecasts one quarter ahead and actual values. The last data point is MPR 2/25.
- 3 The models use quantile regressions, with different indicators to estimate the distribution of output growth, house price inflation and consumer price inflation ahead. See further description in Bowe, F., S.J. Kirkeby, I.H. Lindalen, K.A. Matsen, S.S. Meyer and Ø. Robstad (2023) “Quantifying macroeconomic uncertainty in Norway". Staff Memo 13/2023. Norges Bank.
- 4 The charts show developments in the spread between the 5th and 95th percentiles from the median for the model-estimated distribution of GDP growth one and eight quarters ahead, respectively. Broken lines indicate average 5th and 95th percentiles between 2010 and 2019.
- 5 The charts show developments in the spread between the 5th and 95th percentiles from the median for the model-estimated distribution of consumer price inflation one and eight quarters ahead, respectively. Broken lines indicate average 5th and 95th percentiles between 2010 and 2019.
Boxes
How sensitive are sectors in the Norwegian economy to interest rates?
This box looks at how policy rate changes affect the different sectors in the national accounts. The findings show that the policy rate’s impact varies across sectors and that private services, together with construction, are among the most interest rate sensitive sectors of the economy. Demand is an important channel for the transmission of monetary policy to activity levels. Sectors that largely supply goods and services for public consumption and exports are less interest rate sensitive than sectors that largely supply goods and services for private consumption and investment.
According to extensive international literature and previous Norges Bank analyses, policy rate increases normally dampen overall activity and inflation. Inflation increased substantially in the years following the pandemic, and the policy rate was raised sharply and rapidly. This dampened economic activity, and inflation has fallen significantly from the peak. At the same time, developments have varied across sectors, with weak developments in construction, while activity levels in manufacturing have remained steady. To learn more about how the effect of monetary policy differs across sectors, estimates are made of the effect of policy rate changes on activity levels and employment for different sectors.1 The estimates assume an unexpected policy rate increase.2
Chart A shows how activity, measured as mainland gross domestic product, and employment develop following a policy rate hike in this analysis. A higher policy rate dampens both activity and employment, albeit with a lag. At the same time, employment falls somewhat less than overall activity, indicating that monetary policy affects overall labour productivity over some time. This is consistent with firms retaining employees even when activity levels are temporarily lower than labour demand. The uncertainty in the estimates is substantial and indicates that it is difficult to accurately estimate when and to what extent policy rate changes dampen activity levels. The results show that it takes time for monetary policy to transmit to the real economy.3 At the same time, other structural conditions in the economy will determine long-term activity levels and employment.
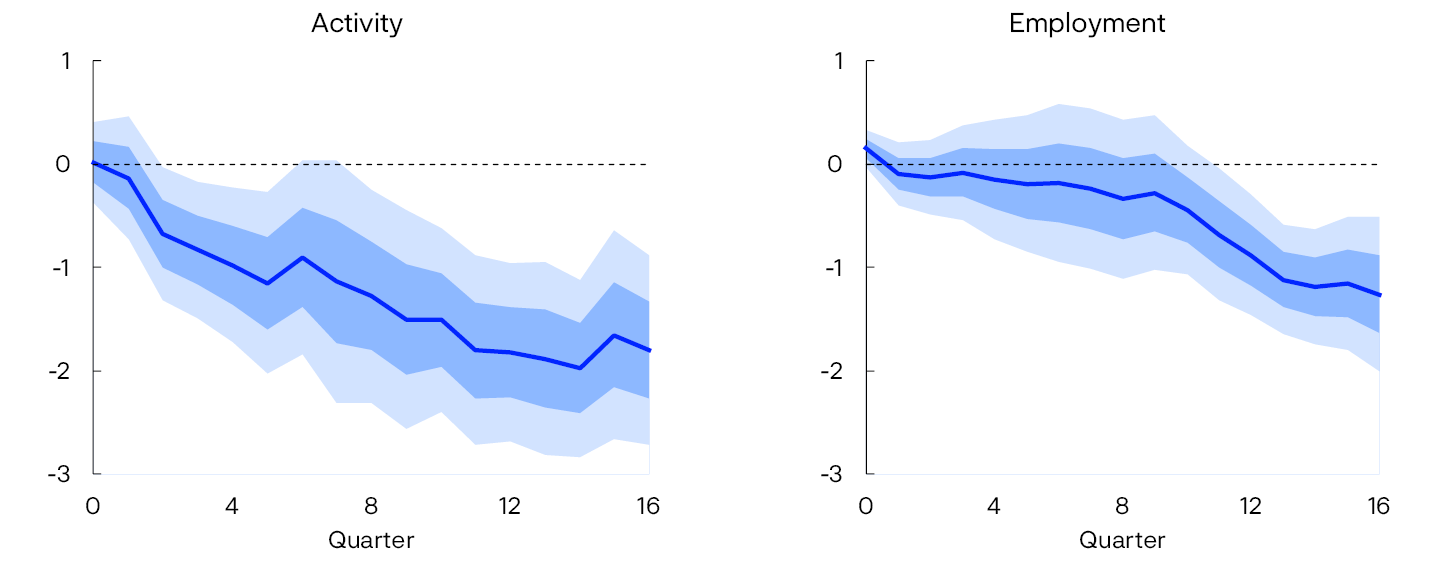
Chart B shows the average effect of policy rate changes on activity levels and employment in selected sectors after 8 to 16 quarters.
Average effect on sectors of policy rate changes (8-16 quarters). Share of mainland GDP in parentheses
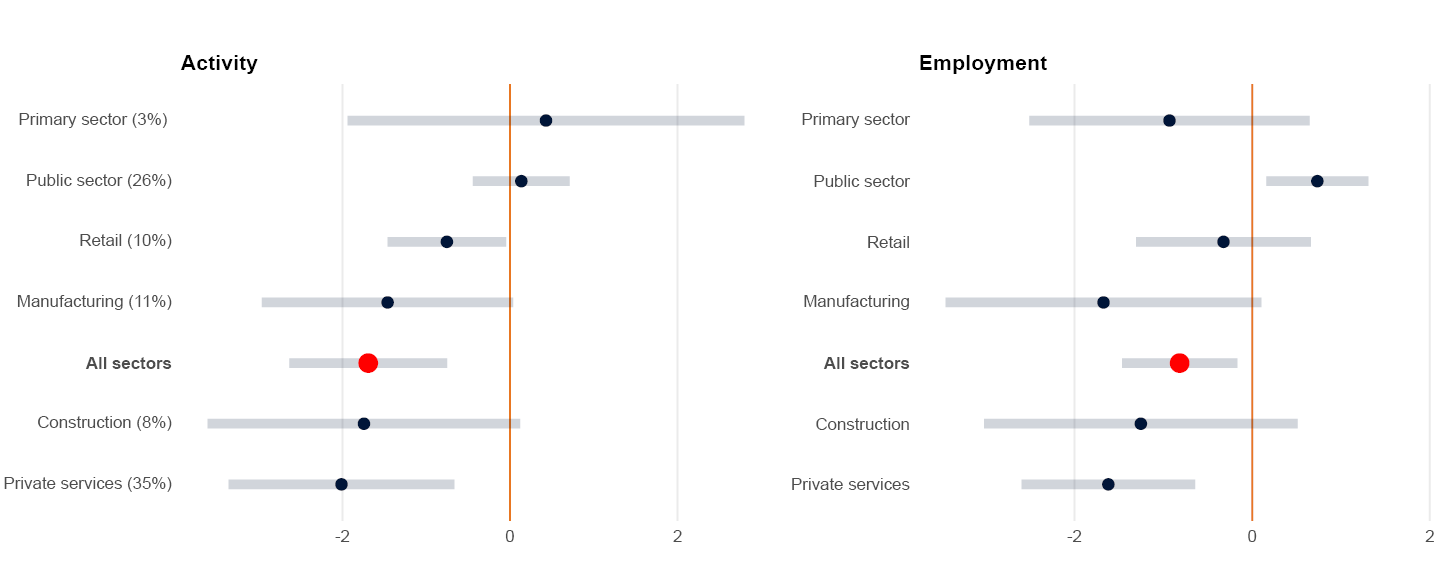
The results indicate that the effect on both activity levels and employment varies across sectors. Private services and construction are most sensitive to policy rate changes, likely reflecting that both construction and some private services are closely linked to demand for new homes.6 On the other hand, the public sector (central and local government) and the primary sector are not very sensitive to policy rate changes. For most sectors, activity levels fall more than employment.
Demand is an important channel for the transmission of monetary policy to the economy and inflation. When the policy rate increases, disposable income declines for households and firms with more debt than bank deposits and savings become more profitable. By using information from input-output tables, one can test whether sectors’ responses to the policy rate differ depending on which part of demand they supply goods and services to. A sector can supply goods and services to meet demand both directly and indirectly through other sectors.
Chart C, left panel, shows the share of production supplied to different parts of demand for some selected sectors.7 For example, the construction sector supplies a large share of goods and services for investment purposes, while the fisheries sector primarily supplies goods for export. This sector variation is used to estimate the importance of demand for the sectors’ interest rate sensitivity.8
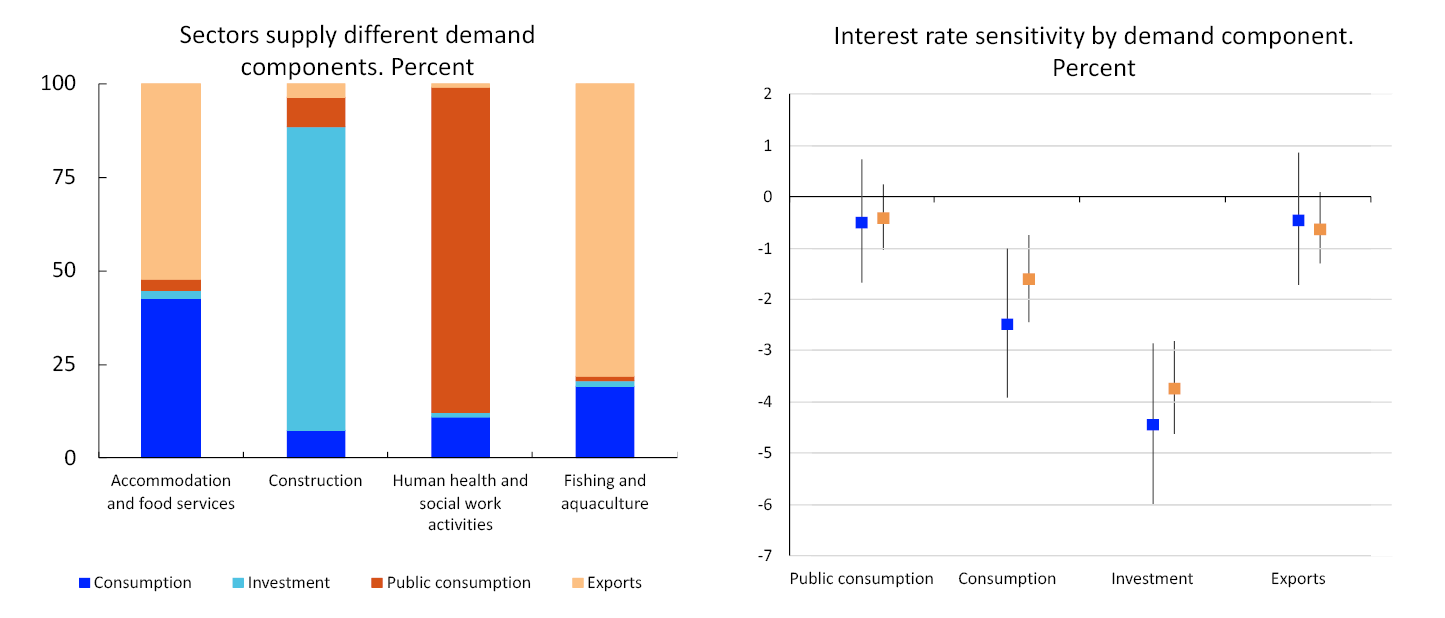
The right panel shows how interest rate sensitivity varies across sectors based on which demand component they supply to. Sectors that supply a large share of goods and services for public consumption and exports are less sensitive to interest rate changes than sectors that supply goods and services for private consumption and investment. This is consistent with other studies showing that while demand for investment (both housing and business investment) is the demand component most sensitive to interest rates, public consumption and exports are less sensitive to interest rates. 10
The policy rate has increased substantially in recent years and has likely affected some sectors more than others. Activity has increased less in interest rate sensitive sectors than in the rest of the economy. At the same time, the impact of other shocks differs across sectors. For example, high construction costs have also dampened construction activity, while a weaker krone has supported activity in export-oriented sectors.
Looking ahead, the policy rate is expected to decrease gradually. Prospects for a slightly lower policy rate will boost investment among businesses and demand for goods, services and housing among households. Higher demand is expected to lift activity in interest rate sensitive sectors.
- 1 Identifying the purely causal relationship between the policy rate and economic variables is difficult. Normally, changes in the policy rate will be a reaction to developments in target variables such as employment, output and inflation. This is addressed by following Holm et al (2021) to estimate the isolated effect of policy rate changes, often called a "monetary policy shock". See Holm M.B., P. Paul and A. Tishbirek, (2021) "The Transmission of Monetary Policy under the Microscope". Journal of Political Economy, University of Chicago Press, vol. 129(10), pp 2861–2904.
- 2 Policy rate developments are the same as in "The Interest Rate Sensitivity of Consumption and Investment” in Monetary Policy Report 4/2023, but normalised to a policy rate peak of 1 percentage point to simplify the interpretation of the estimates. The policy rate increases by 1 percentage point before gradually declining. After six quarters, the policy rate has decreased to 0.5 percentage point, before gradually decreasing further and reaching 0 after around 12 quarters.
- 3 The results are more persistent than the response to a similar monetary policy shock in our core model NEMO. The difference in persistence must be viewed in light of a more persistent effect on the interest rate level, reflecting both the initial shock and the subsequent systemic response. See Motzfeldt Kravik, E. and Y. Mimir (2019) “Navigating with NEMO”. Staff Memo 5/2019. Norges Bank
- 4 Sixteen regressions are estimated for activity and employment where the change in the variable from quarter t to quarter t+h (h=1,…,16) can be explained by the monetary policy shock in quarter t. In addition, backdated values are included of both the monetary policy shock and the variable. The shaded areas indicate confidence intervals corresponding to 67% (dark blue) and 95% (light blue). The regression is based on QNA figures for the period 1995–2022.
- 5 The shaded bars (grey) indicate an confidence interval corresponding to 95%.
- 6 A number of studies find that demand for new homes and investment in existing housing stock are sensitive to interest rates, see for example Monetary Policy Report 4/2023 and Bowe et al (2023) "The Interest Sensitivity of Consumption and Investment: Evidence from Norway”. Staff Memo 1/2025. Norges Bank.
- 7 In order to include as much variation in interest rate sensitivity as possible, a more detailed categorisation of sectors is assumed than that shown in Chart B, ie the main industries [in Norwegian only] in the national accounts.
- 8 A panel data regression is used to match the estimated effects of interest rate sensitivity (dependent variable) with the share of goods and services they supply to the demand components (four explanatory variables).
- 9 Investment includes both private and public investment. Interest rate sensitivity by demand component is the estimated average effect between 8 and 16 quarters ahead. The black lines indicate a confidence interval corresponding to 95%.
- 10 See Monetary Policy Report 4/2023 and Bowe et al (2023) "The Interest Sensitivity of Consumption and Investment: Evidence from Norway”. Staff Memo 1/2025. Norges Bank
A monetary policy rule for understanding changes in the policy rate path
To clarify the relationship between the model rate and Norges Bank’s forecasts, the Bank has developed a monetary policy rule. The rule includes variables that are key inputs for developments in inflation and the output gap ahead and has been designed to generate a model-based policy rate path in NEMO that is close to the path currently generated using the loss function. This box uses the rule to illustrate an alternative presentation of the policy rate decomposition based on the changes in our forecasts for the Norwegian economy.
Norges Bank’s main model in its forecasting work and in the monetary policy analysis is the macroeconomic model NEMO. In NEMO, a model-based path is generated by minimising a loss function based on the monetary policy mandate: low and stable inflation and high and stable output and employment. See Norges Bank’s Monetary Policy Handbook for a more detailed discussion of the loss function. The model-based path from a loss function can be said to be optimal given the model’s design and the weights in the loss function. The loss function approach, however, results in a complex relationship between the model-based path and the Bank’s forecasts of economic variables.
Monetary policy rules are an alternative to loss functions in models like NEMO. These rules directly link developments in macroeconomic variables and the policy rate. Even though such rules are not necessarily optimal, they can provide a simpler description of how the policy rate is set in models. Norges Bank has developed a rule that produces a model-based path in NEMO that is close to the model-based path using the loss function. At the same time, the rule is developed so that the model dynamics in NEMO are approximately the same for both methods of generating the model-based path. The design of the rule strikes a balance between the aim of having a high degree of consistency with the loss function and the aim of limiting complexity, while at the same time providing a clear connection between key variables used in the conduct of monetary policy in Norway and the model-based path. This rule is referred to as GEORG – Ganske Enkel Optimal ReGel.1 GEORG differs from other monetary policy rules, such as the Taylor rule shown in Chart 3.3, which are often estimated or calibrated to add historical interest rate setting. 2
The policy rate in GEORG for date t can be written as:

where rˉt is the model’s steady-state policy rate, and rt–1 is the policy rate in the previous period. The macroeconomic variables in GEORG are summarised in Xt. The monetary policy shock zt captures previous deviations between the actual policy rate and the rate in GEORG and is gradually phased out over the course of the forecast period. Like the loss function, GEORG implies that the policy rate is changed gradually.

The variables in Xt are expressed as a gap (ˆ), ie as deviations from their steady-state values in the model:3
- π is inflation
- ŷ is the output gap
- Φ is the rise in unit labour costs (ULC)
- S is percentage change in the exchange rate (I-44) over the past two years
- rf are foreign policy rates
- μ is the money market spread
To best simulate the model-based path resulting from the loss function, NEMO with GEORG uses variables that may contain information about future developments in the target variables for monetary policy, inflation and the output gap. For example, unit labour costs (ULC) constitute a large part of domestic firms’ marginal costs, and growth in wage costs can be an indicator of future inflation. Higher wages will also, in isolation, increase purchasing power and likely also household demand. On the other hand, higher productivity, included in ULC, will reduce firms’ need to increase prices for a certain wage level and dampen future inflationary pressure.
Changes in the exchange rate also affect future inflation and economic activity through import prices and net exports, although with a considerable lag.4 Interest rates abroad affect the exchange rate, but can also be viewed as an indicator of economic developments among Norway’s trading partners, which in turn may influence imported inflation and demand for Norwegian exports.
Inflation and the output gap are also directly included in the rule. This is to capture other information about the outlook for economic activity and inflation that is not reflected in the other indicators. For example, the indicator of international price impulses to imported consumer goods (IPK) is not included in GEORG but is captured indirectly through the inflation term. Other key variables for the Norwegian economy, such as petroleum prices and oil investment will be captured through the effects this has on inflation and the output gap. Norges Bank is planning to regularly assess the rule’s design.
To correct for short-term fluctuations and noise, and thus to better simulate the loss function, the variables are included in the rule with forecasts for the next quarter (t+1). For example, the exchange rate may fluctuate substantially through the quarter or the impact on individual prices may generate noise in inflation. For the current quarter, the quarterly average will then not adequately represent underlying inflation developments.
By using GEORG with NEMO, the Bank can produce an alternative presentation of the decomposition based on changes in the forecasts. This differs from the current decomposition shown in Chart 3.2 that explains the change in the model-based path in the periods between the monetary policy reports with contributions from exogenous driving forces or shocks. The alternative method provides a direct link between changes in forecasts and changes in the model-based path based on the coefficients in GEORG. Chart D shows the alternative decomposition based on forecast changes and NEMO with GEORG. rˉt is a little lower than in the September Report, mainly reflecting the upward revision of the money market spread (grey bars). On the other hand, higher policy rate expectations abroad further out have resulted in an upward revision of the steady-state policy rates in Norway and abroad in the model (green bars). The two decomposition methods are fundamentally different from each other.5
A decomposition, whether based on underlying shocks or forecast changes, provides a simplified presentation of how new information affects the policy rate path. In setting the policy rate and the policy rate path, the Monetary Policy and Financial Stability Committee will often have to consider conditions that are not fully captured by the NEMO model. Normally, there will therefore also be changes in the policy rate path that do not result from changes in the forecasts for economic variables. Nevertheless, GEORG may be useful as an aid to better communicate the relationship between Norges Bank’s forecasts and the model’s policy rate path. The aim is to apply this new presentation of the decomposition in future monetary policy reports.
- 1 For more details, see Almlid, E., I.F. Haltia and Ø. Robstad (2025) "Mapping Optimal Policy into a Rule in NEMO: GEORG". Staff Memo 15/2025. Norges Bank.
- 2 For a more detailed description of the Taylor rule, see Lindalen, I. H and N. Maffei-Faccioli (2025) "The Norwegian Taylor rule". Staff Memo 5/2025. Norges Bank.
- 3 Here, the following parameter values are used: ωr = 0.74, ωπ = 1.17, ωy = 1.27, ωΦ = 1.25, ωS = 0.13, ωrf = 0.25 and ωμ = –1. The steady-state values in the model for the current report are as follows: rˉ = 3.05%, πˉ = 2%, yˉt = potential output, Φˉ = 2.4%, Sˉ = 0%, rˉf = 2.65% and μˉ = 0.25pp.
- 4 Ulvedal, P. and N.H. Vonen (2016) "Pass-through from exchange rate movements to consumer prices". Staff Memo 3/2016. Norges Bank.
- 5 For a more detailed description of the difference between the methods, see Almlid, E., I.F. Haltia and Ø. Robstad (2025) "Mapping Optimal Policy into a Rule in NEMO: GEORG". Staff Memo 15/2025. Norges Bank.
Annex
Detailed tables of projections
Table 1 International projections
|
Change from projections in Monetary Policy Report 3/2025 in parentheses |
Weights1 Percent |
Percentage change from previous year |
||||
|---|---|---|---|---|---|---|
|
2024 |
2025 |
2026 |
2027 |
2028 |
||
|
GDP |
||||||
|
US |
12 |
2.8 (0) |
1.9 (0.1) |
1.8 (0.2) |
1.7 (0) |
1.7 (0) |
|
Euro area |
47 |
0.8 (0) |
1.4 (0.1) |
1.2 (0.1) |
1.3 (0) |
1.4 (0) |
|
UK |
15 |
1.1 (0) |
1.4 (0.1) |
1 (-0.1) |
1.4 (0.1) |
1.2 (0.1) |
|
Sweden |
18 |
0.9 (0.1) |
1.9 (0.7) |
2.3 (0.2) |
1.9 (-0.2) |
2.1 (0) |
|
China |
8 |
5 (0.1) |
4.9 (0.1) |
4.4 (0.3) |
4.1 (0) |
3.8 (0) |
|
5 trading partners1 |
100 |
1.5 (0.1) |
1.8 (0.2) |
1.7 (0.1) |
1.7 (-0.1) |
1.7 (0) |
|
Prices |
||||||
|
Underlying inflation2 |
3 (0) |
2.7 (0.1) |
2.3 (0) |
2.1 (0) |
2.2 (0) |
|
|
Wage growth2 |
4.3 (-0.1) |
3.8 (0.3) |
3.3 (0.1) |
3.1 (0.1) |
2.9 (0) |
|
|
Prices for consumer goods imported to Norway,including freight rates3 |
2.7 (0) |
0.1 (0) |
0 (0) |
0.3 (-0.4) |
0.7 (-0.2) |
|
|
Prices for intermediate goods imported to Norway4 |
0 (-0.1) |
0.5 (0) |
0.7 (-0.2) |
1.7 (0.2) |
1.8 (0.3) |
|
Table 2 Short-term projections
Table 2a Consumer prices. Twelve-month change. Percent
|
2025 |
2026 |
||||||
|---|---|---|---|---|---|---|---|
|
Sep |
Oct |
Nov |
Dec |
Jan |
Feb |
Mar |
|
|
Consumer price index (CPI) |
|||||||
|
Actual |
3.6 |
3.1 |
3.0 |
||||
|
Projections MPR 3/25 |
3.7 |
2.7 |
2.5 |
2.6 |
|||
|
Projections MPR 4/25 |
2.9 |
2.7 |
1.9 |
2.6 |
|||
|
CPI-ATE |
|||||||
|
Actual |
3.0 |
3.4 |
3.0 |
||||
|
Projections MPR 3/25 |
3.2 |
3.2 |
3.1 |
3.1 |
|||
|
Projections MPR 4/25 |
3.0 |
2.9 |
2.6 |
2.7 |
|||
Sources: Statistics Norway and Norges Bank
Table 2b House prices. Monthly change. Seasonally adjusted. Percent
|
2025 |
2026 |
||||||
|---|---|---|---|---|---|---|---|
|
Sep |
Oct |
Nov |
Dec |
Jan |
Feb |
Mar |
|
|
Actual |
0.4 |
0.6 |
0.7 |
||||
|
Projections MPR 3/25 |
0.6 |
0.5 |
0.5 |
0.4 |
|||
|
Projections MPR 4/25 |
0.8 |
0.6 |
0.6 |
0.6 |
|||
Sources: Eiendomsverdi, Finn.no, Real Estate Norway and Norges Bank
Table 2c Registered unemployment (rate). Percent of labour force. Seasonally adjusted
|
2025 |
2026 |
||||||
|---|---|---|---|---|---|---|---|
|
Sep |
Oct |
Nov |
Dec |
Jan |
Feb |
Mar |
|
|
Actual |
2.1 |
2.2 |
2.2 |
||||
|
Projections MPR 3/25 |
2.1 |
2.1 |
2.1 |
2.2 |
|||
|
Projections MPR 4/25 |
2.2 |
2.2 |
2.2 |
2.2 |
|||
Sources: Nav and Norges Bank
Table 2d GDP for mainland Norway. Quarterly change.1 Seasonally adjusted. Percent
|
2025 |
2026 |
|||
|---|---|---|---|---|
|
Q2 |
Q3 |
Q4 |
Q1 |
|
|
Actual |
0.5 |
0.1 |
||
|
Projections MPR 3/25 |
0.4 |
0.4 |
||
|
Projections MPR 4/25 |
0.5 |
0.3 |
||
- 1 Quarterly figures based on monthly national accounts.
Sources: Statistics Norway and Norges Bank
Table 3 Projections of main economic aggregates
|
Change from projections in Monetary Policy Report 3/2025 in parentheses |
Percentage change from previous year (unless otherwise stated) |
|||||
|---|---|---|---|---|---|---|
|
Constant 2023 prices (NOK bn) 2024 |
2024 |
Anslag |
||||
|
2025 |
2026 |
2027 |
2028 |
|||
|
Prices and wages |
||||||
|
CPI |
3.1 |
3.0 (0.1) |
2.4 (0.2) |
2.6 (0.1) |
2.2 (0.1) |
|
|
CPI-ATE |
3.7 |
3.1 (0.0) |
2.7 (-0.1) |
2.4 (0.1) |
2.2 (0.1) |
|
|
Annual wages |
5.6 |
4.9 (0.2) |
4.2 (0.0) |
3.6 (-0.1) |
3.3 (-0.1) |
|
|
GDP deflator, mainland Norway |
3.4 (-0.1) |
3.3 (-0.4) |
3.4 (-0.4) |
3.2 (-0.1) |
2.9 (0.0) |
|
|
Real economy1 |
||||||
|
Gross domestic product (GDP) |
5387 |
1.5 (0.0) |
1.4 (1.0) |
1.2 (0.0) |
0.5 (0.3) |
0.3 (0.6) |
|
GDP, mainland Norway2 |
4049 |
0.6 (0.0) |
1.6 (-0.4) |
1.3 (-0.2) |
1.3 (0.0) |
1.4 (0.1) |
|
Output gap, mainland Norway (level) |
0.1 (0.0) |
0.0 (0.0) |
-0.2 (-0.1) |
-0.4 (-0.1) |
-0.3 (-0.1) |
|
|
Employment, persons, QNA |
0.7 (0.2) |
0.7 (-0.1) |
0.5 (-0.3) |
0.6 (0.0) |
0.7 (0.1) |
|
|
Registered unemployment (rate, level) |
2.0 |
2.1 (0.0) |
2.2 (0.0) |
2.2 (0.1) |
2.1 (0.0) |
|
|
Demand1 |
||||||
|
Mainland demand2 |
4210 |
0.9 (0.6) |
1.8 (-0.4) |
2.4 (-0.3) |
2.2 (0.0) |
1.9 (0.1) |
|
– Household consumption |
2139 |
1.5 (0.2) |
3.3 (0.2) |
2.1 (-0.4) |
1.7 (-0.1) |
1.5 (0.0) |
|
– Business investment |
459 |
1.3 (4.2) |
1.8 (-0.6) |
4.0 (0.6) |
2.8 (0.2) |
2.0 (0.0) |
|
– Housing investment |
192 |
-15.8 (3.3) |
-1.5 (3.2) |
3.3 (-4.2) |
7.7 (-1.4) |
7.6 (0.7) |
|
– Public demand |
1420 |
2.5 (-0.2) |
0.0 (-1.7) |
2.2 (-0.2) |
2.0 (0.0) |
1.6 (0.1) |
|
Petroleum investment2 |
244 |
4.8 (-5.0) |
6.0 (1.0) |
-3.0 (2.0) |
-6.0 (-1.0) |
-6.0 (-2.0) |
|
Mainland exports2 |
1103 |
3.4 (-0.5) |
4.2 (0.4) |
1.5 (0.1) |
1.3 (-0.3) |
2.2 (-0.1) |
|
Mainland imports2 |
1624 |
4.5 (0.2) |
3.7 (3.3) |
-0.8 (-3.1) |
2.5 (-0.4) |
2.5 (-0.2) |
|
House prices and debt |
||||||
|
House prices |
3.0 |
6.0 (0.0) |
6.3 (-0.6) |
7.4 (0.8) |
6.3 (0.9) |
|
|
Household credit (C2) |
3.5 |
4.5 (0.1) |
4.5 (0.0) |
4.6 (0.0) |
4.5 (-0.1) |
|
|
Interest rates and exchange rate |
||||||
|
Policy rate (level) |
4.5 |
4.3 (0.0) |
3.9 (0.0) |
3.4 (-0.1) |
3.2 (-0.1) |
|
|
Import-weighted exchange rate (I-44) (level) |
120.3 |
119.6 (0.5) |
119.5 (2.5) |
119.5 (2.5) |
119.5 (2.5) |
|
|
Policy rate, trading partners (level)3 |
4.1 |
2.8 (0.0) |
2.4 (0.1) |
2.5 (0.2) |
2.7 (0.3) |
|
|
Household income and saving1 |
||||||
|
Real disposable income excl. dividend income |
3.7 |
4.0 (-0.1) |
3.4 (-0.3) |
2.3 (-0.4) |
2.2 (-0.1) |
|
|
Saving ratio excl. dividend income (rate, level) |
2.4 |
2.0 (-0.2) |
2.6 (-0.1) |
2.7 (-0.2) |
3.1 (-0.2) |
|
|
Fiscal policy |
||||||
|
Structural non-oil deficit as a percentage of GPFG4 |
2.6 |
2.7 (0.0) |
2.8 (0.0) |
2.8 (0.0) |
2.8 (0.0) |
|
- 1 All figures are working-day adjusted.
- 2 Annual figures based on monthly national accounts.
- 3 Overnight Index Swap.
- 4 Government Pension Fund Global measured at the beginning of the year.
Sources: Eiendomsverdi, Finn.no, LSEG Datastream, Ministry of Finance, Norwegian Labour and Welfare Administration (Nav), Real Estate Norway, Statistics Norway and Norges Bank