Do narratives relevant for business cycles go viral?
In an earlier blog post, we provided evidence on how news topics covered by the media can be used to describe business cycle fluctuations for the three major economies; the US, Japan, and the euro area. In particular, building on the Nobel Prize-winning economist Robert J. Shiller’s narrative perspective, we showed how a topic decomposition of economic news could be used to capture the epidemiology of narratives relevant to economic fluctuations. In this piece, we build on those results and investigate the extent to which narratives relevant for business cycles go viral.
To investigate this, we start by formulating a testable hypothesis. Our claim is that, if narratives relevant for business cycles go viral, they must be of a similar type and at the same time important for business cycle developments across countries – at least periodically.
The hypothesis is then addressed by first constructing statistical measures of how similar the news topics are across countries. Next, these measures are weighted according to how important the underlying news topics are in explaining business cycle developments. From this we derive novel “virality indexes”, quantifying the degree to which (similar) narratives relevant for business cycles go viral.
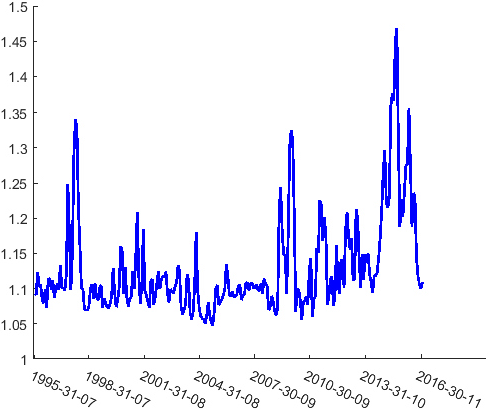
The figure below illustrates the derived virality indexes. The US business cycle is taken as the common “numeraire”. The graphs therefore illustrate the degree to which narratives important for growth in the US are important, and of a similar type, as the narratives important for growth in either of the two other economic regions.
(a) VIR Japan,US
(b) VIR Euro,US
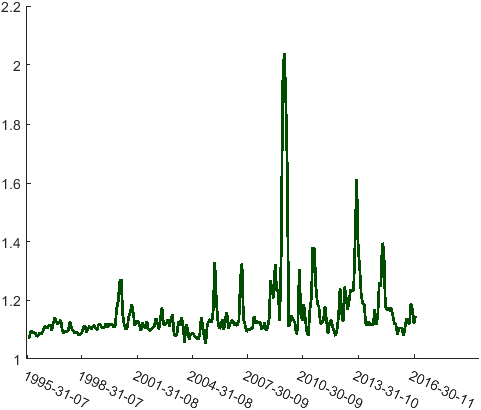
Figure: Virality indexes for the US-Japan and US-Europe economies. In the interest of visual clarity, the indexes are plotted on a monthly frequency, where aggregation from daily to monthly frequency is obtained by a simple mean.
The figure shows us that narratives do go viral, but only occasionally. On average, the indexes fluctuate mildly. However, at some occasions, the indexes spike. This pattern is especially pronounced following the global financial crisis in 2008, when the frequency, duration, and magnitude of the spikes all increase significantly relative to the periods before. Using an algorithm to compute the number of peaks, and their duration, we identify only two peaks prior to 2008. This is in the late 1997 for the 


Our full analysis can be found in the newly published working paper titled “Business cycle narratives”. In that paper, we also show that most of the epidemic episodes graphed in the figure below are associated with narratives related to US labor market conditions and monetary policy. Interestingly, however, we find little evidence suggesting that epidemics lead to more synchronized international business cycles.
In our next post, we will provide evidence casting light on whether narratives relevant for business cycles are associated with economic fundamentals, or better understood as capturing the market’s animal spirits.


0 Kommentarer
Kommentarfeltet er stengt