Business cycle narratives
Humans are storytellers. Complex explanations are often condensed to simple narratives, and some go viral. Can they even have economic impact? In recent research at Norges Bank we have explored to what extent narratives are informative for economic developments. In this blog post, the first in a series of three, we describe how narratives can be quantified and used to describe business cycle fluctuations in the three major economies; the US, Japan, and the euro area.
Quantifying narratives
Narratives play an important role in many sciences, including linguistics, anthropology, psychology, and history. In economics, however, narratives have thus far played a minor role in academic work. The Nobel Prize-winning economist Robert J. Shiller recognizes this shortcoming, and writes in his presidential address before the American Economic Association 2017 meeting:
“The human brain has always been highly tuned toward narratives, whether factual or not, to justify ongoing actions […]. Narratives “go viral” and spread far, even worldwide, with economic impact […]. Though these narratives are deeply human phenomena that are difficult to study in a scientific manner, quantitative analysis may help us gain a better understanding of these epidemics in the future.”
These claims beg a quantitative investigation, but how to do that? In our research, we propose a methodology for quantifying the relationship between narratives and business cycle fluctuations. Inspired by research in linguistics and psychology, we define narratives as time dependent, and accounts of events occurring over time. The particulars of narratives, however, are looked upon as tokens of broader types.
We operationalize this definition by focusing on news topics extracted from close to 11 million articles published through the Dow Jones Newswire Achieve, including the Dow Jones flagship publication The Wall Street Journal. The news topics are extracted using a statistical model, where each news article constitutes a mixture of many different topics. The topics themselves are mixtures of words that can be illustrated and interpreted with the use of word clouds.
Does the news topic approach offer a good quantitative approximation to our narrative definition? Undoubtedly, stories in the news are time dependent, and reflect accounts of events occurring over time. The topic model captures these features by allowing us to measure how the theme and meaning of stories in the news changes through time. Likewise, the particular topic composition of a given story might very well be unique and time dependent, but the individual topic distributions that the narrative constitutes are potentially shared by many other narratives. Thus, the particulars of narratives are treated as tokens of broader types, namely the topics.
Our underlying hypothesis is simple: To the extent that the media provides a relevant description of the economy, the more intensive a particular topic is represented in the media at a given point in time, the more likely it is that this topic represents something of importance for the economy’s current and future needs and developments. As an example, consider the first sentences of this news story:
(2010-04-20) “Nissan Motor Co. said Tuesday that the volcanic eruption in Iceland has forced it to temporarily suspend part of its domestic production lines as it is unable to airlift auto parts from Ireland… Nissan, which produced 2.74 million vehicles worldwide in 2009, expects Wednesday’s stoppage to result in a production loss of 2,000 vehicles…”
We find that three news topics have high weight in describing this piece of text. These are labeled “Outlook”, “Motor”, and “Natural disasters” (word clouds associated with these topics are shown in Figure 2 below). If many news stories have similar topic decompositions on this day, we hypothesize that these narratives signal something that can have economy-wide effects.
Decomposing every news article appearing in the corpus in a similar way, we construct daily time series reflecting the continuously evolving narratives about economic conditions, as described by the media. We then ask the question: To what extent are narratives informative for describing business cycle variation?
Narratives and business cycle variation
Jumping straight to the answer, narratives are very informative for the business cycle. To reach this conclusion, we include the quantitative narrative measures in a newly developed coincident index model, and estimate daily business cycle indexes for each of the three economies; the US, Japan, and the euro area. Similar to conventional coincident index models, the goal is to construct a timely measure of the state of the economy that tracks the phases of the business cycle. In contrast to existing models of this type, we allow for time-varying sparsity, and include our news-based narrative variables in the model’s information set instead of hard economic indicators.
In Figure 1, we plot the estimated news-based business cycle indicator together with output growth and existing state-of-the-art coincident index estimates. It is clear that our indicators track the state of the economy very well. In our research, we formally show that all indexes provide a good description of the business cycle phases, confirming the visual impression. In particular, the news-based narrative approach quantifies the phases of the business cycles almost equally well as coincident indexes estimated based on hard economic indicators.
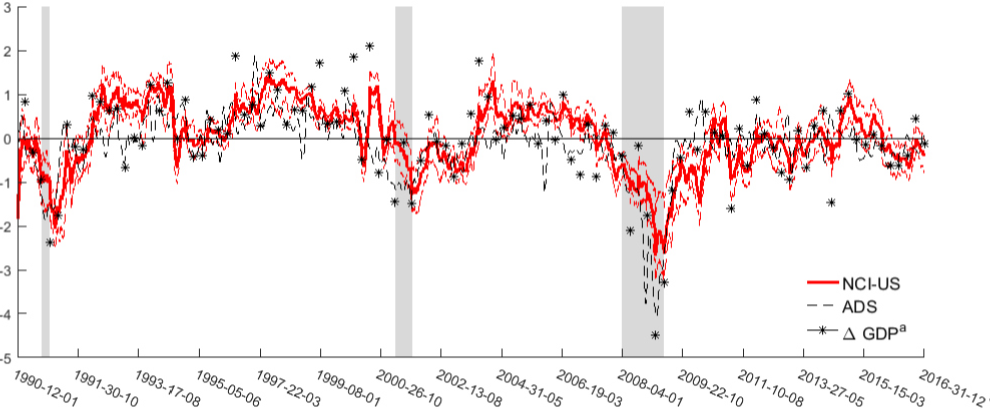
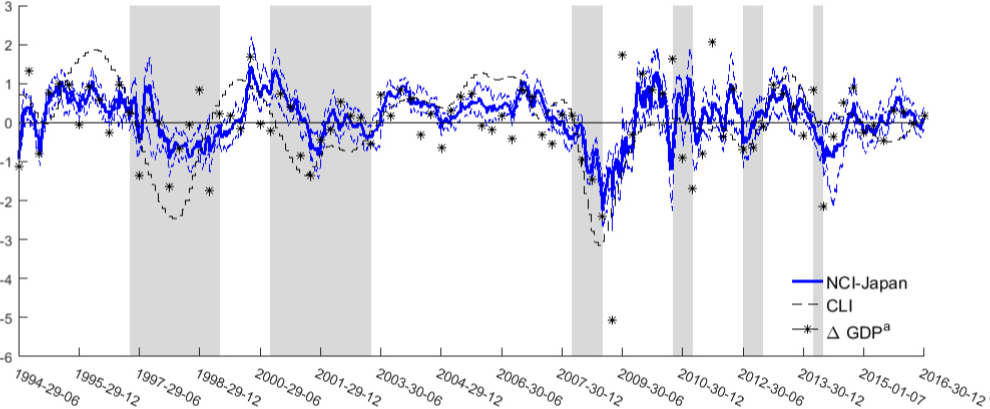
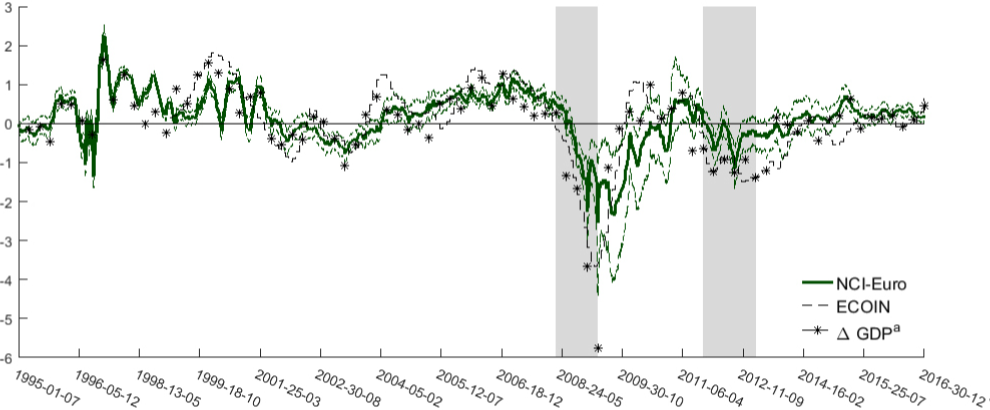
Figure 1: Δ GDPª is standardized output growth. It is recorded at the end of each quarter. The colored solid line is the standardized (median) estimate of the daily business cycle index, while the dotted colored lines are the 68 percent probability bands. The gray shaded areas illustrate recession periods as defined by NBER (US), ERCI (Japan), and CEPR (euro area).
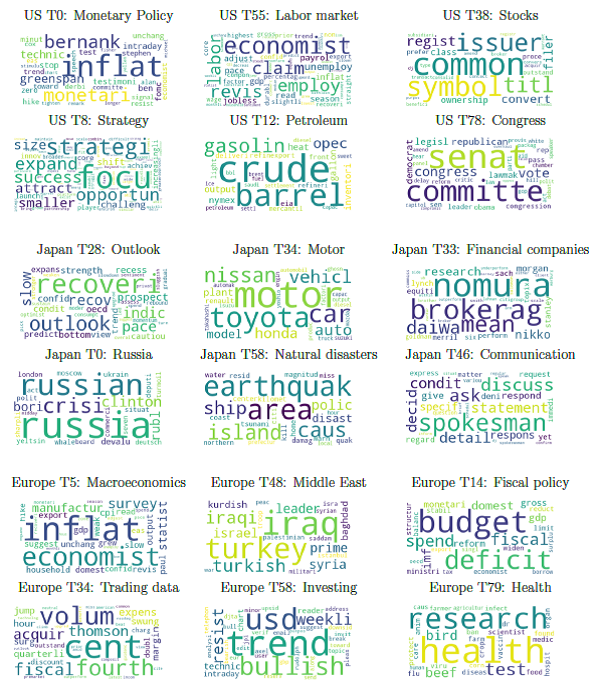
Figure 2: Word clouds and topic categorization. For each word cloud the size of a word reflects the probability of this word occurring in the topic. Each word cloud only contains a subset of all the words in the topic distribution. Topic labels are subjectively given.
An attractive feature of our modeling framework is that the evolution of the daily business cycle indexes can be decomposed into news surprises driven by the developments in the time-dependent news topics. Accordingly, we can shed light on the epidemiology of narratives relevant to economic fluctuations.
At a broad level, the most important news narratives are shown to be associated with general macroeconomic developments, finance, and (geo-)politics. This is illustrated in Figure 2, which graphs word clouds associated with some of the most influential news narratives on average across the sample. Some of these narratives are clearly associated with concepts that are also well measured by hard economic indicators, whereas others reflect concepts or events that are difficult, if not impossible, to capture using conventional economic data.
Our analysis also reveals two other important findings. First, in times of economic expansion a vast set of narratives are important in explaining our index estimates. In contrast, narratives associated with economic fluctuations become sparser in explaining the index estimates in bad times. Second, the timing of when specific topics become important in describing business cycle fluctuations resonates well with the conventional narrative held about economic developments the last two decades. This should not be too surprising, given that the narratives we know are the ones we have been served, partly through the media. What is perhaps more surprising is that it is possible to quantify it so well using new data sources and methods.
At a more practical level, while there is an abundance of high-frequency financial data, there is often limited availability of high-frequency data reflecting the broader economy. The narrative approach proposed here makes it possible for the index user to get broad-based high-frequency information about the type of new information that drive or reflect economic fluctuations. For policy makers in particular, understanding why an index changes might be as important as the movement itself, as reflected in the broad coverage of various data in monetary policy reports and national budgets. For the Norwegian economy we have already utilized this logic and constructed, tested, and operationalized a news-based coincident index named the Financial News Index (FNI). The construction of the index is described in this working paper. Regular updates of the index are done in collaboration with Retriever and Centre for Applied Macro and Petroleum Economics at BI Norwegian Business School (CAMP), and published here.
In later blog posts of this series, we will provide evidence on the extent to which narratives relevant to economic growth go viral, and whether these narratives are associated with economic fundamentals or better understood as capturing the market’s animal spirits. Stay tuned.
References:
Larsen, Vegard H. and Leif A. Thorsrud (2018). Business Cycle Narratives. Working Paper 2018/3, Norges Bank
Shiller, R. J. (2017). Narrative economics. American Economic Review 107 (4), 967-1004
Thorsrud, Leif Anders (2016). Words are the new numbers: A newsy coincident index of business cycles. Working Paper 2016/21, Norges Bank


0 Kommentarer
Kommentarfeltet er stengt