Valuable insight into the NOK market
Norges Bank publishes weekly statistics on the purchase and sale of the Norwegian krone (NOK) against foreign currencies in the spot, forward- and swap market. The statistics are based on transaction data submitted by the largest banks in the NOK market. Even though underlying transactions only represent a share of the increasing global turnover in the NOK market, the statistics nevertheless provide valuable insight into NOK transaction flows. Through this blog we make comparisons with global turnover data and highlight the analytical insights from the statistics.
About the statistics on foreign exchange transactions
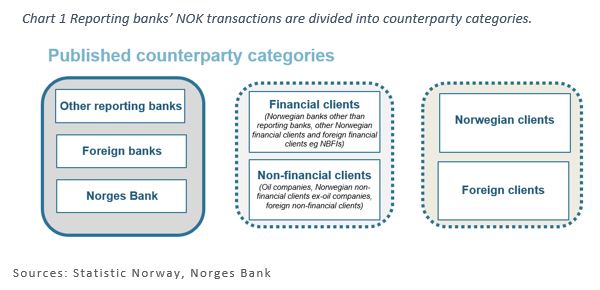
Since October 2005, Norges Bank has published statistics on the purchase and sale of Norwegian kroner against foreign currencies based on data reported by a number of the largest Nordic market makers in the NOK market. The statistics provide information on NOK market activity and is a useful tool for monitoring flows in the foreign exchange market. Reporting banks submit detailed daily FX transactions to Statistics Norway, specifying instrument type, maturity distribution, a breakdown according to purchase or sale of NOK against EUR, USD or against other currencies, and by counterparty category classification. The statistics are published weekly on Norges Bank’s website and are presented in an aggregated form. Chart 1 provides an overview of the published counterparty categories.
NOK market turnover
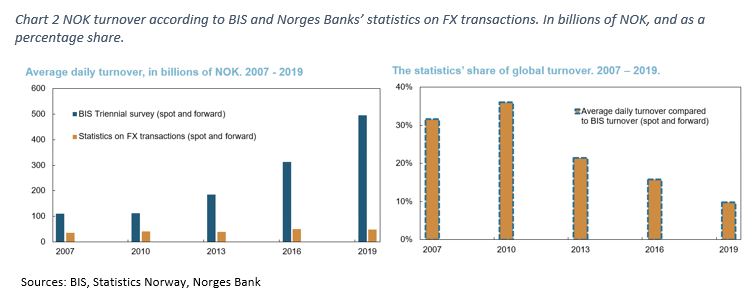
In recent years, reported turnover in NOK combined for the spot and forward market from Norges Bank’s FX statistics has averaged around NOK 50bn per day. However, quantifying global NOK turnover is difficult, partly owing to a change in market structure and increasingly fragmented trading, with the appearance of a growing number of new trading venues, electronic platforms and algorithm providers. The BIS triennial survey of global foreign exchange and derivatives markets is likely the best available overview, and the survey from 2019 shows that daily global turnover combined for spot and forward transactions in NOK was close to NOK 500bn. According to the BIS, total global turnover for all currencies, including NOK, has risen over a long period. Since the turnover reported in the statistics on FX transactions has been relatively stable, it suggests that NOK turnover increasingly occurs outside of the Nordic reporting banks. Chart 2 indicates that the foreign exchange statistics’ share of global NOK turnover has fallen from 30% to 10%.
Increased regulation in the aftermath of the financial crisis of 2008 has reduced banks’ risk capacity and ability to hold risky inventory on their balance sheets. Previously, banks were more likely to warehouse positions on their balance sheets, until having an actual underlying need to offset the position. A result of stricter regulation and downscaling of proprietary trading desks has caused the banks to mitigate their foreign exchange risk to a greater extent, and more immediately passing positions into the marketplace. This will inflate turnover statistics, as one FX transaction can change hands several times between market makers (“hot potato effect”) before finally being offset by a commercial need to exchange in the opposite direction. Even if the statistics do not include all global NOK trades, they will nevertheless serve as a reliable indicator of changes in turnover in the NOK market.
NOK transaction flows
The statistics can also provide valuable information about the various counterparties’ NOK transactions over time. Chart 3 shows cumulative net NOK purchases overall for spot and forward transactions by the different counterparty categories.
In the statistics, Norges Bank is included as a separate category. This is because Norges Bank, on behalf of the Ministry of Finance, carries out the necessary foreign exchange transactions associated with petroleum revenue spending via the central government budget. Until end-2013, Norges Bank sold NOK on behalf of the Ministry of Finance, but has since end-2014 purchased NOK in the market. The green line in the chart below illustrates this shift as cumulative net NOK purchases by Norges Bank continues to fall up until 2014 and rise thereafter.
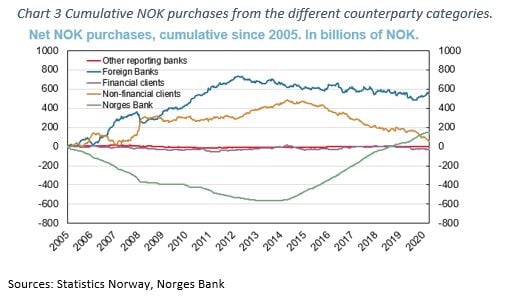
Chart 3 also shows that the counterparty category non-financial clients were buyers of NOK in the period to 2015, but have since been NOK sellers. This counterparty category includes oil companies, who are regular net NOK purchasers when converting foreign currency revenue to make petroleum tax payments. Conversely, Norwegian commercial importers are natural NOK sellers given their need to purchase intermediate goods etc. The shift from cumulative NOK purchases to net NOK sales likely reflects the pronounced fall in oil prices in 2014, with the related fall in the government’s net cash flow from lower petroleum tax payments. At the same time, owing to current account deficit excluding the petroleum sector, non-financial market participants are net NOK sellers.
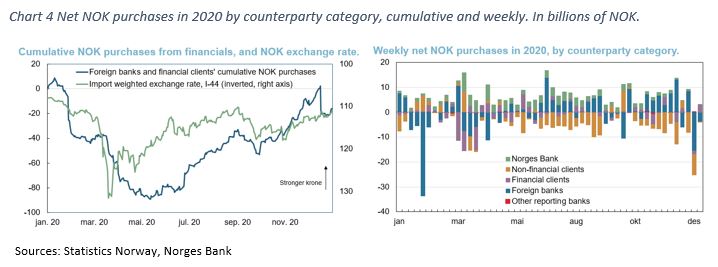
In addition to being a useful tool for explaining activity and specific mechanisms in the NOK market, the statistics can periodically underpin developments in the NOK exchange rate. The counterparty categories foreign banks and financial clients can be used as indication of speculative behaviour among NOK market participants. This builds on the theory of order flow analysis, where the price impact pass-through of a transaction may depend on which client originated the trade and whether such client is assumed to hold private information of signal value. If assuming that financial clients behave actively or more aggressively compared with passive non-financial clients, financial clients’ net NOK purchases can at times align well with movements in the NOK exchange rate. The left-hand side of Chart 4 shows the sum of foreign banks’ and financial clients’ cumulative NOK purchases through 2020 with the development in the Norwegian exchange rate. Here, a strong correlation is visible at times. In particular, the krone depreciation in the first quarter of 2020 coincided with substantial NOK sales. These NOK sales were largely reversed through the second half of the year, while the krone appreciated. An examination of weekly net purchases through 2020 for different counterparty categories (Chart 4, right-hand side), shows that financial clients in particular (including Norwegian, non-bank financial counterparties) sold NOK in March. At the same time, their total turnover volume accounted for a significantly larger than normal share of total turnover. This may largely reflect Norwegian asset managers’ constant need to rebalance their foreign investments’ currency hedges as the value of their foreign assets fell.
Possible challenges associated with the statistics
Owing to its design, the statistics do not capture NOK transactions occurring outside of the Nordic reporting banks. It is important to remember this shortcoming when using the statistics and interpreting the origins of NOK transactions.
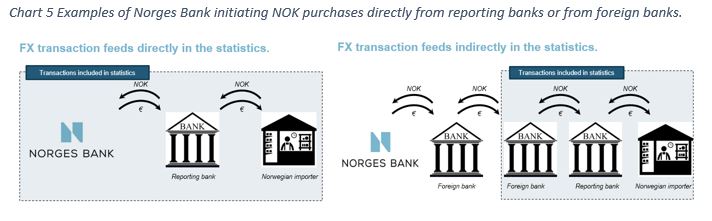
Chart 5 illustrates the different ways in which a NOK purchase initiated by Norges Bank is included in the statistics on FX transactions, depending on which intermediaries are used. In the first example, Norges Bank purchases NOK against EUR directly from one of the reporting bank, and the bank is assumed to offload the position quickly through an offsetting transaction with a counterparty wanting to sell NOK. It is assumed here that the end client is a Norwegian import company. By this example, the transaction with Norges Bank is classified in the statistics as a NOK purchase by Norges Bank, while the transaction between the reporting bank and the import company is categorised as NOK sales from a non-financial client. In the second example of chart 5, Norges Bank undertakes the FX transaction with a market maker that is a non-reporting bank, such as a foreign bank. The foreign bank offloads its risk in the marketplace, by passing it onto another foreign bank, which in turn offloads its risk onto one of the Nordic reporting banks. As in the first example, we assume the reporting bank finally buys back the NOK ultimately from an import company. By this example, the statistics will simultaneously display NOK purchases from a foreign bank and NOK sales from an import company. Since Norges Bank initiated the NOK exchange with a non-reporting bank in this example, it is not considered a counterparty in this case.
Since Norges Bank’s counterparty list is not exclusively limited to reporting banks, its NOK transactions will be underestimated in the weekly statistics on FX transactions. The deviation between actual NOK transactions (published on the Norges Bank website on the last day of each month) and Norges Bank’s NOK purchases in the statistics corresponds with Norges Bank’s transactions with other market makers than the defined reporting banks.
Correspondingly, foreign banks’ NOK transactions could also include transactions initiated by oil companies and other Norwegian non-financial clients. To the extent speculative interest and at times an influence on the exchange rate are ascribed to the counterparty category foreign banks, it is not unreasonable to assume that NOK transactions motivated by speculation are partly overestimated in the statistics. However, the scale of this is uncertain.
Despite some statistical challenges, the statistics on foreign exchange transactions still provide unique insight into the NOK market. The statistics can be used both to examine changes in total turnover and to analyse the behaviour and activity of different counterparty categories.

0 Kommentarer
Kommentarfeltet er stengt