Fragmented, not frozen – the Norwegian overnight interbank market after the Lehman failure
The perception of a markets-wide cessation of interbank lending in the immediate aftermath of the Lehman bankruptcy seems to be widely shared. We do not find evidence of such a “freeze” of the Norwegian overnight interbank market following the Lehman failure. Our evidence rather suggests a “fragmentation” of the interbank market with medium-sized banks paying much higher interest rates on their overnight interbank borrowing than large banks. Moreover, while large banks increased their overnight interbank borrowing, medium-sized banks effectively withdrew from the market as borrowers.
The bankruptcy of the US investment bank Lehman Brothers about 10 years ago severely stressed interbank markets across the world (Gjedrem (2008), BIS (2009)). Interbank interest rates increased substantially as Figure 1 indicates and many banks were either denied loans or rationed when borrowing from other banks.
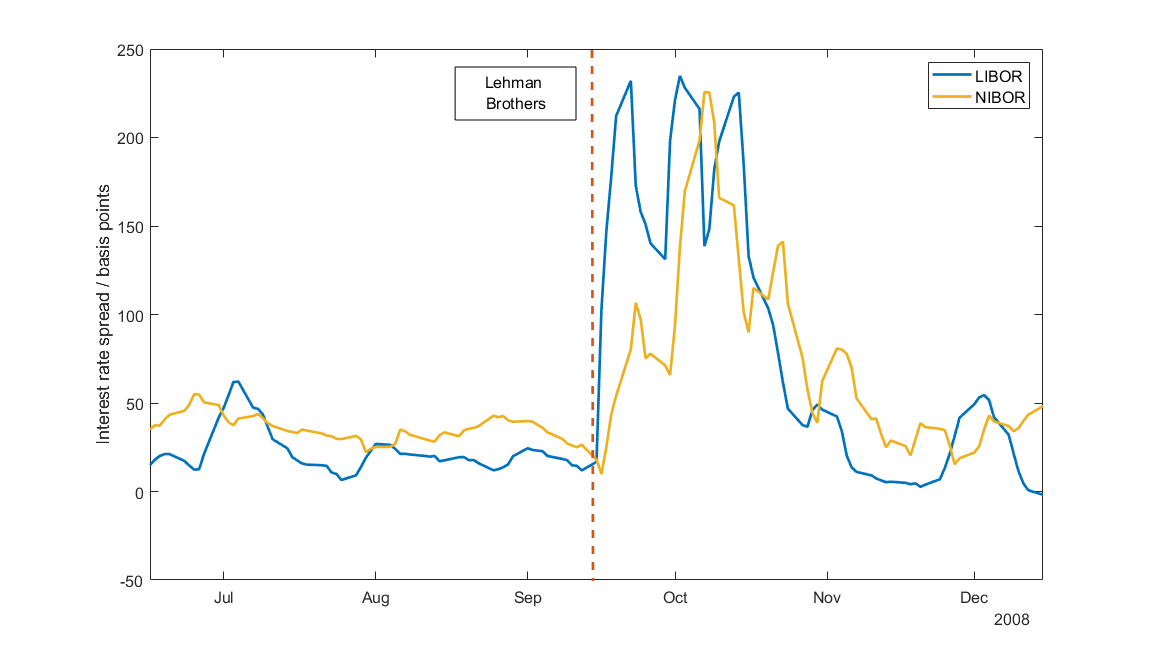
| Figure 1: LIBOR (overnight) and NIBOR (tomorrow/next) rates presented as deviations from the federal funds rate and Norges Bank’s policy rate, respectively. The observations are five-day moving averages and cover the period 15 June – 15 December 2008. The dashed vertical line marks 15 September, the day Lehman Brothers filed for bankruptcy. |
To meet banks’ liquidity demand, lower interbank rates and normalise interbank lending, central banks undertook several extraordinary measures (Gjedrem (2009), BIS (2008)). In particular, they provided generous amounts of liquidity at concessionary terms to banks in their domains; an overview of Norges Bank’s actions during the autumn of 2008 is available here.
We shed light on how the Norwegian (unsecured) overnight interbank market evolved in months before and after the Lehman bankruptcy on 15 September 2008, using hitherto unused data of interbank transactions and improved analytical tools. In our daily data, we do not find evidence of the overnight interbank market for NOK liquidity “freezing” or “breaking down” on 15 September or on any of the days afterwards. However, we document large disparities between banks in their experience of the market stress following the Lehman failure. Our findings are largely aligned with studies of international interbank markets including Afonso, Kovner and Schoar (2010) and Abbassi et al (2015).
How do we know?
Banks borrow overnight in the interbank market to ensure they can meet their immediate liquidity needs. Information about individual interbank loans has not been subject to reporting and hence there is limited, if any, publicly available information about the size, interest rates and counterparties of individual loans. Such information can, however, be gleaned from settlement data of central banks with fairly high confidence. Interbank loans and repayments settle over the respective banks’ accounts at central banks. Researchers have developed so called ‘Furfine filters’ based on e.g. Furfine (2001) that scan through transaction registries of settlement systems and identify payments that may relate to overnight lending between banks.
We have adapted a ‘Furfine filter’ to Norges Bank’s settlement system and found that it gives highly reliable information about counterparties, interest rates, and values of unsecured overnight interbank loans; see Akram, Fevolden and Smith (2018). We use this filter to comb through settlement data from Norges Bank and shed light on the Norwegian unsecured overnight interbank market three months before and after the collapse of Lehman Brothers.
Unsecured interbank lending occurs mostly at short maturities. While the unsecured overnight market is an important venue for obtaining NOK liquidity, it is not the dominant one. Banks also borrow and exchange foreign currencies to NOK for short or long maturities while hedging for exchange rate risk. Lack of data prevents us from shedding light on how this market was affected by the Lehman failure.
What do we find? Divergence in interest rates and interbank activity across banks
Our five main findings are as follows:
First, while Norwegian unsecured overnight rates increased substantially after the Lehman failure, this happened gradually and these rates reached their maximum level about one month later. Further, overnight rates did not increase as much as market reference rates such as LIBOR or NIBOR. Figure 2 plots daily (loan-weighted) interest rate spreads of the overnight interest rate relative to Norges Bank’s policy rate, the overnight deposit rate. It also shows the weekly moving averages of the daily interest rate spreads.
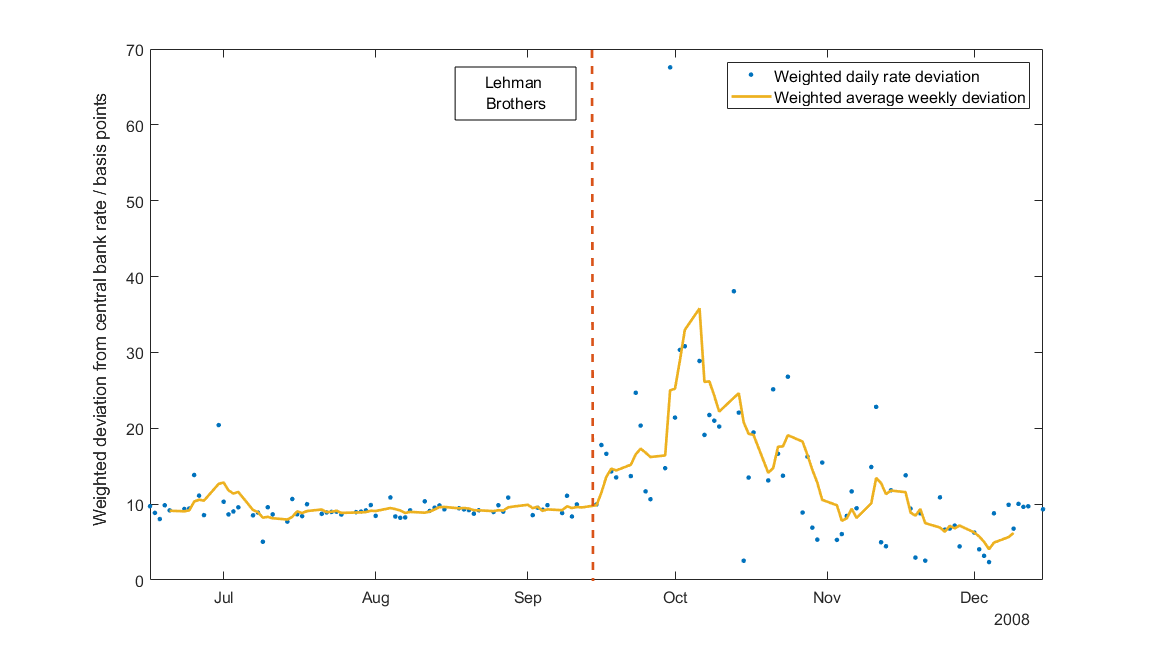
| Figure 2. Overnight interbank interest rates relative to Norges Bank’s policy rate in basis points over the period 15 June -15 December 2008. Blue dots present daily observations of loan-weighted interest rates spreads while the (yellow) line represents their five-day moving average values. |
While the weekly average spread was about 10 basis points during the three months leading up to 15 September, it gradually increased to around 35 basis points by early October. Afterwards, it declined towards its levels before mid-September displaying large daily fluctuations in contrast with its relatively stable values during the three months period prior to the Lehman default. The gradual and relatively muted increase in the overnight interest rate spread is in contrast with the NIBOR spread, which increased by more than 200 basis points by early October; see Figure 1.
Second, overnight interbank interest rates diverged widely across banks after mid-September. Figure 3 shows loan-weighted weekly averages of interest rates agreed between large and medium-sized banks. Here, large banks belong to Group 1 banks while medium-sized banks belong to Group 2 banks as categorised by Norges Bank. Figure 3 shows that overnight interest rates associated with loans between and in-between the two bank categories were close to each other before mid-September, but started diverging afterwards, with the divergence reaching its highest in October.
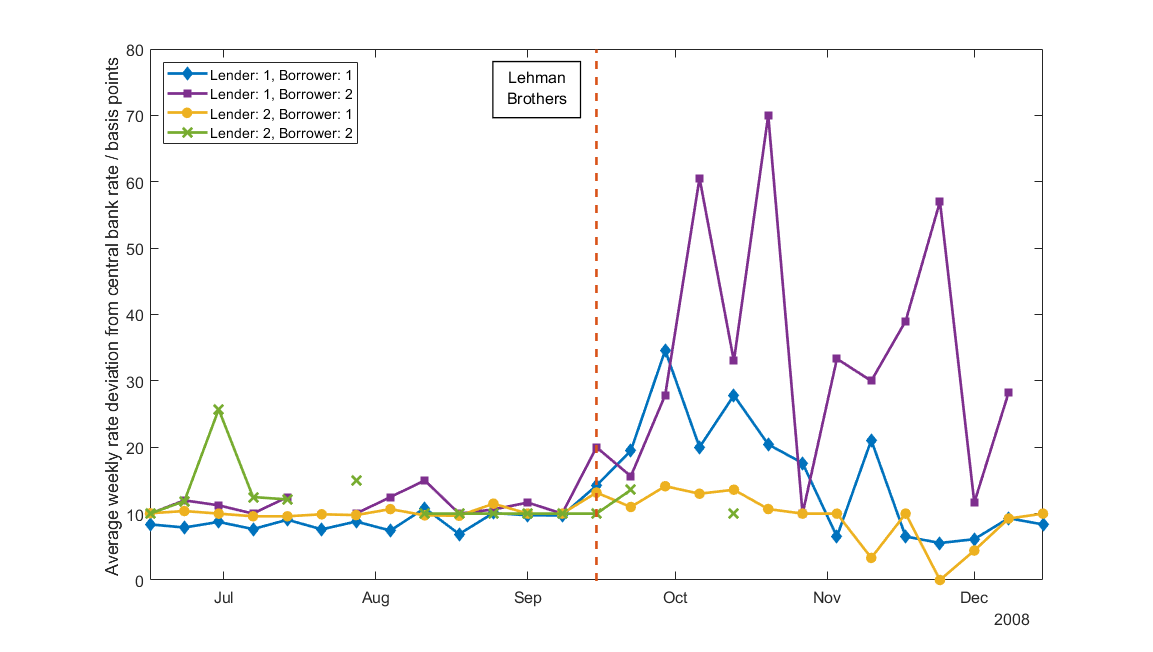
| Figure 3. Spreads between overnight interbank interest rates associated with borrowing between and in-between large and medium-sized banks, referred to as Groups “1” and “2”, respectively and Norges Bank’s policy rate. Banks are grouped according to today’s quota system, which was introduced in 2011. Sample: 15 June —15 December 2008. |
In particular, the spread for overnight rates for loans from large banks (Group 1) to medium-sized banks (Group 2) increased from 11 basis points to 70 basis points after mid-October. Lending between large banks took place at an interest rate spread that was at most half this amount (35 basis points) in late September. Interestingly, while medium-sized banks continued their lending to large banks at about the same rate as before mid-September, their lending to other medium-sized banks almost stopped in late September. This is evident from the absence of interest rates for lending between medium-sized banks from late September onwards, except once around mid-October.
Turning to participation in the overnight interbank market, our third key finding is that while the number of overnight market participants remained about the same as before Lehman’s failing, market activity measured both by the number and value of transactions declined after mid-September. Yet, the decline in market activity overall was rather modest.
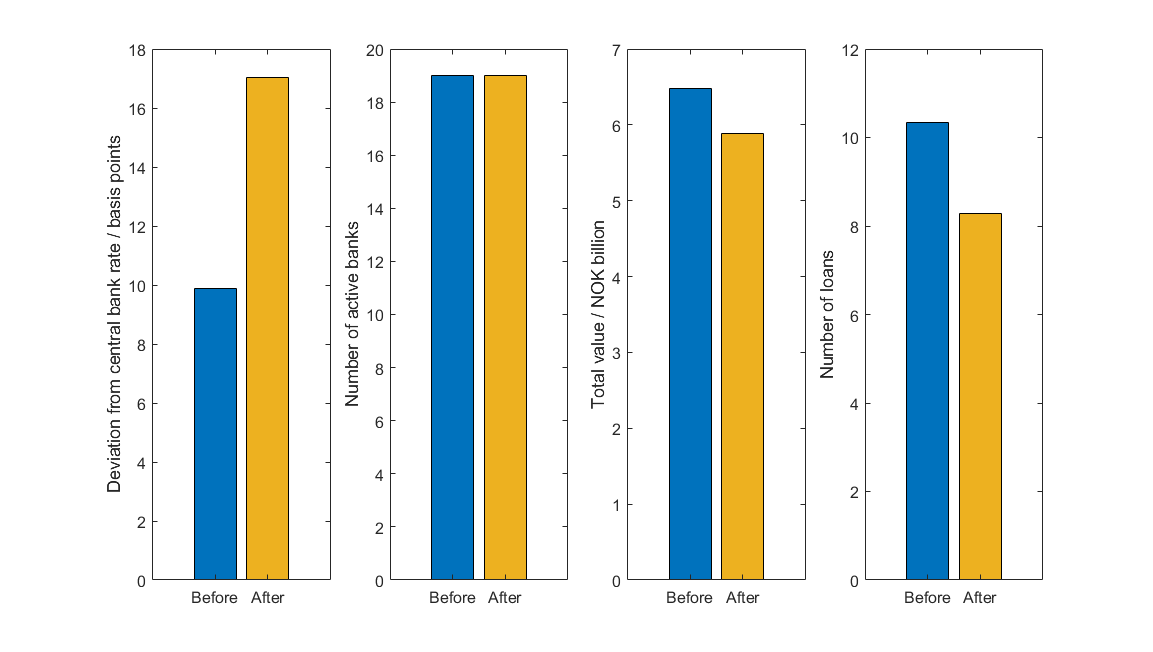
| Figure 4. Overnight interest rate spreads, market participation (as lenders or borrowers) and market activity as measured by the average daily turnover and the average daily number of loans, three months before and after 15 September 2008. |
Figure 4 shows that the number of active market participants during the three-month periods before and after mid-September was identical (19). The average of total values transacted daily in the three months after mid-September fell by 9 percent compared to the average level three months before mid-September. The daily average number of loans went down from 10 to eight over these periods. (Interbank activity has increased since then, especially after the shift in Norges Bank liquidity policy in October 2011 (Akram and Findreng (2017).)
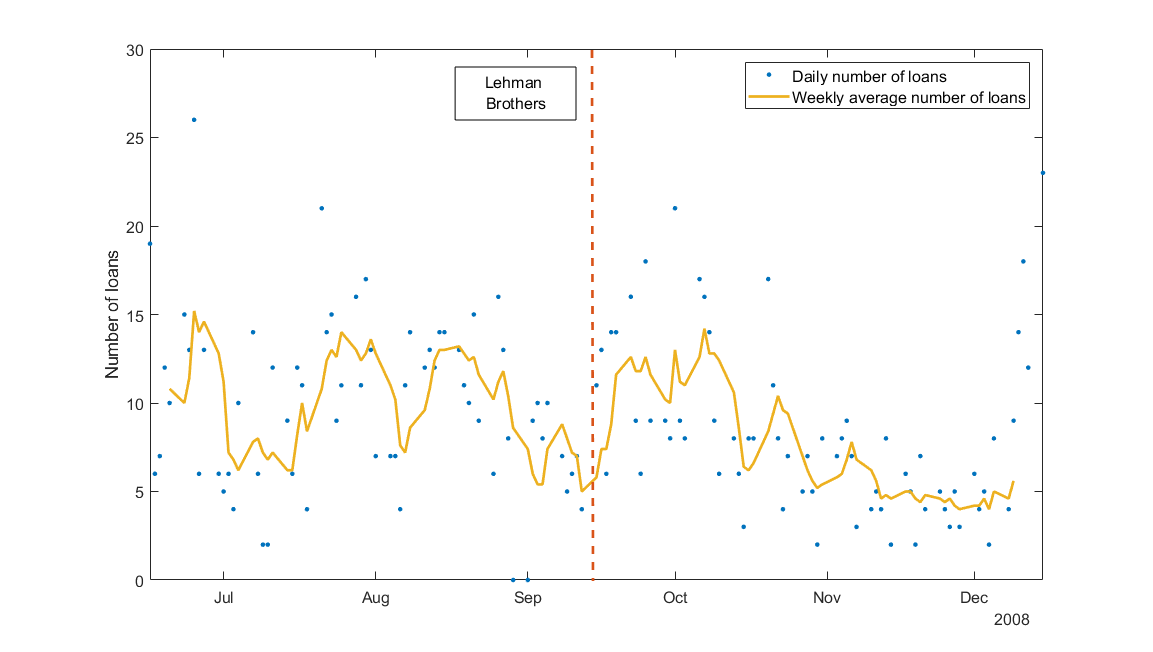
| Figure 5. Total number of overnight interbank loans per day and their weekly (five-day) moving averages over the sample period. |
Our fourth key finding is that the overall number of loans did not decline immediately after the Lehman bankruptcy. Figure 5 shows that until late October, the daily number of overnight interbank loans were comparable to their levels three months prior to the bankruptcy. The daily number of loans became relatively low in November and early December.
Aggregate numbers such as those in Figures 4 and 5 mask substantial differences between banks in terms of their market activity. Our fifth finding is that there occurred substantial changes in the composition of market participants as lenders as well as borrowers. Notably, the shares of large banks as both lenders and borrowers increased after mid-September.
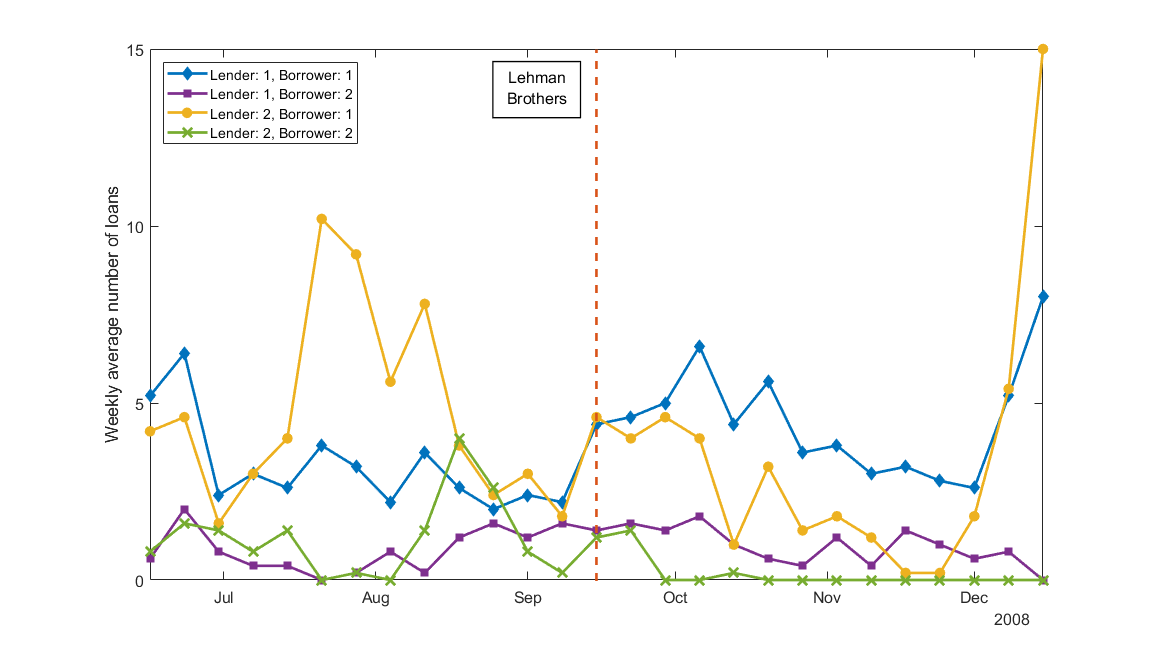
| Figure 6. Overnight interbank loans between and in-between large (Group 1) and medium-sized banks (Group 2), referred to as (Group) “1” and “2”, respectively. For example, “Lender: 1, Borrower:1” denotes (five-day) weekly averages of loans from banks in Group 1 to other banks in Group 1, while “Lender: 2, Borrower: 1” denotes weekly averages of loans from banks in Group 2 to banks in Group 1. |
In particular, large banks increased their lending to other large banks from mid-September onwards; see Figure 6. Medium-sized banks reduced their lending especially to medium-sized banks over the autumn before lending exclusively to large banks in mid-December. Medium-sized banks became effectively absent as borrowers by mid-December; see Figures 6, 7 and 8. By mid-December, only large banks borrowed from medium-sized banks and other large banks.
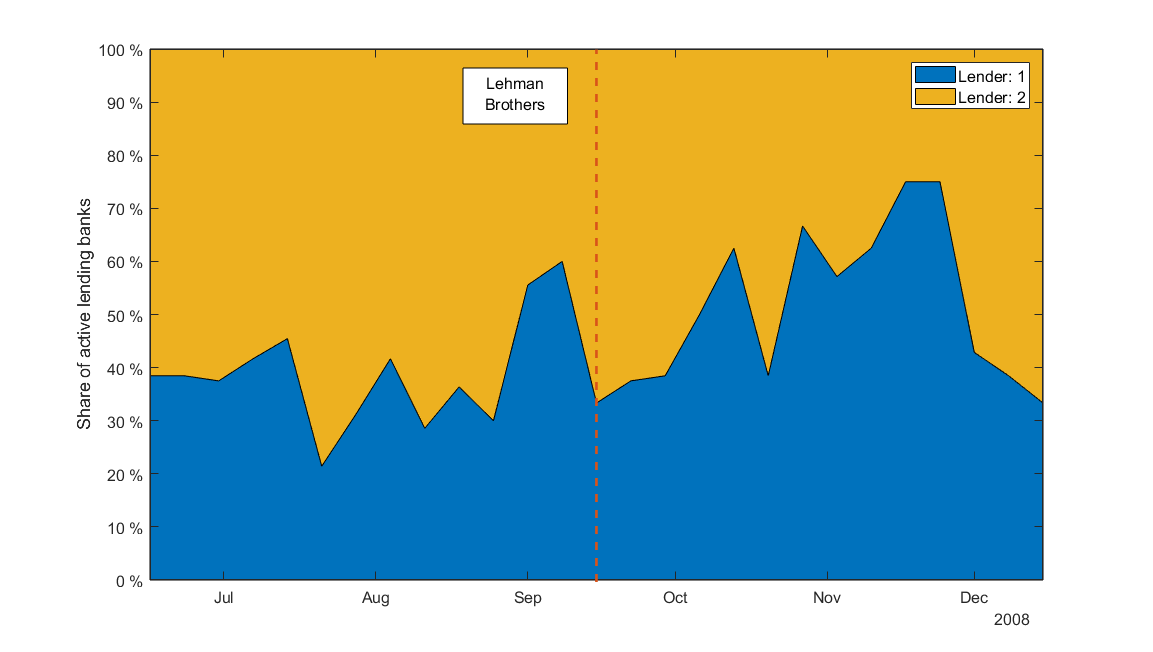
| Figure 7 Large banks’ (Group 1) and mediums-sized banks’ (Group 2) shares of overnight lending over the sample period. |
Figure 7 shows that the share of large banks as lenders gradually increased from 39 percent during the three-month period before the Lehman bankruptcy to 75 percent in late November before returning to its former levels in early December. Figure 8 shows that the share of large banks as borrowers also increased after mid-September. It went from 55 percent a month before the bankruptcy to 85 percent a month after the bankruptcy. It briefly reverted to its former levels around mid-November before increasing to 100 percent by mid-December.
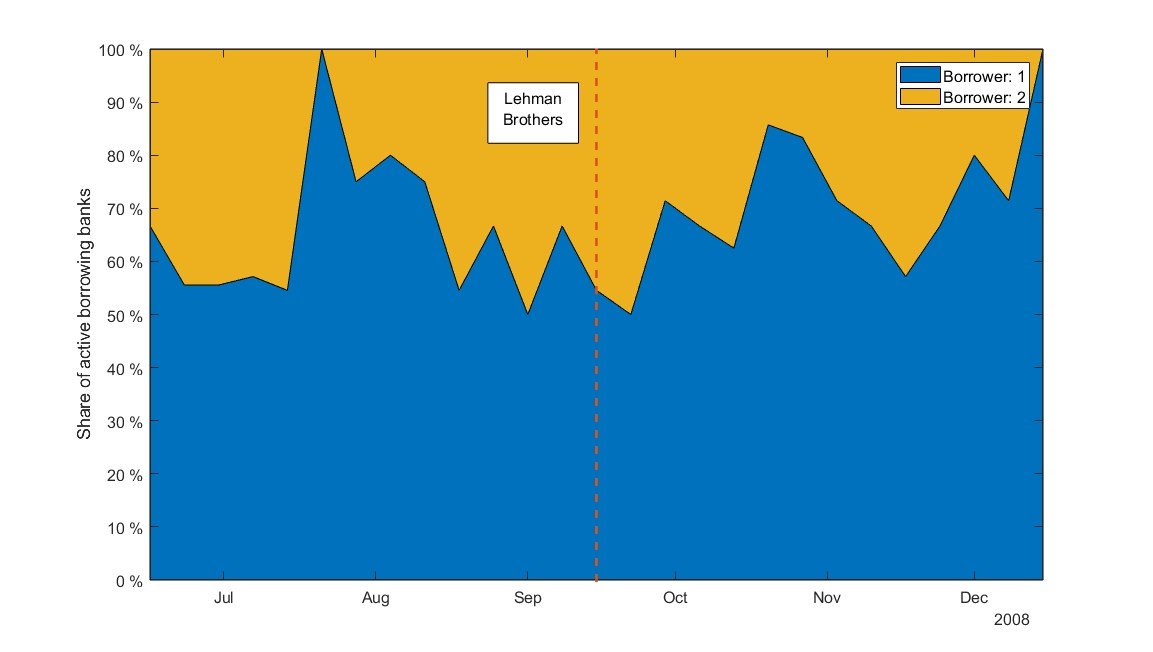
| Figure 8: Large banks’ (Group 1) and medium-sized banks’ (Group 2) shares of overnight borrowing over the sample period. |
In summary
The Norwegian unsecured overnight interbank market continued to operate in the aftermath of the Lehman failure. Overnight interest rate spreads increased, though substantially less than market reference rates such as NIBOR. Moreover, overall interbank trading remained at levels not far below those before the Lehman bankruptcy. The overall interest rates as well as trading indicators, however, mask substantial differences across banks regarding interest rates and interbank lending and borrowing.
Our investigation of the interest rates and trading activity at the levels of groups of large and medium-sized banks suggest a “fragmentation” of the overnight interbank market following the Lehman failure. Specifically, even though interest rates did not increase as much as market reference rates, they diverged substantially across banks, with medium-sized banks paying much higher interest rates on their overnight interbank borrowing than large banks. Large banks became dominant participants in the overnight market with more lending as well as borrowing relatively to medium-sized banks. In particular, while continuing their lending to large banks, medium-sized banks withdrew from the overnight interbank market as borrowers in late 2008. One could say, the unsecured overnight interbank market continued to operate after the Lehman bankruptcy, but for a few months, primarily as a market for large banks.


0 Kommentarer
Kommentarfeltet er stengt