Are narratives associated with economic fundamentals or better understood as capturing the market’s animal spirits?
This is the last blog post, in a series of three, where we use text as data and take a narrative perspective to describe and understand business cycle fluctuations. In the preceding posts we have shown how a topic decomposition of economic news could be used to track the business cycle in the US, Japan, and euro area, and we have investigated whether or not narratives relevant for growth go viral.
However, no causal inference is sought, or can be inferred, from the preceding analyses. In this piece, we take one step towards a more structural understanding, and investigate whether narratives are associated with economic fundamentals, or if they are better understood as capturing the market’s animal spirits. At a broad level, this is a long standing debate in the economic literature. Under the former view, changes in expectations, due to news (new information) about economics fundamentals, is put forward as the primary driver of economic fluctuations. The alternative view of narratives and their role in explaining economic fluctuations can be associated with the classical work of Pigou (1927) and Keynes (1936), where changes in agents’ expectations can be totally self-fulfilling or not rooted in economic fundamentals at all.
To this end, we borrow from recent work trying to infer causal relationships among components of biological systems using so called “Graphical Granger Causality” modeling. This approach allows us to construct a network graph of how different news narratives are interconnected. The underlying idea is simple: We have a large set of time series for the news topics, i.e., the narrative variables (see our first blog post). Among these series, we are interested in finding those that are most easy, and most difficult, to predict using historical values of the other news topics. The high dimensional news topic dataset can thereby be partitioned into what we loosely call “propagators” and “initiators”. The “propagators” are easily predicted by many other news topics. In contrast, the “initiators” are more exogenous, and therefore much harder to predict. Our hypothesis is that fluctuations in narratives belonging to the “initiators” group are less likely to be due to potential feedback loops, and more likely to represent new information. Or in other words, narrative ”initiators” should be associated with economic fundamentals while narrative “propagators” might be better understood as capturing the market’s animal spirits.
Figure 1 provides an illustration. The density of the grey edges shows that many news topics predict each other. The 10 most connected news topics are highlighted using colored nodes. They have predictive power for many other news topics, but are also themselves predicted by many other topics. These are the “propagators”. In contrast, news topics that we call “initiators” are typically found further out in the network graph. At the extreme they are not predicted by any of the other series, but they do still have predictive power for many of the other narratives. Thus, any unexpected changes in these less central parts of the network should be less likely to be due to feedback loops (“propagators”), and more likely to represent new information (“initiators”).
Figure 2 confirms this intuition. Taking a weighted average of the “initiator” narratives, we get a series that co-move with total factor productivity (TFP) in the US. The correlation is not large, but as shown in the panel to the right, the dynamic relationship between the narrative “initiators” and TFP is strong and statistically significant.
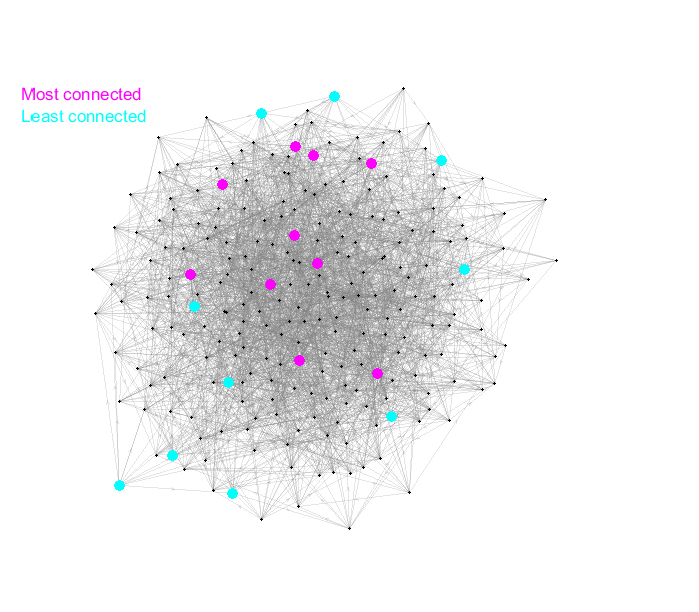
Figure 1: A network graph of how the news narratives are connected to each other. Each node is a narrative (news topic time series). In the interest of visual clarity, their name is not reported. The (gray) edges connecting the nodes are directed, and illustrate the direction of predictability across narratives. The highlighted nodes are those that are estimated to be the most (least) central narratives in the graph.
(a) TFP and the news factor
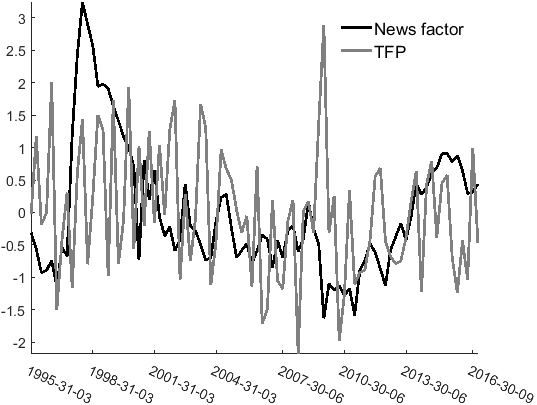
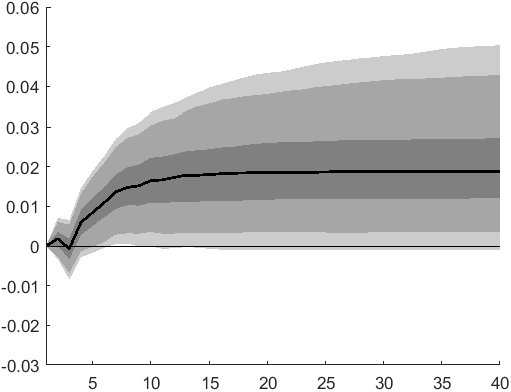
Figure 2: Figure 2a reports the estimated news factor (derived from the “initiators”) together with TFP for the US. Figure 2b reports the response (in levels) of US TFP following a one standard deviation innovation in the news factor. The black solid line is the median estimate. The uncertainty bands reflect the 95, 90, and 50 percent quantiles, constructed from a residual bootstrap.
The narrative realism of these results can be appreciated by looking at the news topics that constitute the “initiators”, namely the “Clients”, “Software”, ”Stocks”, “Bankruptcies”, and “Commodities” topics. One example of a news story where these topics receive a particular high weight is this one from 2014:
“(2014-06-11) Microsoft Corp.’s strategy for moving customers to its cloud email and productivity software is resonating with many corporate customers. Microsoft says the number of commercial seats for Office 365, its flagship productivity and email cloud service, more than doubled over the 12 months ending March 2014. It hopes its moves will lead to sales of a broader array of services to existing customers, including more complex business applications and cloud infrastructure services…”
Conversely, in the article titled “Business cycle narratives”, we show that the relationship between TFP and the so called “propagators” is statistically insignificant. Thus, while narratives interact in complicated ways, we document that some news topics are clearly associated with economic fundamentals, as predicted by the news-driven business cycle view. Other narratives show no such relationship, and are likely better explained by classical work on market’s animal spirits.
Humans are storytellers, and complex explanations are often condensed to simple narratives. Empirical economic research taking a narrative perspective is in its early phases. In this and the two previous blog posts (here and here), we have summarized some of the main research findings documented in our new working paper titled “Business Cycle Narratives”. This work is just one of many where we investigate the potential of using text as data, and other Big Data sources. We have also shown, for example, that the news topics the media writes about can be used to predict daily stock returns. Our story is simply that text and narratives can be quantified, and that such information is very informative for describing, and perhaps even understanding, economic fluctuations.


0 Kommentarer
Kommentarfeltet er stengt