
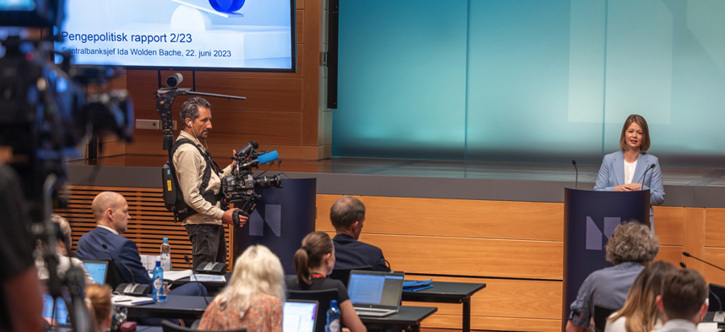
Equipped for an uncertain future
Uncertainty and an ever-changing economic landscape require high standards for how we, as an organisation, perform our social mission. While our influence on the global economy is limited, what we can do is ensure that our organisation is as well prepared as possible to meet the changes that occur.
Norges Bank performs important tasks on behalf of the nation. How successful we are is determined both by external factors and by how well-equipped we are, as an organisation, to respond to events.
The year 2023 was marked by continued high inflation and global monetary policy tightening. To restrain the rise in prices in Norway, Norges Bank raised the policy rate from 2.75% to 4.5% in the course of the year. Gains in equity and fixed income markets led to a sharp increase in the value of the Government Pension Fund Global (GPFG).
Much of what we do at Norges Bank is less visible than the policy rate or the value of the GPFG. Payments worth billions of NOK are settled daily in Norges Bank’s settlement system, the very heart of the Norwegian payment system. Managing the GPFG also entails millions of transactions every year, and the infrastructure we use needs to function as intended. In recent years we have enhanced our organisation to ensure operational resilience. In the light of the geopolitical situation, we have stepped up contingency planning and increased our efforts to prevent and respond to cyber attacks.
We need to adapt to a changing economy and a changing world. We need to improve our models and analyses, gather new and better data and perform our tasks in new ways. This requires high standards for Norges Bank as an organisation and workplace. That is why it is important for us to attract and cultivate capable and motivated employees and foster a good working environment with the right to speak up and room for making mistakes.
I am proud of my colleagues who, with their strong engagement and talent, enable us to carry out Norges Bank’s important social mission.
Oslo, 27 February 2024
Ida Wolden Bache
Governor
Norges Bank’s Executive Board
The Executive Board comprises the Governor, the two Deputy Governors and six external board members, all appointed by the King in the Council of State. In addition, two board members are selected by and among employees to participate when administrative matters are on the agenda.
The Governor is Chair and the two Deputy Governors are First Deputy Chair and Second Deputy Chair of the Executive Board. The Executive Board has four preparatory and advisory committees, whose work strengthens and streamlines the Executive Board’s discussions. For more information on the members of the Executive Board, see norges-bank.no
Work of the Executive Board in 2023
The Executive Board held 13 meetings and discussed 218 items of business in 2023. Meetings also take place in the form of seminars for more in-depth presentations and discussions with the administration on the premises for important items on the Board’s agenda. Approximately two thirds of the Board’s time was spent on matters related to the management of the Government Pension Fund Global.
In addition, time is spent by the Executive Board’s four subcommittees on preparing selected matters to be considered by the Executive Board. For more information on the Executive Board’s subcommittees, see norges-bank.no
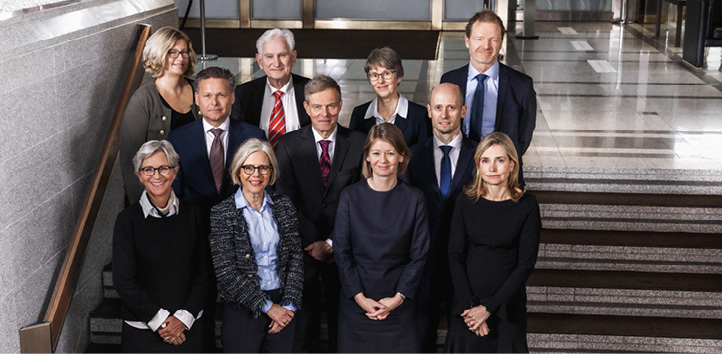
Table 1 Work of the Executive Board 2019–20231
|
2019 |
2020 |
2021 |
2022 |
2023 |
|
|
Number of Executive Board meetings |
18 |
20 |
14 |
14 |
13 |
|
Number of Executive Board seminars |
11 |
4 |
5 |
6 |
5 |
|
Number of matters considered by the Executive Board |
242 |
222 |
228 |
212 |
218 |
|
Committee meetings |
|||||
|
Audit Committee |
5 |
7 |
11 |
7 |
6 |
|
Remuneration Committee |
4 |
5 |
7 |
6 |
6 |
|
Ownership Committee |
5 |
7 |
9 |
7 |
8 |
|
Risk and Investment Committee |
7 |
10 |
13 |
13 |
9 |
1 Upon the establishment of the Monetary Policy and Financial Stability Committee in 2020, some of the Executive Board’s areas of responsibility were transferred to the Committee.

Annual Report of the Executive Board for 2023
Norges Bank is Norway’s central bank, and its main office is in Oslo. The Bank has executive and advisory authority in the area of monetary policy, manages Norway’s foreign exchange reserves and the Government Pension Fund Global (GPFG), and is responsible for promoting robust payment systems and financial markets. In addition, the Bank has the sole right to issue Norwegian banknotes and coins.

The year 2023 was marked by continued high inflation and rising policy rates internationally. The krone depreciated further in 2023, particularly in the period to summer. Prices surged for both imported goods and domestically produced goods and services. To dampen the rise in prices, the Monetary Policy and Financial Stability Committee raised Norges Bank’s policy rate from 2.75% to 4.5% in the course of the year. See the Norges Bank’s Monetary Policy and Financial Stability Committee for further information.
Problems at some US and Swiss banks led to substantial movements in global financial markets in spring 2023. The authorities in these two countries intervened to reduce the risk of contagion to other institutions and prevent a further escalation of the financial market turmoil. The impact on Norway’s financial system was limited.
Global equity markets rose substantially through 2023, contributing to a sharp increase in the market value of the GPFG. Solid returns from GPFG fixed income investments also had a positive impact. In addition, the GPFG’s market value rose owing to the krone depreciation and transfers to the GPFG. A fall in global real estate markets in isolation pulled down the GPFG’s value. Developments in equity and fixed income markets and the krone depreciation also contributed to an increase in the value of Norges Bank’s foreign exchange reserves.
At the start of 2023, a new strategy period for Norges Bank commenced (Strategy 25). For the GPFG, this strategy means continuing and developing the investment strategies further. The ambition is to exploit the GPFG’s characteristics as a large and long-term investor to achieve the highest possible return in a responsible way. To ensure capacity, quality and robustness, Norges Bank Investment Management strengthened its organisation in the course of the year. The work to increase transparency continued, and the GPFG was named the world’s most transparent fund in 2023.

For Central Banking, Strategy 25 will focus on important areas in the payment system. In 2023, work started on deciding the design of the next generation NOK settlement system. At the same time, the Bank’s work on assessing whether to introduce a central bank digital currency continued. In line with Strategy 25, the Executive Board decided to establish a new and modern central banking data and analysis platform, the aim of which is to better facilitate the Bank’s analysis work.
Work on climate and environmental issues are strategic focus areas for both the GPFG and Central Banking. Norges Bank Investment Management continued its work to align the activities of investee companies with the Paris Agreement. In Central Banking, in line with Strategy 25, work has been carried out to improve the Bank’s understanding of the economic impacts of climate change and energy transition.
High priority was given to security and contingency preparedness in 2023, in particular cyber attack prevention and response. However, in light of the geopolitical situation, Norges Bank increased its focus on general contingency preparedness.
During 2023, some changes were made to Norges Bank’s organisation. In March, the Executive Board approved separate HR and Communication departments in both Norges Bank Investment Management and Central Banking. The aim was to achieve clearer divisions of responsibility, a simpler organisation and more tailored support to the two operational areas.
The Executive Board is pleased with the organisation’s performance and thanks the employees for their significant contributions in 2023. Norges Bank’s most important resource is its staff, and work is carried out systematically to ensure job satisfaction, stimulating work and the expertise necessary to perform the Bank’s mission. On an annual basis, the Bank conducts a comprehensive staff survey that also measures and assesses employee engagement, well-being and effectiveness. The survey is an important tool in the Bank’s work to develop its employees, organisation and workplace. The Executive Board is satisfied with the results of the 2023 staff survey and assesses the working environment at the Bank as positive. See the section on Norges Bank’s corporate social responsibility and sustainability for more information on the Bank’s staff and how the Bank works to be an attractive and future-fit workplace.

Government Pension Fund Global
Norges Bank manages the GPFG on behalf of the Ministry of Finance. The objective of the Bank’s investment management is to achieve the highest possible long-term return within the constraints laid down in the mandate from the Ministry of Finance.
The market value of the GPFG increased by NOK 3 336bn through 2023 and was NOK 15 765bn at the end of the year. The market value is affected by the return on investments, capital inflows and withdrawals by the government and exchange rate movements.
Return on the Government Pension Fund Global
In 2023, the return was equivalent to NOK 2 222bn1. A weaker krone increased the market value of the GPFG by NOK 409bn, but this has no bearing on GPFG purchasing power in foreign currency. Net transfers from the Norwegian government were NOK 704bn after the payment of management fees.
Measured in the GPFG’s currency basket, the return for the year was 16.1% before management costs. Equities returned 21.3%. Stock markets were lifted by a surge in prices for technology stocks. A continued rise in central bank policy rates due to high inflation affected bond markets, but a drop in long yields towards the end of the year contributed to a return on fixed income investments of 6.1% in 2023.
Investments in unlisted real estate returned -12.4%, and unlisted renewable energy infrastructure 3.7%. The return on unlisted real estate was weak, both in absolute terms and relative to other asset classes. The return was pulled down by lower valuations as a result of higher real interest rates and decreased demand for office properties since the pandemic.
GPFG investments at the end of the year broke down into 70.9% equities, 27.1% fixed income, 1.9% unlisted real estate and 0.1% unlisted renewable energy infrastructure.
With such a large fund and an equity share of around 70%, we have to be prepared for considerable fluctuations in the GPFG’s return and market value. Each year, Norges Bank publishes the results of both historical and hypothetical stress tests. The tests conducted at the end of 2023 include shocks such as an economic recession linked to high public and private debt, long-term geoeconomic conflict and repricing of the equity market. In these stress tests, the decrease in the value of the GPFG is estimated at around 30% over a period of up to five years.
The Executive Board considers the return on the GPFG over time to have been good. In the period between 1998 and 2023, the average annual return was 6.1%. The annual net real return, after deductions for inflation and management costs, was 3.8% in the same period.
Return relative to the benchmark index
The return achieved by Norges Bank is measured against the return on the GPFG’s benchmark index. In 2023, GPFG return was 0.18 percentage point less than the return on the benchmark index.
Norges Bank’s investment strategies are grouped into three main categories: market exposure, security selection and fund allocation. These strategies are complementary and aim to take advantage of the GPFG’s size and long investment horizon. Each strategy has evolved over time.
Under the strategy for market exposure, the GPFG is invested broadly in equities and bonds included in the benchmark index. The investments are made cost-effectively and with a view to contributing to the objective of the highest possible return. The strategy for security selection is based on fundamental analysis of companies, and Norges Bank uses both internal and external managers. Fund allocation consists of a number of strategies that aim to improve the GPFG’s long-term risk and return characteristics. Investments in real estate and unlisted renewable energy infrastructure are part of the fund allocation strategy.
The results for both market exposure and security selection were good in 2023 and contributed positively to the GPFG’s relative return. However, the results for fund allocation, especially investments in unlisted real estate, meant that the GPFG’s overall return before costs was lower than the return on the benchmark index.

GPFG unlisted real estate investments are almost entirely in office, logistics and retail properties. Office properties account for around half of the portfolio, and investments in office and retail premises are concentrated in a small number of major cities. Higher real interest rates since the pandemic have resulted in weak returns on real estate in general, and especially in the part of the office market where the GPFG is invested. The rise in working from home following the pandemic has also reduced demand for office space. The GPFG’s office properties returned -15.4% in 2023. The valuation of the office portfolio peaked in the first quarter of 2022 and has since been written down by 25.2%.
Unlisted real estate is not part of the benchmark index and is funded by investing less in equities and bonds. Substantial variations may occur between the return on real estate investments and their funding from year to year. The results must be assessed over time. The return on unlisted real estate investments in 2023 was considerably lower than the return on the equities and bonds sold to fund them. This meant that unlisted real estate made a contribution of -0.58 percentage point to the GPFG’s relative return.
Investments in listed real estate returned 16.6% in 2023. In isolation, this made a positive contribution to the GPFG’s relative return of 0.11 percentage point. The value of these investments fluctuated widely during the year but surged in 2023 Q4 along with the rest of the equity market.
There was considerable variation in the results of the different investment strategies in 2023. The Executive Board considers it important for GPFG performance to be assessed as a whole and over time and is satisfied that the overall return over time has been higher than the return on the benchmark index, against which the return is measured.
Norges Bank has reported contributions to the relative return for the same three strategies in the period between 2013 and 2023. In this period, the average annual excess return before management costs was 0.29 percentage point. Market exposure and security selection made positive contributions to the relative return, while fund allocation made a negative contribution.
In the period between 1998 and 2023, the average annual return before management costs was 0.28 percentage point higher than the return on the benchmark index from the Ministry of Finance.
Risk
The objective of the highest possible return is to be achieved with acceptable risk. The risk in the GPFG is measured, analysed and followed up using a broad set of measures and different types of analysis. The management mandate requires Norges Bank to manage the GPFG with a view to ensuring that expected relative volatility (tracking error) does not exceed 1.25 percentage points. Expected relative volatility was 0.34 percentage point at the end of 2023, compared with 0.39 percentage point a year earlier.
Measured over the full period between 1998 and 2023, realised relative volatility was 0.64 percentage point.
Management costs
Management of the GPFG is to be cost-effective. Low costs are not an end in themselves, but cost-effective management supports the objective of the highest possible return after costs. In the period between 2013 and 2023, annual management costs averaged 0.05% of assets under management. In 2023, management costs amounted to NOK 6.6bn, or 0.05% of assets under management. The Executive Board is satisfied that management costs are low compared with other managers (see section on corporate governance for more information).

Responsible investment management and investment strategy
The mandate from the Ministry of Finance requires responsible investment to be an integral part of the management of the GPFG. A good long-term return depends on sustainable economic, environmental and social development. Norges Bank published expectations of companies on consumer interests during the year, as well as views on the responsible use of artificial intelligence.
Climate risk management is a priority for responsible investment, and in 2023, Norges Bank published sharpened expectations for how companies should manage climate risk and views on the use of voluntary carbon credits. A number of companies in the portfolio committed to net zero carbon emissions during the year.
It is hard to measure the effects of work on responsible investment. Provisional results from a research project in 2023 indicate that the Bank’s publication of its voting decisions five days before shareholder meetings leads to increased support for the GPFG’s position from other shareholders.
Norges Bank contributes to the development of the GPFG’s overall investment strategy through its role as an advisor to the Ministry of Finance. In November, the Executive Board submitted its recommendation to the Ministry of Finance to permit parts of the GPFG to be invested in unlisted equities.
The work to promote responsible investment is described in Norges Bank’s work on corporate social responsibility and sustainability.
For more information on the management of the GPFG, see the Government Pension Fund Global Annual Report for 2023.
Foreign exchange reserves
Norges Bank holds foreign exchange reserves for the purpose of crisis management. The foreign exchange reserves are to be sufficiently liquid to be available for use in foreign exchange market transactions or as part of the conduct of monetary policy or with a view to promoting financial stability and to meet Norges Bank’s international commitments. The aim of the management of the foreign exchange reserves is the highest possible return within the applicable risk limits. The reserves are divided into an equity portfolio, a fixed income portfolio and a petroleum buffer portfolio.
Equity and fixed income portfolio
The market value of the total equity and fixed income portfolio was NOK 654.4bn at year-end 2023, which is NOK 72.0bn more than in 2022. At the end of 2023, the value of the equity portfolio was NOK 143.1bn, while the value of the fixed income portfolio was NOK 511.3bn.
In international currency terms, the return on the total equity and fixed income portfolio was NOK 49.5bn in 2023, or 8.2%. The return on the equity portfolio was NOK 30.5bn, equivalent to 25.0%, while the fixed income portfolio returned NOK 19.0bn, equivalent to 4.3%. In NOK terms, the return on the foreign exchange reserves was 12.7%, reflecting higher equity prices, current interest income and lower global interest rates. The krone depreciation further increased the return in NOK terms.
The foreign exchange reserves are managed close to benchmark indexes set by the Executive Board, and the return closely tracks global equity and bond market developments. In 2023, the return on the equity and fixed income portfolios was 0.01 percentage point and 0.03 percentage point higher than the return on the portfolios’ benchmark indexes, respectively. At year-end 2023, expected relative volatility for the equity and fixed income portfolios was 0.05 and 0.02 percentage point, respectively, approximately unchanged through 2023. The foreign exchange reserves’ risk associated with return for Norges Bank arises from market exposure and different currency compositions on both the asset and liability sides. See also the discussion of the balance sheet and financial statements below.
Over the past ten years, the annual return on the equity and fixed income portfolio has been 10.4% and 1.0% in international currency terms, respectively. Overall, annual returns have been 3.5%. The Executive Board is of the opinion that returns have been solid over time.
Petroleum buffer portfolio
The purpose of the petroleum buffer portfolio is to provide for an appropriate management of the government’s need for converting foreign currency and NOK and for any transfers to and from the GPFG. The portfolio normally fluctuates in value owing to the purchase and sale of currency in the market, the purchase of foreign exchange from the State’s Direct Financial Interest (SDFI) and monthly transfers to and from the GPFG. As in recent years, high oil and gas prices have also led to large capital flows and substantial volatility in the petroleum buffer portfolio in 2023.
At the end of 2023, the market value of the petroleum buffer portfolio was NOK 35.4bn, which is NOK 7.8bn more than in 2022. The return on the portfolio was NOK 8.8bn, primarily owing to the krone depreciation. Net transfers amounted to NOK -3.1bn.
Responsible investment and investment strategy
The composition of the equity and fixed income portfolio is to be adapted to the aims of the foreign exchange reserves. The Executive Board has set management limits and principles to ensure that the reserves are invested to meet future liquidity needs. This framework for investment is assessed annually.
The equity portfolio is to be managed according to the same principles and strategies for responsible investment as the equity investments in the GPFG. Among other things, this means that the Bank’s work with responsible investment must be based on a long-term objective whereby investee company operations are in line with the goals of the Paris Agreement.
The work to integrate responsible investment into the management of the foreign exchange reserves is described in the section on corporate social responsibility and sustainability.
For more information on the management of the foreign exchange reserves, see the report Management of Norges Bank’s foreign exchange reserves.
Tasks performed as the government’s bank
In addition to being Norway’s central bank, Norges Bank is also the government’s bank. As the government’s bank, Norges Bank performs a number of tasks on behalf of the government, which includes government debt management and carrying out necessary foreign exchange transactions related to petroleum revenue spending.

NOK transactions on behalf of the government
The volume of foreign exchange transactions carried out by the Bank on behalf of the government has been high, and in 2023, the Bank purchased foreign exchange for NOK 329bn. The transactions in 2023 reflect the very high petroleum prices in 2022 because in the first half of the year, oil companies pay taxes on income earned in the preceding year.
Norges Bank is tasked with converting government revenues from petroleum activities on the Norwegian continental shelf so that the government receives the correct amount of NOK for spending via the central government budget and the correct amount of foreign exchange for saving in the GPFG. The transactions are a task carried out on behalf of the government, completely separate from monetary policy. The weak krone drew attention to the krone sales, which reflect oil companies’ krone purchases. The companies’ revenues are primarily in foreign currency and the companies must purchase NOK in order to pay taxes and duties to the government. A substantial share of these NOK revenues is used to cover the central government budget deficit. Norges Bank therefore only sells part of what the oil companies pay to the government.
Government debt
Norges Bank manages government debt on behalf of the Ministry of Finance. The borrowing requirement is primarily met through issuing long-term bonds. The government also borrows short-term by selling Treasury bills, which are debt instruments with a maturity of one year or less. The government borrows exclusively in NOK.
At the end of 2023, government debt totalled NOK 567bn, with NOK 517bn in government bonds, and NOK 50bn in Treasury bills.
Through the year, bonds amounting to NOK 80bn were issued to the market. In February, a new 10-year bond was issued via syndication in the amount of NOK 22bn. This bond was reopened in the amount of NOK 10bn through a syndication in October. In addition, existing bonds were reopened for NOK 48bn on 22 auction days. On some of these auction days, two different bonds were auctioned.
The average yield for the bonds issued in 2023 was 3.52%, compared with 2.76% in 2022, reflecting the general rise in yields.
Treasury bills worth NOK 52bn were issued to the market at 18 auctions.
Owing to high volatility and uncertainty in fixed income markets in both Norway and other countries, Norges Bank permitted primary dealers to quote larger-than-normal yield spreads in the interdealer market for government bonds and Treasury bills. In autumn, Norges Bank reduced the permitted yield spread somewhat.
Government bond and Treasury bill issuance was carried out in line with the Strategy and borrowing programme for 2023.
The payment system
Norges Bank is tasked with promoting an efficient and secure payment system. Norges Bank is the ultimate settlement system for interbank payments in Norway and issues banknotes and coins. Norges Bank oversees the payment system and other financial infrastructure, contributes to contingency arrangements and is the supervisory authority for interbank systems. The financial infrastructure is considered to be secure and efficient. Operation has been stable, and payments can be made swiftly and at low cost.
Norges Bank’s settlement system
Payment settlement between banks and other financial sector undertakings with an account at Norges Bank takes place in Norges Bank’s settlement system (NBO). Thus, most payments in NOK are ultimately settled in NBO. The operation of the settlement system was stable through 2023, with an average of NOK 355bn in payment transactions handled daily. At year-end 2023, banks’ sight deposits and reserves on deposit with Norges Bank totalled NOK 38bn.

In line with Strategy 25, the decision has been made to begin the process of overhauling the settlement system. The process addresses substantial and sometimes wide-ranging issues including aspects such as secure and stable operation, availability, interoperability, liquidity management, monetary policy, national governance and control, and cost efficiency. A key question is whether the next generation settlement system will build on the current model, with a dedicated solution for Norges Bank, or whether participation in the Eurosystem cooperation on TARGET services is more appropriate.
A well-functioning solution for real-time payments is an important part of an efficient payment system. Instant payments are payment services that ensure that payees receive funds directly in their accounts seconds after the payment is initiated - 24 hours a day, seven days a week. Norges Bank is assessing whether to expand its role as settlement bank by providing financial infrastructure for real-time payments through participation in the Eurosystem’s TARGET Instant Payment Settlement (TIPS) service. Norges Bank has initiated formal discussions with the European Central Bank on possible participation in TIPS.
Cash
Norges Bank has the role of wholesaler in cash distribution and supplies cash to banks from five central bank depots. Retail banks are retailers in cash distribution and provide customers with different cash services. In 2023, the supply of cash in circulation remained at approximately the same level as in previous years and largely reflected the same seasonal variations.
Although cash usage is very low in a global context, cash plays an important role in the payment system. In addition to being central bank money, cash has characteristics that make it part of the contingency arrangements for electronic payment solutions and is important for those that do not have the skills or opportunity to use digital payment solutions.
For cash to be able to fulfil its functions, the public must have real opportunities to obtain and use cash. In recent years, several regulations have been introduced to increase cash availability by clarifying banks’ obligation to offer their customers cash services. For some time, shops and service providers have increasingly turned down cash as a means of payment. In the Executive Board’s view, it is important that consumers’ right to pay cash is clear, and the proposed clarification in a bill from the Ministry of Justice and Public Security will be an important contribution in ensuring that cash remains easy to use. Norges Bank has repeated this view in its publications in 2023.
Central bank digital currency
The structural changes in the payment system raise questions about whether there is a need for Norges Bank to implement measures to ensure that NOK payments can continue to be made efficiently and securely in the future. Norges Bank and many other central banks are now exploring whether to introduce a central bank digital currency (CBDC).
Norges Bank started to explore CBDC in 2016, and in December 2023, Norges Bank published reports from Phase 4 of the exploration project. Phase 4 has consisted of experimental testing of technical solutions, analysis of scenarios for the payment system that would justify the issuance of a CBDC, evaluation of consequences for liquidity management and monetary policy and a review of the legislative changes necessary for an introduction of a CBDC in Norway. The exploration project will be continued in Phase 5 until the end of 2025. In addition to assessing a retail CBDC intended for the general public, the Bank will evaluate if new forms of interbank settlement in wholesale CBDC can facilitate innovation in tokenised bank deposits and other assets in tokenised form. The Bank will cooperate with other central banks and international organisations to gain knowledge and contribute to international standardisation and cooperation.
Cyber security and contingency planning
Cyber incidents are a potential threat to the financial system and financial stability. The cyber resilience of the financial sector needs to be strengthened. This requires extensive public-private cooperation. In collaboration with Finanstilsynet (Financial Supervisory Authority of Norway), Norges Bank has introduced cyber resilience testing according to Threat Intelligence-Based Ethical Red-teaming (TIBER), a framework from the European Central Bank. TIBER-NO is the Norwegian implementation of the framework that has also been adopted by the Nordic countries and many other countries in Europe. The first Norwegian test was conducted in 2023 and several other tests are currently being carried out. In addition, Norges Bank also participates in testing among Nordic countries. There is considerable interest in TIBER testing, and the Bank’s experience so far has been that the framework is appropriate for improving cyber resilience.
Upon the recommendation of Norges Bank, the Ministry of Finance has laid down a mandate for a working group to assess the contingency arrangements in the payment system. The working group will assess the need for measures to increase the safety of electronic payments in different scenarios.
For more information on the payment system, see Financial Infrastructure Report 2023.
Corporate governance
Norges Bank’s governance framework aims to be in line with best practice. The Executive Board follows up the Bank’s operations through periodic reporting on the status of implementing strategy and objectives, resource use, financial and operational risk and compliance.
Norges Bank’s use of resources is to be cost-efficient and prudent, with a cost level that is reasonable compared with that of peer organisations. The Executive Board followed up the budgeting process closely, and planning and the budget for 2024 were discussed at several Executive Board meetings in the latter half of 2023. A number of measures have been implemented to streamline operations, with some also contributing to taking advantage of synergies and economies of scale across the organisation.
Benchmarking, ie external comparisons of the Bank’s use of resources with that of other peer organisations, is used as a corporate governance tool. During 2023, two external cost comparisons were completed for the Bank’s resource use. On behalf of the Ministry of Finance, CEM Benchmarking has compared the management costs of the GPFG with 270 other funds. The GPFG is the fund in the peer group with lowest costs measured as a share of assets under management. According to CEM, the costs are lower because Norges Bank’s share of management carried out internally was higher and more cost efficient. In Central Banking, a comparison of resource use between the Nordic central banks was conducted. The survey shows that the Bank’s use of resources is somewhat lower than that of other peer central banks. The results also show that resource use among a number of the Nordic central banks is increasing, particularly in payment system development.

The Executive Board follows up financial and operational risk and compliance through periodic status reports. Valuations, performance measurement, management and control of risk comply with internationally recognised standards and methods. See the notes to the financial statements. There were no material breaches of the limits for the management of the GPFG or the foreign exchange reserves in 2023, and operational risk exposure was within the Board’s risk tolerance limit.
The Executive Board submits an annual risk assessment to Norges Bank’s Supervisory Council based on reporting by the administration and Internal Audit. No material deficiencies in the risk management and control regime were identified in 2023 and the Executive Board assesses the control environment and control systems at Norges Bank as satisfactory.
No directors’ and officers’ liability insurance has been provided for the members of the Executive Board or the chair of the Board, ie the Governor, in her role as general manager of Norges Bank. In practice, the Board members have limited liability risk, and the Bank self-insures any liability for damages on behalf of Board members or equivalent executive management positions. This is in line with practice in other Nordic central banks.
Balance sheet and financial statements
Balance sheet
Norges Bank’s balance sheet contains a number of items directly related to the Bank’s mission. The balance sheet total at year-end 2023 was NOK ١٦ ٦٢٩bn, compared with NOK 13 ٢٠٠bn at year-end 2022.
In line with the management mandate for the GPFG, the Ministry of Finance has placed a portion of the government’s assets in a separate account in Norges Bank (the GPFG krone account), presented as a liability to the Ministry of Finance. Norges Bank reinvests these funds, in its own name, and presents this as net value GPFG. The value of the GPFG krone account will always equal the value of the investment portfolio less accrued management fee and deferred tax. Norges Bank, in its role as asset manager, bears no financial risk associated with the management of the GPFG. At year-end 2023, the market value of GPFG investments was NOK ١٥ ٧٦٥bn, compared with NOK 12 ٤٢٩bn at year-end 2022. See the separate section above for more details on the management of the GPFG. Detailed financial reporting for the investment portfolio of the GPFG is presented in Note 20 to the financial statements. In addition, an annual report on the management of the GPFG is produced.
Excluding the GPFG, the foreign exchange reserves are Norges Bank’s largest balance sheet asset. The foreign exchange reserves are primarily invested in equities, fixed income instruments and cash. Net foreign exchange reserves amounted to NOK ٦٩٠bn at year-end 2023, compared with NOK ٦١٠bn at year-end 2022. See the separate section above for more details on the management of the foreign exchange reserves.
Under the government’s consolidated account system, all government liquidity is collected daily in government accounts at Norges Bank. At year-end 2023, deposits amounted to NOK 282bn, compared with NOK ٣٠٥bn at year-end 2022. Except for the GPFG krone account, this is the largest liability item on the balance sheet. However, this item fluctuates considerably through the year owing to substantial incoming and outgoing payments over the government’s accounts and transfers to and withdrawals from the GPFG.
Banknotes and coins in circulation are a liability item for Norges Bank. Norges Bank guarantees the value of this money. The amount of cash in circulation is driven by public demand. In recent years, lower demand for cash has reduced the amount in circulation. At year-end 2023, banknotes and coins in circulation amounted to NOK 40bn, unchanged compared with year-end 2022.
Deposits from banks, comprising sight deposits, reserve deposits and F-deposits, are managed by Norges Bank in accordance with its liquidity management policy. At 31 December 2023, these deposits amounted to NOK ٥٨bn, compared with NOK ٢٧bn at year-end 2022.
Norges Bank administers Norway’s financial obligations and rights ensuing from participation in the International Monetary Fund (IMF). Norges Bank has therefore both claims on and liabilities to the IMF. At year-end 2023, Norway’s net position with the IMF amounted to a claim of NOK 27bn, compared with NOK ٢٣bn in 2022. See Note 14 in the notes to the financial statements for more details on the relationship between Norges Bank and the IMF.
Norges Bank’s equity at 31 December 2023 was NOK 322bn, compared with NOK 270bn at 31 December 2022. The Bank’s equity consists of the Adjustment Fund and the Transfer Fund. At year-end 2023, the Adjustment Fund stood at NOK 286.7bn and the Transfer Fund at NOK 35.2bn, compared with NOK 253.3bn and NOK 16.2bn, respectively, at year-end 2022. Norges Bank’s equity, excluding the GPFG krone account, was 36.9% of the balance sheet total, compared with 35.0% in 2022.
The Executive Board deems that the Bank’s equity is sufficient to fulfil the Bank’s purpose (cf Section 3-11, Sub-section 1, of the Central Bank Act). This balance sheet composition is normally expected to generate a positive return over time, excluding foreign currency effects, as returns on the Bank’s investments in equities and fixed income instruments are expected to exceed the cost of the Bank’s liabilities.
Norges Bank’s assets are primarily invested in foreign currency, whereas its liabilities are primarily in NOK. Given the Bank’s balance sheet composition, income will largely be affected by developments in global fixed income, equity and foreign exchange markets. Considerable volatility in income should be expected from year to year. Future increases in the value of the GPFG will be affected by, among other things, transfers to/from the GPFG.

Income statement
Net income/-expense from financial instruments
Net income from financial instruments was NOK ٤٠.٩bn in 2023, compared with net expense of NOK ٥٥.١bn in 2022. Equity investments posted a gain of NOK ٣٠.٥bn, while fixed income investments posted a gain of NOK ١٨.٦bn, compared with losses of NOK ١٥.٩bn and NOK ٣٨.٣bn, respectively, in 2022. Net income from financial instruments also includes a gain of NOK ٣٠.٣bn as a result of foreign currency effects. Foreign currency effects in 2022 resulted in a gain of NOK ٤٥.٥bn.
Government Pension Fund Global
The GPFG’s total comprehensive income showed a profit of NOK ٢ 616.4bn, comprising a gain on the portfolio of NOK ٢ ٦٢٣.٠bn net of management costs of NOK 6.6bn. Equity investments posted a gain of NOK 2 031bn, while fixed income investments posted a gain of NOK 232bn. The gain on the portfolio also includes a gain of NOK 409bn owing to foreign currency effects. Norges Bank’s total comprehensive income for 2022 showed a loss of NOK 1 000.5bn, comprising a loss on the portfolio of NOK 995.3bn and costs related to the management fee of NOK 5.2bn.
Total comprehensive income for 2023 was recognised against the GPFG krone account at 31 December 2023. The return on the portfolio, after management costs reimbursed to Norges Bank have been deducted, is transferred in its entirety to the krone account and thus does not affect Norges Bank’s total comprehensive income or equity.
Other operating income
In accordance with the management mandate for the GPFG, Norges Bank is reimbursed for its expenses related to the management of the GPFG up to a limit. Norges Bank was reimbursed by the Ministry of Finance in the amount of NOK ٦.٦bn in 2023, compared with NOK ٥.٢bn in 2022. Norges Bank also earns income from other services provided to banks and rent from external tenants. Income from these activities totalled NOK ١٦١m in 2023, compared with NOK ١٤٩m in 2022.
Operating expenses
Operating expenses amounted to NOK 8.0bn in 2023, compared with NOK 6.4bn in 2022. NOK 6.6bn of the operating expenses in 2023 is related to the management of the GPFG, compared with NOK 5.2bn in 2022. See Note 19 in the notes to the financial statements for more details on the management fee received by Norges Bank under the management mandate. The increase in expenses compared with 2022 is mainly related to external management of the GPFG, personnel expenses, foreign currency effects and IT services, systems and data. Higher fees to external managers primarily reflect high excess return from external management and the fact that a larger share of the GPFG is managed externally. Higher personnel expenses largely reflect a strengthening of the organisation in the form of more employees.
Total comprehensive income
Change in actuarial gains and losses showed a loss of NOK ٣٥m in 2023, compared with a loss of NOK 504m in 2022. Norges Bank’s total comprehensive income for 2023 showed a gain of NOK 70.0bn, compared with a loss of NOK ١١.١bn in 2022.
Distribution of total comprehensive income
The distribution of total comprehensive income follows guidelines on the reserves and on the allocation of Norges Bank’s profit, laid down by Royal Decree of 13 December 2019 pursuant to Section 3-11, Sub-section 2, of the Central Bank Act. Total comprehensive income shall be allocated to the Adjustment Fund until this fund has reached 40% of the Bank’s net foreign exchange reserves. Any surplus is allocated to the Transfer Fund. A third of the Transfer Fund is transferred annually to the Treasury.
Norges Bank’s net gain of NOK ٧٠.0bn will be covered by a provision to the Adjustment Fund of NOK ٣٣.٤bn and a transfer to the Transfer Fund of NOK ٣٦.٦bn. A further NOK ١٧.٦bn will be transferred from the Transfer Fund to the Treasury. The annual transfers and allocations for 2023 were made in accordance with the guidelines.
1 The GPFG’s return reflects the return on the market value of the investment portfolio that does not include deferred tax. The portfolio result of NOK 2 214bn in the financial statements includes the impact of changes on the income statment in deferred tax.
Norges Bank’s Executive Board
Oslo, 8 February 2024
Ida Wolden Bache (sign.)
Governor / Chair of the Executive Board
Pål Longva (sign.)
First Deputy Chair
Øystein Børsum (sign.)
Second Deputy Chair
Karen Helene Ulltveit-Moe (sign.)
Kristine Ryssdal (sign.)
Arne Hyttnes (sign.)
Hans Aasnæs (sign.)
Nina Udnes Tronstad (sign.)
Egil Herman Sjursen (sign.)
Mona Helen Sørensen (sign.)
Employee representative
Truls Oppedal (sign.)
Employee representative
An account of sustainability has been prepared pursuant to Section 3-3c of the Accounting Act. The report is presented in a separate document in the Annual Report. The report on sustainability is an integral part of the Executive Board’s report.
Norges Bank’s Monetary Policy and Financial Stability Committee
The Monetary Policy and Financial Stability Committee is responsible for Norges Bank’s role as the executive and advisory monetary policy authority and is also tasked with promoting financial stability.

The Monetary Policy and Financial Stability Committee comprises the Governor, the two Deputy Governors and two external members.
The external members are appointed by the King in the Council of State for terms of four years. The Governor chairs the Committee, and the two Deputy Governors are First and Second Deputy Chairs. For more information on the Committee’s members, see norges-bank.no
The Committee had 22 meetings and discussed 76 items of business in 2023.
The Committee’s work structure
The Monetary Policy and Financial Stability Committee normally holds eight scheduled meetings a year, where policy rate decisions are made. Four of the meetings coincide with the publication of the Monetary Policy Report. At the interim monetary policy meetings, where the Monetary Policy Report is not published, the Committee also sets the level of the countercyclical capital buffer.
The Committee’s meeting schedule is primarily determined by the dates of the eight monetary policy meetings. In connection with the monetary policy meetings that coincide with the publication of the Monetary Policy Report, the Committee meets four times. In connection with the monetary policy meetings without a report, the Committee meets twice.
Bank staff prepare and present relevant analyses and projections that provide the basis for the Committee’s discussions and advise the Committee on policy decisions. To ensure that the discussion basis is as far as possible the same for all the Committee members, all have access to the same information and analyses provided by Bank staff.
The Committee is committed to transparent and clear external communication and seeks consensus on its assessments and decisions through in-depth discussion. The “Monetary policy assessment”, published in connection with policy rate decisions, and the “Assessment of the countercyclical capital buffer requirement”, published in connection with the buffer decisions, reflect the view of the majority. Topics of particular concern to the members in the discussions are highlighted in the assessments. Members that disagree with the assessment of the majority may dissent, and dissenting views are published together with a brief written explanation in the minutes and in the assessments published at the same time as the rate decision. All of the Committee’s decisions were unanimous in 2023. To underpin the Committee’s form as a collegial committee, the Committee Chair, the Governor, normally speaks on behalf of the Committee. Other Committee members may issue statements by agreement with the Committee Chair.
Annual Report of the Monetary Policy and Financial Stability Committee for 2023
The year 2023 was marked by continued high inflation and rising policy rates internationally. The krone depreciated further in 2023, particularly in the period to summer. Global inflation slowed considerably towards the end of the year. Lower energy prices curbed consumer price inflation in Norway as well, but it was still clearly above target. Higher-than-expected inflation and prospects that inflation would remain high for a longer period contributed to a faster and sharper rise in the policy rate than the Committee envisaged at the beginning of the year.

After the policy rate had been reduced to 0% during the coronavirus pandemic, Norges Bank started raising the policy rate again in autumn 2021 as economic activity recovered. In spring 2022, inflation accelerated, and the policy rate was raised further to 2.75% in the course of the year. The policy rate rise continued in 2023, partly as a result of both higher-than-expected inflation and economic activity. Higher wage growth and a depreciation of the krone contributed to pushing up inflation in the projections. To bring inflation down to target, the policy rate was raised several times, to 4.5% by the end of 2023.
Overall, the financial stability outlook did not change materially in 2023. Norwegian banks are solid and well equipped to absorb higher losses while maintaining lending activity. Creditworthy households and firms had ample access to credit through 2023. Losses have been low, but there is still an elevated risk that debt- and property price-related vulnerabilities may amplify an economic downturn. As decided in March 2022, the countercyclical capital buffer for banks was raised from 2% to 2.5% on 31 March 2023.
Monetary policy
International economy
In the wake of the pandemic, consumer price inflation rose markedly internationally. Freight rates and prices for energy, metals and agricultural products rose sharply. Russia’s invasion of Ukraine further pushed up prices for energy and other commodities. In many countries, inflation had not reached such a high level for several decades.
Energy prices declined towards the end of 2022 and were significantly lower throughout 2023 than the previous year. Nevertheless, gas and electricity prices were still at a high level. Oil prices rose somewhat through summer and after the outbreak of the war between Israel and Hamas in October but fell again to close to USD 80 towards the end of the year, which was about the same level as a year earlier. In 2023, cross-border goods trade flowed more normally again, and freight rates dropped. Throughout the past year, consumer price inflation slowed, particularly through the second half of the year. Underlying inflation among trading partners also slowed.
To reduce inflation, central banks internationally have raised policy rates considerably over the past two years. When inflation slowed through autumn, market policy rate expectations fell as well. Towards the end of 2023, central banks were expected to reduce policy rates in the course of spring 2024. Most central banks communicated that it would be necessary to maintain a tight stance for some time ahead to bring inflation down to target.
Economic activity among trading partners gained further momentum in 2023, but high inflation and higher policy rates contributed to slowing growth throughout the year. Unemployment remained low, and wage growth was high in a number of countries. Growth prospects improved somewhat through the year. In December, there were prospects that economic growth would pick up somewhat in the course of 2024.
Long-term interest rates rose sharply through 2022 and towards autumn 2023, to the highest levels in over a decade. Since then, rates edged down again and were close to the levels observed a year earlier at year-end. International stock indexes advanced through 2023.
Problems at some banks in the US and Switzerland led to large movements in global financial markets in spring 2023. The authorities in the two countries intervened to reduce the contagion effects on other institutions and prevent a further amplification of the market turbulence. The turbulence only had a limited impact on funding costs for Norwegian banks and other financial institutions.

Financial conditions in Norway
The krone depreciated further in 2023, particularly in the period to summer. The depreciation must be viewed in the context of the larger rate hikes abroad than in Norway and the low interest rate differential. Periods of heightened uncertainty in financial markets and a fall in oil prices probably also contributed to the depreciation. After the krone had depreciated through autumn, it appreciated again following the publication of the December 2023 Monetary Policy Report. This is probably attributable to the fact that the policy rate hike in December was not expected in the market and that policy rate expectations abroad had fallen.
Household interest expenses have risen as a result of the policy rate increases. From the time the rise in policy rates began in autumn 2021 and up until the end of 2023, close to 90% of the increase in the policy rate has passed through to mortgage rates. The pass-through from the policy rate to deposit rates has been close to 60%.
As a result of higher interest rates, corporate funding from banks and in the bond market has also gradually become more expensive. Higher risk premiums in the bond market have also pushed up funding costs, particularly for commercial real estate. The benchmark index on the Oslo Stock Exchange was somewhat higher at the end of the year than one year earlier.
Norwegian economy
Activity in the Norwegian economy picked up rapidly after the pandemic and remained high through 2022. Savings made it possible for a large number of households to sustain consumption in spite of high inflation and higher interest rates. Unemployment fell to a low level, and the share of employment rose to the highest level in over 10 years.
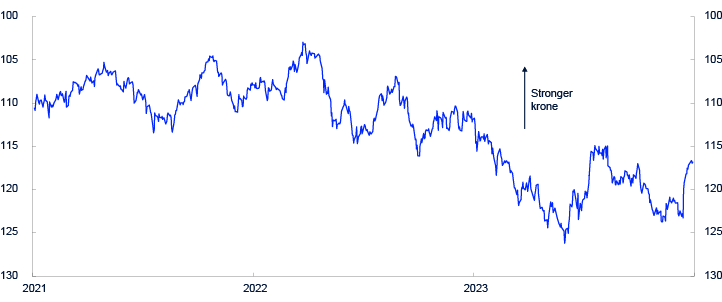
CHART 2 Interest rate differential against Norway’s trading partners. Three-month average. Percent 2014 Q1-2023 Q4
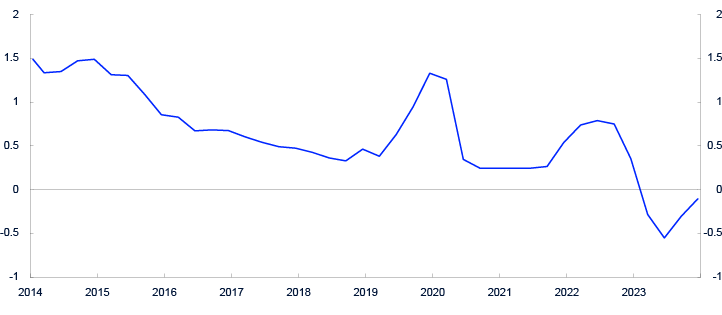
Sources: LSEG datastream and Norges Bank
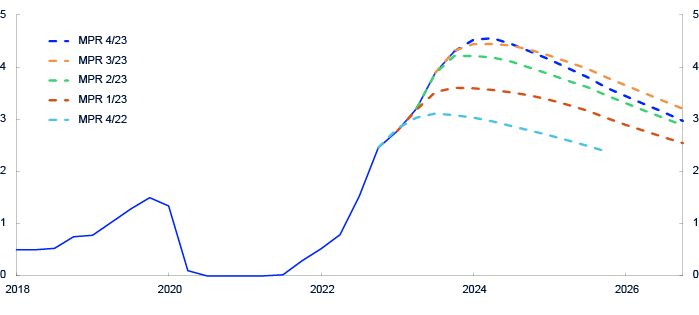
The Norwegian economy seems to have peaked towards the end of 2022. Into 2023, activity remained high, and the labour market was tight. Pressures in the economy gradually subsided, and through autumn it became increasingly evident that the Norwegian economy was cooling down. Growth was low and unemployment had edged up. According to Norges Bank’s Regional Network, recruitment difficulties had eased. In November, enterprises as a whole expected a decline in activity in the next quarter.
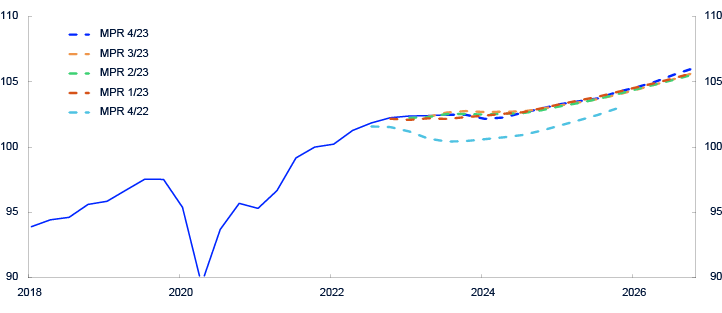
Chart 4 Unemployment. Registered unemployed as a percentage of the labour force. 2018 Q1-2026 Q4
Sources: Norwegian Labour and Welfare Administration (NAV) and Norges Bank
Economic activity was higher than envisaged at the beginning of the year. Household consumption and mainland business investment in particular were higher than expected. High inflation and higher interest expenses nevertheless contributed to a decline in household consumption in 2023. At the same time, housing investment fell considerably more than expected.
There were wide differences across industries, however. Oil service companies experienced strong growth owing to high petroleum investment. The depreciation of the krone improved profitability and resulted in increased activity for export-oriented enterprises. At the same time, lower household demand and weak new home sales contributed to a decline in retail trade and in the construction industry.
While sales of new homes slowed, activity held up better in the secondary housing market. The number of unsold homes rose to a high level, but resale house prices were higher than expected and were 0.5% higher in December than in the same month a year earlier.
The labour market held up better than expected in 2023. Employment continued to rise, and unemployment remained low at year-end. Wage growth rose further and was higher than projected earlier. According to Statistics Norway, annual wage growth was 5.3% in 2023, which is the highest in 15 years. The rise in wage growth reflects high inflation, solid profitability in some business sectors and continued labour market tightness. At year-end, there were prospects of high nominal wage growth in 2024 too, but probably somewhat lower than in 2023.
Consumer prices rose faster than expected through spring, and inflation was markedly above target throughout 2023. The rise in prices must be seen in conjunction with the considerable increase in business costs during recent years. Moreover, continued high demand made it possible to pass on much of the cost increases to selling prices. With rising wage growth and the krone depreciation, there were prospects that inflation would remain above target for some time. While in 2022 the sharpest price rises were primarily confined to energy, food and some other goods, rents and prices for other services increasingly contributed to the rise in prices through 2023.
Lower energy prices dampened the rise in the consumer price index (CPI) through the year. The annual rise in the CPI was 5.5% in 2023, which was slightly lower than the previous year. The consumer price index adjusted for tax changes and excluding energy products (CPI-ATE) rose by 6.2% in 2023, which is the highest annual increase since Statistics Norway began publishing the index in 2001. There was a sharp rise in prices for both imported goods and domestically produced goods and services.
High inflation has likely pushed up inflation expectations in recent years. Norges Bank’s Expectations Survey shows that inflation expectations in the coming years have risen since mid-2021 but declined somewhat again towards the end of 2023. At year-end, long-term inflation expectations were still somewhat above the inflation target of 2%.

Monetary policy trade-offs
The operational target of monetary policy is annual consumer price inflation of close to 2% over time. Inflation targeting shall be forward-looking and flexible so that it can contribute to high and stable output and employment and to countering the build-up of financial imbalances.
In its monetary policy assessments through 2023, the Committee emphasised that inflation was markedly above target. The inflation forecasts were revised upwards, and there were prospects that inflation would remain high for some time. Economic activity was still at a high level, and the labour market was tight. The depreciation of the krone contributed to boosting activity and increasing import prices, which made it more demanding to reduce inflation. The Committee gave weight to the need for higher policy rates to bring inflation down towards the target. The Committee’s assessment was that if monetary policy was not tightened, prices and wages could continue to rise rapidly, and inflation could remain high for a long period. It could then be more costly to bring inflation down again at a later stage. The policy rate was raised both to a further extent and more rapidly than previously projected.
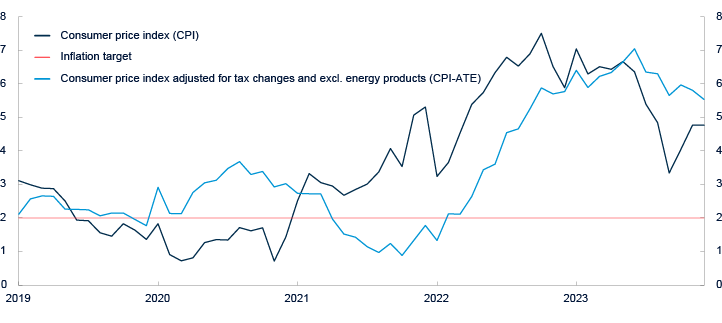
Chart 6 Estimated output gap. Percent. 2018 Q1–2026 Q4.
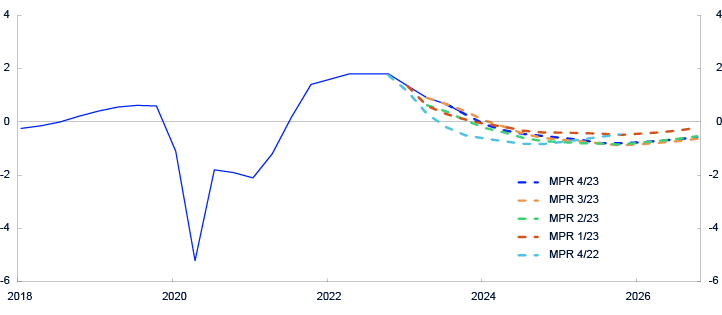
Source: Norges Bank
Consumer price inflation slowed after summer, but still remained markedly above target. At the same time, the Norwegian economy was cooling down. The Committee’s assessment was that monetary policy was having a tightening effect on the economy and that the full effects of previous policy rate increases were yet to be seen. The Committee was concerned with the risk that a too tight stance could contribute to an abrupt slowdown in the Norwegian economy, with a risk of a rapid rise in unemployment. Weight was given to not increasing the policy rate more than needed in order to tackle high inflation. The policy rate was therefore raised more gradually towards the end of the year.
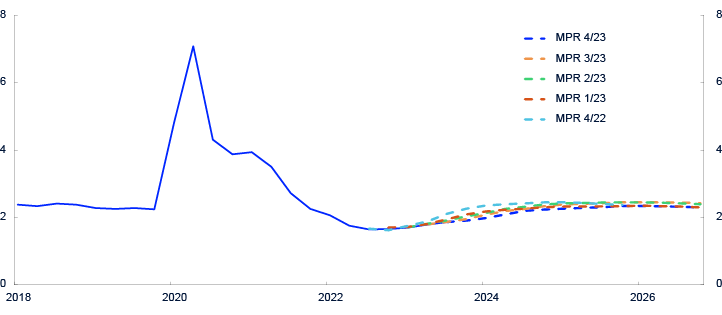
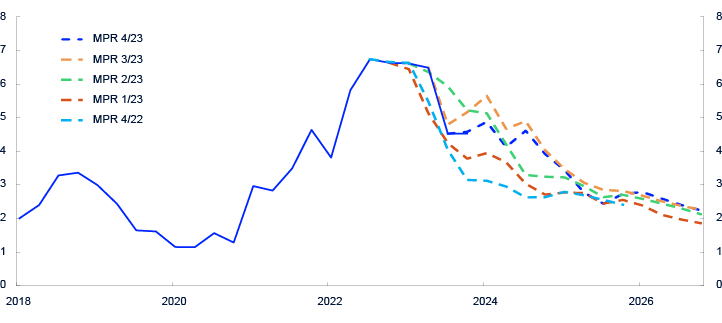
The forecasts in the December 2023 Monetary Policy Report indicated that the policy rate will lie around 4.5% until autumn 2024, before gradually moving down. Economic growth was projected to remain low in 2024, before picking up again. Unemployment was projected to edge up. There were prospects that inflation would recede and approach the target somewhat further out.
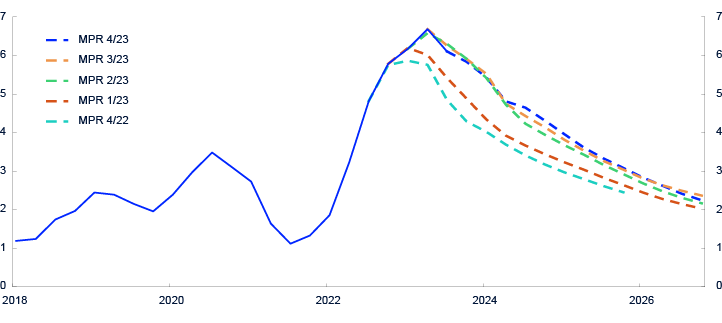
Monetary policy through 2023
The policy rate forecast at the end of 2022 indicated a policy rate rise to around 3% at the beginning of 2023, then remaining at that level during the following year.
The policy rate path was revised upwards through 2023, particularly in the first half-year. As a result of higher-than-projected capacity utilisation and an upward revision of the inflation projection, the policy rate was raised from 2.75% to 3%, and the policy rate forecast was revised upwards at the March monetary policy meeting. The policy rate was raised further to 3.25% at the May meeting. In the period leading up to the June meeting, inflation had been appreciably higher than expected, while higher-than-projected wage growth and a weaker-than-projected krone were expected to push up inflation ahead. The policy rate was raised by 0.5 percentage point to 3.75%, and the policy rate path was revised up further. The Committee raised the policy rate further to 4% at its August meeting and to 4.25% at its September meeting. The prospect that inflation would remain high for somewhat longer than previously projected contributed to a slight upward revision of the policy rate path in September. The policy rate was kept unchanged at the November meeting.
In the period leading up to the December meeting, inflation had been lower than expected, but a weaker-than-projected krone pushed up the inflation forecast. At the December meeting, the policy rate was raised to 4.5%. In the near term, the policy rate path remained relatively unchanged, but was somewhat lower further ahead in the projection period.
Chart 9 Policy rate Projections at different times. Percent. 2018 Q1 – 2026 Q4
Source: Norges Bank
Financial stability and the decision basis for the countercyclical capital buffer and systemic risk buffer
Since September 2021, Norges Bank has had decision-making responsibility for the countercyclical capital buffer and formalised advisory responsibility for banks’ systemic risk buffer. The two buffer requirements account for a substantial portion of banks’ total capital requirements. The Committee decides on the countercyclical capital buffer every quarter and advises on the systemic risk buffer at least every two years. The next time the Committee will issue advice will be in 2024.
The Committee’s assessment in the semi-annual Financial Stability Report was that vulnerabilities in the Norwegian financial system remained relatively unchanged in 2023, but that there was a heightened risk that vulnerabilities could amplify a downturn in the Norwegian economy (see Financial Stability Report 2023 – H2). Many households are heavily indebted and property prices have risen considerably over many years. The buffer requirements ensure that Norwegian banks have satisfactory capital adequacy.
Over the past two years, household debt has grown less than income, and saving during the pandemic contributed to reducing household vulnerabilities. Many households have spent from their savings in the face of high inflation and higher interest rates.
House prices rose slightly in 2023. Turnover in secondary market was close to normal, but the number of unsold homes increased markedly. New home sales are at a low level. House price developments ahead are more uncertain than normal. The risk of a sharp fall in house prices is dampened by low residential construction and low unemployment.
Most households can service their debt in the face of higher policy rates and consumer prices, but indebted households are forced to spend a larger share of their income on interest expenses. A considerable number of households are compelled to reduce consumption. In the event of a sharp tightening of consumption, the result may be losses on corporate loans and an amplified economic downturn owing to tighter bank lending standards. Losses are limited by banks’ relatively low exposure to consumer-exposed industries. Owing to solid capital adequacy and high earnings, banks are well-equipped to absorb higher losses.
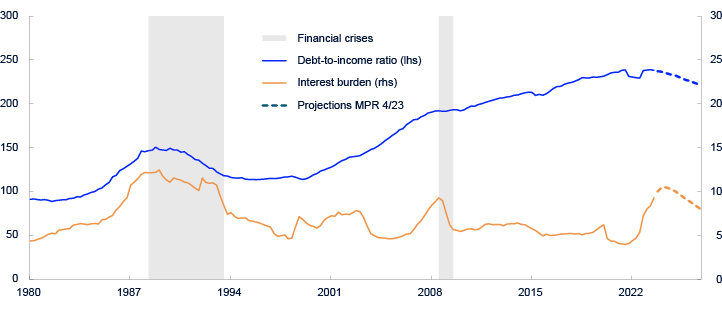
Sources: Statistics Norway and Norges Bank Banks’ large commercial real estate (CRE) exposures are an important financial system vulnerability. During a long period, low policy rates contributed to a sharp rise in commercial real estate prices. Over the past year, prices have fallen, and price developments ahead are more uncertain than normal. CRE companies experience reduced profitability as a result of higher interest expenses, and lower CRE prices weaken their financial strength. This makes refinancing maturing loans more demanding. This may lead to fire sales of property and amplify a fall in property prices.
In spring 2023, problems at some banks in the US and Switzerland led to large movements in financial markets. Norwegian banks remained relatively unaffected, and creditworthy households and firms have had ample access to bank credit. In Norges Bank’s quarterly lending surveys in 2023, banks as a whole reported approximately unchanged credit standards for households and firms through the year, but at the same time some tightening for CRE companies.
The objective of the countercyclical capital buffer is to strengthen banks’ resilience and prevent banks’ credit standards from amplifying an economic downturn. In March 2022, the Committee decided to increase the countercyclical capital buffer rate from 2% to 2.5% with effect from 31 March 2023. The requirement has remained unchanged through 2023. The buffer helps ensure that banks are well equipped to absorb higher losses. The requirement for the systemic risk buffer is 4.5%. The requirement reflects the assessment of structural vulnerabilities such as high household debt, banks’ high commercial real estate exposures and the fact that one bank’s funding is another bank’s liquidity reserves. Banks meet capital and liquidity requirements by a good margin, have solid profitability, and interest margins have increased since the policy rate rise began in 2021. Losses have been low. The interest margin is expected to decline and losses to increase somewhat, but profitability will likely continue to be high.
Norges Bank’s Monetary Policy and Financial Stability Committee
Oslo, 24 January 2024
Ida Wolden Bache (sign.)
Governor / Chair of the Executive Board
Pål Longva (sign.)
First Deputy Chair
Øystein Børsum (sign.)
Second Deputy Chair
Ingvild Almås (sign.)
Steinar Holden (sign.)

Sustainable development and a transition to net-zero emissions are important for society and the economy, and are of importance to us as a central bank and manager of the Government Pension Fund Global (GPFG), as well as an employer and workplace. Norges Bank has drawn up a sustainability strategy, which includes our objectives for our work on climate and the environment, society and social conditions, corporate governance, ethics and culture.
This section provides an overview of Norges Bank’s work with key sustainability topics. Among other things, it discusses what the Bank does to ensure a sound working environment and promote diversity and gender equality and describes the Bank’s work on climate risk and climate impact.

Sustainability strategy
Norges Bank’s sustainability strategy is divided into three main areas with specified objectives for each area. The full strategy is published on Norges Bank’s website.
Climate and the environment
- Norges Bank is committed to working to reduce emissions from its own operations in line with the ambitions of the Paris Agreement.
- Norges Bank will be an active owner and a driving force for investee companies to achieve net zero emissions by 2050.
- Norges Bank will increase its understanding of the impact of climate change and energy transition.
Society and social conditions
- Norges Bank will promote a culture of diversity, inclusion and equal opportunities.
- Norges Bank will promote professional development so that staff enjoy their work, are challenged and gain the skills necessary to meet new challenges.
- Norges Bank will promote human and workers’ rights through responsible investment and in its procurement processes.
Corporate governance, ethics and culture
- Norges Bank will enable its employees and partners to make sustainable choices.
- Norges Bank will report on its sustainability work in line with best practice.
- Norges Bank will support the development of standards for well-functioning markets, good corporate governance and responsible business practices
Our employees

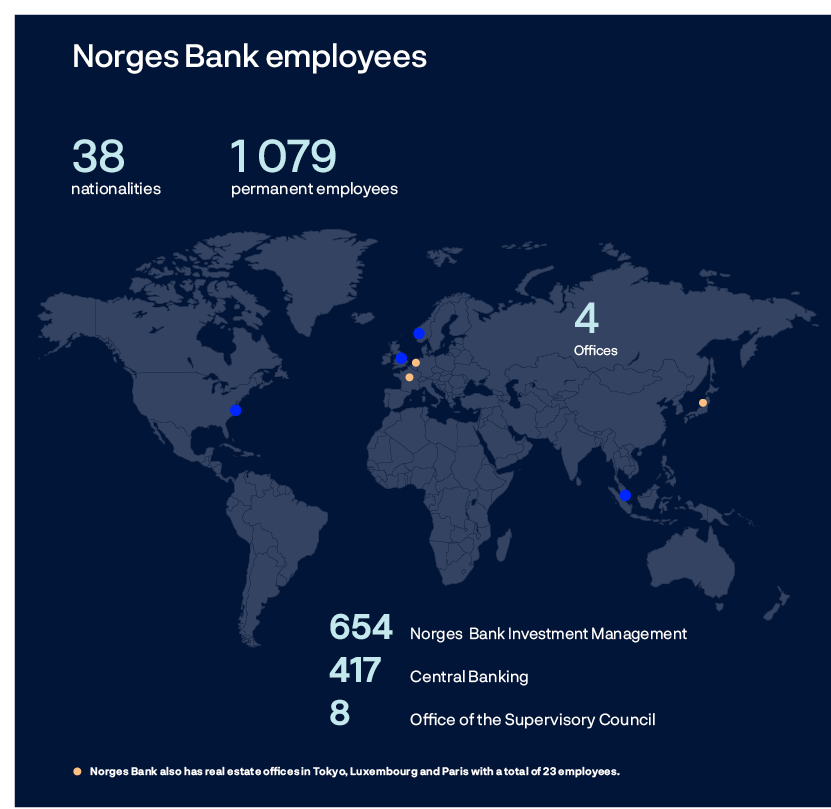
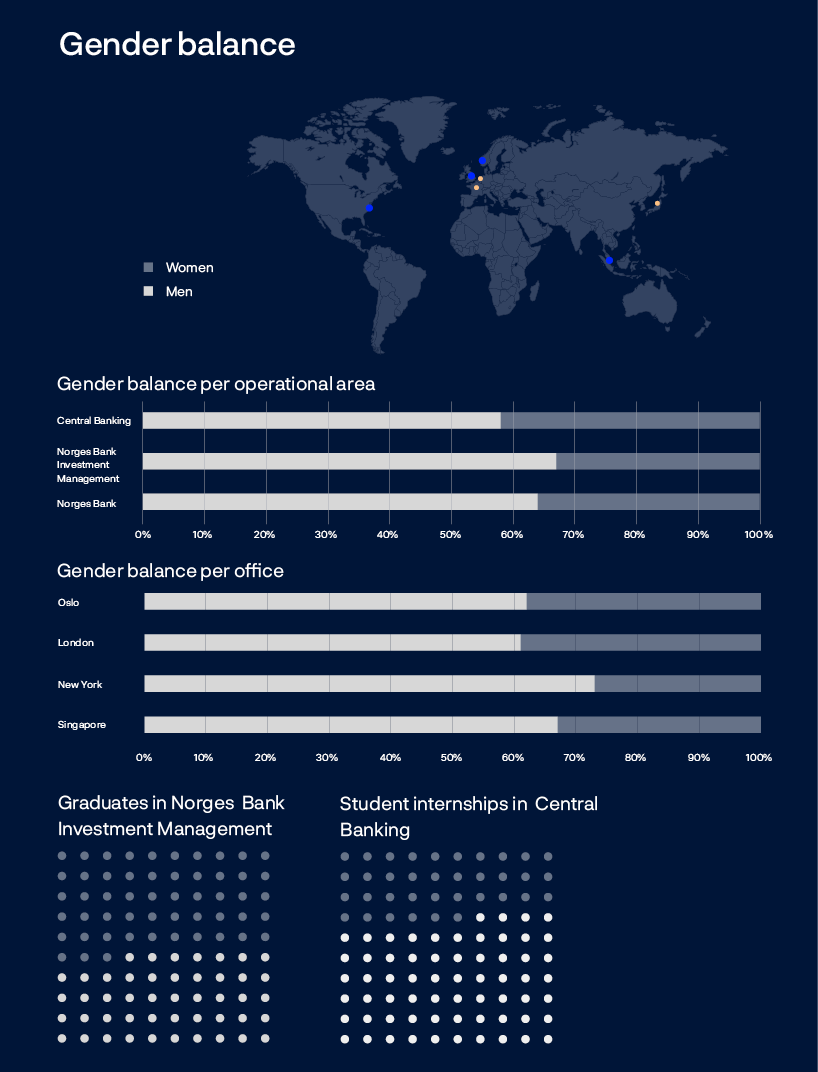
Norges Bank’s employees are the Bank’s most important resource. At the end of 2023, Norges Bank had 1 079 permanent employees. Of these, 654 were employed in Norges Bank Investment Management, 417 in Central Banking and 8 in the Office of the Supervisory Council.
Norges Bank is a global organisation with 25% of its employees at offices in London, New York and Singapore. In addition, the Bank has real estate offices in Paris, Luxembourg and Tokyo. Norges Bank has employees representing 38 different nationalities, 12 in Central Banking and 37 in Norges Bank Investment Management.
Attractive and future-fit workplace
Norges Bank promotes the well-being of all employees so that they are challenged and have the expertise to fulfil the Bank’s mission. Norges Bank’s employees are the Bank’s most important resource, which is why the Bank must attract, develop and retain skilled and engaged employees. A sound and safe working environment must be standard for all the Bank’s employees and others who work in the Bank. The Bank has facilitated a flexible working arrangement with the opportunity to work outside the office.
On an annual basis, the Bank conducts a comprehensive staff survey that also measures and assesses employee engagement, well-being and effectiveness. The survey is an important tool in the Bank’s work to develop its employees, organisation and workplace. Survey results are discussed by the Executive Board, management groups and various working committees, and measures are implemented based on management and individual team discussions.
Compared with other organisations across the Norwegian labour market, Norges Bank has a higher average score in all comparable areas. The working environment is generally seen as supportive and appreciative. In 2023, the areas of work-life balance, autonomy and personal development opportunities have shown improvements.
To ensure sound employment relationships, active cooperation between management and employee representatives has been established through the Working Environment Committee and the Bank’s safety representatives.
In the assessment of Norges Bank’s operations, nothing was identified that would suggest a risk of, or grounds to assume the occurrence of, violations of either fundamental human rights or decent working conditions at the Bank.
Pages 52 to 63 describe Norges Bank’s work on equality and anti-discrimination, in accordance with Norway’s activity duty and the duty to issue a statement.
Diversity and inclusion
The Executive Board has laid down HR principles at Norges Bank. These include work on equity, anti-discrimination, diversity and inclusion. Under the Bank’s ethical rules there is zero tolerance for discrimination, harassment or bullying. Norges Bank sets clear requirements and expectations that employees must be treated with respect and strives to maintain a culture where it is viewed as positive to report wrongdoing and unacceptable conditions. The Bank’s ambitions for the working environment are set in its work on strategy and action plans.

Norges Bank aims to be recognised as a leading institution in its fields of expertise and believes that increased diversity and inclusion are beneficial. Diversity adds perspectives, stimulates creativity and improves decision-making. The Bank seeks to safeguard diversity and inclusion in its processes to recruit, develop and retain employees and managers. When recruiting, the Bank starts with the department’s overall needs and discusses how the recruitment process can be designed to complement team diversity. Salary discussions, development and succession planning are seen in context to safeguard both equal rights and equal opportunities for promotion to senior and management roles.
Norges Bank’s annual staff survey measures employee engagement and underlying factors such as leadership and collaborative culture. The 2023 survey showed that women and men experience equal opportunities for development in their roles.
The share of employees reporting bullying and harassment in the staff survey is low and, in some units, lower compared with 2022.
Gender balance and distribution
Norges Bank is committed to the Women in Finance Charter and its ambition of increasing the share of women in financial institutions, particularly in management and specialist positions. This is done by setting specific targets, management accountability and systematic work in HR processes such as recruitment, advancement and succession planning. Through the development of various HR data, staff surveys, performance appraisals and HSE work, the Bank also works systematically to identify the risk of discrimination or other obstacles to gender equality.
At the end of 2023, 393 women and 686 men were employed in Norges Bank, ie a 36% share of women, which is an increase from 35% in 2022 and 34% in 2021. The share of women in Norges Bank Investment Management was 33% in 2023, an increase from 29% in 2022 and 27% in 2021. In Central Banking, the share of women was 42% in 2023, a reduction from 43% in 2022 and 44% in 2021. The relocation of employees from one operational area to another, in connection with reorganisation, largely explains the internal changes between 2022 and 2023.
Table 2 Share of women and men by job category at Norges Bank’s head office in Oslo
|
Job category |
2023 |
2022 |
2021 |
|||
|
Share of men |
Share of women |
Share of men |
Share of women |
Share of men |
Share of women |
|
|
Executive director |
58% |
42% |
88% |
12% |
80% |
20% |
|
Head of department |
76% |
24% |
75% |
25% |
76% |
24% |
|
Head of section |
64% |
36% |
62% |
38% |
68% |
32% |
|
Chief analyst1 |
100% |
0% |
100% |
0% |
- |
- |
|
Special advisor |
75% |
25% |
72% |
28% |
71% |
29% |
|
Senior advisor |
57% |
43% |
61% |
39% |
65% |
35% |
|
Advisor |
56% |
44% |
50% |
50% |
51% |
49% |
|
Analyst1 |
51% |
49% |
65% |
35% |
- |
- |
|
Consultant |
56% |
44% |
56% |
44% |
47% |
53% |
|
Support staff |
0% |
100% |
0% |
100% |
0% |
100% |
1 In 2022, the job categories analyst and chief analyst were established in the framework for job categories across Central Banking and Norges Bank Investment Management. Previously, these were included in the categories advisor and special advisor, which will therefore entail a change to the job category sample for 2022.

The gender balance within certain job categories reflects current labour market challenges. Fewer women than men apply for management positions and for positions in the financial and IT sector in general. At the end of 2023, the gender balance was in line with a target of at least 40% in most of the job categories below management level. Developments at management level are positive and in line with the target for Executive Directors. For other management and specialist categories, the target has not been reached.
Table 3 Share of women in executive and specialist positions1
|
Job category |
2023 |
2022 |
||
|
Share of men |
Share of women |
Share of men |
Share of women |
|
|
Executives in Norges Bank overall |
70% |
30% |
72% |
28% |
|
Executives in Central Banking |
67% |
33% |
67% |
33% |
|
Executives in Norges Bank Investment Management |
72% |
28% |
77% |
23% |
|
Specialists in Norges Bank overall |
77% |
23% |
76% |
24% |
|
Specialists in Central Banking |
73% |
27% |
69% |
31% |
|
Specialists in Norges Bank Investment Management |
80% |
20% |
80% |
20% |
1 Specialists include chief analysts and special advisors
Under Strategy 25, the Bank will continue to pursue and intensify its efforts to promote diversity and inclusion by also implementing further measures to improve gender balance. In its efforts to achieve the gender balance target of at least 40%, both overall in the Bank and among executives and specialists, Norges Bank works to highlight female employees in the Bank as role models in various arenas. In addition, women across the organisation are encouraged to apply for senior positions internally. In the period ahead, the Bank will make dedicated efforts to ensure that recruitment and promotion processes, development activities and succession plans provide candidates and employees with equal opportunities.
Part-time and temporary employees
Most employees at Norges Bank are employed on full-time contracts. Involuntary part-time work is therefore not considered a challenge. The majority of temporary employment contracts at Norges Bank are related to research and some hourly paid work.
Table 4 Share of temporary and part-time employees at Norges Bank’s head office in Oslo
|
Men |
Women |
|
|
Share of temporary employees |
1.30% |
1.20% |
|
Share of part-time employees |
0.30% |
0.80% |
Recruitment
Norges Bank works systematically to attract and recruit the best candidates from among the foremost national and international professionals. Variation in experience and perspectives is desirable, and to increase diversity in the organisation, the Bank recruits across nationality, gender, age, background, knowledge and skills.

Through Norges Bank’s Knowledge Centre, corporate presentations and lectures at schools and universities, the Bank works to increase students’ and pupils’ knowledge of the Bank. Through the Norges Bank Teaching Initiative and NBIM Teach, Bank staff offer lectures on economics, finance and technology at universities. The Bank also organises an annual nationwide case competition for students. Both Central Banking and Norges Bank Investment Management offer part-time student internships. An important focus area in Norges Bank Investment Management to attract young talent is summer trainee positions for students and the graduate programme.
There has been a significant increase in the applicant pool in the period between 2022 and 2023, reflecting increased focus on recruitment efforts, more targeted recruitment communication and a looser labour market.
In Central Banking, the gender distribution among applicants in 2023 was 65% men and 35% women, with 56% men and 44% women employed. The corresponding figures for Norges Bank Investment Management were 66% men and 23% women among applicants (11% did not wish to disclose their gender), with 61% men and 39% women employed.
Management and employee development
Expectations of Norges Bank’s leadership role are clarified through the introduction of management principles. Managers must promote employees and build common culture through regular follow-up and targeted, inclusive and supportive management. The management principles are highlighted at management meetings and training sessions throughout the year.
As a supplement to the management principles, Norges Bank Investment Management has launched employee expectations, thereby adopting a holistic approach to manager and employee interaction.
Offering managers and employees development opportunities is an important part of retaining motivated and engaged employees. The Bank has updated development processes to facilitate positive discussions on individual and team development.

The Bank regularly works on skills development. In 2023, the Bank, among other things, held courses on energy transition, dissemination and various forms of data analysis. Through access to an online course platform, employees gain access to thousands of courses from leading universities. Employees can also apply for residency and further training at other academic institutions.
Through temporary internships in other units, the Bank facilitates for employees to gain experience across operational areas and increase understanding across disciplines. Employees may also apply for residency at other central banks and other relevant institutions.
In 2023, Norges Bank Investment Management introduced a career framework with a professional development path. This means that all of Norges Bank has a career framework with a career ladder that describes responsibilities at various levels, so that steps to achieve career progression are clear.
The Bank works with succession planning to provide opportunities for internal candidates and to avoid vulnerabilities related to critical positions and expertise. In the period ahead, the Bank will ensure that development and succession planning are safeguarded holistically and strategically across departments, in order to safeguard diversity, development opportunities and gender balance in senior and management roles.
The Bank facilitates a gradual transition to retirement when desired. Through the retiree consultant scheme, an experienced workforce can be retained and the Bank can help employees participate in working life even after the transition to retirement.
Salaries and salary differences
The Executive Board sets the framework for Norges Bank’s remuneration schemes and monitors how they are put into practice. Salary levels are to be competitive, but not market-leading. Salary determination is individual and reflects the responsibilities of the position, competence, experience and achievements of the position holder.
The remuneration system in investment management follows, with necessary adjustments, the requirements of the regulation pursuant to the Act on Securities Funds in line with the mandate for the management of the GPFG laid down by the Ministry of Finance. The Remuneration Committee of the Executive Board contributes to thorough and independent consideration of matters relating to Norges Bank’s remuneration schemes. In addition, Internal Audit at Norges Bank provides an independent opinion on compliance with the rules and guidelines for remuneration. A review in 2023 confirmed that the 2022 salary system had been practised in line with regulations. There have been no significant changes to the scheme in 2023.
See also Note 15 to the annual financial statements for further information on the payroll system and benefits to senior executives and governing bodies.
For the Bank as a whole, women’s salary as a share of men’s average fixed salary is 78%. At the Oslo office, this share is 86%. Broken down between Central Banking and Norges Bank Investment Management, the share is 86% and 88%, respectively. For all Norges Bank Investment Management employees, including the offices abroad, the share is 79%.
Tables 5-8 show the Bank’s survey of wage differences, fixed salaries and remuneration paid at the head office in Oslo. Job categories are based on management levels in the Bank and the job structure for employees in the Bank’s agreements. Total remuneration includes fixed salary, performance pay and paid overtime. All employees working on investment decisions are eligible for performance pay. Figures for fixed salaries and remuneration paid are rounded to the nearest NOK 1000.
The tables highlight variation in the wage gap within some job categories. The Bank works systematically to ensure that remuneration is in line with the principle of equal pay for positions with an equal degree of responsibility and complexity, and regularly analyses salary and salary developments among employees to ensure fair wage practices. The analysis compares compensation for comparable roles, at the same level and the same location. Any deviations at the individual or group level are investigated further to ensure that gender-neutral criteria are applied.
Salary differences between women and men in Central Banking are most pronounced in lower job categories. The differences reflect the uneven gender distribution within different fields of expertise. In some areas of expertise where men dominate, salary levels are higher owing to market conditions. The substantial differences in remuneration paid reflect a preponderance of men in certain fields of expertise involving tasks that require more overtime.
In Norges Bank Investment Management, differences in salary between men and women reflect a preponderance of men in positions involving investment decisions. Positions with investment responsibility generally offer higher salaries in the market compared with positions at the same level in other fields of expertise.
For both operational areas, the preponderance of men in higher positions contributes to the difference between men and women in the figures for total pay. The Bank’s work to improve gender balance among managers and specialists will contribute to reducing salary differences.
Table 5 Fixed salaries by job category in Central Banking
|
Central Banking |
Number of employees |
Median fixed salary |
Wage gap – women’s pay as a percentage of men’s pay |
Average fixed salary |
Wage gap – women’s pay as a percentage of men’s pay |
|||
|
Men |
Women |
Men |
Women |
Men |
Women |
|||
|
Head of department |
19 |
10 |
1 628 000 |
1 585 000 |
97% |
1 684 000 |
1 615 000 |
96% |
|
Head of section |
17 |
9 |
1 235 000 |
1 251 000 |
101% |
1 278 000 |
1 319 000 |
103% |
|
Special advisor |
80 |
32 |
1 247 000 |
1 228 000 |
98% |
1 277 000 |
1 229 000 |
96% |
|
Senior advisor |
72 |
68 |
982 000 |
940 000 |
96% |
997 000 |
965 000 |
97% |
|
Advisor |
19 |
28 |
835 000 |
772 000 |
93% |
813 000 |
785 000 |
97% |
|
Analyst |
8 |
9 |
635 000 |
626 000 |
99% |
642 000 |
629 000 |
98% |
|
Consultant |
14 |
11 |
781 000 |
710 000 |
91% |
786 000 |
666 000 |
85% |
Table 6 Total remuneration by job category in Central Banking
|
Central Banking |
Number of employees |
Median fixed salary |
Wage gap – women’s pay as a percentage of men’s pay |
Average fixed salary |
Wage gap – women’s pay as a percentage of men’s pay |
|||
|
Men |
Women |
Men |
Women |
Men |
Women |
|||
|
Head of department |
19 |
10 |
1 633 000 |
1 585 000 |
97% |
1 710 000 |
1 615 000 |
94% |
|
Head of section |
17 |
9 |
1 235 000 |
1 251 000 |
101% |
1 290 000 |
1 319 000 |
102% |
|
Special advisor |
80 |
32 |
1 274 000 |
1 303 000 |
102% |
1 307 000 |
1 293 000 |
99% |
|
Senior advisor |
72 |
68 |
1 016 000 |
970 000 |
95% |
1 033 000 |
994 000 |
96% |
|
Advisor |
19 |
28 |
850 000 |
797 000 |
94% |
888 000 |
799 000 |
90% |
|
Analyst |
8 |
9 |
655 000 |
640 000 |
98% |
659 000 |
641 000 |
97% |
|
Consultant |
14 |
11 |
863 000 |
713 000 |
83% |
872 000 |
677 000 |
78% |
Table 7 Fixed salaries by job category in Norges Bank Investment Management
|
Norges Bank Investment Management |
Number of employees |
Median fixed salary |
Wage gap – women’s pay as a percentage of men’s pay |
Average fixed salary |
Wage gap – women’s pay as a percentage of men’s pay |
|||
|
Men |
Women |
Men |
Women |
Men |
Women |
|||
|
Head of section |
25 |
15 |
1 540 000 |
1 540 000 |
100% |
1 614 000 |
1 560 000 |
97% |
|
Special advisor |
64 |
17 |
1 383 000 |
1 370 000 |
99% |
1 456 000 |
1 376 000 |
95% |
|
Senior advisor |
84 |
49 |
1 055 000 |
1 050 000 |
100% |
1 077 000 |
1 090 000 |
101% |
|
Advisor |
48 |
24 |
818 000 |
808 000 |
99% |
837 000 |
807 000 |
96% |
|
Analyst |
16 |
14 |
638 000 |
625 000 |
98% |
642 000 |
640 000 |
100% |
Table 8 Total remuneration by job category in Norges Bank Investment Management
|
Norges Bank Investment Management |
Number of employees |
Median fixed salary |
Wage gap – women’s pay as a percentage of men’s pay |
Average fixed salary |
Wage gap – women’s pay as a percentage of men’s pay |
|||
|
Men |
Women |
Men |
Women |
Men |
Women |
|||
|
Head of section |
25 |
15 |
1 700 000 |
1 572 000 |
92% |
1 732 000 |
1 608 000 |
93% |
|
Special advisor |
64 |
17 |
1 625 000 |
1 450 000 |
89% |
1 785 000 |
1 504 000 |
84% |
|
Senior advisor |
84 |
49 |
1 108 000 |
1 130 000 |
102% |
1 176 000 |
1 137 000 |
97% |
|
Advisor |
48 |
24 |
838 000 |
818 000 |
98% |
859 000 |
835 000 |
97% |
|
Analyst |
16 |
14 |
643 000 |
643 000 |
100% |
645 000 |
647 000 |
100% |
For privacy reasons, there must be at least five of each gender per job category to be able to publish pay data. For certain job categories or for the offices abroad, it is therefore not possible to show the results of the survey.
Health, safety and the environment
In the annual staff survey, incidents related to discrimination and undesirable behaviour are also identified. The survey covers both the physical and psychosocial working environment. Overall, the results of the survey show that our employees enjoy working at Norges Bank.
In 2023, Norges Bank continued its efforts to promote a positive psychosocial working environment. Several initiatives throughout the year have focused on how managers and employees ensure a positive working environment and the significance of psychological safety and communicative openness in the working environment.
Norges Bank works closely with the occupational health service and has continued to develop the Bank’s systematic HSE work in 2023. In order to reduce the risk of musculoskeletal disorders, the occupational health service has contributed with ergonomic adaptation of the workplace in both the office and the home office. The Bank has good training facilities and has provided facilities to enable employees to cycle to work. In the ongoing work to upgrade the head office, emphasis is placed on improving the indoor climate.
The safety representative service, with safety representatives and chief safety representatives, does an important job of safeguarding employees’ interests in working environment matters. They are consulted during the planning and follow-up of working environment measures. Management effectively cooperates with the safety representative service and the Working Environment Committee, with a strong mutual commitment to safeguarding the systematic HSE work.
Sickness absence in Norges Bank is stable at a low level and was 2.1% in 2023, down from 2.3% in 2022. The Inclusive Working Life Agreement (IA agreement) now covers all areas of the Norwegian labour market, and the Bank works systematically to prevent sickness absence. The practice of additional self-certification days for employees has been retained, in line with the intentions of the IA agreement.
In 2023, 11 HSE-related incidents related directly to work in the Bank’s office premises, courses or conference centre were reported. No injuries or accidents have been sufficiently severe to require reporting to the Labour Inspection Authority.
Table 9 Parental leave1 of head office employees in Oslo
|
Men |
Women |
|
|
Average number of weeks of parental leave |
7.8 |
15.4 |
1 Number of weeks taken out in the calendar year and not the number of weeks the employee has taken out in total.
Norges Bank offers fully paid gender-neutral parental leave of 16 weeks in addition to 10 weeks of maternity leave for employees at all the Bank’s offices abroad.
Cooperation with trade unions
The relationship between the Bank’s management, the employees and their representatives is based on dialogue, trust and mutual respect. The Bank’s management maintains close contact with the trade unions, for example in employee and personnel committees, in the Working Environment Committee and in regular contact meetings with trade union representatives at several levels in the Bank. The employees have two representatives on the Executive Board who are involved in dealing with administrative matters.
Rules on ethics and personal trading
The Executive Board’s ethical principles state that Norges Bank shall maintain high ethical standards, respect human rights, act in a socially responsible manner and comply with applicable laws and regulations. The rules cover, inter alia, employees’ personal trading, handling of conflicts of interest, gifts and loyalty to the bank in general. In autumn 2023, the Executive Board updated the ethical principles that apply to all employees. The Governor of Norges Bank and the CEO of Norges Bank Investment Management regularly update supplementary rules adapted to the different tasks and risk of conflicts of interest in Norges Bank’s two operational areas.
The Ministry of Finance has adopted separate rules on impartiality for members of Norges Bank’s Executive Board and members of the Monetary Policy and Financial Stability Committee. This impartiality policy was updated with effect from 1 April 2023. As a supplement, the Executive Board has adopted separate rules on conflicts of interest and restrictions on personal trading for the external members of these two bodies. These regulations were also updated in 2023.
Norges Bank has zero tolerance for all forms of corruption. A framework and programme to counteract corruption has been established, which includes management support, risk management, ethical rules, processing of whistleblower reports, procurement procedures, background checks of employees and suppliers, financial reporting and systematic training and controls. In 2023, special training was conducted in the handling of conflicts of interest and anti-corruption measures for all employees of Norges Bank Investment Management. There were no known incidents related to corruption in 2023.
Considerable emphasis is placed on training and raising awareness of the most important risk areas. Measures include introductory courses, one-on-one training, annual tests and confirmation from all employees that they have reviewed the ethical rules. Employees are obliged to report on various matters related to the ethical rules, and all reporting is continuously checked by the compliance functions.
The Executive Board has laid down principles for internal whistleblowing on misconduct at Norges Bank. There are whistleblowing routines where employees and employees of suppliers can report anonymously about unethical or illegal behaviour. All reports must be treated in a proper manner, in accordance with external and internal whistleblowing requirements, and without the risk of retaliation against the whistleblower. In 2023, three whistleblowing cases were reported.
Responsible investment management of the Government Pension Fund Global
Work on climate risk in the Government Pension Fund Global
Climate risk management is an integral part of the responsible investment management of the Government Pension Fund Global (GPFG). The 2025 Climate action plan describes the Bank’s work on managing climate risk and the measures we plan to implement during the period 2022-2025. The purpose of this work is to improve market standards, including frameworks for climate reporting, increase the portfolio’s resilience to climate risk, and implement a targeted active ownership.
The core of this work is active ownership to drive investee companies towards net zero emissions by 2050, and for them to set credible targets and plans for reducing their direct and indirect greenhouse gas emissions (scopes 1, 2 and 3). By the end of 2023, 27% of the investee companies had set 2050 net zero targets based on recognised standards such as the Science Based Targets initiative (SBTi) or similar initiatives. If weighted according to emissions, such targets cover about 68% of the fund's investee companies' emissions (scopes 1 and 2).
The 2025 Climate action plan also aims for more disclosures on climate risk in the portfolio. The disclosures will be developed in line with leading international standards and are included in the GPFG’s overall reporting on responsible investment. Among other things, a separate overview of climate risk is presented, which follows the recommendations of the Task Force on Climate-related Financial Disclosures (TCFD). Analyses and stress tests against various climate scenarios are presented, including a scenario consistent with global warming of 1.5 degrees Celsius. The methods for such analyses are still evolving and do not provide a basis for ranking direct financial outcomes of various climate scenarios. The stress tests nevertheless illustrate the potential effects of climate change on future risks and returns.
Indicators for measuring climate risk
In accordance with the Greenhouse Gas (GHG) Protocol, emission measures are divided into three scopes, depending on how closely related they are to the process or activity:
Scope 1 comprises all direct GHG emissions
Scope 2 comprises all indirect GHG emissions from purchased electricity
Scope 3 comprises other indirect emissions
Carbon intensity
Carbon intensity is an indicator for calculating the GHG emission intensity of a process, activity, service rendered or a portfolio of financial assets. Carbon intensity is used by asset managers to express the carbon footprint of investment portfolios, as recommended by the Task Force on Climate-related Financial Disclosures (TCFD). In manufacturing, carbon intensity is expressed in tonnes of CO2 equivalent per unit of output (kg, litre, kwh). In equity management, carbon intensity is used to understand the volume of emissions related to earnings of investee companies. Norges Bank reports annually on the carbon intensity of the GPFG’s equity and corporate bond portfolio and the equity portfolio of the foreign exchange reserves, for scopes 1 and 2.
Financed GHG emissions
Financed GHG emissions are an alternative indicator originating from the Partnership for Carbon Accounting Financials (PCAF) and their guidelines on how financial institutions should report carbon emissions across asset classes. Norges Bank Investment Management became a formal member of PCAF in 2023. Financed emissions are calculated by multiplying a company’s total emissions by the investor’s financed share of the company’s value, including both equity capital and debt. Norges Bank reports annually on the financed emissions of the GPFG’s equity and corporate bond portfolio and the equity portfolio of the foreign exchange reserves, for scopes 1, 2 and 3.
Norges Bank has measured and published the carbon footprint of investee companies in the equity portfolio and benchmark index since 2014, based on reported and modelled data for scope 1 and 2 emissions. This year we have also provided an estimate for the equity portfolio’s financed scope 3 emissions. Although they are subject to uncertainty, carbon footprint analyses provide insight into the extent of greenhouse gas emissions of investee companies in which the GPFG is invested. The analysis can also provide insight into risks and opportunities across industries. There are still many companies that do not report their emission data or whose reporting still varies in frequency and quality. Large parts of the GPFG’s carbon footprint have therefore been calculated using models.
Norges Bank’s reporting of the GPFG’s financed emissions is in line with guidance from PCAF. The GPFG’s financed emissions for scopes 1 and 2, were 59 million tonnes of CO2 equivalent in 2023, which is 12% lower than the corresponding figure for the benchmark index. The financed emissions for scope 3 are estimated at 61 million tonnes of CO2 equivalent, which is 8% lower than the benchmark index. This is based on an estimation model that the Bank has reason to believe underestimates actual scope 3 emissions. The Bank has used a single source for reported and estimated emission data, as recommended by the PCAF.
Investee companies in the GPFG’s equity portfolio emitted 104 tonnes of CO2 equivalent per million USD in revenue, based on data reported or estimated in 2023. This is referred to as the equity portfolio’s carbon intensity in 2023, 8% lower than that of the benchmark index, and 23% lower than in 2022. For corporate bonds, the portfolio’s carbon intensity was 124 tonnes of CO2 equivalent per million USD in revenue, which is 2% higher than the carbon intensity of the benchmark index, and 7% lower than in 2022. The change since 2022 partly reflects increases in the revenues of emission-intensive companies owing to energy and commodity price developments.
The Bank’s understanding of the effects of climate change on the global economy and financial markets will develop in the future. At the same time, governments will introduce new regulations, new technological advances will be seen, consumer preferences will change, and companies will adapt their strategies accordingly. These developments will affect the GPFG’s climate risk. Given the GPFG’s mandate and investment strategy, the GPFG’s climate risk will primarily depend on government measures that ensure an orderly and predictable climate transition, and on companies achieving their net zero targets.
Work on climate risk in real estate management in the Government Pension Fund Global
We consider climate change in our real estate investments. The Bank’s real estate portfolio is exposed to both physical climate risk, such as extreme weather, gradually rising sea levels and flooding, and transition risk, such as a statutory reduction of energy consumption or lower demand for buildings with high emissions. A growing number of tenants are setting targets for net zero emissions for their own businesses, and therefore prefer energy efficient buildings powered by renewable energy sources. The 2025 Climate action plan sets targets for net zero emissions by 2050 for the real estate portfolio and reduced operational carbon emissions intensity (scopes 1 and 2) by 40% by 2030. In order to achieve these targets, the Bank will work to reduce emissions linked to the real estate portfolio and integrate climate risk assessments into investment processes.

The Bank measures progress towards the net zero target in the real estate portfolio using emission pathways consistent with global warming of 1.5 degrees Celsius for various real estate markets, developed by the Carbon Risk Real Estate Monitor (CRREM). By the end of 2022, 41% of the unlisted real estate portfolio by value was aligned with the CRREM decarbonisation pathway. The portfolio is also measured against the Global Real Estate Sustainability Benchmark (GRESB). In 2023, the real estate portfolio achieved a total point score of 83 out of 100. This is 7 percentage points higher than the score of comparable investment portfolios that report to GRESB.
Further information on the work on climate risk in the GPFG is presented in the report Responsible investment Government Pension Fund Global and the publication on climate risk on Norges Bank Investment Management website.
Responsible investment management of the Government Pension Fund Global
The Executive Board has laid down principles for responsible investment management in Norges Bank. The principles are based on international principles and guidelines for sound corporate governance and responsible business conduct from the United Nations (UN) and the Organization for Economic Co-operation and Development (OECD). The objective for the management of the GPFG is to achieve the highest possible return with acceptable risk. Responsible investment supports the GPFG’s objective in two ways. First, by promoting long-term value creation in investments. Second, by reducing the financial risk associated with environmental and social conditions in companies. Separate due diligence assessments are conducted, seeking to identify and manage investments with a risk of negative impact on people and the environment.
The GPFG’s mission is to safeguard and develop financial assets for future generations. The management mandate states that work on responsible investment shall be integrated into the management of the GPFG. Long-term returns depend on sustainable growth, well-functioning and legitimate markets and sound corporate governance. Work on responsible investment can be divided into three main areas: the market, the portfolio and the companies.

Market
The GPFG is a global fund. It owns a small portion of over 8 800 listed companies in 72 countries and benefits from global solutions to address common challenges such as climate change. Norges Bank contributes to the development of relevant international standards, and is, for example, represented by the Vice-Chair of the International Sustainability Standards Board (ISSB)’s Investor Advisory Group (IIAG). In 2023, Norges Bank participated in 27 public consultations related to responsible investment. All consultation responses are published on Norges Bank Investment Management’s website. The consultations addressed important issues such as corporate reporting, corporate governance and responsible business conduct.
Norges Bank supports selected initiatives in which several companies or investors join forces to find common standards for sustainable business. Such initiatives are particularly appropriate when several companies in one industry or value chain face the same challenge. Norges Bank currently participates in a number of different collaborations with investors, companies and civil society.
Norges Bank participates, within the scope of its management mandate, in initiatives that do not impose constraints on its voting or investment decisions, or primarily target political authorities. Norges Bank makes thorough assessments of cost, complexity and benefit before it launches or enters into an initiative.
Since 2008, Norges Bank has formulated clear expectations for how investee companies should address relevant sustainability challenges linked to their operations, and emphasised that their boards should establish appropriate strategies, control functions and reporting procedures. The expectations form the basis for dialogue with investee companies and the investee companies’ work is measured against these expectations on an annual basis. In 2023, Norges Bank presented new expectations concerning investee companies’ management of consumer interests. During the year, Norges Bank’s expectations of how investee companies address challenges and opportunities related to climate change, biodiversity and ecosystem services, as well as tax and transparency, were updated. The Bank has also presented its positions on different corporate governance issues in order to enhance corporate governance and protect stakeholder interests.
Portfolio
Norges Bank assesses corporate governance and sustainability to gain a better understanding of risks and opportunities associated with investments. The GPFG monitors how the portfolio is exposed to risks and identifies industries and companies for further follow-up. To carry out these analyses, relevant, comparable and reliable data on environmental, social and governance issues must be available. Norges Bank therefore encourages investee companies to move from words to numbers in their reporting to provide a better understanding of financial opportunities and risks.
Norges Bank uses four main approaches to identify and manage risks associated with environmental, social and governance conditions in the portfolio. The first is quarterly pre-screening companies due to enter the GPFG’s benchmark index for equities. The second is continuous monitoring of investee companies through daily analyses of news reports, as well as more in-depth thematic analyses of specific markets and sectors. The third approach involves conducting quarterly due diligence assessments on investee companies against Norges Bank’s sustainability expectations. The fourth approach is thematic analysis of particular ESG topics.
When Norges Bank identifies companies with heightened ESG risk, further analysis is conducted to assess whether dialogue should be initiated with the company, whether Norges Bank’s voting should be affected, or whether the company should be considered for a risk-based divestment. Relevant information is also shared with the Council on Ethics, an independent body established by the Ministry of Finance.
To limit the GPFG’s exposure to unacceptable risk, Norges Bank can, within the limits of the mandate, divest from investee companies. This applies principally to activities that burden other companies and society as a whole with substantial costs, which are therefore deemed unsustainable in the long term. Risk-based divestments may be appropriate if it is considered that the investee company poses particularly high long-term financial risk if investments are not substantial and if active ownership is not considered to be a suitable instrument. Unlike ethical exclusion, risk-based divestments are made within the limits of the management mandate and are not based on independent advice from the Council on Ethics.
In 2023, Norges Bank divested from 86 investee companies following risk assessments related to environmental, social and governance issues. The Bank has divested from a total of 526 investee companies since 2012. Since 2012, risk-based divestments have contributed positively to the cumulative return on equity management by 0.44 percentage point, or about 0.02 percentage point annually.
Norges Bank identifies investment opportunities by analysing, among other things, companies’ governance, operations and environmental and social risks and opportunities. In emerging markets, the GPFG can also benefit from the knowledge of external managers with in-depth knowledge of the markets, industries and companies in which they are invested. This is particularly important as it can often be difficult to obtain relevant company data in emerging markets.
Up to 2% of the GPFG may also be invested in unlisted renewable energy infrastructure. In January, Norges Bank acquired a 49% ownership share of a 1.3 GW portfolio of wind and solar electricity production in Spain. The portfolio is a combination of operational and development projects. In March, the Bank acquired a 16.6% ownership share of a 960MW German offshore wind farm project. The project is under development and is expected to be operational by the end of 2025.
Companies
As a long-term investor, Norges Bank engages in regular dialogue with the largest companies. The dialogue is intended to contribute to good corporate governance and responsible business conduct. The size of the investments provides access to board members, senior executives and specialists in the companies. The Bank is interested in understanding how companies are governed and how they address essential sustainability issues. In addition to meetings, the Bank also has written contact with the companies. In 2023, a total of 3 298 meetings with 1 358 investee companies were held. Of these meetings, governance-related topics were discussed at 1 611 meetings with 805 companies. At 1 589 meetings with 822 companies, different sustainability topics were discussed. Overall, ESG topics were discussed at 64% of the meetings with companies accounting for 62% of the value of the equity portfolio.
Norges Bank assesses companies’ sustainability-related reporting on their governance structure, strategy, risk management and objectives based on its public expectations of companies and use of third-party data. Investee companies with weak or limited reporting, in high-risk sectors, are contacted and encouraged to improve their reporting in accordance with the expectation documents, including by using recognised reporting standards. In 2023, letters were sent to 88 investee companies regarding their reporting.
Voting is one of the most important tools Norges Bank has for safeguarding GPFG assets. At the end of 2023, the GPFG held a stake in 8 859 companies worldwide. In 2023, Norges Bank voted on 115 266 proposals at 11 468 shareholder meetings. This corresponds to 98% of the portfolio and 98% of shareholder meetings. Voting guidelines are publicly available.
Since 2021, Norges Bank has published its voting intentions five days before each shareholder meeting with a brief explanation each time Norges Bank votes against the board’s recommendations. In 2023, Norges Bank expanded its transparency by publishing an explanation also when the Norges Bank votes, in line with the company’s recommendation, against a shareholder proposal. The voting intentions are available on Norges Bank Investment Management’s website. Users can search for individual companies or download the full dataset of the votes since 2013 and obtain access to daily updates on voting intentions five days before the shareholder meeting. In 2023, Norges Bank presented a separate, public voting review after the first half of the year. The summary provides information on trends and results from voting at investee companies’ shareholder meetings.
The Ministry of Finance has issued guidelines for the observation and exclusion of companies from the GPFG, based on their products or conduct. The Council on Ethics and Norges Bank are responsible for following up these guidelines. Decisions concerning the observation and exclusion of companies from the GPFG are made by Norges Bank’s Executive Board, based on recommendations from the Council on Ethics. By not investing in such companies, the GPFG’s exposure to unacceptable risk is reduced. In 2023, Norges Bank announced the exclusion of six companies and placed another five under observation. In addition, Norges Bank revoked the exclusion of two companies, ended the observation of two and extended the observation of another. The Bank ended its active ownership under the guidelines in two cases and extended its active ownership in two cases. Since 2006, the equity benchmark index has returned 1.7 percentage points less than it would have done without any ethical exclusions. On an annualised basis, the return has been 0.03 percentage point lower.
Further information on responsible investment is provided in the report Responsible investment Government Pension Fund Global 2023.
Work on climate and climate risk in Central Banking

Climate change and measures to mitigate its effects have an impact on the Norwegian and global economy. Thus, they also influence Norges Bank’s core tasks.
Efforts to strengthen understanding of the effects of climate change and the energy transition are priority areas in Norges Bank’s Strategy 2025. In 2023, the Bank worked actively to strengthen expertise and integrate climate and energy transition into the Bank’s analyses. Norges Bank has ambitions to share new knowledge through its publications and conferences.
Since 2018, Norges Bank has been a member of the Network for Greening the Financial System (NGFS), a network for central banks and supervisory authorities. The network facilitates sharing experiences and best practice, performing analyses and contributes to the development of environmental and climate risk management in the financial sector. Norges Bank cooperates with the NGFS and other institutions, such as the International Banking Research Network (IBRN), the Bank for International Settlements (BIS), the International Monetary Fund (IMF) and other central banks to increase expertise on the effects of climate-related changes. In 2023, the Bank strengthened its participation in projects organised by the NGFS.
Climate and monetary policy
Climate change and a transition to a low-carbon economy may have an impact on monetary policy assessments. Climate-related changes affect the economy through various channels. For example, extreme weather events such as drought and flooding affect global food prices. In addition, energy prices are weather-dependent and are also affected by the transition to renewable energy. Higher solar and wind power capacity may lead to more volatility in energy prices in the short term than historically observed.
In Norway, green manufacturing projects are boosting investment. At the same time, the transition to a low-carbon economy may increase uncertainty about future revenues and investment in the petroleum industry. In the longer term, the structure of the Norwegian economy will change.
Norges Bank analyses how various climate-related factors affect the Norwegian economy. The climate transition is essentially an energy transition. Norges Bank closely monitors developments in energy markets and is working to better integrate these markets into its analytical framework. In order to increase knowledge about the effects of climate-related changes, Norges Bank conducts annual surveys of the effects of climate change and the climate transition on enterprises in the Bank’s Regional Network. Through the NGFS, Norges Bank contributes to analyses of how climate-related factors affect the macroeconomy in the near and medium term.
Climate risk and financial stability
Norges Bank is responsible for promoting a robust financial system. Norges Bank decides on the level of the countercyclical capital buffer and provides advice on the macroprudential stance and on factors that may threaten financial stability. Climate transition affects banks’ risk assessments through various channels, and the regulatory regime has been changed to take into account climate challenges. Financial institutions must ensure that they are well equipped to assess and manage climate-related transition risks. Norges Bank is working to incorporate climate risk into its analyses and include this risk in advice on macroprudential instruments where relevant.
Well-functioning financial markets are important for financing investments that can face climate change. Reliable information on climate risk is important, and climate scenarios are an instrument in the work to identify the consequences of climate change over time. Through the NGFS, Norges Bank has participated in the development of climate scenarios that are publicly available.
Climate stress tests are the most important tool used by central banks to understand the effect of climate change on the financial system. In 2024, Norges Bank plans to publish a climate stress test to assess how climate change affects risk in Norwegian banks and credit institutions.
Climate risk in the foreign exchange reserves
The Executive Board’s decisions on principles for responsible investment and Norges Bank’s sustainability strategy are part of the framework for the management of the foreign exchange reserves, including the management of climate-related issues and climate risk.
The foreign exchange reserves consist of a fixed income portfolio and an equity portfolio. The fixed income portfolio is intended to ensure that the foreign exchange reserves are sufficiently liquid for contingency purposes and that Norges Bank is able to meet its international commitments. The fixed income portfolio therefore consists of cash and liquid government bonds. So far, climate-related issues have had little impact on the composition of the fixed income portfolio. Norges Bank closely monitors developments related to the assessment of government bonds against governments’ climate impact.
The equity portfolio of the foreign exchange reserves is managed according to the same principles and strategies for responsible investment as the equity investments in the Government Pension Fund Global (GPFG). This means that the GPFG’s climate action plan, including the ambition that investee companies achieve net zero emissions by 2050, also applies to the equity portfolio of the foreign exchange reserves.
In 2023, Norges Bank calculated the financed emissions for the foreign exchange reserves for the first time. The financed emissions (scopes 1 and 2) of the foreign exchange reserves, which are calculated based on the carbon emissions of companies in the equity portfolio weighted and summed up according to the Bank’s share of their enterprise value including cash, amounted to 566 273 tonnes of CO2 equivalent in 2023. The foreign exchange reserves’ financed emissions for scope 3 amounted to 634 411 tonnes, based on an estimation model that Norges Bank has reason to believe underestimates real scope 3 emissions. Carbon intensity, expressed as tonnes of CO2 equivalent for scopes 1 and 2 per million USD in revenue, was 89 tonnes in 2023, which is 30% lower than in 2022. This is primarily attributable to the rise in market values in the technology sector relative to more carbon-intensive sectors during 2023.
Responsible investment management in the foreign exchange reserves
Responsible investment and the management of climate-related issues in foreign exchange reserve management are set out in Norges Bank’s principles for responsible investment and the Bank’s sustainability strategy.
Norges Bank Investment Management exercises active ownership on behalf of the foreign exchange reserves’ equity portfolio by formulating clear expectations of investee companies, voting at shareholder meetings and engaging in dialogue with selected companies.
Decisions on risk-based divestment from individual companies implemented for the GPFG’s equity portfolio are also followed up in the equity portfolio of the foreign exchange reserves. In 2023, Norges Bank divested from a total of 41 companies in the foreign exchange reserves’ equity portfolio. In addition, a total of nine companies were excluded from the foreign exchange reserves’ benchmark index and 10 companies were put under observation based on ethical guidelines. The observation of one company ended in 2023.
Climate impact of Norges Bank’s operations
Norges Bank aims to reduce emissions from its own operations in line with the Paris Agreement, and the Bank works systematically on measures to reduce its own emissions. The Bank will ensure that its own emissions are measured, managed and reported in line with best practice.
Norges Bank calculates its carbon footprint for its own operations in accordance with the standard set by the Greenhouse Gas Protocol Initiative (GHG protocol) and the Eco-Lighthouse certification scheme. The Bank’s carbon accounts include direct and indirect carbon emissions.
TABLE 10 Annual carbon accounts for Norges Bank’ operations
|
GHG emissions, in tonnes of CO2 equivalent1 |
20192 |
2022 |
2023 |
Change 2022–2023 |
Change 2019–2023 |
|
|
Direct emissions (scope 1) |
Fuel, combustion vehicles |
20 |
16 |
14 |
-13% |
-30% |
|
Diesel, backup generators |
1 |
9 |
3 |
-67% |
200% |
|
|
Refrigerants |
- |
- |
11 |
|||
|
Total direct emissions (scope 1) |
21 |
25 |
28 |
12% |
33% |
|
|
Indirect emissions (scope 2) |
Electricity |
745 |
646 |
712 |
10% |
-4% |
|
District heating |
4 |
3 |
5 |
67% |
25% |
|
|
Total indirect emissions, energy (scope 2) |
749 |
649 |
717 |
10% |
-4% |
|
|
Indirect emissions, other (scope 3) |
Air travel |
8 378 |
5 175 |
7 945 |
54% |
-5% |
|
Hotel stays |
450 |
156 |
178 |
14% |
-60% |
|
|
Work-related travel by private car |
11 |
11 |
9 |
-18% |
-18% |
|
|
Waste |
57 |
40 |
7 |
-83% |
-88% |
|
|
Total indirect emissions, other (scope 3) |
8 896 |
5 382 |
8 139 |
51% |
-9% |
|
|
Total GHG emissions3 |
9 666 |
6 056 |
8 884 |
47% |
-8% |
|
1 Includes the gases: CO2, CH4, N20, HFCs, PFCs, SF6 and NF3. Norges Bank mainly uses the Department for Energy Security & Net Zero’s (DESNZ, formerly DEFRA) emission factors.
2 Norges Bank has selected 2019 as a reference year. This is the most recent year with normal activity and reliable underlying data.
3 Norges Bank’s carbon accounts include Norges Bank offices where the Bank has operational control in Oslo, London, New York and Singapore. The Shanghai office was included until it was decided to close the office.

Greenhouse gas emissions totalled 8 884 tonnes of CO2 equivalent at the end of 2023, a reduction of 9% compared with the reference year 2019. Data for 2022 are affected by the pandemic and are therefore not directly comparable. Air travel was the largest source of emissions, accounting for 89% of total emissions. In 2023, travel activity picked up following a decrease during the Covid-19 pandemic, but total emissions from air travel remained 5% lower than in the reference year 2019. Developments must be viewed in the light of a 15% increase in the number of employees since the reference year, as well as work to raise awareness of and ambitions to reduce greenhouse gas emissions from the Bank’s own operations in line with the Bank’s sustainability strategy.
Norges Bank is working to reduce emissions from energy consumption at its offices. At the Bank’s head office, ventilation units and other technical installations have been replaced by more energy-efficient versions in recent years. Measures to reduce energy consumption related to lighting, ventilation and heating systems have been implemented. Climate-related work is key in the ongoing upgrade programme deployed at the head office, and equipment is being replaced with more energy-efficient alternatives. At offices abroad, where the Bank is a tenant, action has been taken to reduce energy consumption from lighting, and indoor temperatures have been adjusted.
Norges Bank’s head office at Bankplassen 2, the course and conference venue Vindåsen and the Venastul resort are Eco-Lighthouse certified. This provides access to tools that support the Bank in measuring and improving environmental performance.
External data centres and cloud platforms
In 2023, Norges Bank also started collecting data related to emissions from the operation of data centres. The emissions include Norges Bank’s percentage of emissions from suppliers of external data centres and cloud platforms. Norges Bank requires data centres to be constructed and operated in an eco-friendly manner to ensure efficient resource utilisation and the use of renewable sources. The emissions are not given in the carbon accounts as all desired data has yet to be obtained. Based on information from four of the five external providers, calculated emissions amounted to 76 tonnes of CO2 equivalent in 2023.
Responsible procurement
Norges Bank procured goods and services totalling approximately NOK 5.1bn in 2023.
Norges Bank is subject to public procurement regulations and is enjoined to set requirements for wage and working conditions pursuant to regulations on wage and working conditions in public contracts. Suppliers and any subcontractors must, upon request, be able to document compliance with wage and working conditions.
Norges Bank aims to have a responsible and sustainable supply chain and sets environmental requirements for procurements where relevant. In 2023, controls of wage and working conditions were carried out at 32 of the Bank’s suppliers. Seven violations of wage and/or working conditions were detected for personnel working for Norges Bank. At Norges Bank’s request, the suppliers confirmed that the conditions were rectified and that any outstanding wage claims will be met.
The public procurement Act includes a requirement that limits the number of tiers in the supply chain for procurements in sectors with a high incidence of work-related crime, such as construction and cleaning services. Norges Bank accepts no more than two tiers of subcontractors. All suppliers with access to the Bank’s premises or systems are responsible for ensuring that personnel performing services or work for Norges Bank are aware of the ethical rules.

Limited assurance of sustainability indicators
Norges Bank has engaged EY to perform a limited assurance engagement on sustainability information in Norges Bank’s Annual Report for 2023. See EY’s report, Independent accountant’s assurance report.
Norges Bank does not make ongoing reference to sustainability indicators in Norges Bank’s Annual Report for 2023. The table below refers to the reporting standard and the indicator on which the information compiled is based. The reported information is for the period between 1 January 2023 and 31 December 2023. Information provided is attested by EY.
|
Standard |
Indicator |
Description |
|
Staff |
||
|
Wage and wage gap |
||
|
GRI 405: Diversity and equal opportunity 2016 |
405-2 Ratio of basic salary and remuneration of women to men |
Wage gaps per job category, Tables 5 - 8. |
|
Responsible investment management of the Government Pension Fund Global |
||
|
Work on climate risk in the Government Pension Fund Global |
||
|
Climate-related disclosures1 |
Financed emissions Asset management |
Financed emissions - equity portfolio and bond portfolio: scopes 1 and 2: 59m tonnes CO2 equivalent |
|
Financed emissions - equity portfolio and bond portfolio: scope 3: 61m tonnes CO2 equivalent |
||
|
GRI 305: Emissions 2016 |
305-4 Greenhouse gas (GHG) emissions intensity |
Carbon intensity - equity portfolio - scopes 1 and 2: 104 tonnes CO2 equivalent |
|
Carbon intensity - bond portfolio - scopes 1 and 2: 124 tonnes CO2 equivalent |
||
|
Work on responsible investment management of the Government Pension Fund Global |
||
|
GRI 415: Public Policy 2016 |
415-1 Political contributions |
Participation in number of public consultations related to responsible investment management: 27 (Norges Bank has made no political monetary contributions) |
|
GRI-G4: Financial Services Sector Disclosures 2014 |
FS10 Percentage and number of companies held in the institution’s portfolio with which the reporting organisation has interacted on environmental or social issues |
Number of meetings held with companies: 3 298 meetings with 1 358 companies (15% of all companies) Number of matters where Norges Bank voted at shareholder meetings: 115 266 at 11 468 shareholder meetings |
|
GRI G4: Financial Services Sector Disclosures 2014 |
FS11 Percentage of holdings subject to positive and negative environmental or social screening |
Number of companies Norges Bank is divested from following risk assessments related to ESG issues: 86 Number of excluded companies: 6 Number of new companies placed under observation: 5 |
|
Work on climate and climate risk in Central Banking |
||
|
Climate risk in the foreign exchange reserves |
||
|
Climate-related disclosures2 |
Financed emissions Asset management |
Financed emissions - equity portfolio: scopes 1 and 2: 566 273 tonnes CO2 equivalent |
|
Financed emissions - equity portfolio: scope 3: 634 411 tonnes CO2 equivalent |
||
|
GRI 305: Emissions 2016 |
305-4 Greenhouse gas (GHG) emissions intensity |
Carbon intensity - equity portfolio - scopes 1 and 2: 89 tonnes CO2 equivalent |
|
Responsible investment management of foreign exchange reserves |
||
|
GRI G4: Financial Services Sector Disclosures 2014 |
FS11 Percentage of holdings subject to positive and negative environmental or social screening |
Number of companies in the foreign exchange reserves’ equity portfolio Norges Bank has divested from following risk assessments related to ESG issues: 41 Number of companies excluded from the foreign exchange reserves’ benchmark index: 9 |
|
Sustainability in Norges Bank’s operations |
||
|
Climate impact of Norges Bank’s operations |
||
|
GRI 305: Emissions 2016 |
305-1 Direct (scope 1) GHG emissions |
28 tonnes CO2 equivalent |
|
305-2 Energy indirect (scope 2) GHG emissions |
717 tonnes CO2 equivalent |
|
|
305-3 Other indirect (scope 3) GHG emissions |
8 139 tonnes CO2 equivalent |
|
1 The climate related disclosures indicator is based on IFRS S2 paragraph 29 (a) (vi) (2) and paragraph B61 Asset Management (a) regarding financed emissions.
2 The climate related disclosures indicator is based on IFRS S2 paragraph 29 (a) (vi) (2) and paragraph B61 Asset Management (a) regarding financed emissions.

Main points
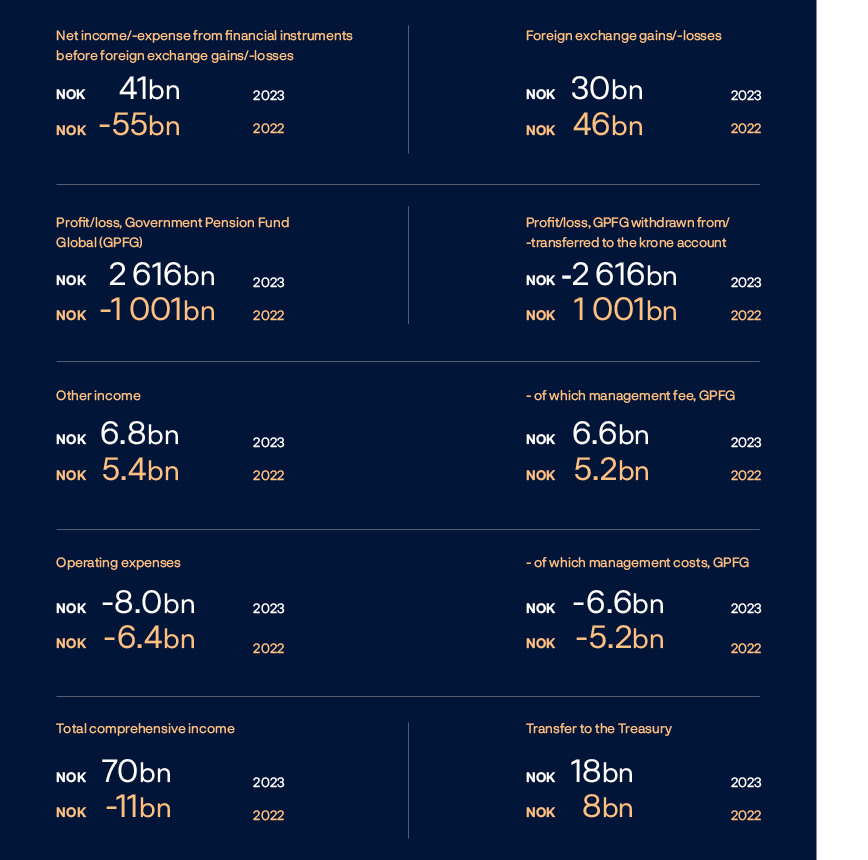
Income statement
|
Amounts in NOK million |
Note |
2023 |
2022 |
|
Net income/-expense from financial instruments |
|||
|
Net income/-expense from: |
|||
|
-Equities |
3,5 |
30 524 |
-15 916 |
|
-Bonds |
3,5 |
18 564 |
-38 331 |
|
-Financial derivatives |
5 |
119 |
-418 |
|
-Secured lending |
9 |
1 283 |
135 |
|
Interest income from deposits in banks |
11 |
2 963 |
1 529 |
|
Interest income from lending to banks |
12 |
905 |
595 |
|
Interest expense on deposits from banks and the Treasury |
12 |
-14 869 |
-2 979 |
|
Interest income from the IMF |
14 |
5 216 |
1 494 |
|
Interest expense to the IMF |
14 |
-4 235 |
-1 243 |
|
Tax expenses |
3 |
-39 |
-2 |
|
Other financial income/-expenses |
490 |
62 |
|
|
Net income/-expense from financial instruments before foreign exchange gains/-losses |
40 921 |
-55 074 |
|
|
Foreign exchange gains/-losses |
8 |
30 323 |
45 513 |
|
Net income/-expense from financial instruments |
71 244 |
-9 561 |
|
|
Other operating income |
|||
|
Management fee, GPFG |
19 |
6 632 |
5 226 |
|
Other operating income |
17 |
161 |
149 |
|
Total other operating income |
6 794 |
5 374 |
|
|
Operating expenses |
|||
|
Personnel expenses |
15 |
-2 853 |
-2 350 |
|
Other operating expenses |
17 |
-4 984 |
-3 895 |
|
Depreciation, amortisation and impairment losses |
18 |
-135 |
-154 |
|
Total operating expenses |
-7 971 |
-6 399 |
|
|
Management of the Government Pension Fund Global (GPFG) |
|||
|
Total comprehensive income, GPFG |
20 |
2 616 385 |
-1 000 551 |
|
Withdrawn from/-transferred to the krone account of the GPFG |
20 |
-2 616 385 |
1 000 551 |
|
Profit/-loss for the period |
70 067 |
-10 586 |
|
|
Statement of comprehensive income |
|||
|
Profit/-loss for the period |
70 067 |
-10 586 |
|
|
Change in actuarial gains/-losses |
16 |
-35 |
-504 |
|
Total comprehensive income |
70 031 |
-11 090 |
Balance sheet
|
Amounts in NOK million |
Note |
31.12.2023 |
31.12.2022 |
|
Assets |
|||
|
Financial assets |
|||
|
Deposits in banks |
11 |
20 792 |
32 334 |
|
Secured lending |
9,10 |
60 723 |
18 685 |
|
Cash collateral posted |
9,10 |
- |
6 |
|
Unsettled trades |
2 020 |
917 |
|
|
Equities |
4,7 |
140 488 |
106 843 |
|
Equities lent |
4,7,9,10 |
2 885 |
3 987 |
|
Bonds |
4,6,7 |
504 680 |
462 853 |
|
Financial derivatives |
6 |
3 |
15 |
|
Lending to banks |
12 |
2 803 |
15 895 |
|
Claims on the IMF |
14 |
134 999 |
126 560 |
|
Other financial assets |
19 |
671 |
529 |
|
Total financial assets |
870 064 |
768 624 |
|
|
Non-financial assets |
|||
|
Pensions |
16 |
93 |
- |
|
Non-financial assets |
18 |
2 078 |
2 047 |
|
Total non-financial assets |
2 171 |
2 047 |
|
|
Net value, GPFG |
20 |
15 756 719 |
12 429 334 |
|
Total assets |
16 628 954 |
13 200 005 |
|
|
Liabilities and equity |
|||
|
Financial liabilities |
|||
|
Secured borrowing |
9,10 |
29 |
37 |
|
Unsettled trades |
9,10 |
38 894 |
13 469 |
|
Financial derivatives |
12 |
31 |
|
|
Deposits from banks |
12 |
58 355 |
26 821 |
|
Deposits from the Treasury |
12 |
281 816 |
304 606 |
|
Notes and coins in circulation |
13 |
39 724 |
40 075 |
|
Liabilities to the IMF |
14 |
107 979 |
103 378 |
|
Other financial liabilities |
5 149 |
3 919 |
|
|
Total financial liabilities |
531 958 |
492 336 |
|
|
Other liabilities |
|||
|
Pensions |
16 |
- |
170 |
|
Other liabilities |
19 |
18 330 |
8 645 |
|
Total other liabilities |
18 330 |
8 815 |
|
|
Deposits in krone account, GPFG |
20 |
15 756 719 |
12 429 334 |
|
Total liabilities |
16 307 007 |
12 930 485 |
|
|
Equity |
321 947 |
269 520 |
|
|
Total liabilities and equity |
16 628 954 |
13 200 005 |
Norges Bank’s Executive Board
Oslo, 8 February 2024
Ida Wolden Bache (sign.)
Governor / Chair of the Executive Board
Pål Longva (sign.)
First Deputy Chair
Øystein Børsum (sign.)
Second Deputy Chair
Karen Helene Ulltveit-Moe (sign.)
Kristine Ryssdal (sign.)
Arne Hyttnes (sign.)
Hans Aasnæs (sign.)
Nina Udnes Tronstad (sign.)
Egil Herman Sjursen (sign.)
Mona Helen Sørensen (sign.)
Employee representative
Truls Oppedal (sign.)
Employee representative
Statement of cash flows
|
Amounts in NOK million, inflows (+)/outflows (-) |
Note |
2023 |
2022 |
|
Operating activities |
|||
|
Receipts of dividend from equities |
2 676 |
2 244 |
|
|
Receipts of interest from bonds |
6 439 |
4 598 |
|
|
Net receipts of interest and fee from secured lending and borrowing |
1 273 |
189 |
|
|
Receipts of dividend, interest and fee from holdings of equities and bonds |
10 388 |
7 031 |
|
|
Net cash flow from purchase and sale of equities |
-2 460 |
-2 366 |
|
|
Net cash flow from purchase and sale of bonds |
-6 781 |
-3 053 |
|
|
Net cash flow financial derivatives |
1 151 |
1 317 |
|
|
Net cash flow related to deposits in banks |
3 209 |
850 |
|
|
Net cash flow secured lending and borrowing |
-18 944 |
1 582 |
|
|
Net cash flow related to other expenses, other assets and other liabilities |
-23 698 |
-10 692 |
|
|
Net cash flow related to other financial assets and other financial liabilities |
45 698 |
32 677 |
|
|
Net cash flow to/-from the Treasury |
687 314 |
1 050 176 |
|
|
Inflow from the Norwegian government to the GPFG |
19 |
-710 104 |
-1 089 712 |
|
Withdrawals by the Norwegian government from the GPFG |
19 |
- |
- |
|
Management fee received from the GPFG |
19 |
6 526 |
4 964 |
|
Net cash flow from operating activities |
-7 701 |
-7 226 |
|
|
Investing activities |
|||
|
Net cash flow related to non-financial assets and liabilities |
18 |
-146 |
-128 |
|
Net cash flow from investing activities |
-146 |
-128 |
|
|
Financing activities |
|||
|
Cash flow from the Transfer Fund to the Treasury |
19 |
-8 094 |
-11 108 |
|
Net cash flow from financing activities |
-8 094 |
-11 108 |
|
|
Net change in cash |
|||
|
Deposits in banks at 1 January |
11 |
32 334 |
49 628 |
|
Net increase/-decrease of cash in the period |
-15 941 |
-18 462 |
|
|
Net foreign exchange gains and losses on cash |
4 399 |
1 168 |
|
|
Deposits in banks at 31 December |
11 |
20 792 |
32 334 |
Accounting policy
The statement of cash flows has been prepared in accordance with the direct method. Major classes of gross payments are presented separately, with the exception of specific transactions primarily arising from the purchase and sale of financial instruments, which are shown net.
Transfers between the GPFG and the Norwegian government are classified as a financing activity in the statement of cash flows in the GPFG’s financial statements. In Norges Bank’s financial statements, transfers are classified as operating activities, since Norges Bank is the manager of the GPFG.
Statement of changes in equity
|
Amounts in NOK million |
Adjustment Fund |
Transfer Fund |
Total equity |
|
1 January 2022 |
266 488 |
22 216 |
288 704 |
|
Total comprehensive income |
-13 155 |
2 065 |
-11 090 |
|
31 December 2022 before transfer to the Treasury |
253 333 |
24 281 |
277 614 |
|
Transferred to the Treasury |
- |
-8 094 |
-8 094 |
|
31 December 2022 |
253 333 |
16 187 |
269 520 |
|
1 January 2023 |
253 333 |
16 187 |
269 520 |
|
Total comprehensive income |
33 406 |
36 625 |
70 031 |
|
31 December 2023 before transfer to the Treasury |
286 739 |
52 812 |
339 551 |
|
Transferred to the Treasury |
- |
-17 604 |
-17 604 |
|
31 December 2023 |
286 739 |
35 208 |
321 947 |
Accounting policy
Norges Bank’s equity comprises an Adjustment Fund and a Transfer Fund. The Adjustment Fund comprises the Bank’s restricted equity, and the Transfer Fund comprises the basis for transfers to the Treasury. Norges Bank’s capital is governed by the Guidelines for provisions and allocations of Norges Bank’s profit or loss laid down on 13 December 2019, pursuant to section 3-11, sub-section 2, of the Central Bank Act.
Notes
Note 1 General information
1. Introduction
Norges Bank is Norway’s central bank. The Bank is a separate legal entity and is owned by the State. The Bank’s main office is at Bankplassen 2, Oslo, Norway.
Norges Bank shall promote economic stability and manage substantial assets on behalf of the nation. The Bank conducts monetary policy, monitors financial stability, promotes robust and efficient payment systems and financial markets and manages Norway’s foreign exchange reserves.
Norges Bank manages the Government Pension Fund Global (GPFG) on behalf of the Ministry of Finance in accordance with section 3, second paragraph, of the Government Pension Fund Act and the management mandate for the GPFG issued by the Ministry of Finance.
The GPFG shall support government saving to finance future expenditure and underpin long-term considerations relating to the use of Norway’s petroleum revenues. The Norwegian Parliament has established the legal framework in the Government Pension Fund Act, and the Ministry of Finance has formal responsibility for the fund’s management. The Executive Board of Norges Bank has delegated day-to-day management of the GPFG to Norges Bank Investment Management (NBIM).
The Ministry of Finance has placed funds for investment in the GPFG in the form of a Norwegian krone deposit with Norges Bank (the krone account). Norges Bank manages the krone account in its own name by investing the funds in an investment portfolio consisting of equities, bonds, real estate and infrastructure for renewable energy. The GPFG is invested in its entirety outside of Norway.
Transfers are made to and from the krone account in accordance with the management mandate. When the Norwegian State’s petroleum revenue exceeds the use of petroleum revenue in the fiscal budget, deposits will be made into the krone account. In the opposite situation, withdrawals will be made. Transfers to and from the krone account lead to a corresponding change in Owner's capital in the GPFG..
For further information about the management mandate for the GPFG, Norges Bank’s governance structure and risk management see note 20.9 Investment risk. For further information about transactions between Norges Bank and the GPFG, see note 19 Related parties.
Norges Bank is not exposed to financial risk from its management of the GPFG. The return on the portfolio, less the management fee to Norges Bank, is transferred in its entirety to the krone account and does not affect total comprehensive income or equity in Norges Bank. The investment portfolio under management is equal to the amount on deposit in the krone account at the time in question, less the accrued management fee and deferred tax. This is presented on a separate line as an asset in Norges Bank’s balance sheet, and the krone account is presented as a liability in the same amount to the Ministry of Finance.
2. Approval of the financial statements
The annual financial statements of Norges Bank for 2023 were approved by the Executive Board on 8 February 2024 and approved by the Supervisory Council on 22 February 2024. The annual financial reporting for the GPFG is an excerpt of Norges Bank’s financial reporting and is included in Norges Bank’s annual financial statements as note 20.
Note 2 Accounting policies
This note describes accounting policies, significant estimates and accounting judgements that are relevant to the financial statements as a whole. Additional accounting policies, significant estimates and accounting judgements are included in the respective statements and notes.
Significant estimates and critical accounting judgements
The preparation of the financial statements involves the use of uncertain estimates and assumptions relating to future events that affect the reported amounts for assets, liabilities, income and expenses. Estimates are based on historical experience and reflect management’s expectations about future events. Actual outcomes may deviate from estimates. The preparation of the financial statements also involves the use of judgement when applying accounting policies, which may have a significant impact on the financial statements.
In cases where there are particularly uncertain estimates or accounting judgements, this is described in the respective notes.
1. Basis of preparation
Pursuant to section 4-3 of the Central Bank Act, the annual financial statements of Norges Bank have been prepared in accordance with the Accounting Act and Regulation on the financial reporting for Norges Bank (the Regulation), laid down by the Ministry of Finance.
The Regulation entails that the financial reporting of the GPFG is prepared in accordance with IFRS Accounting Standards as adopted by the EU, subject to the additions and exemptions specified in the Accounting Act and the Regulation. It sets forth that the return on the investment portfolio and the return assigned to the krone account of the GPFG shall be presented on separate lines in the income statement, the net value of the GPFG and the deposits in the krone account of the GPFG shall be presented on separate lines in the balance sheet, inflows to and withdrawals from the krone account of the GPFG shall be presented on separate lines in the statement of cash flows and the annual financial reporting of the GPFG shall be presented in a separate note in Norges Bank’s annual financial statements, see note 20 Government Pension Fund Global (GPFG). In addition, subsidiaries that are included in the consolidation for the preparation of consolidated financial reporting for the investment portfolio are excluded from the consolidation in Norges Bank’s annual financial statements. See also section 4.2 Subsidiaries below for the consolidation of certain subsidiaries in the GPFG.
The financial statements are presented in a manner that is most relevant to an understanding of the Bank’s financial performance.
The rules on global minimum taxation (Pillar 2) are expected to be implemented with effect from 2024. The current assessment is that Norges Bank will be exempt from the scope. Therefore, no change in tax expense is expected as a result of the implementation.
The annual financial statements are prepared with a closing date of 31 December, and are presented in Norwegian kroner (NOK), and unless otherwise stated, rounded to the nearest million. Rounding differences may occur.
Norges Bank's annual financial statements are prepared under a going concern basis.
2. Changes in accounting policies, including new and amended standards and interpretations, in the period
Accounting policies applied are consistent with the policies applied in the previous accounting year. There are no new or amended IFRS standards and interpretations that have become effective for the accounting year beginning on 1 January 2023 that have had any material effect on the Bank’s financial statements.
3. New and amended standards and interpretations effective from 2024 or later
Issued IFRS standards, changes in existing standards and interpretations issued with effective dates from 2024 or later are expected to be immaterial or not applicable for the Bank’s financial reporting at the time of implementation.
4. Accounting policies for the financial statements as a whole
4.1 Financial assets and liabilities
Recognition and derecognition
Financial assets and liabilities are recognised in the balance sheet upon becoming a party to the instrument’s contractual provisions.
Financial assets are derecognised when the contractual rights to the cash flows expire, or when the financial assets and substantially all the risks and rewards of ownership are transferred. See note 9 Secured lending and borrowing and note 20.13 Secured lending and borrowing for details on transferred assets that are not derecognised.
Financial liabilities are derecognised when the obligation is extinguished, i.e. when the obligation specified in the contract is discharged, cancelled or expires.
Purchase or sale of a financial asset where the contractual terms require settlement in accordance with normal market conditions, is recognised on the trade date.
Classification and measurement
Financial assets are classified based on the business model used for managing the assets and their contractual cash flow characteristics.
The investment portfolio of the GPFG is managed in accordance with the management mandate issued by the Ministry of Finance, the investment mandate issued by the Executive Board of Norges Bank and investment strategies issued by the management of Norges Bank Investment Management. These mandates and strategies, including the risk management strategies, entail that financial assets are managed and evaluated on a fair value basis. The financial assets in the GPFG are therefore measured at fair value through profit or loss, except for Management fee receivable, which is not part of the investment portfolio. Management fee receivable is measured at amortised cost.
The foreign exchange reserves are managed in accordance with the principles issued by the Executive Board and are managed and their performance evaluated on a fair value basis. Other financial assets are measured at amortised cost.
Financial liabilities are measured at amortised cost, except for financial liabilities designated as at fair value through profit or loss. This applies to financial liabilities in the foreign exchange reserves that are managed and their performance evaluated on a fair value basis. For the GPFG, financial liabilities, except for Management fee payable and Deferred tax, are integrated into the investment portfolio that is managed and evaluated on a fair value basis, and are therefore designated at fair value through profit or loss. Management fee payable is measured at amortised cost.
Financial derivatives are measured at fair value through profit or loss.
For further specification of the classification of financial instruments, see note 6 Measurement and table 6.2 Classification of financial instruments.
Impairment
For financial assets classified as measured at amortised cost, an allowance for expected credit losses is recognised. Expected credit losses are estimated per loan and are based on the loan’s exposure at default, probability of default and loss given default. The recognised amount comprises expected credit losses within the 12 months after the reporting date. In the event of a substantial increase in credit risk since initial recognition, an expected loss allowance is recognised over the expected life of the asset.
4.2 Subsidiaries
Investments in real estate and infrastructure for renewable energy are made through subsidiaries of Norges Bank, which are exclusively established as part of the management of the fund. Subsidiaries are controlled by the GPFG and are included in the financial reporting for the GPFG in accordance with section 3-4 of the Regulation. Control over an entity exists when the GPFG is exposed to or has rights to variable returns from its involvement in the entity and is able to influence those returns through its power over the entity. For further information, see note 20.16 Interests in other entities.
The GPFG is an investment entity in accordance with IFRS 10 Consolidated financial statements. IFRS 10 defines an investment entity and introduces a mandatory exemption from consolidation for investment entities.
Subsidiaries measured at fair value through profit or loss
Subsidiaries that invest in real estate or infrastructure for renewable energy through ownership interests in other entities, are investment entities. These subsidiaries are measured at fair value through profit and loss in accordance with the principles for financial assets, as described in section 4.1 Financial assets and liabilities above. Subsidiaries that invest in real estate are presented in the balance sheet of the GPFG as Unlisted real estate. Subsidiaries that invest in infrastructure for renewable energy are presented in the balance sheet of the GPFG as Unlisted infrastructure. See note 20.6 Unlisted real estate and note 20.7 Unlisted renewable energy infrastructure for supplementing policies.
Consolidated subsidiaries
Subsidiaries that perform investment-related services, and which are not investment entities themselves, are consolidated. Consolidated subsidiaries do not own, neither directly nor indirectly, investments in real estate or infrastructure for renewable energy.
Accounting judgement
The GPFG is an investment entity based on the following:
a) It obtains funds from the Norwegian government, a related party and its sole owner, and delivers professional investment services, being the management of the fund, to the Norwegian government,
b) It commits to the Norwegian government that its business purpose is to invest solely for capital appreciation and investment income,
c) It measures and evaluates returns for all its investments exclusively on a fair value basis.
The GPFG does not have an explicit strategy that defines a specific time for the realisation of each investment, but the investments are assessed continuously, and purchase and sale assessments are made. After an overall assessment, it has been concluded that the GPFG meets the criteria in the definition of an investment entity.
Note 3 Income/expense from equities and bonds
Accounting policy
Dividends are recognised when the dividends are formally approved by the shareholders’ meeting or comparable responsible party.
Interest income is recognised when the interest is accrued. Interest expense is recognised as incurred. The measurement of interest income and expense is based on contractual terms.
Realised gain/-loss primarily represents amounts realised when assets or liabilities have been derecognised. Average acquisition cost is assigned at derecognition. Realised gain/-loss includes transaction costs, which are expensed as incurred. Transaction costs are defined as all costs directly attributable to the completed transaction. For investments in equities and bonds, these normally include commission fees and stamp duties.
Unrealised gain/-loss represents changes in fair value for the period for the related balance sheet line item that are not attributable to the aforementioned categories.
Table 3.1 Income/-expense from equities
|
Amounts in NOK million |
2023 |
2022 |
|
Dividends |
2 743 |
2 299 |
|
Realised gain/-loss |
1 288 |
1 115 |
|
Unrealised gain/-loss |
26 493 |
-19 330 |
|
Income/-expense from equities before foreign exchange gains/-losses |
30 524 |
-15 916 |
Table 3.2 Income/-expense from bonds
|
Amounts in NOK million |
2023 |
2022 |
|
Interest |
7 510 |
4 914 |
|
Realised gain/-loss |
-6 749 |
-2 604 |
|
Unrealised gain/-loss |
17 803 |
-40 641 |
|
Income/-expense from bonds before foreign exchange gains/-losses |
18 564 |
-38 331 |
Tax expense
Norges Bank is exempt from income tax on its operations in Norway but is liable to taxes in some other jurisdictions. Tax expense comprises income tax that will not be refunded under local tax rules or tax treaties to Norges Bank. This pertains primarily to withholding tax on dividends related to the foreign exchange reserves’ equity investments.
Accounting policy
Withholding tax, after deduction of refunded amounts, is recognised at the same time as the related dividend. Refundable withholding tax is recognised in the balance sheet as a receivable under Other assets.
Tax expense for 2023 was NOK 39 million, compared with NOK 2 million in 2022.
Japan and Germany are the markets with the highest tax expense in 2023, amounting to NOK 10.5 million and NOK 10.8 million, respectively. Norway’s tax treaties with these countries entail a tax rate of 15 percent. Tax expense in other respects refers to smaller amounts divided among several other jurisdictions.
Accounting policies for taxation are further detailed in note 20.10 Tax.
Note 4 Holdings of equities and bonds
Accounting policy
Investments in equities and bonds are measured at fair value through profit or loss. Earned dividends and interest are presented in the balance sheet on the same line as the underlying financial instrument. All equity investments, except for equities in the BIS, are in the foreign exchange reserve. The balance sheet line Equities lent also constitute a part of the foreign exchange reserves and are presented in the balance sheet separately. For further information on financial instruments lent, see note 9 Secured lending and borrowing.
For further information on measurement, see note 6 Measurement.
Changes in fair value for the period are recognised in the income statement and specified in note 3 Income/expense from equities and bonds.
Table 4.1 Equities
|
Amounts in NOK million |
31.12.2023 |
31.12.2022 |
|
Equity investments in the foreign exchange reserves |
143 142 |
110 613 |
|
Equities in the BIS |
231 |
217 |
|
Total equity investments |
143 373 |
110 830 |
|
Of which presented in the balance sheet on the line Equities |
140 488 |
106 843 |
|
Of which presented in the balance sheet on the line Equities lent1 |
2 885 |
3 987 |
1 Equities lent is exclusively related to equity investments in the foreign exchange reserves.

|
31.12.2023 |
31.12.2022 |
|||
|
Amounts in NOK million |
Nominal value1 |
Fair value |
Nominal value1 |
Fair value |
|
Bonds |
524 135 |
504 680 |
498 837 |
462 853 |
|
Total bonds |
524 135 |
504 680 |
498 837 |
462 853 |
|
Of which presented in the balance sheet on the line Bonds lent |
- |
- |
- |
- |
1 Nominal values have been translated into NOK at the closing rate at the balance sheet date. The nominal value comprises the face value of the instrument or principal.
Bonds in Norges Bank’s balance sheet are in their entirety associated with management of the foreign exchange reserves. Norges Bank issues government debt and enters into financial contracts in the area of government debt management in the name of the Ministry of Finance. Transactions related to government debt management are recognised in the government accounts and not in Norges Bank’s income statement or balance sheet.
Bank for International Settlements (BIS)
The Bank for International Settlements (BIS) acts as a bank for central banks, and its mission is to serve central banks in their pursuit of monetary policy and financial stability by fostering international cooperation in those areas.
The BIS is a limited liability company owned by central banks. Norges Bank has 8 000 voting shares (with a face value of SDR 5 000) in the BIS, in addition to 564 non-voting shares (with a face value of SDR 5 000), for a total of 8 564 shares. Norges Bank’s share of the total shares in the BIS was equal to 1.5 percent at year-end 2023, the same as at year-end 2022.
When the shares were issued, the BIS required payment of only 25 percent of the share capital, with the remaining 75 percent committed capital not recognised in the balance sheet. The committed capital was NOK 438 million at year-end 2023, compared with NOK 422 million at year-end 2022.
Dividends from the BIS are distributed annually. Dividends received from the BIS was NOK 35 million in 2023, compared with NOK 31 million in 2022.
Note 5 Foreign exchange reserves
The foreign exchange reserves are to be available for use in foreign exchange market transactions or as part of the conduct of monetary policy, with a view to promoting financial stability and to meet Norges Bank’s international commitments. The foreign exchange reserves are divided into a fixed income portfolio, an equity portfolio and a petroleum buffer portfolio. See further discussion in note 7 Investment risk.
The petroleum buffer portfolio is intended to receive the government’s cash flow from petroleum activities in foreign currency and any transfers to and from the GPFG. The purpose of the portfolio is to provide for an appropriate management of the government’s need for converting foreign currency and NOK.
See note 8 Currency for a specification of the foreign exchange reserves’ currency breakdown.
Tables 5.1 and 5.2 show income statements and balance sheets, respectively, for the foreign exchange reserves by portfolio. Since the foreign exchange reserves are presented as they are operationally managed by Norges Bank, there may be minor differences between this presentation and presentation under the IMF definition of foreign exchange reserves.
Table 5.1 Foreign exchange reserves by portfolio, income statement
|
Portfolios |
2023 |
|||
|
Amounts in NOK million |
Equities |
Fixed Income |
Petroleum buffer |
Total foreign exchange reserves |
|
Income statement |
||||
|
Net income/-expenses from: |
||||
|
- Equities |
30 474 |
- |
- |
30 474 |
|
- Bonds |
- |
18 565 |
-1 |
18 564 |
|
- Financial derivatives |
15 |
104 |
- |
119 |
|
- Secured lending |
25 |
180 |
1 078 |
1 283 |
|
Interest income from deposits in banks |
2 |
169 |
2 785 |
2 956 |
|
Tax expense |
-39 |
- |
- |
-39 |
|
Other financial income/-expenses |
-15 |
- |
- |
-15 |
|
Net income/-expense from financial instruments before foreign exchange gains/-losses |
30 462 |
19 018 |
3 862 |
53 342 |
|
Foreign exchange gains/-losses |
2 222 |
22 354 |
4 986 |
29 562 |
|
Net income/-expense from financial instruments |
32 684 |
41 372 |
8 848 |
82 904 |
|
Portfolios |
2022 |
|||
|
Amounts in NOK million |
Equities |
Fixed Income |
Petroleum buffer |
Total foreign exchange reserves |
|
Income statement |
||||
|
Net income/-expenses from: |
||||
|
- Equities |
-15 963 |
- |
- |
-15 963 |
|
- Bonds |
- |
-38 331 |
-1 |
-38 331 |
|
- Financial derivatives |
-1 |
-417 |
- |
-418 |
|
- Secured lending |
22 |
29 |
83 |
135 |
|
Interest income from deposits in banks |
- |
34 |
1 494 |
1 528 |
|
Tax expense |
-2 |
- |
- |
-2 |
|
Other financial income/-expenses |
-3 |
- |
- |
-3 |
|
Net income/-expense from financial instruments before foreign exchange gains/-losses |
-15 947 |
-38 684 |
1 577 |
-53 054 |
|
Foreign exchange gains/-losses |
4 436 |
35 423 |
4 462 |
44 321 |
|
Net income/-expense from financial instruments |
-11 511 |
-3 261 |
6 039 |
-8 733 |
Table 5.2 Foreign exchange reserves by portfolio, balance sheet
|
Portfolios |
31.12.2023 |
|||
|
Amounts in NOK million |
Equities |
Fixed Income |
Petroleum buffer |
Total foreign exchange reserves |
|
Balance sheet |
||||
|
Financial assets |
||||
|
Deposits in banks |
29 |
6 993 |
13 551 |
20 573 |
|
Secured lending |
29 |
7 170 |
53 524 |
60 723 |
|
Cash collateral posted |
- |
- |
- |
- |
|
Unsettled trades |
16 |
2 004 |
- |
2 020 |
|
Equities |
140 256 |
- |
- |
140 256 |
|
Equities lent |
2 885 |
- |
- |
2 885 |
|
Bonds |
- |
504 680 |
- |
504 680 |
|
Financial derivatives |
- |
3 |
- |
3 |
|
Other financial assets |
98 |
- |
- |
98 |
|
Total financial assets |
143 313 |
520 850 |
67 075 |
731 238 |
|
Financial liabilities |
||||
|
Secured borrowing |
29 |
- |
- |
29 |
|
Unsettled trades |
- |
9 574 |
29 320 |
38 894 |
|
Financial derivatives |
- |
3 |
9 |
12 |
|
Other financial liabilities |
155 |
- |
2 365 |
2 520 |
|
Total financial liabilities |
184 |
9 577 |
31 694 |
41 455 |
|
Net foreign exchange reserves |
143 129 |
511 273 |
35 381 |
689 783 |
|
Portfolios |
31.12.2022 |
|||
|
Amounts in NOK million |
Equities |
Fixed Income |
Petroleum buffer |
Total foreign exchange reserves |
|
Balance sheet |
||||
|
Financial assets |
||||
|
Deposits in banks |
-5 |
10 999 |
21 115 |
32 109 |
|
Secured lending |
50 |
3 916 |
14 719 |
18 685 |
|
Cash collateral posted |
- |
6 |
- |
6 |
|
Unsettled trades |
2 |
915 |
- |
917 |
|
Equities |
106 626 |
- |
- |
106 626 |
|
Equities lent |
3 987 |
- |
- |
3 987 |
|
Bonds |
- |
462 853 |
- |
462 853 |
|
Financial derivatives |
2 |
13 |
- |
15 |
|
Other financial assets |
122 |
- |
- |
122 |
|
Total financial assets |
110 784 |
478 702 |
35 834 |
625 320 |
|
Financial liabilities |
||||
|
Secured borrowing |
37 |
- |
- |
37 |
|
Unsettled trades |
- |
6 740 |
6 729 |
13 469 |
|
Financial derivatives |
- |
16 |
15 |
31 |
|
Other financial liabilities |
302 |
- |
1 468 |
1 770 |
|
Total financial liabilities |
339 |
6 756 |
8 212 |
15 307 |
|
Net foreign exchange reserves |
110 445 |
471 946 |
27 622 |
610 013 |
Note 6 Measurement
Accounting policy
All assets and liabilities presented in the balance sheet as Equities, Bonds, Financial derivatives, Secured lending and borrowing, Deposits in banks and Cash collateral posted are measured at fair value through profit or loss.
Fair value, as defined by IFRS 13 Fair Value Measurement, is the price that would be received to sell an asset or paid to transfer a liability in an orderly transaction between market participants at the measurement date.
Introduction
Fair value for the vast majority of assets and liabilities is based on quoted market prices or observable market data. If the market is not active, fair value is established by using standard valuation techniques. Estimating fair value may be complex and require the use of judgement, in particular when observable inputs are not available. The valuation risk is addressed by the control environment at Norges Bank, which is responsible for fair value measurement.
The fair value hierarchy
All securities in the foreign exchange reserves are measured at fair value. The securities have been classified in the fair value hierarchy presented in table 6.1 Foreign exchange reserves’ investments by level of valuation uncertainty. The classification is determined by the observability of the market inputs used in the fairvalue measurement:
- Level 1 comprises assets that are valued based on unadjusted quoted prices in active markets. An active market is a market in which transactions take place with sufficient frequency and volume to provide pricing information on an ongoing basis.
- Assets and liabilities classified as Level 2 are valued using models with inputs that are either directly or indirectly observable. Inputs are considered observable when they are based on market data reflecting actual events or transactions.
- Assets classified as Level 3 are valued using models with significant use of unobservable inputs. Inputs are considered unobservable when market data are not available and the input is developed using the best information available about the assumptions that market participants would use when pricing the asset.
An overview of models and valuation techniques with their respective observable and unobservable inputs, categorised by type of instrument, is described in this note.
Significant estimate
Classification in the fair value hierarchy is based on fixed criteria, of which some of the criteria may require the use of judgement.
Table 6.1 Foreign exchange reserves’ investments by level of valuation uncertainty
|
Level 1 |
Level 2 |
Level 3 |
Total |
|||||
|
Amounts in NOK million |
31.12.2023 |
31.12.2022 |
31.12.2023 |
31.12.2022 |
31.12.2023 |
31.12.2022 |
31.12.2023 |
31.12.2022 |
|
Equities |
142 482 |
110 154 |
658 |
456 |
2 |
3 |
143 142 |
110 613 |
|
Bonds |
492 180 |
451 318 |
12 500 |
11 535 |
- |
- |
504 680 |
462 853 |
|
Financial derivatives (assets) |
3 |
15 |
- |
- |
- |
- |
3 |
15 |
|
Financial derivatives (liabilities) |
-12 |
-31 |
- |
- |
- |
- |
-12 |
-31 |
|
Other1 |
- |
- |
41 970 |
36 563 |
- |
- |
41 970 |
36 563 |
|
Total |
634 653 |
561 456 |
55 128 |
48 554 |
2 |
3 |
689 783 |
610 013 |
|
Total (percent) |
92.0% |
92.0% |
8.0% |
8.0% |
0.0% |
0.0% |
100% |
100% |
1 Other comprises other assets and liabilities limited to money market instruments, including reverse repurchase agreements, deposits in banks, short-term borrowing, unsettled trades and other assets and liabilities.
At year-end 2023, the valuation uncertainty for the foreign exchange reserves was generally unchanged compared with year-end 2022. The majority of foreign exchange reserves are associated with low valuation risk and are classified as Level 1. At year-end 2023, 99.5 percent of equity holdings and 97.5 percent of bond holdings are classified as Level 1, and valuation is thus based on quoted market prices.
Accounting policy
Transfers between levels in the fair value hierarchy are deemed to take place at the beginning of the reporting period.
Movements between levels in the hierarchy
There have been no substantial movements between levels in the fair value hierarchy.
Valuation techniques
Norges Bank has defined hierarchies for which price sources are to be used for valuation. Holdings that are included in the benchmark indices are normally valued in accordance with the index providers’ prices, while the remaining holdings of equities and bonds are valued almost exclusively using prices from other reputable external price providers. For equities and derivatives traded in active markets (Level 1), the close price is used. For bonds traded in active markets, the bid price is generally used.
The next section sets out the valuation techniques used for equities and bonds classified as Level 2 in the fair value hierarchy.
Equities (Level 2)
Equities that are valued based on models with observable inputs provided by vendors are classified as Level 2 in the fair value hierarchy. These holdings are not traded in active markets and include listed shares in companies where trading has been suspended. The valuation models take into account various observable market inputs, such as the price of comparable equity quotes, last traded price and volume.
Bonds (Level 2)
Bonds classified as Level 2 are valued based on observable market inputs from comparable issues, in addition to direct indicative or binding quotes. These holdings usually consist of less liquid bonds than those classified as Level 1, i.e. where there is not an activity volume for binding trades and a low activity volume for indicative price quotes at the measurement date.
Control environment
The control environment for fair value measurement is organised around a formalised and documented valuation policy and guidelines, which are supported by work and control procedures. The portfolios managed by Norges Bank Markets contain only liquid government securities, where valuation risk is very low. Any questions are discussed by a separate management committee.
The valuation environment has been adapted in accordance with market standards and established practices for valuation. This is implemented in practice in the form of daily valuation of all holdings. These processes are scalable to market changes and are based on internal and external data solutions.
All holdings and investments are generally valued by external, independent price providers. They have been chosen on the basis of analyses performed by the Norges Bank units responsible for valuation.
Price providers are monitored on an ongoing basis through regular discussions, controls and price challenges for individual securities. For a large portion of holdings, prices from independent price providers are based on quoted market prices. For holdings that are not sufficiently liquid for valuation to be based on quoted prices, widely accepted models are used. Observable inputs are used where possible, but in some cases, owing to illiquid markets, unobservable inputs are used.
The valuation process is subject on a daily basis to numerous controls by the valuation departments. Controls are based on defined thresholds and sensitivities, which are monitored and adjusted in accordance with prevailing market conditions. At each month-end, more extensive controls are performed to ensure valuation in accordance with fair value.
In NBIM, valuation memos and reports are prepared at each quarter-end, documenting the results of the controls performed and the most important sources of uncertainties in the valuations.
The NBIM investment meeting, which includes NBIM’s leader group, is held every quarter prior to the publication of the financial reporting. The committee reviews the documentation, discusses major pricing issues and approves the valuation.
Other investments
Norges Bank holds equity investments in the BIS and Swift, which are not part of the foreign exchange reserves. These are investments undertaken by Norges Bank in its role as Norway’s central bank and to preserve Norway’s international obligations in this area. The obligations involve long-term commitments that do not have economic gain as an objective and are not, by their nature, financial investments. This is primarily related to shares in the Bank for International Settlements (BIS) which are valued at NOK 231 million and would have been allocated to Level 3 in the fair value hierarchy. Valuation is uncertain owing to a lack of activity in the market. These shares are valued using models that use a substantial degree of non- observable inputs. See note 4 Holdings of equities and bonds for further information on equities in the BIS.
Classification of financial instruments
Financial assets are classified in three measurement categories: fair value through profit or loss (designated or mandatory), fair value through other comprehensive income (OCI) and amortised cost. The measurement category is determined at initial recognition of the asset.
Financial liabilities shall generally be measured at amortised cost, except for financial liabilities in the foreign exchange reserves and financial derivatives, which are measured at fair value through profit or loss.
The carrying amount of financial assets and liabilities measured at amortised cost is considered a reasonable estimate of fair value, thus comparable fair value amounts have not been calculated.
Table 6.2 Classification of financial instruments
|
Fair value through profit or loss |
31.12.2023 |
|||
|
Amounts in NOK million |
Designated |
Mandatory |
Amortised cost |
Total |
|
Financial assets |
||||
|
Deposits in banks |
- |
20 573 |
219 |
20 792 |
|
Secured lending |
- |
60 723 |
- |
60 723 |
|
Cash collateral posted |
- |
- |
- |
- |
|
Unsettled trades |
- |
2 020 |
- |
2 020 |
|
Equities |
231 |
140 256 |
- |
140 488 |
|
Equities lent |
- |
2 885 |
- |
2 885 |
|
Bonds |
- |
504 680 |
- |
504 680 |
|
Financial derivatives |
- |
3 |
- |
3 |
|
Lending to banks |
- |
- |
2 803 |
2 803 |
|
Claims on the IMF |
- |
- |
134 999 |
134 999 |
|
Other financial assets |
- |
98 |
573 |
671 |
|
Total financial assets |
231 |
731 238 |
138 594 |
870 064 |
|
Financial liabilities |
||||
|
Short-term borrowing |
- |
- |
- |
- |
|
Secured borrowing |
29 |
- |
- |
29 |
|
Unsettled trades |
38 894 |
- |
- |
38 894 |
|
Financial derivatives |
- |
12 |
- |
12 |
|
Deposits from banks |
- |
- |
58 355 |
58 355 |
|
Deposits from the Treasury |
- |
- |
281 816 |
281 816 |
|
Notes and coins in circulation |
- |
- |
39 724 |
39 724 |
|
Liabilities to the IMF |
- |
- |
107 979 |
107 979 |
|
Other financial liabilities |
2 520 |
- |
2 629 |
5 149 |
|
Total financial liabilities |
41 443 |
12 |
490 503 |
531 958 |
|
Fair value through profit or loss |
31.12.2022 |
|||
|
Amounts in NOK million |
Designated |
Mandatory |
Amortised cost |
Total |
|
Financial assets |
||||
|
Deposits in banks |
- |
32 110 |
224 |
32 334 |
|
Secured lending |
- |
18 685 |
- |
18 685 |
|
Cash collateral posted |
- |
6 |
- |
6 |
|
Unsettled trades |
- |
917 |
- |
917 |
|
Equities |
217 |
106 626 |
- |
106 843 |
|
Equities lent |
- |
3 987 |
- |
3 987 |
|
Bonds |
- |
462 853 |
- |
462 853 |
|
Financial derivatives |
- |
15 |
- |
15 |
|
Lending to banks |
- |
- |
15 895 |
15 895 |
|
Claims on the IMF |
- |
- |
126 560 |
126 560 |
|
Other financial assets |
- |
121 |
408 |
529 |
|
Total financial assets |
217 |
625 320 |
143 087 |
768 624 |
|
Financial liabilities |
||||
|
Short-term borrowing |
- |
|||
|
Secured borrowing |
37 |
- |
- |
37 |
|
Unsettled trades |
13 469 |
- |
- |
13 469 |
|
Financial derivatives |
- |
31 |
- |
31 |
|
Deposits from banks |
- |
- |
26 821 |
26 821 |
|
Deposits from the Treasury |
- |
- |
304 606 |
304 606 |
|
Notes and coins in circulation |
- |
- |
40 075 |
40 075 |
|
Liabilities to the IMF |
- |
- |
103 378 |
103 378 |
|
Other financial liabilities |
1 770 |
- |
2 149 |
3 919 |
|
Total financial liabilities |
15 276 |
31 |
477 029 |
492 336 |
Note 7 Investment risk
The aim of the management of the foreign exchange reserves is to attain the highest possible return within established guidelines and risk limits. Investment risk is mitigated by managing and controlling the investment management risks to which Norges Bank is exposed. In addition, a well-defined division of roles and responsibilities has been established for the risk management process.
Organisation
The Executive Board has the overarching responsibility for risk management at Norges Bank and has established principles for risk management in Central Banking Operations, including financial risk. The Executive Board also lays down the overarching principles for the management of Norges Bank’s foreign exchange reserves, including strategic asset allocation, benchmark indexes, investment universe and overarching risk measures.
The Risk and Investment Committee is a preparatory and advisory body to strengthen and improve the Executive Board’s work related to investment strategy and risk limits for the foreign exchange reserves.
The Governor is responsible for the management of the foreign exchange reserves. The Governor has operationalised the Executive Board’s principles in guidelines issued for the management for the equity portfolio, fixed income portfolio and petroleum buffer portfolio. Operational responsibility for management has been delegated to NBIM and Norges Bank Markets, respectively, with supplemental guidelines.
The division of roles and responsibilities in the risk management system is organised along three lines of defence. The first line of defence comprises the operational risk management and control activities that are performed by the operating units. The second line of defence comprises the central risk management and compliance functions, which are tasked with advising and supporting the operating units. Their task is to challenge the assessments of the first line of defence and ensure that the first line of defence performs adequate controls. The third line of defence is the internal audit function. Internal audit is placed under the Executive Board, independently of the administration, and shall assess whether risk management and compliance function as required.
Framework
The composition of the foreign exchange reserves and associated risk depends primarily on the strategic equity allocation and the portfolios’ benchmark indexes, which are both defined by the Executive Board. The strategic equity allocation of the total equity and fixed income portfolio is 20 percent.
The benchmark index for the equity portfolio is a tax-adjusted version of the FTSE ALL World Developed Market Index, limited to euro area countries, the US, the UK, Japan, Canada, Australia, Switzerland, Sweden and Denmark. The equity portfolio may be invested in cash deposits and equities listed on a regulated and recognised exchange.
The benchmark index for the fixed income portfolio is a market-weighted index of all nominal government bonds with a residual maturity of between one month and 10 years issued by France, Germany, Japan, China, the UK and the US. The fixed income portfolio may be invested in cash deposits, Treasury bills and government bonds issued by the countries in the benchmark index.
No benchmark index has been set for the petroleum buffer portfolio. The purpose of the portfolio is to provide for an appropriate management of the government’s need for converting foreign currency and NOK and for any transfers to and from the GPFG. The petroleum buffer portfolio is invested in short-term fixed income instruments.
Through management of the foreign exchange reserves, Norges Bank is exposed to various types of financial risk, including market risk, credit risk and counterparty risk. For the management of the foreign exchange reserves, risk management is defined as the management of these risks. The units with operational responsibility for management have the responsibility for managing risk in accordance with current principles and guidelines.
Risk management process
Norges Bank employs several measurement methodologies, processes and systems to control investment risk. Robust and widely accepted risk management systems and processes are complemented by internally developed measurement methods and processes.
Market risk
Market risk is defined as the risk of loss or a change in the market value of the portfolio, or parts of the portfolio, as a result of changes in the equity, fixed income or foreign exchange market, including changes in credit premiums.
Continuous monitoring, measurement and assessment of market risk are performed along multiple dimensions. Combining different and complementary risk measures provides a better insight into the portfolios’ risk profile. Norges Bank measures both absolute and relative risk for the investments in the portfolios.
Allocation by geography and industry
The foreign exchange reserves primarily contain investments in sovereign bonds and listed companies. In accordance with the investment management framework, the investments are allocated to several countries and currencies. The following tables show investments broken down by geography and industry.
Table 7.1 Foreign exchange reserves’ allocation by asset class and region/sovereign issuer
|
31.12.2023 |
31.12.2022 |
||||
|
Amounts in NOK million |
Market value in percent |
Market value |
Market value in percent |
Market value |
|
|
Equity portfolio |
|||||
|
Equities |
Americas |
72% |
103 563 |
71% |
78 185 |
|
Europe |
18% |
25 883 |
19% |
21 005 |
|
|
Asia and Oceania |
10% |
13 683 |
10% |
11 255 |
|
|
Total equity portfolio |
100% |
143 129 |
100% |
110 445 |
|
|
Fixed income portfolio |
|||||
|
Bonds |
US |
49% |
253 090 |
49% |
233 101 |
|
France |
18% |
92 647 |
18% |
85 726 |
|
|
Germany |
15% |
77 684 |
15% |
70 521 |
|
|
UK |
7% |
35 794 |
7% |
32 443 |
|
|
Japan |
7% |
35 227 |
7% |
31 708 |
|
|
China |
2% |
10 238 |
2% |
9 354 |
|
|
Total bonds |
98% |
504 680 |
98% |
462 853 |
|
|
Deposits |
2% |
6 593 |
2% |
9 093 |
|
|
Total fixed income portfolio |
100% |
511 273 |
100% |
471 946 |
|
|
Petroleum buffer portfolio |
|||||
|
Deposits |
Americas |
10% |
3 700 |
57% |
15 835 |
|
Europe |
90% |
31 681 |
43% |
11 787 |
|
|
Total petroleum buffer portfolio |
100% |
35 381 |
100% |
27 622 |
|
|
Total foreign exchange reserves |
100% |
689 783 |
100% |
610 013 |
|
Table 7.2 Equity portfolio by industry
|
31.12.2023 |
31.12.2022 |
|||
|
Amounts in NOK million |
Market value |
Share |
Market value |
Share |
|
Technology |
38 389 |
27% |
22 377 |
20% |
|
Consumer discretionary |
21 211 |
15% |
15 374 |
14% |
|
Financials |
19 541 |
14% |
16 167 |
15% |
|
Industrials |
18 625 |
13% |
14 751 |
13% |
|
Health care |
17 747 |
12% |
16 532 |
15% |
|
Consumer goods |
7 689 |
5% |
7 366 |
7% |
|
Energy |
4 892 |
3% |
4 827 |
4% |
|
Basic materials |
4 560 |
3% |
3 888 |
4% |
|
Real estate |
3 558 |
2% |
2 968 |
3% |
|
Telecommunications |
3 495 |
2% |
3 172 |
3% |
|
Utilities |
3 313 |
2% |
3 097 |
3% |
|
Other1 |
110 |
0% |
-74 |
0% |
|
Total equity portfolio |
143 129 |
100% |
110 445 |
100% |
|
Of which presented in the balance sheet on the line Equities |
140 244 |
106 458 |
||
|
Of which presented in the balance sheet on the line Equities lent |
2 885 |
3 987 |
||
1 Includes other asset and liability items in the equity portfolio
Table 7.3 Foreign exchange reserves’ 10 largest holdings of equities
|
31.12.2023 |
|||
|
Amounts in NOK million |
Sector |
Market value |
Share1 |
|
Apple Inc |
Technology |
7 107 |
5.0% |
|
Microsoft Corp |
Technology |
7 007 |
4.9% |
|
Alphabet Inc |
Technology |
3 846 |
2.7% |
|
Amazon.com Inc |
Consumer discretionary |
3 426 |
2.4% |
|
NVIDIA Corp |
Technology |
2 945 |
2.1% |
|
Meta Platforms Inc |
Technology |
1 961 |
1.4% |
|
Tesla Inc |
Consumer discretionary |
1 716 |
1.2% |
|
Berkshire Hathaway Inc |
Financials |
1 625 |
1.1% |
|
Eli Lilly & Co |
Health care |
1 234 |
0.9% |
|
JPMorgan Chase & Co |
Financials |
1 229 |
0.9% |
|
Total |
32 097 |
22.4% |
|
31.12.2022 |
|||
|
Amounts in NOK million |
Sector |
Market value |
Share1 |
|
Apple Inc |
Technology |
4 593 |
4.2% |
|
Microsoft Corp |
Technology |
4 220 |
3.8% |
|
Alphabet Inc |
Technology |
2 366 |
2.1% |
|
Amazon.com Inc |
Consumer discretionary |
1 759 |
1.6% |
|
Berkshire Hathaway Inc |
Financials |
1 317 |
1.2% |
|
UnitedHealth Group Inc |
Health care |
1 168 |
1.1% |
|
Johnson & Johnson |
Health care |
1 093 |
1.0% |
|
Exxon Mobil Corp |
Energy |
1 066 |
1.0% |
|
JPMorgan Chase & Co |
Financials |
924 |
0.8% |
|
Procter & Gamble Co |
Consumer goods |
842 |
0.8% |
|
Total |
19 349 |
17.5% |
1 Percentage of the total equity portfolio.
Foreign exchange rate risk
Foreign exchange rate risk is the risk that the value of financial instruments will change owing to movements in foreign exchange rates. Norges Bank has, primarily through the foreign exchange reserves, invested in securities issued and traded in currencies other than NOK. Consequently, the value of these investments is exposed to foreign exchange rate risk. See note 8 Currency for further information on the exchange rates used and the currency distribution in the foreign exchange reserves.
Interest rate risk
A substantial portion of the foreign exchange reserves is invested in sovereign bonds issued by the US, Germany, France, the UK, Japan and China. The value of fixed income instruments is affected by changes in interest rates in these countries. The investments’ interest rate sensitivity is measured by modified duration. At year-end 2023, modified duration was 3.54 percent for the fixed income portfolio. In isolation, this means that a 1 percent fall in yields corresponds to a 3.54 percent rise in bond prices. By comparison, modified duration at year-end 2022 was 3.59.
Volatility and correlation risk
Norges Bank uses models to quantify the risk of value changes associated with the foreign exchange reserves. This is measured by the standard deviation of the return and is usually referred to as volatility. Expected volatility is defined as one standard deviation. Absolute volatility provides an estimate of how much the portfolio value can be expected to change in the course of a year, given the current portfolio composition. Relative volatility (tracking error) provides an indication of how much the portfolio is expected to fluctuate compared with its benchmark index. In accordance with the Executive Board’s principles for management of the foreign exchange reserves, the maximum expected relative volatility is set at 50 basis points for the equity and fixed income portfolios, respectively. This implies that that the relative return on the portfolios is expected to lie within the range of ±50 basis points in two out of three years.
The risk models make it possible to estimate the risk in a portfolio across asset classes, markets, currencies, securities and instruments. Risk is then expressed as a single numerical value, which takes into account the correlation between risk factors. The models use historical relationships, which provide reliable forecast in markets that are not experiencing substantial changes in volatility and correlation. Estimates will be less reliable in periods marked by significant market movements. Regular testing of the models is performed to validate the model’s ability to estimate risk. Reported risk measures are annualised.
Table 7.4 Portfolio risk, Expected volatility
|
Expected volatility |
||||||||
|
31.12.2023 |
Min 2023 |
Max 2023 |
Avg. 2023 |
31.12.2022 |
Min 2022 |
Max 2022 |
Avg. 2022 |
|
|
Equity portfolio |
14.0% |
12.7% |
16.0% |
13.8% |
15.2% |
14.6% |
15.5% |
15.1% |
|
Fixed income portfolio |
10.7% |
9.0% |
14.6% |
11.6% |
14.6% |
10.3% |
15.0% |
13.3% |
|
Expected relative volatility, basis points |
||||||||
|
31.12.2023 |
Min 2023 |
Max 2023 |
Avg. 2023 |
31.12.2022 |
Min 2022 |
Max 2022 |
Avg. 2022 |
|
|
Equity portfolio |
5 |
5 |
10 |
7 |
6 |
4 |
9 |
6 |
|
Fixed income portfolio |
2 |
1 |
3 |
2 |
3 |
2 |
4 |
2 |
At year-end 2023, expected absolute volatility was measured at 14.0 percent for the equity portfolio and 10.7 percent for the fixed income portfolio. This means that value fluctuations on the order of NOK 20 billion and NOK 55 billion, respectively, can be expected in two out of three years. In these cases, the calculation of expected value fluctuations excludes expected returns. At year-end 2022, the corresponding expected value fluctuations were NOK 17 billion and NOK 69 billion, respectively. At year-end 2023, expected relative volatility for the equity and fixed income portfolios was 5 and 2 basis points, respectively, compared with 6 and 3 basis points, respectively, at year-end 2022.
Credit risk
Credit risk is defined as the risk of loss due to an issuer being unable to meet its payment obligations.
The fixed income portfolio comprises only sovereign bonds issued by the US, Germany, France, the UK, Japan and China, all rated investment grade by external credit rating agencies. The credit risk of bond investments in the foreign exchange reserve is therefore regarded as low.
Table 7.5 Bonds specified by sovereign issuer and credit rating
|
31.12.2023 |
31.12.2022 |
||||
|
Amounts in NOK million |
Credit rating |
Market value |
Share |
Market value |
Share |
|
Germany |
AAA |
77 684 |
15% |
70 521 |
15% |
|
US |
AA+ |
253 090 |
50% |
233 101 |
50% |
|
France |
AA |
92 647 |
18% |
85 726 |
19% |
|
UK |
AA- |
35 794 |
7% |
32 443 |
7% |
|
Japan |
A+ |
10 238 |
2% |
9 354 |
2% |
|
China |
A+ |
35 227 |
7% |
31 708 |
7% |
|
Total bonds |
504 680 |
100% |
462 853 |
100% |
|
Counterparty risk
Counterparty risk is defined as the risk of loss due to a counterparty default on its obligations. Counterparty risk includes the risk associated with counterparty insolvency, settlement risk and custodial risk. Counterparty risk is primarily related to securities lending, reverse repurchase agreement, unsecured bank deposits, foreign exchange contracts and futures.
In the management of the foreign exchange reserves a large number of counterparties are used to limit concentration. To reduce counterparty exposure, requirements have been set for the credit quality of counterparties. Norges Bank’s counterparties usually have credit rating from several independent credit rating agencies. An internal credit evaluation can only be used as the basis for counterparty approval in instances when the counterparty risk is considered very low. Credit ratings of Norges Bank’s counterparties are monitored and complemented by alternative credit risk indicators.
Counterparty risk is also reduced by setting exposure limits for individual counterparties. Netting agreements are in place for trades in securities lending, currency contracts and reverse repurchase agreements, and there are collateral requirements for counterparty net positions with a positive market value. Minimum requirements have also been set relating to the credit quality, time to maturity and concentration of the collateral. Netting and collateral agreements are entered into for all counterparties approved for these types of trades. For securities lending transactions, a premium is added to the market value to reflect the position’s volatility, and these positions are also adjusted for netting and actual collateral received and posted when determining net exposure. See note 10 Collateral and offsetting for further information.
At year-end 2023, counterparty risk is regarded as low. Collateral has been posted in excess of the exposure in the open reverse repurchase agreements, and unsecured bank deposits almost exclusively comprise deposits with the Federal Reserve (US dollar) or with other central banks.
Table 7.6 Counterparties1 by credit rating
|
Non brokers |
Brokers |
|||
|
31.12.2023 |
31.12.2022 |
31.12.2023 |
31.12.2022 |
|
|
AAA |
3 |
3 |
- |
- |
|
AA |
23 |
24 |
23 |
17 |
|
A |
56 |
57 |
36 |
38 |
|
BBB |
9 |
12 |
18 |
15 |
|
BB |
2 |
2 |
12 |
11 |
|
B |
- |
- |
5 |
4 |
|
Total |
93 |
98 |
94 |
85 |
1 Counterparties in the category “Brokers” are defined as equity and bond brokers and futures brokers. Counterparties in other transactions are classified as “non brokers”. In cases where a counterparty is used for trading securities and for other transactions, the same counterparty will be included in both categories. As counterparties are counted per legal entity, several counterparties may be included per corporate group. Counterparties that are central banks are not included in the table.
Leverage
Leverage may be used to ensure effective management of the investments in the equity portfolio, but not with the aim of increasing the economic exposure to risky assets. Leverage is the difference between total net exposure and the market value of the portfolio. Leverage in the portfolio was 0.09 percent at year-end 2023, compared with 0.11 percent at year-end 2022.
Sale of securities that Norges Bank does not own (“short sale”)
The sale of securities that Norges Bank does not own is not permitted in the management of the foreign exchange reserves.
Liquidity risk
Liquidity risk is the risk of being unable to meet financial obligations at the agreed time. As a central bank, Norges Bank is not exposed to this type of liquidity risk in local currency. There is little or no liquidity risk associated with the Bank’s liabilities, which are primarily in NOK. The majority of assets are held in foreign currency and are highly liquid financial instruments. They may be realised at short notice without a substantial change in value, and the liquidity risk associated with them is therefore regarded as low. Assets in foreign currency are regarded as sufficient for meeting foreign currency obligations.
Climate risk
Climate risk is defined as the risk related to future physical climate changes and changes related to the transition to a low-carbon society.
The Executive Board has decided that the equity portfolio in the foreign exchange reserves shall be managed according to the same principles and strategies for responsible management as the equity investments in the GPFG. Among other things, it means that the Bank’s work with responsible management is based on a long-term goal that the companies in the investment portfolio align their operations with the goals of the Paris Agreement. The fixed income portfolio in the foreign exchange reserves consists exclusively of government bonds, and climate related issues will have little effect on the composition of the bond portfolio.
Other risk
Credit risk associated with lending to banks
Credit and counterparty risk associated with F-loans and intraday/overnight loans (D-loans) is managed by requiring collateral for such loans, in the form of securities pledged to Norges Bank. The total lending facility for banks is determined by collateral pledged to Norges Bank, F-deposits and deposits with the Scandinavian Cash Pool.
Norges Bank stipulates more detailed terms for pledging securities and fund units as collateral for loans in Norges Bank pursuant to section 6 of the Regulation on the Access of Banks to Borrowing and Deposit Facilities in Norges Bank etc. The current guidelines have been issued in Norges Bank’s Circular No. 5/2022 from November 2022. See note 12 Loans and deposits for more information.
The rules for pledging collateral are intended to limit Norges Bank’s risk associated with lending to banks and facilitate appropriate levels of bank borrowing. Risk is limited, since only high-quality securities are eligible and since the loan value is lower than the market value of the collateral (haircut).
Loans to the IMF
The Kingdom of Norway is a member of the IMF. Norges Bank shall, in accordance with the Central Bank Act, manage the country’s rights and obligations as a member of the IMF. This includes making currency available for IMF lending. Norges Bank considers the risk related to IMF loans to be low. See note 14 International Monetary Fund (IMF) for further information.
Expected credit losses
Financial assets measured at amortised cost are allocated on the reporting date to Stages 1, 2 or 3.
On initial recognition, assets are allocated to Stage 1. Stage 1 requires an estimation of a 12-month expected credit loss. The expected loss in Stage 1 reflects the entire loss on an asset weighted by the probability that the loss will occur in the next 12 months. On each reporting date, an assessment shall be made of whether the credit risk of an asset has increased significantly since initial recognition. If this is the case, the exposure must be moved to Stages 2 or 3. Stages 2 and 3 require estimation of an expected credit loss over the entire life of the exposure.
Table 7.7 Expected credit loss for financial assets measured at amortised cost
|
31.12.2023 |
31.12.2022 |
|||
|
Amounts in NOK million |
Carrying amount |
Expected credit loss |
Carrying amount |
Expected credit loss |
|
Loans to and net claims on the IMF |
27 020 |
- |
23 182 |
- |
|
Lending to banks |
2 803 |
- |
15 895 |
- |
|
Other |
405 |
- |
237 |
- |
|
Total |
30 228 |
- |
39 314 |
- |
No loss provisions have been made for expected credit losses at year-end 2023 and 2022.
Note 8 Currency
Critical accounting judgement
The management of Norges Bank has concluded that the Bank’s functional currency is the Norwegian krone (NOK), since this is the dominant currency in the Bank’s underlying activities.
Accounting policy
Foreign currency transactions are recognised in the financial statements using the exchange rate prevailing on the transaction date. Assets and liabilities in foreign currencies are translated into NOK using the exchange rate at the balance sheet date. The foreign exchange element, which is linked to realised and unrealised gains and losses on assets and liabilities, is disaggregated in the income statement and presented on a separate line, Foreign exchange gain/-loss.
Accounting policy
Gains and losses on financial instruments are due to changes in the price of the instrument (security element) and changes in foreign exchange rates (foreign exchange element). These are presented on separate lines in the income statement. The method for allocating total gains and losses in NOK to a security element and a foreign exchange element is described below.
Foreign exchange element
Unrealised gains or losses due to changes in foreign exchange rates are calculated based on the original cost of the holding in local currency and the change in the foreign exchange rate from the time of purchase until the balance sheet date. If the holding has been purchased in a previous period, gains and losses recognised in the income statement in previous periods are deducted to arrive at the gain or loss for the current period. For realised gains or losses, the foreign exchange rate on the date of sale is used for calculating realised gains or losses.
Security element
Unrealised gains or losses from changes in the security price are calculated based on the change in the instrument’s price from the purchase date to the balance sheet date and the closing exchange rate at the balance sheet date. If the holding was acquired in a previous period, gains and losses recognised in the income statement in previous periods are deducted to arrive at the gain or loss from security.
Table 8.1 Foreign exchange reserves by currency
|
31.12.2023 |
||||||
|
Amounts in NOK million |
USD |
EUR |
GBP |
JPY |
Other |
Total |
|
Financial assets |
||||||
|
Deposits in banks |
10 099 |
8 422 |
668 |
1 378 |
6 |
20 573 |
|
Secured lending |
34 781 |
10 403 |
15 539 |
- |
- |
60 723 |
|
Cash collateral posted |
- |
- |
- |
- |
- |
- |
|
Unsettled trades |
- |
1 070 |
372 |
505 |
73 |
2 020 |
|
Equities |
100 174 |
13 237 |
5 358 |
8 484 |
13 003 |
140 256 |
|
Equities lent |
394 |
205 |
11 |
2 038 |
237 |
2 885 |
|
Bonds |
253 090 |
170 331 |
35 794 |
35 227 |
10 238 |
504 680 |
|
Financial derivatives |
3 |
- |
- |
- |
- |
3 |
|
Other financial assets |
2 |
46 |
- |
- |
50 |
98 |
|
Total financial assets |
398 543 |
203 714 |
57 742 |
47 632 |
23 607 |
731 238 |
|
Financial liabilities |
||||||
|
Secured borrowing |
29 |
- |
- |
- |
- |
29 |
|
Unsettled trades |
22 065 |
8 050 |
8 074 |
473 |
233 |
38 895 |
|
Financial derivatives |
3 |
9 |
- |
- |
- |
12 |
|
Other financial liabilities |
2 317 |
96 |
20 |
11 |
75 |
2 519 |
|
Total financial liabilities |
24 414 |
8 155 |
8 094 |
484 |
308 |
41 455 |
|
Net foreign exchange reserves |
374 129 |
195 559 |
49 648 |
47 148 |
23 299 |
689 783 |
|
31.12.2022 |
||||||
|
Amounts in NOK million |
USD |
EUR |
GBP |
JPY |
Other |
Total |
|
Financial assets |
||||||
|
Deposits in banks |
18 840 |
10 005 |
648 |
2 318 |
298 |
32 109 |
|
Secured lending |
6 443 |
7 738 |
4 503 |
- |
- |
18 685 |
|
Cash collateral posted |
6 |
- |
- |
- |
- |
6 |
|
Unsettled trades |
- |
245 |
- |
672 |
- |
917 |
|
Equities |
74 647 |
10 511 |
4 072 |
6 693 |
10 703 |
106 626 |
|
Equities lent |
1 076 |
407 |
333 |
1 744 |
427 |
3 987 |
|
Bonds |
233 101 |
156 248 |
32 443 |
31 708 |
9 354 |
462 853 |
|
Financial derivatives |
1 |
-1 |
0 |
11 |
3 |
15 |
|
Other financial assets |
1 |
78 |
0 |
0 |
42 |
122 |
|
Total financial assets |
334 115 |
185 232 |
41 999 |
43 146 |
20 827 |
625 320 |
|
Financial liabilities |
||||||
|
Secured borrowing |
37 |
- |
- |
- |
- |
37 |
|
Unsettled trades |
3 014 |
7 593 |
2 612 |
250 |
- |
13 469 |
|
Financial derivatives |
11 |
17 |
4 |
- |
- |
31 |
|
Other financial liabilities |
1 503 |
44 |
22 |
- |
201 |
1 770 |
|
Total financial liabilities |
4 564 |
7 653 |
2 638 |
250 |
201 |
15 307 |
|
Net foreign exchange reserves |
329 551 |
177 579 |
39 361 |
42 896 |
20 626 |
610 013 |
Total comprehensive income is affected by exchange rate movements. A 1 percent depreciation of NOK against all currency crosses will result in a positive impact on the income statement of around NOK 7 billion, and a corresponding negative impact on the income statement from a 1 percent appreciation of NOK.
Table 8.2 Exchange rates
|
31.12.2023 |
31.12.2022 |
Change1 |
|
|
US dollar |
10.16 |
9.85 |
3.1% |
|
Euro |
11.22 |
10.51 |
6.7% |
|
British pound |
12.95 |
11.85 |
9.3% |
|
Japanese yen |
0.07 |
0.07 |
-3.5% |
|
Special Drawing Rights (SDR)2 |
13.65 |
13.15 |
3.8% |
1 Percentage change in the exchange rate.
2 See note 14 International Monetary Fund (IMF) for further description
Note 9 Secured lending and borrowing
Secured lending and borrowing comprises transactions in which securities or cash is transferred or received secured by other securities or cash. Transactions are carried out under various agreements such as securities lending agreements and reverse repurchase agreements.
Table 9.1 Income/expense from secured lending and borrowing
Accounting policy
Income and expense from secured lending and borrowing transactions
Income and expenses from secured lending and borrowing transactions primarily comprise interest and net fees, which are recognised on a straight-line basis over the term of the agreement. This is presented in the income statement as Income/-expense from secured lending and Income/-expense from secured borrowing, respectively.
|
Amounts in NOK million |
2023 |
2022 |
|
Income/-expense from secured lending |
1 283 |
135 |
|
Income/-expense from secured borrowing |
- |
- |
|
Net income/-expense from secured lending and borrowing |
1 283 |
135 |
The purpose of secured lending and borrowing is to generate additional income from securities and cash holdings as a part of liquidity management and contributes to efficient market pricing. The share of securities lent shall not exceed 20 percent of the equity portfolio’s market value. Lending is governed by demand for the equities in the portfolio and market pricing. All lending is secured by sufficient collateral received.
Accounting policy
Transferred financial assets
Securities lent to counterparties in connection with secured lending and borrowing are not derecognised when the agreement is entered into, as the derecognition criteria are not met. As the counterparty has the right to sell or pledge the security, the security is considered transferred. Transferred securities are presented on a separate line in the balance sheet, as Equities lent. During the lending period, the accounting for the underlying securities is in accordance with accounting policies for the relevant securities.
Secured lending
Cash collateral posted to counterparties is derecognised. A corresponding receivable reflecting the cash amount that will be returned is recognised in the balance sheet as an asset, Secured lending. This asset is measured at fair value.
Secured borrowing
Cash collateral received is recognised as Deposits in banks together with a corresponding liability, Secured borrowing. This liability is measured at fair value.
Collateral received in the form of securities
Collateral received in the form of securities, where Norges Bank has the right to sell or pledge the security, is not recognised in the balance sheet, unless reinvested.
Table 9.2 Lending associated with securities financing transactions
|
Amounts in NOK million |
31.12.2023 |
31.12.2022 |
|
Secured lending |
60 723 |
18 685 |
|
Of which unsettled trades (liability) |
32 906 |
9 845 |
|
Secured lending excluding unsettled trades |
27 817 |
8 840 |
|
Associated collateral in the form of securities (off-balance sheet) |
||
|
Equities received as collateral |
- |
- |
|
Bonds received as collateral |
29 562 |
9 216 |
|
Total security collateral received related to lending |
29 562 |
9 216 |
Table 9.3 Transferred financial assets and secured borrowing
|
Amounts in NOK million |
31.12.2023 |
31.12.2022 |
|
Transferred financial assets |
||
|
Equities lent |
2 885 |
3 987 |
|
Total transferred financial assets |
2 885 |
3 987 |
|
Associated cash collateral, recognised as liability |
||
|
Secured borrowing |
29 |
37 |
|
Of which unsettled trades (assets) |
- |
- |
|
Secured borrowing excluding unsettled trades |
29 |
37 |
|
Associated collateral in the form of securities (off-balance sheet) |
||
|
Equities received as collateral |
1 922 |
2 685 |
|
Bonds received as collateral |
1 170 |
1 628 |
|
Total security collateral received related to transferred financial assets |
3 092 |
4 313 |
Cash collateral received is reinvested in its entirety. No securities received as collateral were reinvested at year-end 2023 or 2022. Therefore, these securities are not recognised in the balance sheet.
Note 10 Collateral and offsetting
Accounting policy
Cash collateral, derivative transactions
Cash collateral posted in connection with derivative transactions is derecognised. A corresponding receivable reflecting the cash amount that will be returned is recognised in the balance sheet as Cash collateral posted. Cash collateral received in connection with derivative transactions is recognised as Deposits in banks together with a corresponding liability, Cash collateral received. Both Cash collateral posted and Cash collateral received are measured at fair value.
Offsetting
Financial assets and liabilities are offset and presented net in the balance sheet when there is a legally enforceable right to offset and an intention to settle on a net basis or realise the asset and settle the liability as a whole.
Collateral
The balance sheet lines Cash collateral posted and Cash collateral received are exclusively associated with derivative transactions. In connection with secured lending and borrowing transactions, collateral will be posted or received in the form of securities or cash, see note 9 Secured lending and borrowing for further information.
Offsetting
For various counterparties and transaction types, cash collateral will be both posted to and received from the same counterparty. Therefore, received cash collateral can be netted against posted cash collateral and vice-versa, as shown in table 10.1 Assets and liabilities subject to netting agreements. The table shows an overview of financial assets and liabilities, the effects of legally enforceable netting agreements and related collateral to reduce credit risk. The column Amount in the balance sheet subject to netting shows the carrying amounts of financial assets and liabilities that are subject to legally enforceable netting agreements. These amounts are adjusted for effects of potential netting of recognised financial assets and liabilities, together with posted or received cash collateral, with the same counterparty. The remaining net exposure is presented in the column Amount after netting and collateral.
In the event of counterparty default, a collective settlement between Norges Bank and the bankruptcy estate could be performed for certain groups of instruments, irrespective of whether the instruments belong to the GPFG or Norges Bank’s foreign exchange reserves. Such cross nettings will be settled between these portfolios, but are therefore not adjusted for in this table.
Table 10.1 Assets and liabilities subject to netting agreements
|
31.12.2023 |
|||||||
|
Amounts subject to enforceable netting agreements |
|||||||
|
Amounts in NOK million |
Gross amonunt as recognised in the balance sheet |
Amount in the balance sheet not subject to enforceable netting agreements |
Amount in the balance sheet subject to netting |
Amount related to same counterparty |
Cash collateral (recognised) |
Security collateral (not recognised) |
Amount after netting and collateral |
|
Assets |
|||||||
|
Secured lending |
60 723 |
32 906 |
27 817 |
- |
- |
27 817 |
- |
|
Financial derivatives |
3 |
3 |
- |
- |
- |
- |
|
|
Total |
60 726 |
32 909 |
27 817 |
- |
- |
27 817 |
- |
|
Liabilities |
|||||||
|
Secured borrowing |
29 |
- |
29 |
- |
- |
29 |
- |
|
Financial derivatives |
12 |
12 |
- |
- |
- |
- |
|
|
Total |
41 |
12 |
29 |
- |
- |
29 |
- |
|
31.12.2022 |
|||||||
|
Amounts subject to enforceable netting agreements |
|||||||
|
Amounts in NOK million |
Gross amonunt as recognised in the balance sheet |
Amount in the balance sheet not subject to enforceable netting agreements |
Amount in the balance sheet subject to netting |
Amount related to same counterparty |
Cash collateral (recognised) |
Security collateral (not recognised) |
Amount after netting and collateral |
|
Assets |
|||||||
|
Secured lending |
18 685 |
9 845 |
8 840 |
- |
- |
8 840 |
- |
|
Financial derivatives |
15 |
15 |
- |
- |
- |
- |
- |
|
Total |
18 700 |
9 860 |
8 840 |
- |
- |
8 840 |
- |
|
Liabilities |
|||||||
|
Secured borrowing |
37 |
- |
37 |
- |
- |
37 |
- |
|
Financial derivatives |
31 |
31 |
- |
- |
- |
- |
- |
|
Total |
68 |
31 |
37 |
- |
- |
37 |
- |
Note 11 Deposits in banks
Accounting policy
Deposits in banks are primarily measured at fair value through profit or loss since they are associated with the management of the foreign exchange reserves. Deposits working accounts are not associated with the management of the foreign exchange reserves and are measured at amortised cost.
Accrued interest on deposits at year-end are included in this balance sheet line.
Norges Bank’s deposits in banks are primarily associated with the management of the foreign exchange reserves. Different types of deposits are used for this purpose, and the aim of foreign currency deposits is to attain the highest possible return, at the same time as the funds remain liquid for contingency purposes.
Table 11.1 Deposits in banks
|
Amounts in NOK million |
31.12.2023 |
31.12.2022 |
|
Nostro foreign banks |
15 924 |
23 527 |
|
Time deposits foreign banks |
4 321 |
8 372 |
|
Margin deposits futures |
330 |
214 |
|
Fixed-rate deposits BIS |
- |
- |
|
Deposits working accounts |
217 |
221 |
|
Total deposits in banks |
20 792 |
32 334 |
Table 11.2 Interest income from deposits in banks
|
Amounts in NOK million |
2023 |
2022 |
|
Interest income on nostro foreign banks |
371 |
24 |
|
Interest income on time deposits foreign banks |
2 574 |
1502 |
|
Interest income on margin deposits futures |
8 |
2 |
|
Interest income on fixed-rate deposits BIS |
8 |
- |
|
Interest income on deposits working accounts |
2 |
1 |
|
Total interest income from deposits in banks |
2 963 |
1 529 |
Nostro foreign banks
Nostro foreign banks comprise foreign currency deposits in foreign banks, central banks and the BIS. Nostro account overdrafts are normally to be avoided, and any overdrafts shall be covered immediately.
Time deposits foreign banks
Time deposits foreign banks are short-term deposits with the BIS or other approved central banks at an agreed interest rate. Deposits are primarily in euro and US dollar.
Margin deposits futures
Margin deposits futures consist of liquidity placed with the Bank’s futures broker.
Fixed-rate deposits BIS
Norges Bank may place deposit at the BIS at an agreed fixed interest rate with a maximum term of three months. Fixed-rate deposits are primarily in euro.
Deposits working account
Deposits working account primarily include deposits in foreign accounts used for operations (payroll and invoice management) by NBIM’s foreign offices.
Note 12 Loans and deposits
Accounting policy
At initial recognition, loans to banks are recognised in the balance sheet at fair value. There are no establishment fees or other directly attributable transaction costs. Subsequent measurement is at amortised cost, where the effective interest is recognised under the line Interest income from lending to banks in the income statement. If there is an indication that an impairment loss has been incurred, the amount of the loss is measured as the difference between the carrying amount and the present value of estimated future cash flows. The carrying amount of the engagement is reduced, and the amount of the loss for the period is recognised in profit or loss.
At initial recognition, Deposits from banks and Deposits from the Treasury are recognised in the balance sheet at fair value. Subsequent measurement is at amortised cost, where the effective interest is recognised under the line Interest expense on deposits from banks and the Treasury in the income statement.
Table 12.1 Lending to banks
|
Amounts in NOK million |
31.12.2023 |
31.12.2022 |
|
Fixed-rate loans to banks |
2 803 |
15 895 |
|
Total lending to banks |
2 803 |
15 895 |
Table 12.2 Deposits from banks
|
Amounts in NOK million |
31.12.2023 |
31.12.2022 |
|
Sight and reserve deposits from banks |
37 955 |
26 353 |
|
Fixed-rate deposits from banks |
20 007 |
- |
|
Other deposits |
393 |
468 |
|
Deposits from banks |
58 355 |
26 821 |
Table 12.3 Deposits from the Treasury
|
Amounts in NOK million |
31.12.2023 |
31.12.2022 |
|
Deposits from the Treasury |
281 816 |
304 606 |
|
Deposits from the Treasury |
281 816 |
304 606 |
Table 12.4 Interest income from lending to banks
|
Amounts in NOK million |
2023 |
2022 |
|
Interest income on D-loans to banks |
- |
- |
|
Interest income on Fixed-rate loans to banks |
905 |
595 |
|
Total interest income from lending to banks |
905 |
595 |
Interest terms for loans to banks
Fixed-rate loans (F-loans) are the instrument primarily used to supply liquidity to the banking system. They are issued to banks at a fixed or floating rate and specified maturity against collateral in the form of securities. The maturity on F-loans is determined by Norges Bank and varies depending on the projection of structural liquidity. Average maturity on floating rate F-loans to banks was 3.6 days in 2023 and 3.8 days in 2022. Average maturity on fixed rate F-loans to banks was 3.3 days in 2023, compared with 1.0 day in 2022.
The interest rates on F-loans are normally determined by multi-price auctions. In a multi-price auction banks submit bids for a desired amount and interest rate. Norges Bank decides the aggregate amount of the allotment. The banks’ interest rate bids are ranked in descending order. Banks that place bids within the aggregate amount will be awarded in the amount and at the interest rate submitted. The interest rate is normally close to the policy rate.
D-loans may be intraday or overnight. Intraday D-loans improve the efficiency of payment settlement, as banks can obtain cover for their positions. These loans are interest-free and are normally repaid by the end of the day. If the loan extends overnight, it becomes an interest-bearing D-loan, with an interest rate 1 percentage point above the policy rate.
Table 12.5 Interest expense on deposits from banks and the Treasury
|
Amounts in NOK million |
2023 |
2022 |
|
Interest expense on sight and reserve deposits from banks |
-1 218 |
-421 |
|
Interest expense on fixed-rate deposits from banks |
-296 |
-109 |
|
Interest expense on depots operated by banks |
-19 |
-7 |
|
Interest expense on deposits from the Treasury |
-13 336 |
-2 442 |
|
Total interest expense on deposits from banks and the Treasury |
-14 869 |
-2 979 |
Interest terms for deposits from banks
Sight deposits: Banks can deposit unlimited reserves in Norges Bank via the standing deposit facility. The interest rate on deposits less than or equal to a bank’s quota is equal to the policy rate (sight deposit rate). Sight deposits in excess of this quota, referred to as reserve deposits, are remunerated at a lower rate, the reserve rate. The reserve rate is 1 percentage point lower than the policy rate.
Fixed-rate deposits: Norges Bank reduces the quantity of reserves in the banking system by providing banks with fixed-rate deposits (F-deposits). As in the case of F-loans, the interest rate is normally determined by multi-price auction. The maturity on F-deposits is determined by Norges Bank and varies depending on the projection of structural liquidity. Norges Bank can offer F-deposits at a floating rate, i.e. the interest rate on the F-deposits depends on the benchmark rate in the money market. Average maturity on F-deposits was 2.4 days in 2023 and 2.1 days in 2022.
Interest terms for deposits from the Treasury
Interest terms for deposits from the government are set in a special agreement between Norges Bank and the Ministry of Finance. The interest rate on the government’s account is calculated on the basis of yields on foreign short-term government securities, weighted by the investments in the foreign exchange reserves.
Table 12.6 Interest rate (p.a.) on Treasury deposits
|
2023 |
2022 |
|
|
First quarter |
3.00% |
0.00% |
|
Second quarter |
3.75% |
0.00% |
|
Third quarter |
4.00% |
0.50% |
|
Fourth quarter |
4.25% |
1.75% |
Note 13 Notes and coins
Accounting policy
Notes and coins in circulation are recognised in the balance sheet at face value when they are put into circulation and derecognised when they are withdrawn from. Notes and coins are put into circulation at the time they are removed from a central bank depot and transferred to private banks. Likewise, they are removed from circulation when they are returned to a central bank depot.
Norges Bank is obliged to redeem withdrawn notes and coins at face value. At the date of withdrawal of notes and coins, a provision equal to an amount, which is deemed unlikely to be redeemed, is made. Changes in the provision are recognised in profit or loss as Other financial income/-expenses.
Expenses for the production of notes and coins are recognised in profit or loss as incurred in Other operating expenses.
Table 13.1 Notes and coins in circulation
|
Amounts in NOK million |
31.12.2023 |
31.12.2022 |
|
Denomination |
||
|
50-krone |
1 045 |
1 044 |
|
100-krone |
1 992 |
2 026 |
|
200-krone |
5 531 |
5 779 |
|
500-krone |
19 621 |
19 436 |
|
1 000-krone |
7 821 |
7 526 |
|
Total notes |
36 010 |
35 811 |
|
Total coins |
4 214 |
4 264 |
|
Total notes and coins |
40 224 |
40 075 |
|
Provision of withdrawn notes from Series VII |
-500 |
- |
|
Notes and coins in circulation |
39 724 |
40 075 |
At year-end 2023, notes and coins in circulation amounted to NOK 39.7 billion, compared with NOK 40.1 billion at year-end 2022. Of notes and coins in circulation at 31 December 2022, NOK 5 652 million comprised withdrawn notes. This pertains to all denominations in Series VII, which were withdrawn in 2018, 2019 and 2020. Norges Bank is still obliged to redeem these notes at face value.
In 2023, NOK 500 million was recognised as income due to a change of provision related to the withdrawal of Series VII notes from circulation. In 2022, NOK 69 million was recognised as income related to withdrawn notes and coins. This is due to a correction of an insufficient amount recognised as income from a previous banknote series.
In 2023, withdrawn notes and coins were redeemed in the amount of NOK 7.1 million, compared with NOK 7.2 million in 2022.
Note 14 International Monetary Fund (IMF)
Accounting policy
Reserve tranche position
The reserve tranche position comprises Norges Bank’s allocated IMF quota less the IMF’s krone deposit with Norges Bank. The outstanding balance with the IMF is recognised gross in the balance sheet, under Claims on the IMF and Liabilities to the IMF, respectively. The IMF quota and the krone liability to the IMF are measured at amortised cost.
Allocated Special Drawing Rights (SDRs)
Norges Bank’s holdings of SDRs are recognised as an asset in the balance sheet, under Claims on the IMF. The equivalent value of SDR allocations by the IMF shows Norges Bank’s total allocations of SDRs and is recognised as a liability, under Liabilities to the IMF. Norges Bank’s holdings of SDRs and the equivalent value of SDRs are measured at amortised cost.
Loans to the IMF and international commitments under the auspices of the IMF
Loans and international commitments are recognised in the balance sheet at fair value at initial recognition, under Claims on the IMF. Subsequent measurement is at amortised cost.
Pursuant to section 3-10, sub-section 1, of the Central Bank Act, Norges Bank shall administer Norway’s financial rights and obligations ensuing from participation in the International Monetary Fund (IMF).
Norway helps to finance the IMF through Norway’s IMF quota subscription and various lending agreements with the IMF. The current lending agreements are: the multilateral lending programme New Arrangements to Borrow (NAB), bilateral borrowing agreements with the IMF and agreements to finance the Poverty Reduction and Growth Trust (PRGT).
Table 14.1 Claims on and liabilities to the IMF
|
31.12.2023 |
|||||
|
Amounts in NOK million |
Loan resource commitments1 |
Amounts drawn on commitments |
Subscription2 |
SDRs |
Total amount recognised |
|
Financial assets |
|||||
|
IMF subscription (quota) |
- |
- |
51 599 |
- |
51 599 |
|
Holdings of Special Drawing Rights (SDRs) |
- |
- |
- |
75 176 |
75 176 |
|
Loans to the IMF - NAB |
53 688 |
55 |
- |
- |
55 |
|
Loans to the IMF - Bilateral borrowing agreement |
35 283 |
- |
- |
- |
- |
|
Loans to the IMF - PRGT |
15 697 |
8 169 |
- |
- |
8 169 |
|
Claims on the IMF |
- |
8 224 |
51 599 |
75 176 |
134 999 |
|
Financial liabilities |
|||||
|
Krone liability to the IMF |
- |
- |
37 035 |
- |
37 035 |
|
Equivalent value of SDR allocations |
- |
- |
- |
70 944 |
70 944 |
|
Liabilities to the IMF |
- |
- |
37 035 |
70 944 |
107 979 |
|
Net positions with the IMF |
- |
8 224 |
14 564 |
4 232 |
27 020 |
|
31.12.2022 |
|||||
|
Amounts in NOK million |
Loan resource commitments1 |
Amounts drawn on commitments |
Subscription2 |
SDRs |
Total amount recognised |
|
Financial assets |
|||||
|
IMF subscription (quota) |
- |
- |
49 609 |
- |
49 609 |
|
Holdings of Special Drawing Rights (SDRs) |
- |
- |
- |
72 328 |
72 328 |
|
Loans to the IMF - NAB |
51 736 |
248 |
- |
- |
248 |
|
Loans to the IMF - Bilateral borrowing agreement |
34 001 |
- |
- |
- |
- |
|
Loans to the IMF - PRGT |
15 126 |
4 375 |
- |
- |
4 375 |
|
Claims on the IMF |
- |
4 623 |
49 609 |
72 328 |
126 560 |
|
Financial liabilities |
|||||
|
Krone liability to the IMF |
- |
- |
35 173 |
- |
35 173 |
|
Equivalent value of SDR allocations |
- |
- |
- |
68 205 |
68 205 |
|
Liabilities to the IMF |
- |
- |
35 173 |
68 205 |
103 378 |
|
Net positions with the IMF |
- |
4 623 |
14 436 |
4 123 |
23 182 |
1 Commitments giving the IMF a borrowing facility with Norges Bank up to an agreed amount. Only the portion drawn is recognised in the balance sheet.
2 The net subscription refers to the reserve tranche position and is Norway’s quota less Norway’s krone liability to the IMF. If necessary, Norges Bank may draw from the IMF an amount equal to Norway’s reserve tranche position.
All rights in and commitments to the IMF are denominated in SDRs. The value of the SDR is calculated on the basis of a currency basket comprising the US dollar, euro, Chinese renminbi, Japanese yen and British pound. The currency weights are adjusted each year in accordance with changes in bilateral foreign exchange rates.
Norway’s IMF quota subscription
The IMF is owned and directed by member countries and functions like a credit union in which each member country pays in a subscription, also called its quota. These subscriptions are the IMF’s basic source of funding for loans. The amount of the subscription reflects the member country’s relative position in the global economy. The quota determines a member country’s voting power in IMF decisions, the member’s financial contribution to the IMF, the amount of financing the member can access in the event of balance of payments problems and the amount of SDRs the member receives when SDRs are allocated.
Norway’s quota is unchanged from year-end 2022. Converted to Norwegian kroner, the quota was NOK 51 599 million as at 31 December 2023, compared with NOK 49 609 million as at 31 December 2022.
Holdings and equivalent value of Special Drawing Rights (SDRs)
The IMF has created an international reserve asset called the Special Drawing Rights (SDR). SDRs are periodically allocated to IMF member countries, most recently in 2021. Equivalent value of SDR allocations shows the amount of SDRs Norway has been allocated since the scheme was established. Holdings of SDRs may be used to pay in quota increases, for other transactions with the IMF or for purchase or sale of SDRs from or to other IMF members. However, SDRs cannot be used for direct purchases of goods and services.
Norges Bank’s SDR allocation is unchanged from year-end 2022. Converted to Norwegian kroner, a total of NOK 70 944 million had been allocated to Norway as at 31 December 2023, compared with NOK 68 205 million at year-end 2022.
Norges Bank’s holdings of SDRs have been deposited with the IMF and amounted to NOK 75 176 million as at 31 December 2023, compared with NOK 72 328 million at year-end 2022.
Norges Bank’s loans to the IMF
New Arrangements to Borrow (NAB)
The New Arrangements to Borrow (NAB) programme is used for loans if the IMF has a need for funds in excess of subscriptions from member countries.
Norges Bank’s total resource commitments under the NAB were unchanged from year-end 2022. Converted to Norwegian kroner, total resource commitments were NOK 53 688 million as at 31 December 2023, compared with NOK 51 736 million at year-end 2022.
Norges Bank’s loans to the IMF under the NAB as at 31 December 2023 totalled NOK 55 million, compared with NOK 248 million at year-end 2022.
Bilateral borrowing agreement
In 2020, the IMF and Norges Bank concluded a bilateral borrowing agreement. The agreement is part of a broader international effort to ensure the IMF sufficient resources to meet the borrowing requirements of member countries in times of crisis. Under the agreement, the IMF is provided with a borrowing facility in the form of a drawing arrangement on Norges Bank. In 2023, the original agreements from 2020 was extended by one year. The agreement is now valid until 31 December 2024.
This borrowing agreement has for the time being not been drawn on. Converted to Norwegian kroner, the borrowing agreement was NOK 35 283 million as at 31 December 2023, compared with NOK 34 001 million at year-end 2022.
Poverty Reduction and Growth Trust (PRGT)
Norway participates in the financing of the IMF’s subsidised lending programme for low-income countries under four agreements. Norway signed such agreements with the IMF in 2010, 2016, 2020 and 2022.
Norges Bank’s borrowing agreement to the PRGT lending programme is unchanged from year-end 2022. Converted to Norwegian kroner, the borrowing agreement was NOK 15 697 million as at 31 December 2023, compared with NOK 15 126 million at year-end 2022.
Norges Bank’s loans to the PRGT totalled NOK 8 169 million as at 31 December 2023, compared with NOK 4 375 million at year-end 2022.
The IMF’s deposits with Norges Bank
The IMF has deposited its entire NOK holdings with Norges Bank, referred to as the Krone liability to the IMF. However, the value of these deposits is adjusted so that the IMF bears no risk associated with exchange rate movements between the krone and the SDR.
As at 31 December 2023, krone deposits from the IMF totalled NOK 37 035 million, compared with NOK 35 173 million at year-end 2022.
Net interest income on claims on and liabilities to the IMF
Table 14.2 Net interest income, claims on/liabilities to the IMF
|
2023 |
||||
|
Amounts in NOK million |
Amount drawn on loan resource commitments |
Subscription |
SDRs |
Total |
|
Interest income from the IMF |
286 |
1 988 |
2 942 |
5 216 |
|
Interest expenses to the IMF |
- |
-1 437 |
-2 798 |
-4 235 |
|
2022 |
||||
|
Amounts in NOK million |
Amount drawn on loan resource commitments |
Subscription |
SDRs |
Total |
|
Interest income from the IMF |
57 |
582 |
855 |
1 494 |
|
Interest expenses to the IMF |
- |
-424 |
-819 |
-1 243 |
SDR interest rate
The SDR interest rate forms the basis for interest income and expense related to member countries’ relationship with the IMF. The rate is calculated and published every week by the IMF. It is based on a weighted average of the three-month sovereign yields in countries/currency areas included in the SDR basket (USD/EUR/CNY/JPY/GBP). The interest rate has a floor of 5 basis points.
Interest on the IMF quota subscription and interest on the krone liability to the IMF
Interest on the reserve tranche position is calculated by the IMF. Interest is calculated net by the IMF but presented gross in Norges Bank’s financial statements as interest income and interest expenses associated with the quota subscription. Interest is calculated monthly and netted quarterly. The interest rate is based on the IMF’s SDR, with the deductions and additions resulting from the IMF’s Burden Sharing mechanism. Under the Burden Sharing mechanism, the SDR interest rate is adjusted to compensate for any future revenue losses.
Interest on Special Drawing Rights and interest on equivalent value of SDR allocations
Norges Bank earns interest income on its holdings of SDRs and is charged for interest expenses on the equivalent value of SDR allocations. Interest is calculated monthly and netted quarterly. The interest rate is the current SDR interest rate at any given time.
Interest on IMF lending programmes
Interest is calculated monthly and netted quarterly. The interest rate is the current SDR interest rate at any given time.
Note 15 Personnel expenses
Accounting policy
Pay comprises all types of remuneration to the Bank’s own employees and is expensed as earned. Ordinary pay may be either a fixed salary or hourly wages and is earned and disbursed on an ongoing basis. Holiday pay is earned on the basis of ordinary pay and is normally disbursed during the holiday months of the subsequent year. Performance-based pay is earned and calculated on the basis of various performance targets and is disbursed in subsequent years.
Payroll tax is calculated and expensed for all pay-related expenses and normally paid in arrears every other month. Pensions are earned under separate rules, see note 16 Pension for further information.
Salary system
Norges Bank’s Executive Board sets the limits for the Bank’s salary and remuneration schemes and monitors how they are put into practice. Pay levels are to be competitive, but not market-leading. Salaries are set individually and reflect the position’s responsibilities and the employee’s skills, experience and achievements. Total remuneration paid includes fixed salary, performance-based pay and overtime payments.
Norges Bank employs external consultants to perform annual comparisons of salary levels with other employers. The Executive Board has a Remuneration Committee comprising three of the external members and one employee representative. The Committee contributes to thorough and independent discussion of matters pertaining to the salary and remuneration schemes.
The Executive Board sets salary bands for the CEO of NBIM, executive managers and employees in Central Banking Operations (CBO) whose salary is determined by the Governor. The Governor determines, within band set, the annual salary adjustment based on the managers’ performance in the previous year.
Norges Bank’s Executive Board lays down the principles for NBIM’s salary system. The Executive Board sets further salary bands for the employees in NBIM who are part of the NBIM’s leader group. The leader group receives only a fixed salary. The CEO of NBIM determines, within band set, the annual salary adjustment based on the managers’ performance in the previous year.
Performance-based pay NBIM
In addition to a fixed salary, employees of NBIM whose work directly involves investment decisions, and certain other NBIM employees, may be entitled to performance-based pay. Performance-based pay is calculated on the basis of the performance of the GPFG, group and individual measured against agreed qualitative and quantitative targets. Qualitative targets may include aspects of environmental, social and governance (ESG) performance. Results are measured over a period of at least two years.
Performance-based pay may not normally exceed 100 percent of fixed salary. For a limited number of employees at international offices, the cap may be up to 200 percent of fixed salary. Employees receiving performance-based pay earned on average 60 percent of the total limit for 2023, based on performance over several years. Expected annual accrued performance-based pay is 60 percent of the total limit.
Accrued performance-based pay is paid over several years. Half is paid the year after it is accrued, while half is held back and paid over the following three years. The amount held back is adjusted for the return on the GPFG.
Performance-based pay totalling NOK 300 million was paid to 225 employees in 2023. In the same period, a total of NOK 11 million of performance-based pay was paid to employees at our subsidiaries.
At year-end 2023, the overall limit for performance-based pay was NOK 533 million. The subsidiaries had an overall limit of NOK 23 million.
In line with the management mandate from the Ministry of Finance, the remuneration system complies with the requirements of the regulations issued under the Norwegian Securities Funds Act with necessary adjustments. The Executive Board’s Remuneration Committee shall contribute to thorough and independent discussion of matters pertaining to the remuneration scheme in Norges Bank. In addition, Norges Bank’s Internal Audit conducts an independent review of compliance with rules and guidelines for remuneration. The review in 2023 confirmed that the implementation of the remuneration scheme for 2022 was in compliance with the rules. There were no significant changes to the remuneration system in 2023.
Performance-based pay Central Banking
Central Banking employees whose work directly involves investment decisions for the foreign exchange reserves may be entitled to performance-based pay. This scheme is a supplement to the ordinary salary system. Performance-based pay is calculated on the basis of performance measured against set targets for the management of the foreign exchange reserves. Accrued performance-based pay is paid over several years. Maximum accrued performance-based pay may not exceed the fixed salary. 60 percent of the calculated performance-based pay is paid the year after it is accrued, and the other 40 percent is held back and paid over the following three years.
Performance-based pay totalling NOK 3 million was paid to 11 employees in 2023. At year-end 2023, the overall limit for performance-based pay was NOK 13.8 million.
Personnel expenses
|
Amounts in NOK million |
2023 |
2022 |
|
Salary and fees |
2 003 |
1 678 |
|
Employer’s social security contributions |
278 |
204 |
|
Pension expense, see note 16 Pension |
241 |
187 |
|
Other personnel expenses |
331 |
281 |
|
Personnel expenses |
2 853 |
2 350 |
Number of employees / full-time equivalent (FTE)
Table 15.2 Number of employees/FTEs
|
31.12.2023 |
31.12.2022 |
|
|
Number of employees |
1 079 |
1 007 |
|
Number of FTEs |
1 059 |
999 |
Benefits to governing bodies
Supervisory Council
Total remuneration paid in 2023 was NOK 1 211 462. Of this amount, fixed remuneration was NOK 960 000. Remuneration rates for 2023 were set by the Storting as from 1 January 2022 (cf Recommendation 40 S (2021-2022)). The remaining NOK 250 862 is other remuneration for attending meetings, including for lost earnings. Total remuneration paid in 2022 was NOK 1 072 000.
With regard to remuneration to the director of the Office of the Supervisory Council and other expenses, see the Supervisory Council’s report to the Storting for 2023.
Table 15.3 Remuneration to the Supervisory Council and the Permanent Committee
|
2023 |
|||
|
Amounts in NOK |
Total remuneration per member |
Supervisory Council |
The Permanent Committee |
|
Chair |
175 400 |
70 200 |
105 200 |
|
Deputy chair |
117 000 |
46 800 |
70 200 |
|
Three members of the Permanent Committee |
105 400 |
35 200 |
70 200 |
|
10 members of the Supervisory Council |
35 200 |
35 200 |
- |
|
2022 |
|||
|
Amounts in NOK |
Total remuneration per member |
Supervisory Council |
The Permanent Committee |
|
Chair |
175 400 |
70 200 |
105 200 |
|
Deputy chair |
117 000 |
46 800 |
70 200 |
|
Three members of the Permanent Committee |
105 400 |
35 200 |
70 200 |
|
10 members of the Supervisory Council |
35 200 |
35 200 |
- |
Executive Board – external members
Service on the Executive Board is remunerated at fixed annual rates. Remuneration to members and alternates of the Executive Board is determined by the Ministry of Finance. Total remuneration to members and alternates of the Executive Board and its committees was NOK 2 963 900 in 2023, compared with NOK 2 817 100 in 2022.
Table 15.4 Remuneration to the Executive Board
|
Amounts in NOK |
2023 |
|||||
|
Name |
Total remuneration |
Executive Board |
Audit Committee |
Remuneration Committee |
Ownership Committee |
Risk and Investment Committee |
|
Karen Helene Ulltveit-Moe |
508 300 |
387 600 |
90 600 |
30 100 |
|
|
|
Kristine Ryssdal |
471 650 |
387 600 |
30 100 |
53 950 |
||
|
Arne Hyttnes |
493 550 |
387 600 |
75 850 |
30 100 |
||
|
Hans Aasnæs |
486 500 |
387 600 |
98 900 |
|||
|
Nina Udnes Tronstad |
517 400 |
387 600 |
75 850 |
53 950 |
||
|
Egil Herman Sjursen |
486 500 |
387 600 |
98 900 |
|
Amounts in NOK |
2022 |
|||||
|
Name |
Total remuneration |
Executive Board |
Audit Committee |
Remuneration Committee |
Ownership Committee |
Risk and Investment Committee |
|
Karen Helene Ulltveit-Moe1 |
510 350 |
368 400 |
86 100 |
16 683 |
39 167 |
|
|
Kristine Ryssdal |
448 300 |
368 400 |
28 600 |
51 300 |
||
|
Arne Hyttnes |
469 100 |
368 400 |
72 100 |
28 600 |
||
|
Hans Aasnæs |
462 400 |
368 400 |
94 000 |
|||
|
Nina Udnes Tronstad2 |
482 342 |
368 400 |
72 100 |
11 917 |
29 925 |
|
|
Egil Herman Sjursen3 |
444 608 |
368 400 |
21 375 |
54 833 |
1 Member in the period 1 January 2022 to 30 May 2022 in the Risk and Investment Committee and 1 June 2022 to 31 December 2022 in the Remuneration Committee.
2 Member in the period 1 January 2022 to 30 May 2022 in the Remuneration Committee and 1 June 2022 to 31 December 2022 in the Ownership Committee.
3 Member in the period 1 January 2022 to 30 May 2022 in the Ownership Committee and 1 June 2022 to 31 December 2022 in the Risk and Investment Committee.
Monetary Policy and Financial Stability Committee – external members
Service on the Monetary Policy and Financial Stability Committee is remunerated at fixed annual rates as set by the Ministry of Finance. Total remuneration to the external members of the committee was NOK 708 600 in 2023, compared with NOK 673 600 in 2022.
Table 15.5 Remuneration to the Monetary Policy and Financial Stability Committee
|
Amounts in NOK |
||
|
Name |
2023 |
2022 |
|
Ingvild Almås |
354 300 |
336 800 |
|
Jeanette Fjære-Lindkjenn |
354 300 |
336 800 |
Benefits to senior executives
Senior executives are entitled to the same retirement benefits and have the same borrowing rights as Norges Bank’s other employees. Pension benefits earned for the year are equal to the individual executive’s accrued service cost for the year. Pension plans are discussed in note 16 Pension, and loans to employees are discussed in a separate section in this note.
Senior executives do not earn performance-based pay or other variable remuneration.
Value of other benefits shows the tax value of benefits-in-kind and primarily comprise coverage of electronic communication, personal insurance and some travel expenses.
Governor and Deputy Governors
The salaries of the Governor and Deputy Governors of Norges Bank are determined by the Ministry of Finance. In addition, they have a free telephone, free newspaper subscription and insurance covered by their employer.
A six-month quarantine period applies to the Governor and Deputy Governors after stepping down or the end of their terms of office. The Ministry of Finance may grant an exemption from this quarantine period. As long as the quarantine period is in force, the Governor and Deputy Governor are entitled to maintain a normal salary and other remuneration.
Table 15.6 Remuneration to the Norges Bank Executive Management Team
|
Amounts in NOK |
2023 |
||||
|
Position |
Name |
Gross salary |
Value of other benefits |
Pension benefits earned |
Employee loan |
|
Governor |
Ida Wolden Bache |
2 523 686 |
11 503 |
387 154 |
- |
|
Deputy Governor |
Øystein Børsum |
2 234 720 |
17 469 |
399 086 |
- |
|
Deputy Governor |
Pål Longva |
2 092 465 |
11 775 |
440 892 |
- |
|
Chief Executive Officer - NBIM |
Nicolai Tangen |
7 141 040 |
18 472 |
382 856 |
- |
|
Deputy Chief Executive Officer - NBIM / Chief of Staff |
Trond Grande |
5 199 029 |
9 156 |
409 556 |
- |
|
Executive Director, Norges Bank Administration |
Alexander Behringer1 |
2 047 602 |
10 900 |
365 953 |
- |
|
Executive Director, General Secretariat |
Ingrid Solberg1 |
1 876 341 |
18 052 |
343 189 |
- |
1 Held the position of Acting Executive Director during all of 2023
|
Amounts in NOK |
2022 |
||||
|
Position |
Name |
Gross salary |
Value of other benefits |
Pension benefits earned |
Employee loan |
|
Governor |
Ida Wolden Bache1 |
2 012 823 |
10 106 |
355 675 |
- |
|
Deputy Governor |
Øystein Børsum |
2 019 671 |
10 249 |
439 433 |
- |
|
Deputy Governor |
Pål Longva2 |
735 217 |
4 203 |
150 991 |
- |
|
Chief Executive Officer - NBIM |
Nicolai Tangen |
6 872 066 |
11 012 |
411 431 |
- |
|
Deputy Chief Executive Officer - NBIM / Chief of Staff |
Trond Grande |
4 930 080 |
9 610 |
447 975 |
- |
|
Executive Director, General Secretariat |
Birger Vikøren |
1 955 109 |
9 653 |
356 586 |
- |
|
Former senior executives |
|||||
|
Governor |
Øystein Olsen3 |
987 606 |
30 613 |
49 038 |
- |
|
Deputy Governor |
Ida Wolden Bache1 |
352 666 |
1 420 |
71 135 |
- |
|
Executive Director, Norges Bank Administration |
Jane Kristin Aamodt Haugland4 |
1 805 351 |
9 018 |
380 444 |
- |
1 Began in the position as Governor on 2 March 2022. Resigned from the position as Deputy Governor on 1 March 2022. Remuneration shown from-/up until the date the appointment/resignation of the respective positions became effective.
2 Began in the position as Deputy Governor on 29 August 2022. Remuneration shown from the date the appointment became effective.
3 Resigned from this position on 28 February 2022. Remuneration shown up until the date the resignation became effective.
4 Resigned from this position on 1 November 2022. Remuneration shown up until the date the resignation became effective.
Benefits to senior executives in Norges Bank’s Central Banking Operations
Table 15.7 Remuneration to senior executives in Norges Bank’s Central Banking Operations
|
Amounts in NOK |
2023 |
||||
|
Position |
Name |
Gross salary |
Value of other benefits |
Pension benefits earned |
Employee loan |
|
Executive Director, Financial Stability |
Torbjørn Hægeland |
2 241 047 |
24 840 |
360 956 |
- |
|
Executive Director, Monetary Policy |
Ole Christian Bech-Moen |
2 240 330 |
12 611 |
336 373 |
- |
|
Executive Director, Markets |
Gaute Langeland1 |
1 496 579 |
6 440 |
244 284 |
- |
|
Executive Director, ICT |
Øystein Kruge |
2 039 220 |
9 156 |
418 109 |
- |
1 Began in this position on 1 May 2023. Remuneration shown from the date the appointment became effective.
|
Amounts in NOK |
2022 |
||||
|
Position |
Name |
Gross salary |
Value of other benefits |
Pension benefits earned |
Employee loan |
|
Executive Director, Financial Stability |
Torbjørn Hægeland |
2 129 677 |
16 100 |
382 825 |
- |
|
Executive Director, Monetary Policy |
Ole Christian Bech-Moen |
2 129 677 |
9 204 |
358 953 |
- |
|
Executive Director, ICT |
Øystein Kruge1 |
151 966 |
710 |
50 298 |
- |
|
Former senior executives |
|||||
|
Executive Director, Markets and ICT |
Olav Andreas Bø2 |
1 098 323 |
4 992 |
209 407 |
- |
1 Began in this position on 1 December 2022. Remuneration shown from the date the appointment became effective.
2 Resigned from this position on 1 July 2022. Remuneration shown up until the date the resignation became effective.
Remuneration to senior executives in Norges Bank Investment Management
A quarantine period of six months applies to the CEO of NBIM after stepping down or the end of his term of office. Moreover, he has contractually waived his rights to employment protection in exchange for severance pay. Severance pay shall be paid for six months in the event of dismissal by Norges Bank and for three months in the event of resignation. Any income from a new employer will be deducted from this compensation.
Table 15.8 Remuneration to senior executives in Norges Bank Investment Management
|
Amounts in NOK |
2023 |
|||||
|
Position |
Name |
Gross salary |
Gross performance pay |
Value of other benefits |
Pension benefits earned |
Employee loan |
|
Chief Human Resources Officer |
Ada Magenæs Aass1 |
1 711 965 |
- |
7 261 |
274 828 |
- |
|
Co-Chief Investment Officer Equities |
Daniel Balthasar2 |
12 030 505 |
3 585 764 |
172 149 |
1 203 051 |
- |
|
Chief Technology and Operating Officer |
Birgitte Bryne |
3 964 247 |
- |
16 555 |
437 723 |
- |
|
Co-Chief Investment Officer Equities |
Pedro Furtado Reis2 |
12 030 505 |
3 475 348 |
168 777 |
1 203 051 |
- |
|
Deputy Chief Executive Officer & Chief of Staff |
Trond Grande |
5 199 029 |
- |
9 156 |
409 556 |
- |
|
Chief Real Assets Officer |
Mie Caroline Holstad |
3 380 174 |
- |
12 341 |
346 309 |
- |
|
Chief Risk Officer |
Dag Huse |
4 842 036 |
- |
9 156 |
668 627 |
- |
|
Chief Governance and Compliance Officer |
Carine Smith Ihenacho |
5 800 948 |
- |
155 701 |
580 095 |
- |
|
Co-Chief Investment Officer Asset Strategies |
Malin Norberg1,2 |
3 135 222 |
- |
15 849 |
253 896 |
1 162 102 |
|
Co-Chief Investment Officer Asset Strategies |
Geir Øivind Nygård |
4 732 467 |
- |
16 091 |
319 435 |
- |
|
Chief of Communications and External Relations |
Marthe Skaar1 |
1 467 748 |
- |
15 077 |
262 270 |
- |
|
Chief Executive Officer |
Nicolai Tangen |
7 141 040 |
- |
18 472 |
382 856 |
- |
1 Began in their positions on 1 April 2023. Remuneration shown from the date the appointment became effective.
2 Members of the leader group in Norges Bank Investment Management only receive a fixed salary. Some members of the leader group who previously had a performance-based salary no longer have this scheme, but will in the coming years be paid the withheld performance salary. The amounts stated in the table are performance salaries paid in the financial year, but earned and recognized in the income statement in previous periods.
|
Amounts in NOK |
2022 |
|||||
|
Position |
Name |
Gross salary |
Gross performance pay |
Value of other benefits |
Pension benefits earned |
Employee loan |
|
Co-Chief Investment Officer Equities |
Daniel Balthasar1,4 |
5 224 435 |
- |
76 181 |
522 444 |
- |
|
Chief Technology and Operating Officer |
Birgitte Bryne |
3 700 102 |
- |
11 451 |
481 639 |
- |
|
Co-Chief Investment Officer Equities |
Pedro Furtado Reis1,4 |
5 224 435 |
- |
74 777 |
522 444 |
- |
|
Deputy Chief Executive Officer & Chief of Staff |
Trond Grande |
4 930 080 |
- |
9 610 |
447 975 |
- |
|
Chief Real Assets Officer |
Mie Caroline Holstad |
3 204 829 |
- |
13 720 |
375 668 |
- |
|
Chief Risk Officer |
Dag Huse |
4 650 270 |
- |
8 520 |
733 944 |
- |
|
Chief Governance and Compliance Officer |
Carine Smith Ihenacho |
4 863 553 |
- |
107 773 |
486 355 |
- |
|
Chief Real Assets Strategies Officer |
Geir Øivind Nygård |
4 545 620 |
- |
11 527 |
348 028 |
- |
|
Chief Executive Officer |
Nicolai Tangen |
6 872 066 |
- |
11 012 |
411 431 |
- |
|
Former senior executives |
||||||
|
Chief Technology Officer |
Age Bakker2 |
937 500 |
- |
2 594 |
125 429 |
- |
|
Chief Equities Officer |
Petter Johnsen3 |
4 871 388 |
- |
112 708 |
487 139 |
- |
1 Began in this position on 1 July 2022. Remuneration shown from the date the appointment became effective.
2 Resigned from this position on 1 April 2022. Remuneration shown up until the resignation became effective.
3 Resigned from this position on 1 July 2022. Remuneration shown up until the resignation became effective.
4 Members of the leader group in Norges Bank Investment Management only receive a fixed salary. Some members of the leader group who previously had a performance-based salary no longer have this scheme, but will in the coming years be paid the withheld performance salary. The amounts stated in the table are performance salaries paid in the financial year, but earned and recognized in the income statement in previous periods.
Loans to employees
The Bank’s loan scheme for its employees comprises residential mortgages and consumer loans. Mortgages are provided in accordance with guidelines from the Supervisory Council within 80 percent of the lowest amount of the purchase price and documented market value, limited to NOK 3 867 000 and a maximum term of 30 years. Consumer loans are limited to a maximum of four times the employee’s monthly salary, though not exceeding NOK 350 000. The loan schemes apply to all permanent employees in a minimum half-time position with an employment contract in Norway. The interest rate is linked to the norm rate for loans on favourable terms from an employer. The Ministry of Finance sets the norm rate six times a year. The norm rate as at December 2023 was 4.5 percent. Total loans to employees as at 31 December 2023 were NOK 405 million, compared with NOK 237 million as at 31 December 2022.
Note 16 Pension
Accounting policy
Accounting treatment of pension and other benefit obligations is in accordance with IAS 19 Employee Benefits. Calculations for fund-based plans through Norges Bank’s pension fund are based on actuarial assumptions regarding life expectancy, expected wage growth and adjustment of the National Insurance basic amount (G), among others. The net benefit obligation is the difference between the present value of the benefit obligation and the fair value of plan assets.
Plan assets are measured at fair value. Benefit obligations and plan assets are measured on the balance sheet date. Employers’ National Insurance contributions are included. Pension expense is calculated on the basis of a straight-line attribution of benefit over the period of service and consists of the current service cost, less the return on plan assets. Recognised pension expense is presented in its entirety under the line Personnel expenses. Changes in actuarial gains and losses are presented under the line Change in actuarial gains/-losses in total comprehensive income.
Norges Bank has funded and unfunded pension and other benefit obligations. All significant funded and unfunded plans are included in the Bank’s actuarial settlement. Norges Bank has a pension plan where the benefits are in line with the Norwegian Public Service Pension Fund and other comparable public sector pension plans. Pension benefits are subject to a life expectancy adjustment and are coordinated with benefits from the National Insurance scheme.
Norges Bank’s funded pension benefit obligations are covered by Norges Bank’s own pension fund, which is organised as a separate legal entity. Service credit for retirement benefits is generally earned for each year the employee is working up until age 70. Employees contribute 2 percent of their gross annual salary into the pension fund. Norges Bank’s contributions are covered by cash payments or the premium fund.
Table 16.1 Number of pension plan members (funded plan)
|
31.12.2023 |
31.12.2022 |
|
|
Members drawing retirement benefits |
931 |
924 |
|
Active members (including all those affected by restructuring) |
867 |
801 |
|
Members who have left the Bank with vested rights |
1 237 |
1 180 |
|
Total number of pension plan members |
3 035 |
2 905 |
Norges Bank’s benefit obligation
Norges Bank has funded pension plans associated with membership of Norges Bank’s pension fund. In addition, the Bank has unfunded plans funded out of current income. These are special and allocated pensions, the unfunded portions of pensions for employees with salaries higher than 12 G earned after 1 January 2007, contractual early retirement pensions calculated on the basis of an expected 15 percent take-up rate and early retirement pension and redundancy pay agreements related to restructuring. The benefit obligation related to restructuring is the present value of all agreements, including agreements with disbursements in 2023 or later.
Significant estimate
Measurement of the present value of Norges Bank’s pension benefit obligation requires determination of a number of economic and demographic assumptions. Changes in these assumptions may affect the pension expense and the pension benefit obligation recognised in the balance sheet. Norges Bank follows Norwegian Accounting Standards Board (NASB) guidelines in determining the economic assumptions. The guideline assumptions are assessed against actual conditions at Norges Bank before a decision is made to apply them.
Table 16.2 Economic and demographic assumptions
|
31.12.2023 |
31.12.2022 |
|
|
Discount rate |
3.10% |
3.00% |
|
Interest rate on assets |
3.10% |
3.00% |
|
Rate of compensation increase |
3.50% |
3.50% |
|
Rate of pension increase |
2.80% |
2.60% |
|
Increase in social security base amount (G) |
3.25% |
3.25% |
|
Expected annual attrition |
5% up to age 50, then 1% |
2% up to age 50, then 0 |
|
Payroll tax/social security tax |
14.10% |
14.10% |
|
Mortality table |
K2013BE |
K2013BE |
|
Disability table |
KU |
KU |
Table 16.3 Net liability recognised in the balance sheet
|
Amounts in NOK million |
31.12.2023 |
31.12.2022 |
|
Change in defined benefit obligation (DBO) incl. payroll tax |
||
|
DBO at beginning of year |
5 700 |
5 697 |
|
Service cost |
229 |
187 |
|
Interest cost |
168 |
107 |
|
Payroll tax on employer contribution |
-65 |
-27 |
|
Benefits paid |
-158 |
-154 |
|
Remeasurement loss/-gain |
300 |
-110 |
|
DBO at year-end |
6 174 |
5 700 |
|
Change in plan assets |
||
|
Fair value of assets at beginning of year |
5 531 |
5 991 |
|
Interest income |
157 |
107 |
|
Employer contribution incl. payroll tax |
529 |
220 |
|
Payroll tax on employer contribution |
-65 |
-27 |
|
Benefits paid |
-149 |
-146 |
|
Remeasurement (loss) gain |
265 |
-614 |
|
Fair value of assets at year-end |
6 267 |
5 531 |
|
Pension scheme not recognised in the actuarial calculation |
- |
1 |
|
Net amount recognised in the balance sheet |
-93 |
170 |
Table 16.4 Specification of funded and unfunded plans
|
31.12.2023 |
31.12.2022 |
|||||
|
Amounts in NOK million |
Funded plan |
Unfunded plans |
Total |
Funded plan |
Unfunded plans |
Total |
|
Accrued benefit obligations |
5 944 |
230 |
6 174 |
5 474 |
227 |
5 701 |
|
Plan assets |
-6 267 |
- |
-6 267 |
-5 531 |
- |
-5 531 |
|
Net benefit obligation/-net plan assets |
-323 |
230 |
-93 |
-57 |
227 |
170 |
Table 16.5 Allocation of plan assets for funded plan
|
Amounts in NOK million |
31.12.2023 |
31.12.2022 |
|
Bonds |
2 588 |
2 533 |
|
Equities |
3 008 |
2 258 |
|
Real estate fund |
671 |
740 |
|
Total |
6 267 |
5 531 |
Pension expense for employees in Norway
Pension expense includes current service cost, interest expense and expected return on plan assets.
The change in the unfunded plans is included in the overall pension expense.
Expenses relating to employees associated with NBIM are covered in their entirety by the management fee and amounted to NOK 113.8 million in 2023 and NOK 90.6 million in 2022.
Table 16.6 Pension expense (incl. payroll tax)
|
Amounts in NOK million |
2023 |
2022 |
|
Service cost incl. interest |
229 |
187 |
|
Administration cost |
7 |
5 |
|
Service cost and cost of benefit changes |
236 |
192 |
|
Net interest cost/-income |
5 |
-6 |
|
Net periodic pension cost |
241 |
187 |
|
Other comprehensive income (OCI) in the period |
||
|
Remeasurement loss/-gain - change in discount rate |
-115 |
-1 125 |
|
Remeasurement loss/-gain - change in other economic assumptions |
154 |
798 |
|
Remeasurement loss/-gain - change in other demographic assumptions |
-14 |
- |
|
Remeasurement loss/-gain - experience adjustments, DBO |
275 |
216 |
|
Remeasurement loss/-gain - experience adjustments, assets |
-306 |
574 |
|
Investment management cost |
41 |
40 |
|
OCI losses/-gains in the period |
35 |
504 |
Sensitivity analysis
The sensitivity analysis has been prepared in the light of possible changes in the assumptions discount rate and wage growth, which are expected to have the most pronounced effect on the pension obligation. The other actuarial assumptions are kept unchanged in the sensitivity analysis.
Table 16.7 Sensitivity analysis
|
31.12.2023 |
||||
|
Discount rate |
General compensation increase |
ABO pensioners / DBO other1 |
Change (2) |
|
|
Assumptions at 31 December 2023 |
3.50% |
3.10% |
6 174 |
|
|
Discount rate + 0.5 percentage point |
3.60% |
3.50% |
5 624 |
-8.91% |
|
Discount rate - 0.5 percentage point |
2.60% |
3.50% |
6 813 |
10.35% |
|
General compensation increase + 0.5 percentage point |
4.00% |
4.00% |
6 403 |
3.71% |
|
General compensation increase - 0.5 percentage point |
3.00% |
3.00% |
5 968 |
-3.34% |
1 Amounts in NOK million.
2 Prosentvis endring i pensjonsforpliktelsen.
Pension plans for locally employed staff of foreign offices
Locally employed staff at Norges Bank’s offices in London, New York and Singapore have a defined-contribution pension plan in accordance with local provisions in addition to what has been established by the authorities. The plans are managed externally, within rules determined by Norges Bank.
Recognised expenses for the plans were NOK 51.5 million in 2023, compared with NOK 39.8 million in 2022, and are presented under the line Other personnel expenses in table 15.1 Personnel expenses.
Note 17 Other operating expenses and other operating income
Other operating expenses
Table 17.1 Other operating expenses
|
Amounts in NOK million |
2023 |
2022 |
|
Custody costs |
509 |
498 |
|
IT services, systems, data and information |
1 139 |
948 |
|
Research, consulting and legal fees |
356 |
339 |
|
Other costs |
431 |
429 |
|
Total other operating expenses excl. external managers |
2 435 |
2 215 |
|
Base fees to external managers |
1 205 |
963 |
|
Performance-based fees to external managers |
1 343 |
717 |
|
Total fees to external managers |
2 549 |
1 680 |
|
Total other operating expenses |
4 984 |
3 895 |
|
Depreciation, amortisation and impairment losses |
135 |
154 |
|
Personnel expenses |
2 853 |
2 350 |
|
Total operating expenses |
7 971 |
6 399 |
|
Of which costs for Norges Bank’s primary tasks |
1 339 |
1 173 |
|
Of which covered by mangement fee, GPFG |
6 632 |
5 226 |
Norges Bank allocates costs to the primary tasks Monetary Policy, Financial Stability, Management of the foreign exchange reserves, Banknotes and coins, Settlement services for banks, Government debt management and The Treasury single account system. In addition, costs are allocated to the management of the Government Pension Fund Global.
See note 20.12 Management costs for specification and further information regarding costs covered by management fee, GPFG.
Table 17.2 Fees, external auditor
|
Norges Bank |
Subsidiaries |
|||
|
Amounts in NOK thousands, inclusive VAT |
2023 |
2022 |
2023 |
2022 |
|
Statutory audit |
13 310 |
13 111 |
11 536 |
8 953 |
|
Other assurance services |
1 523 |
1 286 |
306 |
-52 |
|
Tax advice |
1 325 |
2 153 |
- |
- |
|
Other services |
- |
- |
- |
- |
|
Total fees, external auditor |
16 158 |
16 551 |
11 842 |
8 901 |
Statutory audit
Statutory audit consists of audit fees of Central Banking Operations and the GPFG. Norges Bank’s external auditor is Ernst & Young AS (EY). EY began as elected auditor for the audit of the financial year 2022.
Former external auditor Deloitte AS (Deloitte) resigned after the end of their engagement, at the end of the audit of the financial year 2021. In 2022, the fees for Norges Bank to EY and Deloitte were NOK 9.5 million and NOK 3.6 million, respectively.
Norges Bank has established subsidiaries which invest exclusively as part of Norges Bank’s management of the investment portfolio of the GPFG. The subsidiaries have separate engagement agreements with their external auditors and are not bound by the agreement between Norges Bank and EY.
Other assurance services
The external auditor assists the Supervisory Council in several of their supervisory reviews. The fees for this work are agreed separately and are presented as Other assurance services.
Tax advice
Services provided to Norges Bank in 2023 relate exclusively to services provided by EY. This is mainly related to services for NBIM
Other operating income
Accounting policy
Other operating income is recognised at the time a service is rendered. The transaction price is agreed annually and primarily contains fixed elements.
Table 17.3 Other operating income
|
Amounts in NOK million |
2023 |
2022 |
|
Services, banks |
122 |
108 |
|
Services, government (see note 19 Related parties) |
1 |
- |
|
Rent (see note 19 Related parties) |
31 |
33 |
|
Other income |
7 |
7 |
|
Total other operating income |
161 |
149 |
Services for banks
Norges Bank performs settlement services for banks through Norges Bank’s settlement system (NBO). To promote efficient and robust settlement of payments in Norges Bank, expenses for account maintenance and settlement services are covered by the annual fees for NBO. The assumption is that revenues will cover two-thirds of the overall cost of implementing and operating the settlement system. A third of expenses is attributable to central banking functions and covered by Norges Bank.
Note 18 Non-financial assets
Accounting policy
Non-current assets are recognised at cost, less accumulated straight-line depreciation over their expected useful life.
Gold comprises gold coins and gold bars that are part of the Bank’s historical collections. The holdings were recognised at estimated cost in accordance with fair value on the date the gold was reclassified from international reserves to non-current assets. In the event the metallic value of gold rises, the holdings of gold are not revalued.
The collection of art and numismatic objects such as medals, banknotes and coins is recognised at estimated cost on the basis of the most recent appraisal.
Impairment testing
An impairment test is performed if there is an indication that an asset is impaired. If the carrying amount exceeds fair value, the carrying amount will be reduced to fair value.
Table 18.1 Non-financial assets
|
Amounts in NOK million |
31.12.2023 |
31.12.2022 |
|
Non-current assets |
1 492 |
1 481 |
|
Gold |
291 |
291 |
|
Art and numismatic collections |
91 |
90 |
|
Other assets |
204 |
185 |
|
Non-financial assets |
2 078 |
2 047 |
Table 18.2 Non-current assets
|
2023 |
||||||
|
Intangible assets |
Property, plant and equipment |
|||||
|
Amounts in NOK million |
Software |
Buildings |
Land |
Other |
Plant under construction |
Total |
|
Cost at 1 Jan. |
676 |
3 434 |
60 |
258 |
48 |
4 476 |
|
+ Additions for the year |
7 |
99 |
- |
12 |
26 |
144 |
|
- Disposals for the year |
-10 |
-11 |
- |
-102 |
- |
-123 |
|
-/+ Adjustments for the year |
- |
- |
- |
- |
- |
- |
|
Cost at 31 Dec. |
673 |
3 522 |
60 |
168 |
74 |
4 497 |
|
- Accumulated depreciation and impairment at 1 Jan. |
-629 |
-2 129 |
- |
-237 |
- |
-2 995 |
|
+ Disposals depreciation for the year |
10 |
11 |
- |
102 |
- |
123 |
|
- Depreciation for the year |
-23 |
-105 |
- |
-7 |
- |
-135 |
|
- Impairment for the year |
- |
- |
- |
- |
- |
- |
|
Depreciation and impairment at 31 Dec. |
-641 |
-2 223 |
- |
-142 |
- |
-3 007 |
|
Carrying amount at 31 Dec. |
32 |
1 299 |
60 |
26 |
74 |
1 491 |
|
Depreciation schedule, no. of years |
3–6 |
5–75 |
none |
4–10 |
none |
|
|
2022 |
||||||
|
Intangible assets |
Property, plant and equipment |
|||||
|
Amounts in NOK million |
Software |
Buildings |
Land |
Other |
Plant under construction |
Total |
|
Cost at 1 Jan. |
677 |
3 333 |
60 |
261 |
38 |
4 370 |
|
+ Additions for the year |
9 |
100 |
- |
9 |
10 |
128 |
|
- Disposals for the year |
-10 |
- |
- |
-11 |
- |
-21 |
|
-/+ Adjustments for the year |
- |
- |
- |
- |
- |
- |
|
Cost at 31 Dec. |
676 |
3 434 |
60 |
258 |
48 |
4 476 |
|
- Accumulated depreciation and impairment at 1 Jan. |
-610 |
-2 014 |
- |
-237 |
- |
-2 862 |
|
+ Disposals depreciation for the year |
10 |
- |
- |
7 |
- |
17 |
|
- Depreciation for the year |
-29 |
-115 |
- |
-8 |
- |
-151 |
|
- Impairment for the year |
- |
- |
- |
- |
- |
- |
|
Depreciation and impairment at 31 Dec. |
-629 |
-2 129 |
- |
-237 |
- |
-2 995 |
|
Carrying amount at 31 Dec. |
47 |
1 305 |
60 |
21 |
48 |
1 481 |
|
Depreciation schedule, no. of years |
3–6 |
5–75 |
none |
4–10 |
none |
|
Bankplassen 4
In 1986, Bankplassen 4 was transferred from Norges Bank to the government by the then Norwegian Directorate of Public Construction and Property, now Statsbygg. The transfer agreement pertains to ownership rights to the building and a ground lease, limited to the plot the building occupies. Norges Bank does not receive rent for the right of use. The term of the lease is 80 years, with the option of 10-year extensions. If the lease is not renewed, the building reverts to Norges Bank free of charge. The building is fully depreciated and its carrying amount at 31 December 2023 is NOK 0.
Note 19 Related parties
Accounting policy
Norges Bank is owned by the Norwegian government and under IAS 24 Related Party Disclosures is exempt from the disclosure requirements pertaining to related party transactions and outstanding balances, including commitments, with the Norwegian government. This includes transactions with other entities that are related parties because the Norwegian government has control of, joint control of, or significant influence over both Norges Bank and the other entities.
Norges Bank, including the GPFG, is a separate legal entity that is wholly owned by the government through the Ministry of Finance. See note 1 General information for information regarding the relationship between the Ministry of Finance, Norges Bank and the GPFG. All transactions are carried out in its own name and on market terms.
For information regarding transactions with governing bodies and senior executives of Norges Bank, see note 15 Personnel expenses.
The management of the GPFG
Norges Bank is not exposed to financial risk from its management of the GPFG.
The Ministry of Finance has placed funds for asset management by the GPFG as a krone deposit in a special account with Norges Bank (the krone account). The krone deposit is subsequently placed with Norges Bank Investment Management for investment management.
Inflow to/ -withdrawal from the Ministry of Finance’s krone account
Transfers are made to and from the krone account in accordance with the management mandate.
Inflow to/ -withdrawal from the krone account are carried out by monthly transfers between the GPFG and Norges Bank. In 2023, net inflow amount to the krone account was NOK 711 billion, compared with net inflow amount of NOK 1 090 billion in 2022.
Of the transferred amount, 5 percent is held back to the month after, in order to adjust the transferred currency amount to the amount in NOK instructed by the Ministry of Finance. Unsettled transfers between the GPFG and Norges Bank are presented in the balance sheet as a net balance between the two reporting entities, on the balance sheet line Other financial liabilities. Unsettled transfers were NOK 2 365 million at year-end 2023, compared with NOK 1 468 million at year-end 2022
Management fee
Accounting policy
The management fee for management of the GPFG accrues during the financial year and is presented in the income statement as Management fee, GPFG. Unsettled management fee at year-end is measured at amortised cost.
Norges Bank’s total operating expenses related to the management of the GPFG are reimbursed by the Ministry of Finance as principal. The management fee corresponds to actual costs incurred by Norges Bank, excluding administration fees invoiced separately to Norges Bank’s subsidiaries in Norway and including performance-based fees to external managers. The management fee was NOK 6 632 million in 2023 and NOK 5 226 million in 2022.
The management fee is withdrawn from the krone account during the year based on forecasts. The difference between the total amount withdrawn and the actual management fee for the year is presented either on the balance sheet line Other financial assets or Other financial liabilities and is settled the following year.
In 2023, Norges Bank received a payment of NOK 6.5 billion withdrawn from the krone account, compared with NOK 5.0 billion in 2022. At year-end 2023, Norges Bank's liability to the GPFG totalled NOK 168 million to the GPFG, compared with NOK 274 million at year-end 2022.
See note 20.12 Management costs for further information.
Transactions between Norges Bank and the GPFG
Internal trades in the form of money market lending or borrowing between the GPFG and Norges Bank’s equity portfolio are presented in the balance sheet as a net balance between the portfolios, either on the balance sheet line Other financial assets or Other financial liabilities. For Norges Bank, net balance between the portfolios amounted to a liability of NOK 59 million at year-end 2023, compared with NOK 302 million at year-end 2022.
Associated income and expense items are presented net in the income statement as Other financial income/expense. All transactions are carried out at market prices.
Transactions between Norges Bank and wholly owned subsidiaries
As part of the management of the GPFG’s investments in real estate and infrastructure for renewable energy, Norwegian subsidiaries have been established that are wholly owned by Norges Bank. For an overview of the companies that own and manage the investments, as well as consolidated subsidiaries, see note 20.16 Interests in other entities. For further information regarding transactions with subsidiaries, see note 20.6 Unlisted real estate and note 20.7 Unlisted renewable energy infrastructure.
Other transactions with the government
Pursuant to section 3-7 of the Central Bank Act, Norges Bank provides services in connection with government borrowing and government debt management and the central government’s group account. Under the new Central Bank Act in force from 1 January 2020, Norges Bank’s costs related to these tasks are no longer covered by the Ministry of Finance.
Pursuant to point 5 of the Guidelines for provisions and allocations of Norges Bank’s profit or loss, “In connection with the closing of the books each year, an amount equal to one third of the capital in the Transfer Fund shall be transferred to the Treasury.” This transfer amounted to NOK 17.6 billion for 2023 and NOK 8.1 billion for 2022. On the basis of the prepared financial statements, the transfer takes place in the following year, but the amount due appears under the balance sheet item Other liabilities in the balance sheet at 31 December.
Other related party transactions
Norges Bank has transactions with other government agencies and bodies. These transactions are primarily related to leasing of buildings and amounted to NOK 32 million in 2023 and NOK 34 million in 2022.
Income statement
|
Amounts in NOK million |
Note |
2023 |
2022 |
|
Profit/loss on the portfolio before foreign exchange gain/loss |
|||
|
Income/expense from: |
|||
|
- Equities |
4 |
2 030 561 |
-1 201 835 |
|
- Bonds |
4 |
231 769 |
-453 128 |
|
- Unlisted real estate |
6 |
-47 389 |
-2 213 |
|
- Unlisted infrastructure |
7 |
-257 |
897 |
|
- Financial derivatives |
4 |
15 752 |
23 926 |
|
- Secured lending |
13 |
9 922 |
4 845 |
|
- Secured borrowing |
13 |
-13 278 |
-4 792 |
|
Tax expense |
10 |
-13 555 |
-4 850 |
|
Interest income/expense |
49 |
-22 |
|
|
Other income/expense |
4 |
-4 |
|
|
Profit/loss on the portfolio before foreign exchange gain/loss |
2 213 577 |
-1 637 176 |
|
|
Foreign exchange gain/loss |
11 |
409 441 |
641 850 |
|
Profit/loss on the portfolio |
2 623 018 |
-995 326 |
|
|
Management fee |
12 |
-6 632 |
-5 226 |
|
Profit/loss and total comprehensive income |
2 616 385 |
-1 000 551 |
Balance sheet
|
Amounts in NOK million |
Note |
31.12.2023 |
31.12.2022 |
|
Assets |
|||
|
Deposits in banks |
8 584 |
12 061 |
|
|
Secured lending |
13,14 |
728 559 |
462 982 |
|
Cash collateral posted |
14 |
19 361 |
21 601 |
|
Unsettled trades |
33 812 |
11 428 |
|
|
Equities |
5 |
10 577 325 |
8 138 602 |
|
Equities lent |
5,13 |
493 949 |
451 799 |
|
Bonds |
5 |
3 563 613 |
2 968 272 |
|
Bonds lent |
5,13 |
1 006 711 |
886 555 |
|
Financial derivatives |
5,14 |
19 192 |
20 498 |
|
Unlisted real estate |
6 |
300 541 |
329 732 |
|
Unlisted infrastructure |
7 |
17 593 |
14 489 |
|
Withholding tax receivable |
10 |
10 522 |
8 937 |
|
Other assets |
17 |
2 752 |
2 017 |
|
Management fee receivable |
168 |
274 |
|
|
Total assets |
16 782 681 |
13 329 248 |
|
|
Liabilities and owner's capital |
|||
|
Secured borrowing |
13,14 |
911 548 |
796 082 |
|
Cash collateral received |
14 |
28 754 |
14 801 |
|
Unsettled trades |
44 247 |
44 329 |
|
|
Financial derivatives |
5,14 |
33 055 |
40 159 |
|
Deferred tax |
10 |
8 246 |
4 488 |
|
Other liabilities |
17 |
112 |
56 |
|
Total liabilities |
1 025 962 |
899 915 |
|
|
Owner's capital |
15 756 719 |
12 429 334 |
|
|
Total liabilities and owner's capital |
16 782 681 |
13 329 248 |
Statement of cash flows
Accounting policy
The statement of cash flows is prepared in accordance with the direct method. Major classes of gross cash receipts and payments are presented separately, with the exception of specific transactions that are presented on a net basis, primarily relating to the purchase and sale of financial instruments. Cash flows related to the fund’s investment activities are presented as operating activities, since they represent the income-generating activities of the fund. Inflows and withdrawals between the GPFG and the Norwegian government are financing activities. These transfers have been settled in the period. Accrued inflows/withdrawals are shown in the statement of changes in owner’s capital.
|
Amounts in NOK million, receipt (+) / payment (-) |
Note |
2023 |
2022 |
|
Operating activities |
|||
|
Receipts of dividend from equities |
234 173 |
190 235 |
|
|
Receipts of interest from bonds |
90 644 |
55 724 |
|
|
Receipts of interest and dividend from unlisted real estate |
6 |
6 861 |
6 156 |
|
Receipts of interest and dividend from unlisted infrastructure |
7 |
752 |
162 |
|
Net receipts of interest and fee from secured lending and borrowing |
-3 730 |
1 521 |
|
|
Receipts of dividend, interest and fee from holdings of equities, bonds, unlisted real estate and unlisted infrastructure |
328 700 |
253 797 |
|
|
Net cash flow from purchase and sale of equities |
-436 867 |
-719 766 |
|
|
Net cash flow from purchase and sale of bonds |
-412 160 |
-702 877 |
|
|
Net cash flow to/from investments in unlisted real estate |
6 |
-6 742 |
-3 930 |
|
Net cash flow to/from investments in unlisted infrastructure |
7 |
-3 256 |
1 143 |
|
Net cash flow financial derivatives |
2 219 |
52 485 |
|
|
Net cash flow cash collateral related to derivative transactions |
16 030 |
-16 013 |
|
|
Net cash flow secured lending and borrowing |
-184 578 |
52 860 |
|
|
Net payment of taxes |
10 |
-11 173 |
-11 058 |
|
Net cash flow related to interest on deposits in banks and bank overdraft |
428 |
30 |
|
|
Net cash flow related to other income/expense, other assets and other liabilities |
947 |
478 |
|
|
Management fee paid to Norges Bank1 |
-6 526 |
-4 964 |
|
|
Net cash inflow/outflow from operating activities |
-712 977 |
-1 097 816 |
|
|
Financing activities |
|||
|
Inflow from the Norwegian government |
710 104 |
1 089 712 |
|
|
Withdrawal by the Norwegian government |
- |
- |
|
|
Net cash inflow/outflow from financing activities |
710 104 |
1 089 712 |
|
|
Net change deposits in banks |
|||
|
Deposits in banks at 1 January |
12 061 |
18 450 |
|
|
Net increase/decrease of cash in the period |
-2 873 |
-8 104 |
|
|
Net foreign exchange gain/loss on cash |
-604 |
1 715 |
|
|
Deposits in banks at end of period |
8 584 |
12 061 |
1 Management fee in the statement of cash flows consists of transfers to/from the krone account in connection with the settlement of management costs incurred in Norges Bank.
Statement of changes in owner’s capital
Accounting policy
Owner’s capital for the GPFG comprises contributed capital in the form of accumulated net inflows from the Norwegian government and retained earnings in the form of total comprehensive income. Owner’s capital corresponds to the Ministry of Finance’s krone account in Norges Bank.
|
Amounts in NOK million |
Inflows from owner |
Retained earnings |
Total owner's capital |
|
1 January 2022 |
2 967 570 |
9 372 515 |
12 340 085 |
|
Profit/loss and total comprehensive income |
- |
-1 000 551 |
-1 000 551 |
|
Inflow during the period |
1 089 800 |
- |
1 089 800 |
|
Withdrawal during the period |
- |
- |
- |
|
31 December 2022 |
4 057 370 |
8 371 964 |
12 429 334 |
|
1 January 2023 |
4 057 370 |
8 371 964 |
12 429 334 |
|
Profit/loss and total comprehensive income |
- |
2 616 385 |
2 616 385 |
|
Inflow during the period |
711 000 |
- |
711 000 |
|
Withdrawal during the period |
- |
- |
- |
|
31 December 2023 |
4 768 370 |
10 988 349 |
15 756 719 |
GPFG Note 1 General information
General information relating to the GPFG appears in note 1 General information
GPFG Note 2 Accounting policies
The accounting policies for the financial reporting of the GPFG are described in note 2 Accounting policies.
GPFG Note 3 Returns
Table 3.1 shows return for the fund and for each asset class.
Table 3.1 Returns
|
2023 |
2022 |
|
|
Returns measured in the fund's currency basket (percent) |
||
|
Return on equity investments |
21.25 |
-15.36 |
|
Return on fixed-income investments |
6.13 |
-12.11 |
|
Return on unlisted real estate investments |
-12.37 |
0.07 |
|
Return on unlisted infrastructure investments |
3.68 |
5.12 |
|
Return on fund |
16.14 |
-14.11 |
|
Relative return on fund (percentage points) |
-0.18 |
0.87 |
|
Returns measured in Norwegian kroner (percent) |
||
|
Return on equity investments |
26.26 |
-9.27 |
|
Return on fixed-income investments |
10.51 |
-5.78 |
|
Return on unlisted real estate investments |
-8.75 |
7.27 |
|
Return on unlisted infrastructure investments |
7.96 |
12.69 |
|
Return on fund |
20.93 |
-7.93 |
A time-weighted rate of return methodology is applied. The fair value of holdings is determined at the time of cash flows into and out of the asset classes and the fund as a whole. Geometric linking of periodic returns is used for longer return periods.
Returns are calculated net of transaction costs, non-reclaimable withholding taxes on dividends and interest, and taxes on realised capital gains.
Returns are measured both in Norwegian kroner and in the fund’s currency basket. The currency basket is weighted according to the currency composition of the benchmark index for equities and bonds. Returns measured in the fund’s currency basket are calculated as the geometric difference between the fund’s returns measured in Norwegian kroner and the return of the currency basket.
The fund’s relative return is calculated as the arithmetic difference between the fund’s return and the return of the fund’s benchmark index. The fund’s benchmark index consists of global equity and bond indices determined by the Ministry of Finance and is calculated by weighting the monthly returns of the benchmark indices for each of the two asset classes, using the weight in the actual benchmark at the beginning of the month for the respective asset class.
GPFG Note 4 Income/expense from equities, bonds and financial derivatives
Accounting policy
Investments in equities, bonds and financial derivatives are measured at fair value through profit and loss. See note 2 Accounting policies for further information.
Tables 4.1 to 4.3 specify the change in fair value in the period, where the line Income/expense shows the amount recognised in profit or loss for the relevant income statement line. The following principles for presentation apply for the respective income and expenses presented in the tables:
Dividend income is recognised on the ex-dividend date, which is when the right to receive the dividend is established.
Interest income is recognised when the interest is accrued. Interest expense is recognised as incurred. The measurement of interest income and expense is based on contractual terms.
Realised gain/loss mainly represents amounts realised when assets or liabilities are derecognised. Average acquisition cost is assigned upon derecognition. Realised gain/loss includes transaction costs, which are expensed as incurred. Transaction costs are defined as all costs directly attributable to the completed transaction. For investments in equities and bonds, these normally comprise commission fees and stamp duty.
Unrealised gain/loss represents changes in fair value for the related balance sheet item during the period, that are not attributable to the aforementioned categories.
Table 4.1 Specification Income/expense from equities
|
Amounts in NOK million |
2023 |
2022 |
|
Dividends |
240 842 |
197 631 |
|
Realised gain/loss |
236 321 |
191 774 |
|
Unrealised gain/loss |
1 553 398 |
-1 591 241 |
|
Income/expense from equities before foreign exchange gain/loss |
2 030 561 |
-1 201 835 |
Table 4.2 Specification Income/expense from bonds
|
Amounts in NOK million |
2023 |
2022 |
|
Interest |
109 431 |
66 093 |
|
Realised gain/loss |
-101 065 |
-130 749 |
|
Unrealised gain/loss |
223 402 |
-388 472 |
|
Income/expense from bonds before foreign exchange gain/loss |
231 769 |
-453 128 |
Table 4.3 Specification Income/expense from financial derivatives
|
Amounts in NOK million |
2023 |
2022 |
|
Interest |
4 185 |
7 449 |
|
Realised gain/loss |
13 404 |
12 616 |
|
Unrealised gain/loss |
-1 837 |
3 862 |
|
Income/expense from financial derivatives before foreign exchange gain/loss |
15 752 |
23 926 |
GPFG Note 5 Holdings of equities, bonds and financial derivatives
Accounting policy
Investments in equities and bonds are measured at fair value through profit or loss. Earned dividends and interest are presented in the balance sheet on the same line as the underlying financial instruments. The balance sheet line Equities includes investments in depository certificates (GDR/ADR) and units in listed funds, such as REITs. Lent equities and bonds are presented separately. For more information on lent securities, see note 13 Secured lending and borrowing.
Financial derivatives are measured at fair value through profit or loss. Exchange-traded futures and associated variation margin are presented net in the balance sheet, since there is a legally enforceable right to offset and the intention is to settle on a net basis or to realise the asset and settle the liability simultaneously. Norges Bank does not engage in hedge accounting, therefore no financial instruments are designated as hedging instruments.
For further information on fair value measurement, see note 8 Fair value measurement. Changes in fair value are recognised in the income statement and specified in note 4 Income/expense from equities, bonds and financial derivatives.
Table 5.1 specifies the sector composition of investments in equities.
Table 5.1 Equities
|
31.12.2023 |
31.12.2022 |
|
|
Amounts in NOK million |
Fair value incl. earned dividends |
Fair value incl. earned dividends |
|
Technology |
2 465 516 |
1 517 241 |
|
Financials |
1 655 254 |
1 370 888 |
|
Consumer discretionary |
1 562 073 |
1 151 176 |
|
Industrials |
1 447 684 |
1 141 525 |
|
Health care |
1 230 877 |
1 104 937 |
|
Consumer staples |
618 337 |
569 295 |
|
Real estate |
608 689 |
478 101 |
|
Basic materials |
441 742 |
381 322 |
|
Energy |
413 062 |
378 240 |
|
Telecommunications |
367 904 |
265 277 |
|
Utilities |
260 137 |
232 400 |
|
Total equities |
11 071 274 |
8 590 402 |
|
Of which presented in the balance sheet line Equities |
10 577 325 |
8 138 602 |
|
Of which presented in the balance sheet line Equities lent |
493 949 |
451 799 |
At the end of 2023, earned dividends amounted to NOK 12 580 million (NOK 10 306 million in 2022).
Table 5.2 specifies investments in bonds per category. Notional value represents the amount that shall be returned at maturity, also referred to as the par value of the bond.
Table 5.2 Bonds
|
31.12.2023 |
31.12.2022 |
|||
|
Amounts in NOK million |
Notional value |
Fair value incl. earned interest |
Notional value |
Fair value incl. earned interest |
|
Government bonds |
||||
|
Government bonds issued in the government's local currency |
2 742 815 |
2 594 816 |
2 366 163 |
2 165 605 |
|
Total government bonds |
2 742 815 |
2 594 816 |
2 366 163 |
2 165 605 |
|
Government-related bonds |
||||
|
Sovereign bonds |
11 311 |
10 632 |
11 053 |
9 460 |
|
Bonds issued by local authorities |
154 963 |
142 393 |
149 232 |
132 412 |
|
Bonds issued by supranational bodies |
101 177 |
98 290 |
104 967 |
90 526 |
|
Bonds issued by federal agencies |
166 493 |
155 662 |
162 295 |
149 450 |
|
Total government-related bonds |
433 944 |
406 977 |
427 547 |
381 848 |
|
Inflation-linked bonds |
||||
|
Inflation-linked bonds issued by government authorities |
232 929 |
283 137 |
250 560 |
243 441 |
|
Total inflation-linked bonds |
232 929 |
283 137 |
250 560 |
243 441 |
|
Corporate bonds |
||||
|
Convertible bonds |
57 |
73 |
- |
- |
|
Bonds issued by utilities |
100 984 |
95 387 |
83 977 |
74 812 |
|
Bonds issued by financial institutions |
466 844 |
446 681 |
427 297 |
382 224 |
|
Bonds issued by industrial companies |
487 613 |
460 147 |
419 297 |
372 278 |
|
Total corporate bonds |
1 055 498 |
1 002 288 |
930 570 |
829 314 |
|
Securitised bonds |
||||
|
Covered bonds |
307 782 |
283 106 |
269 778 |
234 618 |
|
Total securitised bonds |
307 782 |
283 106 |
269 778 |
234 618 |
|
Total bonds |
4 772 968 |
4 570 324 |
4 244 619 |
3 854 827 |
|
Of which presented in the balance sheet line Bonds |
3 563 613 |
2 968 272 |
||
|
Of which presented in the balance sheet line Bonds lent |
1 006 711 |
886 555 |
||
At the end of 2023, earned interest amounted to NOK 34 537 million (NOK 22 218 million in 2022).
Financial derivatives
Financial derivatives are used to adjust the exposure in various portfolios as a cost-efficient alternative to trading in the underlying securities. Foreign exchange derivatives are also used in connection with liquidity management. Equity derivatives with an option component are often a result of corporate actions, and can be converted into equities or sold. The GPFG also uses equity swaps in combination with purchase and sale of equities.
Table 5.3 specifies financial derivatives recognised in the balance sheet. Notional amounts are the basis for calculating any cash flows and gains/losses for derivative contracts. This provides information on the extent to which different types of financial derivatives are used.
Table 5.3 Financial derivatives
|
31.12.2023 |
31.12.2022 |
|||||
|
Amounts in NOK million |
Notional amount |
Fair value |
Notional amount |
Fair value |
||
|
Asset |
Liability |
|||||
|
Asset |
Liability |
|||||
|
Foreign exchange derivatives |
976 868 |
6 388 |
18 148 |
1 028 213 |
6 955 |
28 135 |
|
Interest rate derivatives |
464 466 |
11 920 |
12 323 |
390 528 |
13 049 |
11 615 |
|
Credit derivatives |
52 311 |
706 |
2 556 |
53 290 |
- |
375 |
|
Equity derivatives1 |
- |
69 |
- |
- |
274 |
- |
|
Exchange-traded futures contracts2 |
95 742 |
110 |
29 |
91 638 |
221 |
34 |
|
Total financial derivatives |
1 589 387 |
19 192 |
33 055 |
1 563 669 |
20 498 |
40 159 |
1 Notional amounts are not considered relevant for equity derivatives and are therefore not included in the table.
2 Exchange-traded futures contracts have daily margin payments and the net amount recognised in the balance sheet is normally zero at the balance sheet date, with the exception of futures contracts in certain markets where there is different timing for setting the market value for recognition in the balance sheet and daily margining.
Foreign exchange derivatives
This consists of foreign exchange forward contracts, which are agreements to buy or sell a specified quantity of foreign currency on an agreed future date.
Interest rate derivatives
This consists of agreements between two parties to exchange interest payment streams based on different interest rate calculation methods. Interest rate derivatives recognised in the balance sheet are mainly interest rate swaps, where one party pays a floating rate of interest and the other pays a fixed rate.
Credit derivatives
This comprises credit default swaps indices (CDS indices) for corporate bonds, where one party (the seller) assumes the credit risk and the other party (the buyer) reduces the credit risk on the underlying index of corporate bonds. Under a CDS index contract, the seller receives a periodic coupon from the buyer as compensation for assuming the credit risk. The buyer only receives payment if the credit protection is triggered by for instance default on the underlying credit in the index (credit event).
Equity derivatives
Equity derivatives are derivatives with exposure to an underlying equity. Equity derivatives recognised in the balance sheet include instruments with an option component, such as rights and warrants. These instruments grant the owner the right to purchase an equity at an agreed price within a certain time frame.
Futures contracts
Futures contracts are listed contracts to buy or sell a specified asset (security, index, interest rate, power or similar assets) at an agreed price at a future point in time.
Equity swaps in combination with purchase or sale of equities
Equity swaps are entered into in combination with purchases or sales of equities, as part of the fund’s secured lending and borrowing activities. See note 13 Secured lending and borrowing for further information. The GPFG does not take market risk in these transactions and therefore has virtually no net exposure. The equity swaps (derivative) are not recognised in the balance sheet. At the end of 2023, equities purchased in combination with offsetting equity swaps amounted to NOK 250 billion (NOK 104 billion at the end of 2022). Equity sales in combination with offsetting equity swaps amounted to NOK 132 billion (NOK 105 billion at the end of 2022). See also table 14.1 in note 14 Collateral and offsetting.
GPFG Note 6 Unlisted real estate
Accounting policy
Investments in unlisted real estate are made through subsidiaries of Norges Bank, exclusively established as part of the management of the GPFG. Subsidiaries presented as Unlisted real estate in the balance sheet are measured at fair value through profit or loss. See note 2 Accounting policies for further information.
The fair value of unlisted real estate is equivalent to the sum of the GPFG’s share of assets and liabilities in the underlying real estate subsidiaries, measured at fair value. For further information, see note 8 Fair value measurement.
Changes in fair value are recognised in the income statement and presented as Income/expense from unlisted real estate.
The following principles for presentation apply for the respective income and expense elements presented in table 6.1:
Interest is recognised when it is earned.
Dividends are recognised when the dividend is formally approved by the general meeting or equivalent decision-making body, or is paid out in accordance with the company’s articles of association.
Table 6.1 Income/expense from unlisted real estate
|
Amounts in NOK million |
2023 |
2022 |
|
Receipts of interest and dividend |
6 861 |
6 156 |
|
Unrealised gain/loss1 |
-54 251 |
-8 369 |
|
Income/expense from unlisted real estate before foreign exchange gain/loss |
-47 389 |
-2 213 |
1 Earned interest and dividends which are not cash-settled are included in Unrealised gain/loss.
Table 6.2 Changes in carrying amounts unlisted real estate
|
Amounts in NOK million |
31.12.2023 |
31.12.2022 |
|
Unlisted real estate at 1 January |
329 732 |
310 134 |
|
Net cash flow to/from investments |
6 742 |
3 930 |
|
Unrealised gain/loss |
-54 251 |
-8 369 |
|
Foreign exchange gain/loss |
18 318 |
24 036 |
|
Unlisted real estate, closing balance for the period |
300 541 |
329 732 |
Cash flows between the GPFG and subsidiaries presented as Unlisted real estate
The GPFG makes cash contributions to subsidiaries in the form of equity and long-term loan financing, to fund investments in real estate assets, primarily properties. Net income in the underlying real estate companies can be distributed back to the GPFG in the form of interest and dividend as well as repayment of equity and loan financing. There are no significant restrictions on the distribution of interest and dividend from subsidiaries to the GPFG.
Net income distributed back to the GPFG in the form of interest and dividend is presented in the statement of cash flows as Receipts of interest and dividend from unlisted real estate. Cash flows in the form of equity and loan financing, as well as repayment of these, are presented in the statement of cash flows as Net cash flows to/from investments in unlisted real estate.
Net income that is not distributed back to the GPFG is reinvested in the underlying real estate companies, to finance for instance property development and repayment of external debt.
A net cash flow from the GPFG to subsidiaries will result in an increase in the value of Unlisted real estate in the balance sheet, while a net cash flow from subsidiaries to the GPFG will result in a decrease.
Tables 6.3 specifies cash flows between the GPFG and subsidiaries presented as Unlisted real estate.
Table 6.3 Cash flow unlisted real estate
|
Amounts in NOK million |
2023 |
2022 |
|
Receipts of interest from ongoing operations |
2 042 |
1 568 |
|
Receipts of dividends from ongoing operations |
4 709 |
4 200 |
|
Receipts of interest from sales |
110 |
219 |
|
Receipts of dividends from sales |
- |
168 |
|
Receipts of interest and dividend from unlisted real estate |
6 861 |
6 156 |
|
Payments for new investments |
-7 007 |
-7 074 |
|
Payments for property development |
-1 778 |
-1 186 |
|
Net payments external debt |
-104 |
72 |
|
Receipts from ongoing operations |
1 533 |
1 694 |
|
Receipts from sales |
615 |
2 564 |
|
Net cash flow to/from investments in unlisted real estate |
-6 742 |
-3 930 |
|
Net cash flow unlisted real estate |
119 |
2 225 |
|
Of which cash flow from ongoing operations |
8 284 |
7 463 |
|
Of which cash flow to/from other activities |
-8 164 |
-5 237 |
Underlying real estate companies
Real estate subsidiaries have investments in other non-consolidated, unlisted companies. For further information, see note 16 Interests in other entities.
Principles for presentation
The following principles apply for the respective income and expense elements in the subsidiaries presented in table 6.4:
Rental income is recognised on a straight-line basis over the lease term. Net rental income mainly comprises accrued rental income, less costs relating to the operation and maintenance of properties.
Asset management fees are directly related to the underlying properties and are primarily linked to the operation and development of properties and leases. Fixed fees are expensed as incurred. Variable fees to external asset managers are based on achieved performance over time. The provision for variable fees is based on the best estimate of the incurred fees to be paid. The change in best estimate in the period is recognised in profit or loss.
Transaction costs and fees from purchases and sales of properties are incurred as one-off costs and expensed as incurred.
Table 6.4 specifies the GPFG’s share of net income generated in the underlying real estate companies, which is the basis for Income/expense from unlisted real estate presented in table 6.1.
Table 6.4 Income from underlying real estate companies
|
Amounts in NOK million |
2023 |
2022 |
|
Net rental income |
13 852 |
12 807 |
|
External asset management - fixed fees |
-1 044 |
-1 071 |
|
External asset management - variable fees |
-23 |
-33 |
|
Internal asset management - fixed fees1 |
-123 |
-99 |
|
Operating costs in wholly-owned subsidiaries2 |
-82 |
-65 |
|
Operating costs in joint ventures |
-171 |
-166 |
|
Interest expense external debt |
-776 |
-644 |
|
Tax expense |
-210 |
-303 |
|
Net income from ongoing operations |
11 424 |
10 427 |
|
Realised gain/loss |
46 |
769 |
|
Unrealised gain/loss3 |
-58 630 |
-13 085 |
|
Realised and unrealised gain/loss |
-58 584 |
-12 316 |
|
Transaction costs and fees from purchases and sales |
-229 |
-324 |
|
Net income underlying real estate companies |
-47 389 |
-2 213 |
1 Internal asset management is carried out on 100 percent owned properties by employees in a wholly-owned, consolidated subsidiary.
2 Operating costs in wholly-owned subsidiaries are measured against the upper limit from the Ministry of Finance, see note 12 for more information.
3 Unrealised gain/loss presented in table 6.1 includes net income in the underlying real estate companies which is not distributed back to the GPFG, and will therefore not correspond to Unrealised gains/loss presented in table 6.4.
Table 6.5 specifies the GPFG’s share of assets and liabilities in the underlying real estate companies, which comprises the closing balance for Unlisted real estate as presented in table 6.2.
Table 6.5 Assets and liabilities underlying real estate companies
|
Amounts in NOK million |
31.12.2023 |
31.12.2022 |
|
Properties |
327 165 |
356 518 |
|
External debt |
-25 564 |
-24 751 |
|
Net other assets and liabilities1 |
-1 060 |
-2 036 |
|
Total assets and liabilities underlying real estate companies |
300 541 |
329 732 |
1 Net other assets and liabilities comprise cash, tax and operational receivables and liabilities.
GPFG Note 7 Unlisted renewable energy infrastructure
Accounting policy
Investments in unlisted renewable energy infrastructure (Unlisted infrastructure) are made through subsidiaries of Norges Bank, exclusively established as part of the management of the GPFG. Subsidiaries presented as Unlisted infrastructure in the balance sheet are measured at fair value through profit or loss. See note 2 Accounting policies for further information.
The fair value of unlisted infrastructure is equivalent to the sum of the GPFG’s share of assets and liabilities in the underlying infrastructure subsidiaries, measured at fair value. For further information, see note 8 Fair value measurement.
Changes in fair value are recognised in the income statement and presented as Income/expense from unlisted infrastructure.
The following principles for presentation apply for the respective income and expense elements presented in table 7.1:
Interest is recognised when it is earned.
Dividends are recognised when the dividend is formally approved by the general meeting or equivalent decision-making body, or is paid out in accordance with the company’s articles of association.
Table 7.1 Income/expense from unlisted infrastructure
|
Amounts in NOK million |
2023 |
2022 |
|
Receipts of interest and dividend |
752 |
162 |
|
Unrealised gain/loss1 |
-1 010 |
735 |
|
Income/expense from unlisted infrastructure before foreign exchange gain/loss |
-257 |
897 |
1 Earned interest and dividends which are not cash-settled are included in Unrealised gain/loss.
Table 7.2 Changes in carrying amounts unlisted infrastructure
|
Amounts in NOK million |
31.12.2023 |
31.12.2022 |
|
Unlisted infrastructure at 1 January |
14 489 |
14 287 |
|
Net cash flow to/from investments |
3 256 |
-1 143 |
|
Unrealised gain/loss |
-1 010 |
735 |
|
Foreign exchange gain/loss |
859 |
609 |
|
Unlisted infrastructure, closing balance for the period |
17 593 |
14 489 |
Cash flows between the GPFG and subsidiaries presented as Unlisted infrastructure
The GPFG makes cash contributions to subsidiaries in the form of equity and long-term loan financing, to fund investments in renewable energy infrastructure. Net income in the underlying infrastructure companies can be distributed back to the GPFG in the form of interest and dividend as well as repayment of equity and loan financing. There are no significant restrictions on the distribution of interest and dividend from subsidiaries to the GPFG.
Net income which is distributed back to the GPFG in the form of interest and dividend is presented in the statement of cash flows as Receipts of interest and dividend from unlisted infrastructure. Cash flows in the form of equity and loan financing, as well as repayment of these, are presented in the statement of cash flows as Net cash flows to/from investments in unlisted infrastructure.
A net cash flow from the GPFG to subsidiaries will result in an increase in the value of Unlisted infrastructure in the balance sheet, while a net cash flow from subsidiaries to the GPFG will result in a decrease.
Table 7.3 specifies cash flows between the GPFG and subsidiaries presented as Unlisted infrastructure.
Table 7.3 Cash flow unlisted infrastructure
|
Amounts in NOK million |
2023 |
2022 |
|
Receipts of interest from ongoing operations |
397 |
162 |
|
Receipts of dividends from ongoing operations |
355 |
- |
|
Receipts of interest and dividend from unlisted infrastructure |
752 |
162 |
|
Payments for new investments |
-2 939 |
- |
|
Payments for development of infrastructure assets |
-1 071 |
- |
|
Receipts from ongoing operations |
755 |
1 143 |
|
Net cash flow to/from investments in unlisted infrastructure |
-3 256 |
1 143 |
|
Net cash flow unlisted infrastructure |
-2 504 |
1 305 |
|
Of which cash flow from ongoing operations |
1 507 |
1 305 |
|
Of which cash flow to/from other activities |
-4 010 |
- |
Underlying infrastructure companies
Infrastructure subsidiaries have investments in other non-consolidated, unlisted companies. For further information, see note 16 Interests in other entities.
Principles for presentation
The following principles apply for the respective income and expense elements in the subsidiaries presented in table 7.4:
Income from the sale of renewable energy is recognised at the time of delivery. Net income from the sale of renewable energy mainly comprises accrued income less costs relating to the operation and maintenance of infrastructure assets.
Transaction costs and fees from purchases and sales of infrastructure for renewable energy are incurred as one-off costs and expensed as incurred.
Table 7.4 specifies the GPFG’s share of net income generated in the underlying infrastructure companies, which is the basis for Income/expense from unlisted infrastructure presented in table 7.1.
Table 7.4 Income from underlying infrastructure companies
|
Amounts in NOK million |
2023 |
2022 |
|
Net income from sale of renewable energy |
1 356 |
2 175 |
|
Operating costs in wholly-owned subsidiaries1 |
-8 |
-6 |
|
Operating costs in joint ventures |
-32 |
-16 |
|
Tax expense |
-70 |
-353 |
|
Interest income/expense |
26 |
- |
|
Net income from ongoing operations |
1 273 |
1 799 |
|
Unrealised gain/loss2 |
-1 468 |
-898 |
|
Transaction costs and fees from purchases |
-62 |
-4 |
|
Net income underlying infrastructure companies |
-257 |
897 |
1 Operating costs in wholly-owned subsidiaries are measured against the upper limit from the Ministry of Finance, see note 12 for more information.
2 Unrealised gain/loss presented in table 7.1 includes net income in the underlying infrastructure companies which is not distributed back to the GPFG, and will therefore not correspond to Unrealised gains/loss presented in table 7.4.
Table 7.5 specifies the GPFG’s share of assets and liabilities in the underlying infrastructure companies, which comprises the closing balance for Unlisted infrastructure as presented in table 7.2.
Table 7.5 Assets and liabilities underlying infrastructure companies
|
Amounts in NOK million |
31.12.2023 |
31.12.2022 |
|
Infrastructure assets |
15 936 |
13 983 |
|
Net other assets and liabilities1 |
1 657 |
506 |
|
Total assets and liabilities underlying infrastructure companies |
17 593 |
14 489 |
1 Net other assets and liabilities comprise cash, tax and operational receivables and liabilities.
GPFG Note 8 Fair value measurement
Accounting policy
All assets and liabilities presented as Equities, Bonds, Unlisted real estate, Unlisted infrastructure, Financial derivatives, Secured lending and borrowing, Deposits in banks and Cash collateral posted and received are measured at fair value through profit or loss.
Fair value, as defined by IFRS 13 Fair value measurement, is the price that would be received to sell an asset or paid to transfer a liability in an orderly transaction between market participants at the measurement date.
1. Introduction
Fair value for the majority of assets and liabilities is based on quoted market prices or observable market inputs. If the market is not active, fair value is established using standard valuation techniques. Estimating fair value can be complex and requires the use of judgement, particularly when observable inputs are not available. This valuation risk is addressed by the control environment in Norges Bank Investment Management, which is described in section 6 of this note.
2. The fair value hierarchy
All assets and liabilities that are part of the investment portfolio are classified in the three categories in the fair value hierarchy presented in table 8.1. The classification is determined by the observability of the market inputs used in the fair value measurement:
Level 1 comprises assets that are valued based on unadjusted quoted prices in active markets. An active market is defined as a market in which transactions take place with sufficient frequency and volume to provide pricing information on an ongoing basis.
Assets and liabilities classified as Level 2 are valued using models with market inputs that are either directly or indirectly observable. Inputs are considered observable when they are developed based on market data reflecting actual events and transactions.
Assets classified as Level 3 are valued using models with significant use of unobservable inputs. Inputs are considered to be unobservable when market data is not available, and the input is developed using the best available information on the assumptions that market participants would use when pricing the asset.
An overview of models and valuation techniques with their respective observable and unobservable inputs, categorised by type of instrument, is provided in section 4 of this note.
Significant estimates
Classification in the fair value hierarchy is based on set criteria, some of which may require the use of judgement.
Level 3 investments consist of instruments measured at fair value that are not traded or quoted in active markets. Fair value is determined using valuation techniques that use models with significant use of unobservable inputs. A considerable degree of judgement is applied in determining the assumptions that market participants would use when pricing the asset or liability, when observable market data is not available.
Table 8.1 Categorisation of the investment portfolio by level in the fair value hierarchy
|
Level 1 |
Level 2 |
Level 3 |
Total |
|||||
|
Amounts in NOK million |
31.12.2023 |
31.12.2022 |
31.12.2023 |
31.12.2022 |
31.12.2023 |
31.12.2022 |
31.12.2023 |
31.12.2022 |
|
Equities |
11 033 488 |
8 556 594 |
36 286 |
30 602 |
1 500 |
3 206 |
11 071 274 |
8 590 402 |
|
Government bonds |
2 165 249 |
1 929 618 |
429 567 |
235 987 |
- |
- |
2 594 816 |
2 165 605 |
|
Government-related bonds |
340 242 |
303 108 |
65 926 |
78 406 |
809 |
334 |
406 977 |
381 848 |
|
Inflation-linked bonds |
220 652 |
204 037 |
62 485 |
39 404 |
- |
- |
283 137 |
243 441 |
|
Corporate bonds |
942 658 |
740 645 |
59 628 |
88 663 |
2 |
6 |
1 002 288 |
829 314 |
|
Securitised bonds |
256 012 |
202 781 |
26 989 |
31 837 |
105 |
- |
283 106 |
234 618 |
|
Total bonds |
3 924 813 |
3 380 189 |
644 595 |
474 297 |
916 |
340 |
4 570 324 |
3 854 827 |
|
Financial derivatives (assets) |
282 |
429 |
18 906 |
20 024 |
4 |
45 |
19 192 |
20 498 |
|
Financial derivatives (liabilities) |
-1 633 |
-409 |
-31 422 |
-39 750 |
- |
- |
-33 055 |
-40 159 |
|
Total financial derivatives |
-1 351 |
20 |
-12 516 |
-19 726 |
4 |
45 |
-13 863 |
-19 661 |
|
Unlisted real estate |
- |
- |
- |
- |
300 541 |
329 732 |
300 541 |
329 732 |
|
Unlisted infrastructure |
- |
- |
- |
- |
17 593 |
14 489 |
17 593 |
14 489 |
|
Other (assets)1 |
- |
- |
803 590 |
519 026 |
- |
- |
803 590 |
519 026 |
|
Other (liabilities)2 |
- |
- |
-984 661 |
-859 756 |
- |
- |
-984 661 |
-859 756 |
|
Market value investment portfolio3 |
14 956 950 |
11 936 803 |
487 294 |
144 443 |
320 554 |
347 812 |
15 764 797 |
12 429 059 |
|
Total (percent) |
94.9 |
96.0 |
3.1 |
1.2 |
2.0 |
2.8 |
100.0 |
100.0 |
1 Other (assets) consists of the balance sheet lines Deposits in banks, Secured lending, Cash collateral posted, Unsettled trades (assets), Withholding tax receivable and Other assets.
2 Other (liabilities) consists of the balance sheet lines Secured borrowing, Cash collateral received, Unsettled trades (liabilities) and Other liabilities.
3 Deferred tax is not included as part of the investment portfolio from 2023.
The majority of the total portfolio is priced based on observable market prices. At the end of 2023, 98.0 percent of the portfolio was classified as Level 1 or 2, which is a marginal increase compared to year-end 2022. Movements between levels in the fair value hierarchy are described in section 3 of this note.
Equities
Measured as a share of total value, virtually all equities (99.66 percent) were valued based on official closing prices from stock exchanges at the end of 2023 and classified as Level 1. A small share of equities (0.33 percent) were classified as Level 2 at year-end. These are mainly equities for which trading has recently been suspended, or illiquid securities that are not traded daily. The share of equities valued with significant use of unobservable inputs and classified as Level 3 at year-end was 0.01 percent. These are equities that are not listed, or where trading has been suspended and an adjustment has been applied to the last traded price based on company- or country-specific factors.
Bonds
The majority of bonds have observable, executable market quotes in active markets and 85.88 percent of bond holdings were classified as Level 1 at the end of 2023. Bond holdings that do not have a sufficient number of observable quotes or that are priced based on comparable liquid bonds are classified as Level 2. These amounted to 14.10 percent of bond holdings at year-end. An insignificant share of bond holdings (0.02 percent) that did not have observable quotes were classified as Level 3 at year-end, since the valuation was based on significant use of unobservable inputs.
Unlisted real estate and unlisted renewable energy infrastructure
All investments in unlisted real estate and unlisted renewable energy infrastructure are classified as Level 3, since models are used to value the underlying assets and liabilities with extensive use of unobservable market inputs. Properties and investments in unlisted infrastructure are measured at the value determined by external valuers. Exceptions to this policy are newly acquired properties where the purchase price, excluding transaction costs, is normally considered to be the best estimate of fair value, or where there are indications that the value determined by external valuers does not reflect fair value and adjustments are therefore warranted.
Financial derivatives
Some equity derivatives (rights and warrants) and credit derivatives (CDS indices) that are actively traded are classified as Level 1. The majority of derivatives are classified as Level 2, since the valuation of these is based on standard models using observable market inputs. Certain derivatives are valued based on models with significant use of unobservable inputs and are classified as Level 3.
Other assets and liabilities that are part of the investment portfolio are classified as Level 2.
3. Movements between the levels in the fair value hierarchy
Accounting policy
Transfers between levels in the fair value hierarchy are deemed to have occurred at the beginning of the reporting period.
Reclassifications between Level 1 and Level 2
The share of equities classified as Level 1 was virtually unchanged compared to year-end 2022. There were no significant reclassifications of equities between Level 1 and Level 2.
The share of bonds classified as Level 1 decreased by 1.8 percentage points compared to year-end 2022, with a corresponding increase in the share of Level 2 holdings. The primary drivers of this change were net purchases of government bonds classified as Level 2. There was a net reclassification from Level 2 to Level 1 of NOK 13 billion during the year. This consisted of bonds with a value of NOK 64 billion which were reclassified from Level 2 to Level 1, primarily due to increased price observability for corporate bonds, offset by bonds with a value of NOK 51 billion which were reclassified from Level 1 to Level 2.
Reclassifications between Level 2 and Level 3
The share of equities classified as Level 3 was slightly reduced compared to year-end 2022, due to negative value development for equities in this level. There were no significant reclassifications of equities between Level 2 and Level 3. The share of bonds classified as Level 3 was virtually unchanged compared to year-end 2022. There was a net reclassification of government-related bonds from Level 2 to Level 3 during the year of NOK 466 million.
Table 8.2 Changes in Level 3 holdings
|
Amounts in NOK million |
01.01.2023 |
Purchases |
Sales |
Settlements |
Net gain/loss |
Transferred into Level 3 |
Transferred out of Level 3 |
Foreign exchange gain/loss |
31.12.2023 |
|
Equities |
3 206 |
- |
-100 |
-21 |
-1 328 |
47 |
-1 |
-303 |
1 500 |
|
Bonds |
340 |
245 |
-147 |
-54 |
45 |
563 |
-97 |
20 |
916 |
|
Financial derivatives (assets) |
45 |
4 |
-45 |
- |
- |
- |
- |
- |
4 |
|
Unlisted real estate1 |
329 732 |
6 742 |
- |
- |
-54 251 |
- |
- |
18 318 |
300 541 |
|
Unlisted infrastructure1 |
14 489 |
3 256 |
- |
- |
-1 010 |
- |
- |
859 |
17 593 |
|
Total |
347 812 |
10 247 |
-292 |
-75 |
-56 544 |
610 |
-98 |
18 894 |
320 554 |
|
Amounts in NOK million |
01.01.2022 |
Purchases |
Sales |
Settlements |
Net gain/loss |
Transferred into Level 3 |
Transferred out of Level 3 |
Foreign exchange gain/loss |
31.12.2022 |
|
Equities |
1 349 |
83 |
-1 014 |
310 |
-28 634 |
27 678 |
-152 |
3 585 |
3 206 |
|
Bonds |
7 |
237 |
- |
- |
-20 |
103 |
- |
13 |
340 |
|
Financial derivatives (assets) |
- |
- |
- |
- |
-20 |
60 |
- |
5 |
45 |
|
Unlisted real estate1 |
310 134 |
3 930 |
- |
- |
-8 369 |
- |
- |
24 036 |
329 732 |
|
Unlisted infrastructure1 |
14 287 |
-1 143 |
- |
- |
735 |
- |
- |
609 |
14 489 |
|
Total |
325 777 |
3 108 |
-1 014 |
310 |
-36 308 |
27 841 |
-152 |
28 248 |
347 812 |
1 Purchases represent the net cash flow to investments in unlisted real estate and unlisted infrastructure, as presented in the Statement of cash flows.
The share of the portfolio classified as Level 3 was 2.0 percent at the end of 2023, a decrease from 2.8 percent at year-end 2022. The GPFG’s aggregate holdings in Level 3 amounted to NOK 320 554 million at year-end 2023, a decrease of NOK 27 258 million compared to year-end 2022. The decrease is mainly due to investments in unlisted real estate which are all classified as Level 3.
Investments in unlisted real estate amounted to NOK 300 541 million at year-end, a decrease of NOK 29 191 million compared to year-end 2022. The decrease is mainly due to unrealised losses, partly offset by foreign exchange gains and new investments.
4. Valuation techniques
Norges Bank Investment Management has defined hierarchies for which price sources are to be used in the valuation. Holdings that are included in the benchmark indices are normally valued in accordance with prices from the index providers, while the remaining holdings of equities and bonds are valued almost exclusively using prices from other external price providers. For equities and derivatives traded in active markets (Level 1), the close price is used. For bonds traded in active markets, the bid price is generally used. Market activity and volumes are monitored using several price sources that provide access to market prices, quotes and transactions at the measurement date.
The next section sets out the valuation techniques used for instruments classified as Level 2 and Level 3 in the fair value hierarchy. In addition, the most significant observable and unobservable inputs used in the valuation models are described.
Unlisted real estate (Level 3)
The fair value of unlisted real estate is determined as the sum of the underlying assets and liabilities as presented in note 6 Unlisted real estate. Assets and liabilities consist mainly of properties and external debt. Properties are valued at each reporting date by external certified and independent valuation specialists using valuation models. Valuation of properties is inherently dependent on significant forward-looking assumptions. These include key estimates with respect to each individual property type, location, future estimated net cash flows and relevant yields. These assumptions represent primarily unobservable inputs and unlisted real estate is therefore classified as Level 3 in the fair value hierarchy. Assumptions used reflect recent comparable market transactions of properties with a similar location and quality.
Valuation of commercial real estate is based on variations of discounted cash flow models.
Yields and assumptions regarding expected future cash flows are the most important inputs in the valuation models. Expected future cash flows are affected by changes in assumptions related to, but not limited to:
- Estimated market rental values and market rental value growth
- Changes in actual tenancy situation
- Expected inflation (market, consumer price index, costs, etc.)
Renewal and tenant default probabilities, void periods, operating costs and capital costs
The asset values are estimated by discounting the expected future cash flows. The discount rates used take into account a range of factors reflecting the specific investment, including asset level characteristics, market outlook, comparable market transactions and the local and global economic environment. For certain investments, the capitalisation method, also known as the traditional method, is used in line with local market convention. The traditional method capitalises the current net income with a capitalisation rate that incorporates the same factors as the above-mentioned discount rate and estimated cash flows.
Table 8.3 provides information on the significant unobservable inputs used in the measurement of fair value for investments in unlisted real estate.
Table 8.3 Unobservable inputs – Unlisted real estate
|
Property type |
Fair value in NOK million |
Valuation methodology |
Average equivalent yield/discount rate in percent |
Average annual market rent per square meter (in NOK) |
|||
|
31.12.2023 |
31.12.2022 |
31.12.2023 |
31.12.2022 |
31.12.2023 |
31.12.2022 |
||
|
Office |
|||||||
|
Europe |
28 291 |
81 048 |
Income capitalisation |
4.6 |
3.6 |
11 191 |
7 183 |
|
Europe |
47 864 |
- |
Discounted cash flow |
5.3 |
- |
6 700 |
- |
|
US |
74 128 |
89 789 |
Discounted cash flow |
7.3 |
6.3 |
8 152 |
8 018 |
|
Retail |
|||||||
|
Europe |
13 814 |
35 104 |
Income capitalisation |
5.1 |
3.8 |
17 549 |
16 791 |
|
Europe |
18 939 |
- |
Discounted cash flow |
4.9 |
- |
19 895 |
- |
|
Logistics |
|||||||
|
US |
70 439 |
79 108 |
Discounted cash flow |
7.8 |
6.4 |
1 770 |
1 651 |
|
Europe |
36 946 |
33 963 |
Income capitalisation |
5.7 |
5.0 |
1 093 |
902 |
|
Tokyo |
|||||||
|
Office/Retail |
8 022 |
8 016 |
Discounted cash flow |
2.3 |
2.4 |
16 428 |
17 134 |
|
Other |
2 097 |
2 703 |
|||||
|
Total |
300 541 |
329 732 |
|||||
Unlisted renewable energy infrastructure (Level 3)
The fair value of unlisted infrastructure is determined as the sum of the underlying assets and liabilities as presented in note 7 Unlisted renewable energy infrastructure. The investments are valued by external, independent valuation specialists using bespoke valuation models. Valuation of unlisted infrastructure is dependent on significant forward-looking judgements. These include key assumptions and estimates with respect to each individual asset type, future revenue streams and relevant discount rates. These assumptions represent primarily unobservable inputs and Unlisted infrastructure is therefore classified as Level 3 in the fair value hierarchy.
Discount rates and assumptions regarding expected future revenue streams (power prices) are the most important inputs in the valuation models. Power prices are forecasted by independent, energy market forecasters.
Forecasted future cash flows are discounted with a discount rate using valuation models. The models take into account estimates of risk premiums both for the market in general and for the specific infrastructure assets. In addition, the external valuers also compare this value with value estimates calculated using market multiples (trading factors from similar companies) and transaction multiples (metrics from recent comparable transactions), before determining the final estimate of fair value.
Equities (Level 2 and Level 3)
Equities that are valued based on models with observable inputs are classified as Level 2 in the fair value hierarchy. These holdings are not traded in active markets. The valuation models take into account various observable market inputs such as comparable equity quotes, last traded price and volume.
Holdings in Level 3 consist of equities that are not listed or have been suspended from trading, where the valuation models use unobservable inputs to a significant extent. For equities that are suspended from trading, the value is adjusted down compared to last-traded price, based on an assessment of company and country-specific factors. For equities that are not listed, an adjustment for liquidity risk is applied. Valuation models for these holdings take into account unobservable inputs such as historical volatility, company performance and analysis of comparable companies and securities.
Russian equities constitute the majority of equity securities classified as Level 3 at year-end 2023. Trading in Russian securities is regulated by extensive sanctions. In order to estimate the price that would be received for the sale of the shares under current market conditions, a downward adjustment was applied to the last traded price of these securities at year-end. The downward adjustment reflects the estimated discount market participants would demand to reflect the risk associated with the inherent uncertainty in the cash flows of the shareholdings, as well as the inability to access a public market to trade the shares. The adjustment to the last traded price was based on unobservable inputs and is considered to be significant to the fair value measurement. All equity holdings where an adjustment has been applied to the last traded price were therefore classified as Level 3. At year-end 2023, these equity securities had a value of NOK 1.4 billion, compared to NOK 3 billion at year-end 2022.
Bonds (Level 2 and Level 3)
Bonds classified as Level 2 are valued using observable inputs from comparable issues, as well as direct indicative or executable quotes. These holdings usually consist of less liquid bonds than those classified as Level 1, i.e. where there is no trading volume of binding offers and a low volume of indicative quotes at the measurement date.
Bonds classified as Level 3 are valued based on models using unobservable inputs such as probability for future cash flows and spreads to reference curves. These holdings include defaulted and highly illiquid bonds.
Financial derivatives (Level 2 and Level 3)
Foreign exchange derivatives consist mainly of foreign exchange forward contracts, and are valued using industry standard models which use observable market data inputs such as forward rates.
Interest rate derivatives, which mainly consist of interest rate swaps, are valued using industry standard models with observable market data inputs such as interest from traded interest rate swaps.
Equity derivatives and credit derivatives, are mainly valued using observable prices provided by vendors according to the price hierarchy. In some cases where an equity derivative is not traded, inputs such as conversion factors, subscription price and strike price are utilised to value the instruments.
5. Sensitivity analysis for Level 3 holdings
The valuation of holdings in Level 3 involves the use of judgement when determining the assumptions that market participants would use when observable market data is not available. In the sensitivity analysis for Level 3 holdings, the effect of using reasonable alternative assumptions is shown.
Table 8.4 Additional specification Level 3 and sensitivities
|
Amounts in NOK million |
Key assumptions |
Change in key assumptions |
Specification of Level 3 holdings 31.12.2023 |
Sensitivities 31.12.2023 |
Change in key assumptions |
Specification of Level 3 holdings 31.12.2022 |
Sensitivities 31.12.2022 |
||
|
Unfavourable changes |
Favourable changes |
||||||||
|
Unfavourable changes |
Favourable changes |
||||||||
|
Equities |
Adjustment for country-specific factors Russia |
- |
1 358 |
-1 358 |
- |
- |
2 997 |
-2 997 |
- |
|
Suspension adjustment |
20.0 percent |
142 |
-28 |
28 |
20.0 percent |
209 |
-42 |
42 |
|
|
1 500 |
-1 386 |
28 |
3 206 |
-3 039 |
42 |
||||
|
Bonds |
Probability of future cash flows |
10.0 percent |
916 |
-90 |
90 |
10.0 percent |
340 |
-34 |
34 |
|
Financial derivatives (assets) |
Other |
4 |
-1 |
1 |
45 |
-9 |
9 |
||
|
Unlisted real estate |
Yield |
0.25 percentage point |
-14 818 |
16 879 |
0.20 percentage point |
-15 944 |
17 896 |
||
|
Market rent |
2.0 percent |
-5 400 |
5 419 |
2.0 percent |
-5 362 |
5 370 |
|||
|
300 541 |
-20 218 |
22 298 |
329 732 |
-21 306 |
23 266 |
||||
|
Unlisted infrastructure |
Discount rate |
0.25 percentage point |
-424 |
463 |
0.25 percentage point |
-312 |
287 |
||
|
Power price forecast |
5.0 percent |
-976 |
1 027 |
5.0 percent |
-804 |
780 |
|||
|
17 593 |
-1 400 |
1 490 |
14 489 |
-1 116 |
1 066 |
||||
|
Total |
320 554 |
-23 095 |
23 907 |
347 812 |
-25 504 |
24 417 |
|||
Unlisted real estate
Changes in key assumptions can have a material effect on the valuation. A number of key assumptions are used, of which yields and forecasts for future market rents are the assumptions that have the largest impact when estimating property values. This is illustrated in the sensitivity analysis by using other reasonable alternative assumptions for yield and market rents. At the end of 2023, a change in the yield of 0.25 percentage point, and a change in market rents of 2 percent is viewed as a reasonable range for alternative assumptions. At year-end 2022, a change in the yield of 0.20 percentage point, and a change in market rents of 2 percent was viewed as a reasonable range for alternative assumptions. The change in the range for yields is mainly to reflect the increased absolute yield level.
The sensitivity analysis is based on a statistically relevant sample that is representative for the unlisted real estate portfolio, and reflects both favourable and unfavourable changes. In an unfavourable outcome, it is estimated that an increase in the yield of 0.25 percentage point, and a reduction in market rents of 2 percent would result in a decrease in value of the unlisted real estate portfolio of approximately NOK 20 218 million or 6.7 percent (6.5 percent at year-end 2022). In a favourable outcome, a reduction in the yield of 0.25 percentage point and an increase in market rents of 2 percent would result in an increase in value of the unlisted real estate portfolio of approximately NOK 22 298 million or 7.4 percent (7.1 percent at year-end 2022). The isolated effects of changes in yields and future market rents are presented in table 8.4.
Changes outside of the ranges specified above are considered to be less reasonable alternative assumptions, however if the range of alternative assumptions were to be expanded, the value changes would be linear.
Unlisted renewable energy infrastructure
The sensitivity analysis for unlisted infrastructure is adapted to each individual investment. A number of key assumptions are used, of which discount rates and future power prices are the assumptions that have the largest impact when estimating values. This is illustrated in the sensitivity analysis by using other reasonable alternative assumptions for discount rates and future power prices.
Equities
Fair value of equities classified as Level 3 is sensitive to assumptions regarding whether trading will be resumed and how markets have moved from the time the trading was suspended, as well as specific factors related to the country and the individual company, such as trading restrictions and the company’s financial situation.
6. Control environment
The control environment for fair value measurement of financial instruments and investments in unlisted real estate and unlisted infrastructure is organised around a formalised and documented valuation policy and guidelines, supported by work and control procedures.
The valuation environment has been adapted in accordance with market standards and established valuation practices. This is implemented in practice through daily valuation of all holdings, except for investments in unlisted real estate and unlisted infrastructure, where valuations are performed quarterly. For unlisted real estate, the quarterly valuations are performed by external valuers. For unlisted infrastructure, external valuers perform the valuations at the end of the second and fourth quarters, while the internal valuation department performs the valuations at the end of the first and third quarters. These processes are scalable to market changes and are based on internal and external data solutions.
All holdings and investments are generally valued by external, independent price providers. These have been selected based on analyses performed by the departments responsible for valuation.
Price providers are monitored on an ongoing basis through regular discussions, controls and price challenges for individual securities. For a large portion of holdings, prices from independent price providers are based on quoted market prices. For holdings that are not sufficiently liquid for valuation to be based on quoted prices, models are used. Observable inputs are used where possible, but unobservable inputs are used in some cases, due to illiquid markets.
The valuation process is subject to numerous daily controls by the valuation departments. These controls are based on defined thresholds and sensitivities, which are monitored and adjusted in accordance with prevailing market conditions. At the end of each month for financial instruments and at the end of each quarter for investments in unlisted real estate and unlisted infrastructure, more extensive controls are performed to ensure the valuations represent fair value in accordance with IFRS. Particular attention is paid to illiquid financial instruments and unlisted investments, i.e. investments deemed to pose valuation challenges. Illiquid instruments are identified using sector and currency classifications, credit rating indicators, bid/ask spreads, and market activity.
Valuation memos and reports are prepared each quarter-end, documenting the results of the controls performed and the most important sources of uncertainty in the valuations. Prior to the publication of the financial reporting, the valuation documentation is reviewed, significant pricing issues are discussed, and the valuation is approved in the NBIM Leader Group Investment meeting.
GPFG Note 9 Investment risk
Management mandate for the GPFG
The GPFG is managed by Norges Bank on behalf of the Ministry of Finance, in accordance with section 3, second paragraph of the Government Pension Fund Act and the management mandate for the GPFG issued by the Ministry of Finance.
The GPFG shall seek to generate the highest possible return, net of costs, measured in the currency basket of the investment portfolio, within the applicable investment management framework. The strategic benchmark index set by the Ministry of Finance is divided into two asset classes, equities and bonds, with an allocation of 70 percent to equities and 30 percent to bonds.
The benchmark index for equities is constructed based on the market capitalisation for equities in the countries included in the benchmark. The benchmark index for bonds specifies a defined allocation between government bonds and corporate bonds, with a weight of 70 percent to government bonds and 30 percent to corporate bonds. The currency distribution is a result of these weighting principles.
Investments in unlisted real estate and unlisted renewable energy infrastructure are not defined by the fund’s benchmark index. The management mandate sets a maximum allocation to unlisted real estate of 7 percent of the investment portfolio. Investments in unlisted infrastructure can amount to up to 2 percent of the investment portfolio. The fund’s allocation to unlisted real estate and unlisted infrastructure is further regulated in the investment mandate issued by the Executive Board of Norges Bank. It is up to Norges Bank to determine the allocation to unlisted real estate and unlisted infrastructure within the limits set in the management mandate, and how this shall be financed.
The fund cannot invest in securities issued by Norwegian entities, securities issued in Norwegian kroner, or real estate and infrastructure located in Norway. The fund can also not invest in companies which are excluded following the guidelines for observation and exclusion from the GPFG.
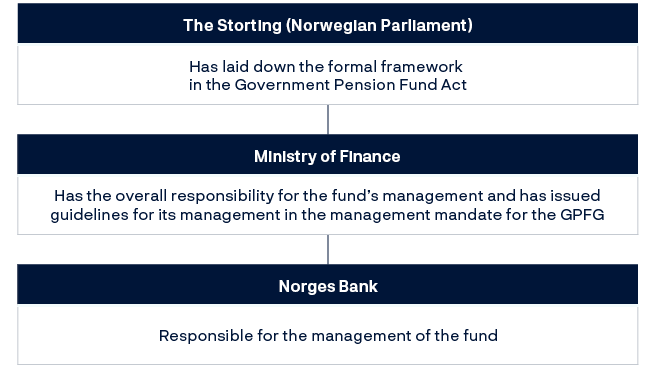
Norges Bank’s governance structure
The Executive Board of Norges Bank has delegated responsibility for the management of the GPFG to the Chief Executive Officer (CEO) of Norges Bank Investment Management.
The CEO of Norges Bank Investment Management is authorised through a job description and an investment mandate. The Executive Board has issued principles for, among other things, risk management, responsible investment and compensation to employees in Norges Bank Investment Management. Internationally recognised standards are applied in the areas of valuation and performance measurement as well as management, measurement and control of risk. Reporting to the Executive Board is carried out monthly, and more extensively on a quarterly basis. The Governor of Norges Bank and the Executive Board are notified immediately in the event of special events or significant matters.
Investment responsibilities within Norges Bank Investment Management are further delegated through investment mandates. Responsibility for processes and personnel is delegated through job descriptions, while process requirements are described in policies and guidelines. The composition of the leader group and the delegation of authority shall ensure segregation of duties between the investment areas, trading, operations, risk management and compliance and control.
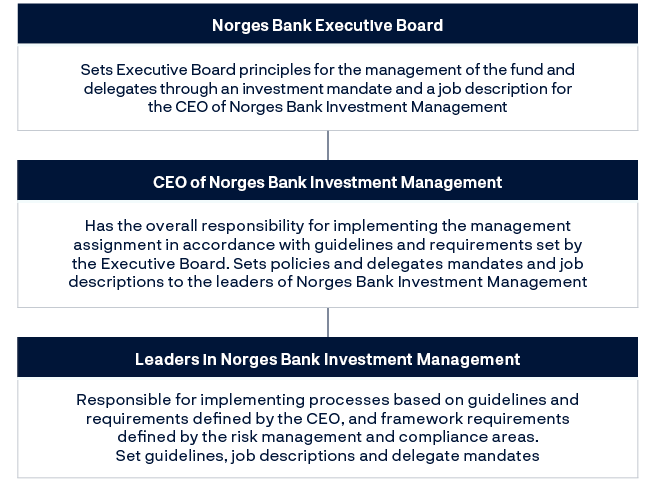
The NBIM Leader Group Investment Meeting complements the delegation of responsibility by advising on investment risk management and the portfolio’s investment universe.
Internal risk reporting requirements are set by the CEO of Norges Bank Investment Management, through job descriptions in the risk area. Reporting to the CEO is carried out on a daily, weekly and monthly basis. The CEO shall be notified immediately of any special events or serious breaches of the investment mandate.
Framework for investment risk
In the management mandate for the GPFG, there are a number of limits and restrictions within the combined equity and bond asset class, as well as within the individual asset classes. Investments in unlisted real estate and unlisted renewable energy infrastructure are regulated by a separate management framework in the investment mandate. The framework underpins how a diversified exposure to unlisted real estate and unlisted infrastructure shall be established and managed.
Clear roles and responsibilities are a cornerstone of process design at Norges Bank Investment Management. Changes to investment mandates, the portfolio hierarchy and new counterparties are monitored and require approval by the Chief Risk Officer (CRO), or a person authorised by the CRO.
The Executive Board’s principles for risk management are further described in policies and guidelines. Responsibility for effective processes related to risk management is delegated to the CRO and the Chief Corporate Governance & Compliance Officer.
Risk management is defined as the management of market risk, credit risk, counterparty risk, operational risk and risk related to environmental, social and governance factors. The first three items listed are defined as investment risk. The investment area in Norges Bank Investment Management is responsible for managing risk in the portfolio and in individual mandates, while the risk management areas independently measure, manage and report investment risk across the portfolio, at asset class level and other levels within the portfolio that reflect the investment process. Separate risk assessments are required in advance of investments in unlisted real estate and unlisted infrastructure.
Table 9.1 Investment risk
|
Type |
Market risk |
Credit risk |
Counterparty risk |
|
Definition |
Risk of loss or a change in the market value of the portfolio, or parts of the portfolio, due to changes in financial market variables, real estate and infrastructure values |
Risk of loss due to a bond issuer not meeting its payment obligations |
Risk of loss due to counterparty bankruptcy or other events leading to counterparties defaulting |
|
Main dimensions |
Measured both absolute and relative to the benchmark |
Measured at single issuer and portfolio levels - Probability of default - Loss given default - Correlation between instruments and issuers at portfolio level |
Measured risk exposure by type of position - Securities lending - Unsecured bank deposits and securities - Derivatives including FX contracts - Repurchase and reverse repurchase agreements - Settlement risk towards brokers and long settlement transactions |
Investment risk – market risk
Norges Bank Investment Management defines market risk as the risk of loss or a change in the market value of the portfolio, or parts of the portfolio, due to changes in financial market variables, as well as real estate and infrastructure values. Market risk for the investment portfolio, both absolute and relative to the benchmark, is measured along the dimensions concentration risk, volatility and correlation risk, systematic factor risk and liquidity risk. For unlisted real estate, this involves measurement of the share of real estate under construction, vacancy, tenant concentration and geographical concentration. For unlisted infrastructure, this involves measurement of exposure towards different sectors, share of income from government subsidies, development exposure, and geographical concentration. Market risk is actively taken to generate investment returns in line with the objectives of the investment mandates.
Investment risk – credit risk
Norges Bank Investment Management defines credit risk as the risk of loss resulting from a bond issuer defaulting on their payment obligations. Credit risk is measured both in relation to single issuers, where the probability of default and loss given default are taken into account, and at portfolio level, where the correlation of credit losses between instruments and issuers is taken into account. Credit risk is actively taken to generate investment returns in line with the objectives of the investment mandates.
Investment risk – counterparty risk
Norges Bank Investment Management defines counterparty risk as the risk of loss due to counterparty bankruptcy or other events leading to counterparties defaulting. Counterparties are necessary to ensure effective liquidity management and effective trading and management of market and credit risk. Counterparty risk also arises in connection with securities lending and with the management of the equity and bond portfolios, as well as the real estate and infrastructure portfolios. Counterparty risk is controlled and limited to the greatest extent possible, given the investment strategy.
Risk management process
Norges Bank Investment Management employs several measurement methodologies, processes and systems to control investment risk. Robust and widely recognised risk management systems and processes are complemented by internally developed measurement methodologies and processes.
Market risk
Norges Bank Investment Management measures market risk in both absolute terms for the actual portfolio, and the relative market risk for holdings in the GPFG.
Continuous monitoring, measurement and assessment of market risk is performed along multiple risk dimensions, employing a number of methodologies and approaches. Combining different and complementary risk measures provides a better insight into the risk profile of the GPFG’s holdings.
Concentration risk
Concentration analysis complements statistical risk estimation by describing the concentration of a single exposure or a group of exposures. More concentrated portfolios tend to contribute to less diversification. Concentration is measured across different dimensions depending on the asset class, including country, currency, sector, issuer and company exposure.
The portfolio is invested across several asset classes, countries and currencies as shown in table 9.2.
Table 9.2 Allocation by asset class, country and currency
|
Asset class |
Market value in percent by country and currency1 |
Market value by asset class in percent |
Market value by asset class in NOK million |
||||||
|
31.12.2023 |
31.12.2022 |
||||||||
|
Market |
31.12.2023 |
Market |
31.12.2022 |
31.12.2023 |
31.12.2022 |
||||
|
Equities |
Developed |
89.8 |
Developed |
89.1 |
|||||
|
US |
48.8 |
US |
44.7 |
||||||
|
Japan |
7.2 |
Japan |
7.3 |
||||||
|
UK |
6.1 |
UK |
7.0 |
||||||
|
France |
4.3 |
France |
4.8 |
||||||
|
Switzerland |
4.1 |
Switzerland |
4.5 |
||||||
|
Total other |
19.4 |
Total other |
20.8 |
||||||
|
Emerging |
10.2 |
Emerging |
10.9 |
||||||
|
China |
3.1 |
China |
3.8 |
||||||
|
India |
2.2 |
India |
2.0 |
||||||
|
Taiwan |
2.1 |
Taiwan |
2.0 |
||||||
|
Brazil |
0.6 |
Brazil |
0.5 |
||||||
|
Mexico |
0.4 |
South Africa |
0.4 |
||||||
|
Total other |
1.9 |
Total other |
2.2 |
||||||
|
Total equities |
70.88 |
69.77 |
11 174 263 |
8 672 186 |
|||||
|
Fixed income |
Developed |
99.8 |
Developed |
99.7 |
|||||
|
US dollar |
51.2 |
US dollar |
50.2 |
||||||
|
Euro |
28.2 |
Euro |
28.1 |
||||||
|
Japanese yen |
6.9 |
Japanese yen |
8.0 |
||||||
|
British pound |
5.0 |
British pound |
4.5 |
||||||
|
Canadian dollar |
3.9 |
Canadian dollar |
3.8 |
||||||
|
Total other |
4.6 |
Total other |
5.1 |
||||||
|
Emerging2 |
0.2 |
Emerging2 |
0.3 |
||||||
|
Total fixed income |
27.10 |
27.45 |
4 271 746 |
3 412 044 |
|||||
|
Unlisted real estate |
US |
48.6 |
US |
51.8 |
|||||
|
UK |
18.7 |
France |
16.5 |
||||||
|
France |
15.7 |
UK |
16.4 |
||||||
|
Germany |
5.3 |
Germany |
5.0 |
||||||
|
Switzerland |
3.6 |
Switzerland |
3.4 |
||||||
|
Total other |
8.0 |
Total other |
7.0 |
||||||
|
Total unlisted real estate |
1.91 |
2.66 |
301 128 |
330 300 |
|||||
|
Total unlisted infrastructure |
0.11 |
0.12 |
17 660 |
14 530 |
|||||
|
Market value investment portfolio |
15 764 797 |
12 429 059 |
|||||||
1 Market value in percent by country and currency includes derivatives and cash. From 2023, market value is presented before management fee receivable and deferred tax. Up to and including 2022, market value was presented before management fee receivable.
2 The share of individual emerging market currencies in the fixed income portfolio is insignificant.
At the end of 2023, the equity portfolio’s share of the fund was 70.9 percent, up from 69.8 percent at year-end 2022. The bond portfolio’s share of the fund was 27.1 percent, down from 27.5 percent at year-end 2022. Unlisted real estate amounted to 1.9 percent of the fund at year-end, compared to 2.7 percent at year-end 2022. Unlisted infrastructure amounted to 0.1 percent of the fund at year-end, which was the same as year-end 2022.
For equity investments, concentration in the portfolio is further measured by sector. Table 9.3 shows the composition of the equity asset class by sector.
Table 9.3 Allocation of equity investments by sector1, percent
|
Sector |
31.12.2023 |
31.12.2022 |
|
Technology |
22.3 |
17.5 |
|
Financials |
15.0 |
15.8 |
|
Consumer discretionary |
14.1 |
13.3 |
|
Industrials |
13.1 |
13.1 |
|
Health care |
11.1 |
12.7 |
|
Consumer staples |
5.6 |
6.6 |
|
Real estate |
5.5 |
5.5 |
|
Basic materials |
4.0 |
4.4 |
|
Energy |
3.7 |
4.4 |
|
Telecommunications |
3.3 |
3.1 |
|
Utilities |
2.4 |
2.7 |
1 Does not sum up to 100 percent because cash and derivatives are not included.
The GPFG has substantial investments in government-issued bonds. Table 9.4 shows the largest holdings in bonds issued by governments. These include government bonds issued in local and foreign currency and inflation-linked bonds issued in local currency.
Table 9.4 Largest holdings within the segment government bonds
|
Amounts in NOK million |
Market value 31.12.2023 |
Amounts in NOK million |
Market value 31.12.2022 |
|
|
US |
1 344 708 |
US |
1 022 086 |
|
|
Japan |
362 637 |
Japan |
475 342 |
|
|
Singapore |
225 902 |
Germany |
171 336 |
|
|
Germany |
201 925 |
Singapore |
155 332 |
|
|
UK |
152 941 |
UK |
106 701 |
|
|
Canada |
85 209 |
France |
73 898 |
|
|
France |
79 170 |
Canada |
64 837 |
|
|
Italy |
60 385 |
Italy |
63 415 |
|
|
Netherlands |
52 858 |
Australia |
44 187 |
|
|
Spain |
49 664 |
Spain |
31 959 |
The portfolio is also invested in companies which issue both equities and bonds. Table 9.5 shows the portfolio’s largest holdings of non-government issuers, including both bond and equity holdings. Covered bonds issued by financial institutions and debt issued by other underlying companies are included in the bonds column.
Table 9.5 Largest holdings excluding sovereigns, both bonds and equities
|
Amounts in NOK million, 31.12.2023 |
Sector |
Equities |
Bonds |
Total |
|
Microsoft Corp |
Technology |
358 388 |
1 717 |
360 105 |
|
Apple Inc |
Technology |
337 297 |
5 631 |
342 929 |
|
Alphabet Inc |
Technology |
195 493 |
1 948 |
197 440 |
|
Amazon.com Inc |
Consumer discretionary |
177 283 |
6 596 |
183 879 |
|
NVIDIA Corp |
Technology |
145 855 |
3 230 |
149 085 |
|
Meta Platforms Inc |
Technology |
113 120 |
4 198 |
117 318 |
|
Nestlé SA |
Consumer staples |
91 221 |
1 527 |
92 747 |
|
Taiwan Semiconductor Manufacturing Co Ltd |
Technology |
89 218 |
- |
89 218 |
|
Novo Nordisk A/S |
Health care |
88 694 |
- |
88 694 |
|
JPMorgan Chase & Co |
Financials |
59 877 |
22 686 |
82 563 |
|
Amounts in NOK million, 31.12.2022 |
Sector |
Equities |
Bonds |
Total |
|
Apple Inc |
Technology |
209 674 |
9 662 |
219 336 |
|
Microsoft Corp |
Technology |
199 878 |
1 581 |
201 459 |
|
Alphabet Inc |
Technology |
110 219 |
1 717 |
111 936 |
|
Nestlé SA |
Consumer staples |
88 149 |
1 994 |
90 143 |
|
Amazon.com Inc |
Consumer discretionary |
80 207 |
9 260 |
89 466 |
|
Roche Holding AG |
Health care |
62 055 |
1 498 |
63 554 |
|
Shell PLC |
Energy |
60 710 |
272 |
60 982 |
|
Taiwan Semiconductor Manufacturing Co Ltd |
Technology |
60 040 |
- |
60 040 |
|
Bank of America Corp |
Financials |
33 303 |
25 468 |
58 771 |
|
Berkshire Hathaway Inc |
Financials |
51 834 |
6 169 |
58 003 |
Table 9.6 shows the composition of the unlisted real estate asset class by sector.
Table 9.6 Distribution of unlisted real estate investments by sector, percent
|
Sector |
31.12.2023 |
31.12.2022 |
|
Office |
52.0 |
53.7 |
|
Retail |
11.9 |
11.7 |
|
Logistics |
35.7 |
34.2 |
|
Other |
0.4 |
0.4 |
|
Total |
100.0 |
100.0 |
Volatility and correlation risk
Norges Bank Investment Management uses models to quantify the risk of fluctuations in value for all or parts of the portfolio. Volatility is a standard risk measure based on the statistical concept of standard deviation, which takes into account the correlation between different investments in the portfolio. Expected volatility is defined as one standard deviation. This risk measure gives an estimate of how much one can expect the portfolio’s value to change or fluctuate during the course of a year, based on market conditions over the past three years. In two of three years, the portfolio return is expected to be within the negative and positive value of the estimated volatility. Expected volatility can be expressed in terms of the portfolio’s absolute or relative risk. Norges Bank Investment Management uses the same model both for portfolio risk and for relative volatility.
All the fund’s investments are included in the calculation of expected relative volatility and are measured against the fund’s benchmark index consisting of global equity and bond indices.
The modelling of unlisted investments is challenging due to few or no historical prices. For investments in unlisted real estate, the exposure to a group of relevant risk factors is mapped to the model framework in MSCI’s Barra Private Real Estate 2 (PRE2) model. These are decided by key attributes such as location and property type. The model uses time series of valuations and actual transactions as a starting point, but also includes listed real estate share prices to establish representative, daily time series. For investments in unlisted infrastructure, the starting point is a combination of time series available in the existing framework for listed markets. The exposure to generic, listed risk factors is mapped for each project based on attributes such as share of contractually agreed prices, project lifetime, project phase, sector, country, and the quality of counterparties.
The risk model from MSCI then uses these factors for unlisted investments in the same way as ordinary equity and fixed-income risk factors, to calculate expected absolute and relative volatility, as well as expected shortfall for the fund’s investments.
Calculation of expected volatility
Expected volatility for the portfolio, and volatility relative to the benchmark index, is estimated by using a parametric calculation method based on current investments. The model weights weekly return data equally over a sampling period of three years.
Tables 9.7 and 9.8 present risk both in terms of the portfolio’s absolute risk and relative risk.
Table 9.7 Portfolio risk, expected volatility, percent
|
Expected volatility, actual portfolio |
||||||||
|
31.12.2023 |
Min 2023 |
Max 2023 |
Average 2023 |
31.12.2022 |
Min 2022 |
Max 2022 |
Average 2022 |
|
|
Portfolio |
10.3 |
8.7 |
10.8 |
9.7 |
10.1 |
9.6 |
10.4 |
10.1 |
|
Equities |
12.5 |
11.3 |
15.0 |
12.4 |
14.2 |
13.8 |
14.4 |
14.2 |
|
Fixed income |
10.8 |
9.8 |
11.2 |
10.4 |
11.1 |
10.0 |
11.1 |
10.7 |
|
Unlisted real estate |
12.9 |
11.8 |
12.9 |
12.4 |
12.1 |
11.7 |
12.4 |
12.0 |
|
Unlisted infrastructure |
34.0 |
14.9 |
40.0 |
32.1 |
14.9 |
8.9 |
14.9 |
11.7 |
Table 9.8 Relative risk measured against the fund’s reference index, expected relative volatility, basis points
|
Expected relative volatility |
||||||||
|
31.12.2023 |
Min 2023 |
Max 2023 |
Average 2023 |
31.12.2022 |
Min 2022 |
Max 2022 |
Average 2022 |
|
|
Portfolio |
34 |
33 |
41 |
36 |
39 |
39 |
53 |
45 |
Risk measured as expected volatility indicates an expected annual value fluctuation in the fund of 10.3 percent, or approximately NOK 1 620 billion at the end of 2023, compared to 10.1 percent at year-end 2022. Expected volatility for the equity portfolio was 12.5 percent at year-end, down from 14.2 percent at year-end 2022, while expected volatility for the fixed-income portfolio was 10.8 percent, down from 11.1 percent at year-end 2022.
The management mandate specifies that expected relative volatility for the fund shall not exceed 1.25 percentage points. The measurement of risk and follow-up of the limit is performed based on the risk model described above. The fund’s expected relative volatility was 34 basis points at the end of the year, down from 39 basis points at year-end 2022. The decrease in the fund’s expected relative volatility in 2023 is mainly due to reduced expected relative volatility from real estate investments.
In addition to the above-mentioned model, other risk models are employed that capture the market dynamics of recent periods to a greater extent, as well as models that measure tail risk.
Expected shortfall is a tail risk measure that quantifies the expected loss of a portfolio in extreme market situations. Expected shortfall measured on relative returns provides an estimate of the annual expected relative underperformance versus the benchmark index for a given confidence level. Using historical simulations, relative returns of the current portfolio compared to the benchmark index are calculated on a weekly basis over a sampling period from January 2007 until the end of the last accounting period. The expected shortfall at a 97.5 percent confidence level is then given by the annualised average relative return, measured in the currency basket for the 2.5 percent worst weeks.
The Executive Board has determined that the fund shall be managed in such a way that the annual expected shortfall measured against the benchmark index does not exceed 3.75 percentage points. Expected shortfall is measured and monitored based on the risk model described above. At the end of the year, expected shortfall was 1.08 percentage points, compared to 1.22 percentage points at year-end 2022.
Calculation of expected shortfall
Expected shortfall for the portfolio, measured against its benchmark index, is estimated using historical simulations based on current investments. The model weights weekly returns equally over a sampling period from January 2007 until the end of the last accounting period, so that the measure can capture extreme market movements. A confidence level of 97.5 percent is used for the calculations.
Strengths and weaknesses
The strength of these types of risk model is that one can estimate the risk associated with a portfolio across different asset classes, markets, currencies, securities and derivatives, and express this risk as a single numerical value, which takes into account the correlation between different asset classes, securities and risk factors, as well as capturing deviations from a normal distribution.
The model-based risk estimates are based on historical relationships in the markets and are expected to provide reliable forecasts in markets without significant changes in volatility and correlation. Estimates will be less reliable in periods marked by significant changes in volatility and correlation. Calculated volatility gives a point estimate of risk and provides little information on the total risk profile and any tail risk. Annualisation means that it is assumed that volatility and the composition of the portfolio are constant over time. To compensate for these shortcomings, complementary models and methods are employed, such as stress tests and analyses of concentration risk and realised returns.
Verification of models
Risk models used in estimating and controlling investment risk are continuously evaluated and verified for their ability to estimate risk. The special nature of the investment portfolio and the investment universe, as well as the GPFG’s long-term investment horizon, are taken into account when evaluating the models.
Credit risk
Credit risk is the risk of losses resulting from issuers of bonds defaulting on their payment obligations. Fixed-income instruments in the portfolio’s benchmark index are all rated investment grade by one of the major credit rating agencies. Investments in bonds are made based on internal assessments with regards to expected return and risk profile.
Table 9.9 Bond portfolio specified by credit rating
|
Amounts in NOK million, 31.12.2023 |
AAA |
AA |
A |
BBB |
Lower rating |
Total |
|
Government bonds |
612 472 |
1 456 325 |
406 747 |
80 433 |
36 233 |
2 592 210 |
|
Government-related bonds |
198 601 |
149 019 |
34 615 |
22 373 |
2 369 |
406 977 |
|
Inflation-linked bonds |
48 794 |
193 647 |
24 943 |
15 752 |
- |
283 137 |
|
Corporate bonds |
8 977 |
66 905 |
460 349 |
455 568 |
10 487 |
1 002 288 |
|
Securitised bonds |
239 362 |
41 931 |
1 812 |
- |
- |
283 106 |
|
Total bonds1 |
1 108 207 |
1 907 827 |
928 467 |
574 127 |
49 090 |
4 567 718 |
|
Amounts in NOK million, 31.12.2022 |
AAA |
AA |
A |
BBB |
Lower rating |
Total |
|
Government bonds |
1 365 320 |
192 142 |
509 240 |
75 988 |
22 914 |
2 165 605 |
|
Government-related bonds |
173 893 |
136 251 |
51 670 |
18 168 |
1 867 |
381 848 |
|
Inflation-linked bonds |
154 708 |
58 278 |
14 368 |
16 087 |
- |
243 441 |
|
Corporate bonds |
7 761 |
61 407 |
366 585 |
383 325 |
10 236 |
829 314 |
|
Securitised bonds |
198 124 |
34 817 |
1 677 |
- |
- |
234 618 |
|
Total bonds |
1 899 805 |
482 896 |
943 540 |
493 569 |
35 018 |
3 854 827 |
1 At year-end 2023, bonds received as collateral amounting to NOK 2.6 billion were sold. These bonds are presented in the balance sheet as a liability under Secured borrowing.
The market value of the bond portfolio increased to NOK 4 568 billion at year-end 2023, from NOK 3 855 billion at year-end 2022. The share of holdings in corporate bonds increased by 0.4 percentage point during the year, to 21.9 percent of the bond portfolio at year-end 2023. Government bonds, including inflation-linked bonds, comprised 62.9 percent of the bond portfolio at year-end, an increase of 0.4 percentage point compared to year-end 2022.
The share of bonds with credit rating AAA decreased by 25.0 percentage points during the year, to 24.3 percent of the total bond portfolio at year-end 2023. The decrease is mainly due to USA being downgraded to AA from category AAA. This led to an increase in category AA to 41.8 percent of the bond portfolio at year end 2023, from 12.5 percent at year end 2022. The share of bonds with credit rating BBB decreased by 0.2 percentage point compared to year-end 2022, to 12.6 percent at year-end 2023.
The share of bonds in the Lower rating category increased to 1.1 percent at year-end 2023, from 0.9 percent at year-end 2022. This was mainly due to an increase in the share of Brazilian government bonds in the Lower rating category. Defaulted bonds had a market value of NOK 23 million at year-end 2023, compared to NOK 27 million at year-end 2022. Defaulted bonds are grouped under Lower rating.
Table 9.10 Bond portfolio by credit rating and currency, percent
|
31.12.2023 |
AAA |
AA |
A |
BBB |
Lower rating |
Total |
|
US dollar |
0.8 |
31.3 |
7.1 |
6.9 |
0.1 |
46.1 |
|
Euro |
11.7 |
5.1 |
4.2 |
4.0 |
0.1 |
25.1 |
|
Japanese yen |
- |
- |
8.0 |
- |
- |
8.0 |
|
Singapore dollar |
4.9 |
- |
- |
- |
- |
4.9 |
|
Canadian dollar |
3.1 |
0.8 |
0.5 |
- |
- |
4.7 |
|
Other currencies |
3.7 |
4.6 |
0.5 |
1.4 |
0.8 |
11.1 |
|
Total |
24.3 |
41.8 |
20.3 |
12.6 |
1.1 |
100.0 |
|
31.12.2022 |
AAA |
AA |
A |
BBB |
Lower rating |
Total |
|
US dollar |
27.5 |
2.1 |
7.1 |
7.1 |
0.2 |
44.0 |
|
Euro |
10.9 |
5.6 |
3.5 |
4.2 |
0.1 |
24.4 |
|
Japanese yen |
- |
- |
12.8 |
- |
- |
12.8 |
|
Canadian dollar |
2.9 |
0.7 |
0.3 |
0.2 |
- |
4.1 |
|
Singapore dollar |
4.0 |
- |
- |
- |
- |
4.0 |
|
Other currencies |
3.9 |
4.0 |
0.7 |
1.4 |
0.6 |
10.7 |
|
Total |
49.3 |
12.5 |
24.5 |
12.8 |
0.9 |
100.0 |
At year-end 2023, investments had been made in purchased credit default swaps with a nominal value of NOK 52.3 billion, a small decrease from NOK 53.3 billion at year-end 2022. 29 percent of these were in the category where the underlying issuers have a low credit rating. See table 5.3 in note 5 Holdings of equities, bonds and financial derivatives for further information. When investing in purchased credit default swaps, the credit risk in the bond portfolio is reduced when the portfolio has investments in the same underlying bonds as the credit default swaps. At year-end 2023, credit risk exposure was reduced by NOK 23.7 billion as a result of purchased credit default swaps, compared to a reduction of NOK 28.5 billion at year-end 2022.
In addition to credit ratings from credit rating agencies, measurement of credit risk is complemented by two credit risk models, of which one is based on credit ratings and the other is based on observable credit premiums. Both of these methods also take into account the correlation and expected value of bonds in a bankruptcy situation. The models also take into account credit default swaps, and these reduce or increase the credit risk depending on whether credit risk is bought or sold. The models are used for risk measurement and monitoring of credit risk in the fixed-income portfolio. The overall credit quality of the bond portfolio deteriorated slightly during the year.
Counterparty risk
Counterparties are necessary to trade in the markets and to ensure effective management of liquidity, market and credit risk. Exposure to counterparty risk is related to trading in derivatives and foreign exchange contracts, securities lending, and repurchase and reverse repurchase agreements. Counterparty risk also arises from unsecured bank deposits and in connection with the daily liquidity management of the fund, as well as purchases and sales of unlisted real estate and unlisted infrastructure. Furthermore, there is exposure to counterparty risk related to counterparties in the international settlement and custody systems where transactions settle. This can occur both for currency trades and for the purchase and sale of securities. Settlement risk and exposure from trades with a long settlement period are also defined as counterparty risk.
Various counterparties are used to reduce concentration and there are strict requirements for counterparty credit rating. Credit rating requirements are generally higher for counterparties to unsecured deposits in banks than in cases where collateral is received. Changes in counterparty credit ratings are monitored continuously.
Netting agreements are in place for trades in OTC derivatives, currency contracts, as well as repurchase and reverse repurchase agreements, in order to reduce counterparty risk. Many derivatives are also cleared, meaning that the counterparty risk is mainly towards the clearing house instead of banks. Further reduction of counterparty risk is achieved through requirements for collateral for counterparty net positions with a positive market value. For instruments where collateral is used, minimum requirements have been set relating to the credit quality, time to maturity and concentration of the collateral. Netting and collateral agreements are entered into for all approved counterparties for these types of trades.
There are also requirements governing the way real estate and infrastructure transactions are conducted in order to ensure acceptable counterparty risk. Counterparty risk that arises during the acquisition process is analysed in advance of the transaction and requires approval by the CRO. In 2023, 8 real estate transactions were analysed and approved by the CRO through this process, compared to 13 transactions in 2022. In 2023, 2 investments in unlisted infrastructure were analysed and approved by the CRO through this process. No investments were made in unlisted infrastructure in 2022.
Counterparty risk is also limited by setting exposure limits for individual counterparties. In most instances, the exposure limit is determined by the credit rating of the counterparty, where counterparties with strong credit rating have a higher limit than counterparties with weaker credit rating. Exposure per counterparty is measured daily against limits set by the Executive Board and the CEO of Norges Bank Investment Management.
The methodologies used to calculate counterparty risk are in accordance with internationally recognised standards. As a rule, the Basel regulations for banks are used for measuring counterparty risk, with certain adjustments based on internal analyses. The risk model calculates the expected counterparty exposure in the event of a counterparty default. The Standardised Approach in the Basel regulations (SA-CCR) is used for derivatives and foreign exchange contracts. The Standardised Approach takes into account collateral received and netting arrangements when calculating counterparty risk.
For repurchase agreements, securities lending transactions executed through an external agent and securities posted as collateral in derivative trades, a method is used that adds a premium to the market value to reflect the position’s volatility. When determining counterparty risk exposure for these positions, an adjustment is also made for netting and actual collateral received and posted.
Exposure to counterparty risk is related to counterparties in the settlement and custody systems, both for currency trades and for the purchase and sale of securities. Settlement risk is reduced using the currency settlement system CLS (Continuous Linked Settlement), or by trading directly with the settlement bank. For some currencies, Norges Bank is exposed to settlement risk when the sold currency is delivered to the counterparty before the receipt of currency is confirmed. This type of exposure is included on the line Settlement risk towards brokers and long settlement transactions in table 9.11.
In table 9.11, exposure is broken down by type of activity/instrument associated with counterparty risk.
Total counterparty risk increased to NOK 212.0 billion at year-end 2023, from NOK 172,0 billion at year-end 2022, an increase of 23.3 percent. The largest increase in counterparty risk exposure came from derivatives, including foreign exchange contracts, which amounted to NOK 30.2 billion in 2023, and was largest for futures and foreign exchange contracts. The increase was mainly due to increased activity in these instruments. There was also an increase in risk exposure from repurchase and reverse repurchase agreements at year-end 2023 compared to year-end 2022. This is mainly due to increased lending activity at year-end 2023.
Counterparty risk exposure from the securities lending programme increased to NOK 66.8 billion at year-end 2023, from NOK 62.3 billion at year-end 2022. The increase was mainly due to higher bond lending in the programme at year-end 2023. Both equities and bonds are lent through the securities lending programme. Counterparty risk exposure from securities lending accounted for 31.5 percent of the fund’s total counterparty risk exposure at the end of 2023, compared to 36.2 percent at the end of 2022.
Table 9.11 Counterparty risk by type of position
|
Amounts in NOK million |
Risk exposure |
|
|
31.12.2023 |
31.12.2022 |
|
|
Derivatives including foreign exchange contracts |
102 476 |
72 319 |
|
Securities lending |
66 750 |
62 291 |
|
Unsecured bank deposits1 and securities |
20 188 |
21 662 |
|
Repurchase and reverse repurchase agreements |
19 798 |
13 986 |
|
Settlement risk towards brokers and long settlement transactions |
2 798 |
1 699 |
|
Total |
212 011 |
171 956 |
1 Includes bank deposits in non-consolidated subsidiaries.
Norges Bank’s counterparties have a credit rating from independent credit rating agencies or a documented internal credit rating. Credit ratings for counterparties are monitored and complemented by alternative credit risk indicators.
Table 9.12 shows approved counterparties classified by credit rating category. The table also includes brokers that are used when purchasing and selling securities.
Table 9.12 Counterparties by credit rating1
|
Norges Bank's counterparties (excluding brokers) |
Brokers |
|||
|
31.12.2023 |
31.12.2022 |
31.12.2023 |
31.12.2022 |
|
|
AAA |
3 |
3 |
1 |
1 |
|
AA |
38 |
38 |
40 |
34 |
|
A |
70 |
62 |
89 |
87 |
|
BBB |
9 |
11 |
33 |
31 |
|
BB |
2 |
2 |
23 |
22 |
|
B |
- |
- |
5 |
4 |
|
Total |
122 |
116 |
191 |
179 |
1 The table shows the number of legal entities. The same legal entity can be included as both broker and counterparty.
The number of counterparties and brokers increased slightly during the year. There were 122 counterparties at year-end 2023, compared to 116 at year-end 2022. The number of brokers increased to 191 at year-end 2023, from 179 at year-end 2022. The overall credit quality of brokers and counterparties remained unchanged from year-end 2022.
Leverage
Leverage may be used to ensure effective management of the investments within the equity and bond portfolios, but not with the aim of increasing the economic exposure to risky assets. The use of leverage is regulated in both the management mandate and the investment mandate. Leverage is the difference between total net exposure and market value of the portfolio. Net exposure is determined by including securities at market value, cash at face value and positions in derivatives by converting them to the underlying exposure. When the exposure is greater than market value, the portfolio is leveraged.
The GPFG’s leverage was 1.5 percent for the aggregated equity and bond portfolio at the end of 2023, compared to 2.8 percent at the end of 2022. For investments in unlisted real estate, requirements are set in the investment mandate, limiting the maximum leverage of the portfolio to 35 percent. The unlisted real estate investments had a debt ratio of 7.8 percent at the end of 2023, compared to 7.6 percent at the end of 2022. At year-end 2023, there was no external debt for the unlisted infrastructure investments.
Sale of securities Norges Bank does not own
Sale of securities not owned by Norges Bank (short sales) can only be carried out if there are established borrowing agreements to cover a negative position. Such transactions were used to a limited extent in 2023.
GPFG Note 10 Tax
Accounting policy
Norges Bank is exempt from income tax on its operations in Norway, but is subject to taxes in a number of foreign jurisdictions. Tax expense in the income statement represents income taxes that are not reimbursed through local tax laws or treaties, and consists of taxes on dividends, interest income and capital gains related to investments in equities and bonds, tax on fee income from secured lending and taxes in consolidated subsidiaries. The majority of these taxes are collected at source.
Withholding taxes, net of deductions for refundable amounts, are recognised at the same time as the related dividend or interest income. See the accounting policy in note 4 Income/expense from equities, bonds and financial derivatives.
Other income tax, which is not collected at source, is recognised in the income statement in the same period as the related income or gain and presented in the balance sheet as a liability within Other liabilities, until it has been settled. Deferred tax in the balance sheet mainly consists of capital gains tax. Capital gains tax is recognised as a liability based on the expected future payment when the GPFG is in a gain position in the applicable market. No deferred tax asset is presented in the balance sheet when the GPFG is in a loss position, since the recognition criteria are not considered to be met.
Tax incurred in subsidiaries presented in the balance sheet lines Unlisted real estate and Unlisted infrastructure is recognised in the income statement as Income/expense from unlisted real estate and Income/expense from unlisted infrastructure, respectively. Only the tax expense in consolidated subsidiaries is included in the income statement line Tax expense. This is specified in table 10.1 in the line Other.
The rules on global minimum taxation (Pillar 2) are expected to be implemented in Norway with effect from 2024. The current assessment is that the fund will be exempt from the scope of application. Therefore, no change in the fund’s tax cost is expected as a result of the implementation.
All uncertain tax positions, such as disputed withholding tax refunds, are assessed each reporting period. The best estimate of the probable reimbursement or payment is recognised in the balance sheet.
Table 10.1 shows tax expense by type of investment and type of tax.
Table 10.1 Specification tax expense
|
Amounts in NOK million, 2023 |
Gross income before taxes |
Income tax on dividends, interest and fees |
Capital gains tax |
Other |
Tax expense |
Net income after taxes |
|
Income/expense from: |
||||||
|
Equities |
2 030 561 |
-7 533 |
-5 818 |
- |
-13 351 |
2 017 210 |
|
Bonds |
231 769 |
-20 |
- |
- |
-20 |
231 749 |
|
Secured lending |
9 922 |
-165 |
- |
- |
-165 |
9 757 |
|
Other |
- |
- |
- |
-19 |
-19 |
- |
|
Tax expense |
-7 718 |
-5 818 |
-19 |
-13 555 |
|
Amounts in NOK million, 2022 |
Gross income before taxes |
Income tax on dividends, interest and fees |
Capital gains tax |
Other |
Tax expense |
Net income after taxes |
|
Income/expense from: |
||||||
|
Equities |
-1 201 835 |
-4 347 |
-266 |
- |
-4 613 |
-1 206 448 |
|
Bonds |
-453 128 |
-25 |
- |
- |
-25 |
-453 153 |
|
Secured lending |
4 845 |
-202 |
- |
- |
-202 |
4 643 |
|
Other |
- |
- |
- |
-9 |
-9 |
- |
|
Tax expense |
-4 574 |
-266 |
-9 |
-4 850 |
Table 10.2 shows receivables and liabilities recognised in the balance sheet related to tax.
Table 10.2 Specification balance sheet items related to tax
|
Amounts in NOK million |
31.12.2023 |
31.12.2022 |
|
Withholding tax receivable |
10 522 |
8 937 |
|
Tax payable1 |
15 |
12 |
|
Deferred tax |
8 246 |
4 488 |
1 Included within the balance sheet line Other liabilities.
Table 10.3 specifies the line Net payment of taxes in the statement of cash flows.
Table 10.3 Specification net payment of taxes
|
Amounts in NOK million |
2023 |
2022 |
|
Receipt of refunded withholding tax |
8 231 |
6 617 |
|
Payment of taxes |
-19 405 |
-17 676 |
|
Net payment of taxes |
-11 173 |
-11 058 |
GPFG Note 11 Foreign exchange gains and losses
In accordance with the management mandate, the fund is not invested in securities issued by Norwegian companies, securities denominated in Norwegian kroner nor real estate or infrastructure located in Norway. The fund’s returns are measured primarily in the fund’s currency basket, which is a weighted combination of the currencies in the fund’s benchmark index for equities and bonds. The fund’s market value in Norwegian kroner is impacted by changes in exchange rates, but this has no bearing on the fund’s international purchasing power.
Accounting judgement
The management of Norges Bank has concluded that the Norwegian krone is the bank’s functional currency, since this currency is dominant for the bank’s underlying activities. Owner’s equity, in the form of the GPFG krone account, is denominated in Norwegian kroner and a share of the costs related to management of the GPFG is incurred in Norwegian kroner. Returns on the investment portfolio are reported both internally and to the owner in Norwegian kroner, while the percentage return is measured both in Norwegian kroner and in the currency basket defined by the Ministry of Finance. Furthermore, there is no single investment currency that stands out as dominant within the investment management.
Accounting policy
Foreign currency transactions are recognised in the financial statements using the exchange rate prevailing on the transaction date. Assets and liabilities in foreign currencies are translated into Norwegian kroner using the exchange rate at the balance sheet date. The foreign exchange element linked to realised and unrealised gains and losses on assets and liabilities is disaggregated in the income statement and presented on a separate line, Foreign exchange gain/loss. This presentation is considered to provide the best informational value, based on the objective of the investment strategy of the GPFG which is to maximise the international purchasing power of the fund.
Accounting policy
Gains and losses on financial instruments are due to changes in the price of the instrument (security element) and changes in foreign exchange rates (foreign exchange element). These are presented separately in the income statement. The method used to allocate the total gain/loss in Norwegian kroner to a security element and a foreign exchange element is described below.
Foreign exchange element
Unrealised gain/loss due to changes in foreign exchange rates is calculated based on the cost of the holding in foreign currency and the change in the exchange rate from the time of purchase until the balance sheet date. If the holding has been purchased in a prior period, previously recognised gain/loss is deducted to arrive at the gain/loss in the current period. Upon realisation, the exchange rate on the date of sale is used when calculating the realised gain/loss.
Security element
Unrealised gain/loss due to changes in the security price is calculated based on the change in the security price from the purchase date to the balance sheet date, and the exchange rate at the balance sheet date. If the holding has been purchased in a prior period, previously recognised gain/loss is deducted to arrive at the gain/loss in the current period. Upon realisation, the selling price is used when calculating the realised gain/loss.
The change in the fund’s market value due to changes in foreign exchange rates is presented in table 11.1.
Table 11.1 Specification foreign exchange gain/loss
|
Amounts in NOK million |
2023 |
2022 |
|
Foreign exchange gain/loss - USD/NOK |
114 262 |
445 752 |
|
Foreign exchange gain/loss - EUR/NOK |
150 575 |
100 638 |
|
Foreign exchange gain/loss - GBP/NOK |
64 611 |
-6 685 |
|
Foreign exchange gain/loss - JPY/NOK |
-33 765 |
-11 871 |
|
Foreign exchange gain/loss - CHF/NOK |
43 197 |
28 912 |
|
Foreign exchange gain/loss - other |
70 561 |
85 104 |
|
Foreign exchange gain/loss |
409 441 |
641 850 |
Table 11.2 gives an overview of the distribution of the market value of the investment portfolio for the main currencies the GPFG is exposed to. This supplements the overview of the allocation by asset class, country and currency shown in table 9.2 in note 9 Investment risk.
Table 11.2 Specification of the investment portfolio by currency
|
Amounts in NOK million |
31.12.2023 |
31.12.2022 |
|
US dollar |
7 765 611 |
5 706 838 |
|
Euro |
2 836 773 |
2 301 709 |
|
British pound |
1 079 685 |
936 868 |
|
Japanese yen |
939 710 |
804 707 |
|
Swiss franc |
593 279 |
502 895 |
|
Other currencies1 |
2 549 740 |
2 176 043 |
|
Market value investment portfolio |
15 764 797 |
12 429 059 |
1 From 2023, Deferred tax is not included as part of the investment portfolio.
Table 11.3 gives an overview of exchange rates at the balance sheet date for the main currencies the GPFG is exposed to.
Table 11.3 Exchange rates
|
31.12.2023 |
31.12.2022 |
Percent change |
|
|
US dollar |
10.17 |
9.85 |
3.3 |
|
Euro |
11.24 |
10.51 |
6.9 |
|
British pound |
12.93 |
11.85 |
9.2 |
|
Japanese yen |
0.07 |
0.07 |
-3.7 |
|
Swiss franc |
12.14 |
10.65 |
14.0 |
GPFG Note 12 Management costs
Accounting policy
Management fee is recognised in the GPFG’s income statement as an expense when incurred.
Performance-based fees to external managers are based on achieved excess returns relative to the applicable benchmark index over time. The provision for performance-based fees is based on the best estimate of the incurred fee to be paid. The effect of changes in estimates is recognised in profit or loss in the current period.
Management costs comprise all costs relating to the management of the fund. These are mainly incurred in Norges Bank, but management costs are also incurred in subsidiaries of Norges Bank that are exclusively established as part of the management of the GPFG’s investments in unlisted real estate and unlisted renewable energy infrastructure.
Management costs in Norges Bank
The Ministry of Finance reimburses Norges Bank for costs incurred in connection with the management of the GPFG, in the form of a management fee. The management fee is equivalent to the actual costs incurred by Norges Bank, including performance-based fees to external managers, and is expensed in the income statement line Management fee. Costs included in the management fee are specified in table 12.1.
Table 12.1 Management fee
|
Amounts in NOK million |
2023 |
2022 |
||
|
Basis points |
Basis points |
|||
|
Salary, social security and other personnel-related costs |
2 045 |
1 579 |
||
|
Custody costs |
464 |
473 |
||
|
IT services, systems, data and information |
773 |
632 |
||
|
Research, consulting and legal fees |
269 |
247 |
||
|
Other costs |
276 |
274 |
||
|
Allocated costs Norges Bank |
256 |
339 |
||
|
Base fees to external managers |
1 205 |
963 |
||
|
Management fee excluding performance-based fees |
5 289 |
3.6 |
4 508 |
3.8 |
|
Performance-based fees to external managers |
1 343 |
718 |
||
|
Management fee |
6 632 |
4.5 |
5 226 |
4.4 |
Management costs in subsidiaries
Management costs incurred in wholly-owned subsidiaries consist of costs related to the management of the investments in unlisted real estate and unlisted renewable energy infrastructure. These costs are expensed directly in the portfolio result and are not part of the management fee.
Management costs incurred in non-consolidated subsidiaries are presented in the income statement lines Income/expense from unlisted real estate and Income/expense from unlisted infrastructure. Management costs incurred in consolidated subsidiaries are presented in the income statement line Other income/expense. These costs are specified in table 12.2.
Table 12.2 Management costs subsidiaries
|
Amounts in NOK million |
2023 |
2022 |
||
|
Basis points |
Basis points |
|||
|
Salary, social security and other personnel-related costs |
34 |
30 |
||
|
IT services, systems, data and information |
5 |
4 |
||
|
Research, consulting and legal fees |
52 |
38 |
||
|
Other costs |
58 |
42 |
||
|
Total management costs, subsidiaries1 |
148 |
0.1 |
114 |
0.1 |
|
Of which management costs non-consolidated subsidiaries |
89 |
71 |
||
|
Of which management costs consolidated subsidiaries |
59 |
43 |
||
1 For 2023, the amount consists of NOK 141 million related to investments in unlisted real estate and NOK 7 million related to investments in unlisted renewable energy infrastructure. For 2022, NOK 108 million was related to investments in unlisted real estate and NOK 6 million was related to investments in unlisted infrastructure.
Upper limit for reimbursement of management costs
Every year the Ministry of Finance establishes an upper limit for the reimbursement of management costs. Norges Bank is only reimbursed for costs incurred within this limit. Norges Bank is also reimbursed for performance-based fees to external managers. These fees are not measured against the upper limit.
For 2023, total management costs incurred in Norges Bank and its subsidiaries, excluding performance-based fees to external managers, were limited to NOK 6 200 million. In 2022, the limit was NOK 5 600 million.
Total management costs measured against the upper limit amounted to NOK 5 437 million in 2023. This consisted of management costs in Norges Bank, excluding performance-based fees to external managers, of NOK 5 289 million and management costs in subsidiaries of NOK 148 million. Total management costs including performance-based fees to external managers amounted to NOK 6 781 million in 2023.
Costs measured as a share of assets under management
Costs are also measured in basis points, as a share of average assets under management. Average assets under management are calculated based on the market value of the portfolio in Norwegian kroner at the start of each month in the calendar year.
In 2023, management costs incurred in Norges Bank and its subsidiaries, excluding performance-based fees to external managers, corresponded to 3.7 basis points of assets under management. Management costs including performance-based fees to external managers corresponded to 4.6 basis points of assets under management.
Other operating costs in subsidiaries
In addition to the management costs presented in table 12.2, other operating costs are also incurred in subsidiaries related to the ongoing maintenance, operation and development of the investments. These are not costs related to investing in real estate or renewable energy infrastructure but are costs for operating the underlying investments once they are acquired. Therefore, they are not defined as management costs. Other operating costs are expensed directly in the portfolio result and are not part of the management fee. They are also not included in the costs measured against the upper limit.
Other operating costs incurred in non-consolidated subsidiaries are presented in the income statement lines Income/expense from unlisted real estate and Income/expense from unlisted infrastructure. For further information, see table 6.4 in note 6 Unlisted real estate and table 7.4 in note 7 Unlisted renewable energy infrastructure. Other operating costs incurred in consolidated subsidiaries are presented in the income statement line Other income/expense.
GPFG Note 13 Secured lending and borrowing
Secured lending and borrowing consists of collateralised (secured) transactions, where the GPFG posts or receives securities or cash to or from a counterparty, with collateral in the form of other securities or cash. These transactions take place under various agreements such as securities lending agreements, repurchase and reverse repurchase agreements and equity swaps in combination with purchases or sales of equities.
The objective of secured lending and borrowing is to provide an incremental return on the GPFG’s holdings of securities and cash. These transactions are also used in connection with liquidity management.
Accounting policy
Income and expense from secured lending and borrowing
Income and expense mainly consist of interest and net fees. These are recognised on a straight-line basis over the term of the agreement and are presented in the income statement as Income/expense from secured lending and Income/expense from secured borrowing.
Table 13.1 Income/expense from secured lending and borrowing
|
Amounts in NOK million |
2023 |
2022 |
|
Income/expense from secured lending |
9 922 |
4 845 |
|
Income/expense from secured borrowing |
-13 278 |
-4 792 |
|
Net income/expense from secured lending and borrowing |
-3 356 |
53 |
Accounting policy
Transferred financial assets
Securities transferred to counterparties are not derecognised when the agreement is entered into, as the derecognition criteria are not met. Since the counterparty has the right to sell or pledge the security, the security is considered to be transferred. Transferred securities are therefore presented separately in the balance sheet lines Equities lent and Bonds lent. During the lending period, the underlying securities are accounted for in accordance with accounting policies for the relevant securities.
When an equity is sold in combination with the purchase of an equivalent equity swap, the sold equity is presented in the balance sheet as Equities lent, since the GPFG’s exposure to the equity is virtually unchanged. The equity swap (derivative) is not recognised in the balance sheet, since this would lead to recognition of the same rights twice. When an equity is purchased in combination with the sale of an equivalent equity swap, the GPFG has virtually no exposure to the equity or the derivative and neither the equity nor the derivative are recognised in the balance sheet.
Secured lending
Cash collateral posted to counterparties is derecognised, and a corresponding receivable reflecting the cash amount that will be returned is recognised as a financial asset, Secured lending. This receivable is measured at fair value.
Secured borrowing
Cash collateral received is recognised as Deposits in banks together with a corresponding financial liability, Secured borrowing. This liability is measured at fair value.
Collateral received in the form of securities
Collateral received through secured lending and borrowing transactions in the form of securities, where the GPFG has the right to sell or pledge the security, is not recognised in the balance sheet.
Table 13.2 shows the amount presented as Secured lending, and the associated collateral received in the form of securities.
Table 13.2 Secured lending
|
Amounts in NOK million |
31.12.2023 |
31.12.2022 |
|
Secured lending |
728 559 |
462 982 |
|
Total secured lending |
728 559 |
462 982 |
|
Associated collateral in the form of securities (off balance sheet) |
||
|
Equities received as collateral |
273 558 |
169 631 |
|
Bonds received as collateral1 |
486 798 |
303 525 |
|
Total collateral received in the form of securities related to secured lending |
760 356 |
473 157 |
1 At year-end 2023, bonds received as collateral amounting to NOK 2.6 billion were sold. At year-end 2022, no securities received as collateral were sold or re-pledged.
Table 13.3 shows transferred securities with the associated liability presented as Secured borrowing, and collateral received in the form of securities or guarantees.
Table 13.3 Transferred financial assets and secured borrowing
|
Amounts in NOK million |
31.12.2023 |
31.12.2022 |
|
Transferred financial assets and secured borrowing |
||
|
Equities lent |
493 949 |
451 799 |
|
Bonds lent |
1 006 711 |
886 555 |
|
Total transferred financial assets |
1 500 660 |
1 338 354 |
|
Associated cash collateral, recognised as liability |
||
|
Secured borrowing |
911 548 |
796 082 |
|
Total secured borrowing |
911 548 |
796 082 |
|
Associated collateral in the form of securities or guarantees (off balance sheet) |
||
|
Equities received as collateral |
264 550 |
226 054 |
|
Bonds received as collateral |
360 945 |
342 978 |
|
Guarantees |
4 544 |
19 953 |
|
Total collateral received in the form of securities or guarantees related to transferred financial assets |
630 039 |
588 985 |
GPFG Note 14 Collateral and offsetting
Accounting policy
Cash collateral derivative transactions
Cash collateral posted in connection with derivative transactions is derecognised and a corresponding receivable, reflecting the cash amount that will be returned, is recognised in the balance sheet as Cash collateral posted. Cash collateral received in connection with derivative transactions is recognised in the balance sheet as Deposits in banks, with a corresponding liability Cash collateral received. Both Cash collateral posted and Cash collateral received are measured at fair value.
Offsetting
Financial assets and liabilities are offset and presented net in the balance sheet when there is a legal right to offset and the intention is to settle net or realise the asset and settle the liability simultanously.
Collateral
For various counterparties and transaction types, cash collateral will both be posted to and received from the same counterparty. Therefore, received cash collateral can be netted against posted cash collateral and vice-versa as shown in table 14.1. The balance sheet lines Cash collateral posted and Cash collateral received are related exclusively to derivative transactions. Collateral in the form of cash or securities is also posted and received in connection with secured lending and borrowing transactions. See note 13 Secured lending and borrowing for further information.
Offsetting
Table 14.1 provides an overview of financial assets and liabilities, the effects of legally enforceable netting agreements and related collateral to reduce counterparty risk. The column Assets/Liabilities in the balance sheet subject to netting shows the carrying amounts of financial assets and liabilities that are subject to legally enforceable netting agreements. These amounts are adjusted for the effect of potential netting of financial assets and liabilities recognised in the balance sheet with the same counterparty, together with posted or received cash collateral. This results in a net exposure, which is shown in the column Assets/Liabilities after netting and collateral.
Some netting agreements could potentially not be legally enforceable. Transactions under the relevant contracts are shown in the column Assets/Liabilities not subject to enforceable netting agreements.
In the event of counterparty default, a collective settlement between Norges Bank and the bankruptcy estate could be agreed for certain groups of instruments, irrespective of whether the instruments belong to the GPFG or Norges Bank’s foreign exchange reserves. Such a settlement will be allocated proportionately between these portfolios and is therefore not adjusted for in the table.
Table 14.1 Assets and liabilities subject to netting agreements
|
Amounts in NOK million, 31.12.2023 |
Amounts subject to enforceable master netting agreements |
||||||||
|
Description |
Gross financial assets recognised in the balance sheet |
Gross financial liabilities offset in the balance sheet |
Net financial assets in the balance sheet |
Assets not subject to enforceable netting agreements1 |
Assets in the balance sheet subject to netting |
Financial liabilities related to same counterparty |
Cash collateral received (recognised as liability) |
Security collateral received (not recognised) |
Assets after netting and collateral |
|
Assets |
|||||||||
|
Secured lending |
728 559 |
- |
728 559 |
277 351 |
451 208 |
- |
231 221 |
219 987 |
- |
|
Cash collateral posted |
19 361 |
- |
19 361 |
- |
19 361 |
13 715 |
- |
- |
5 646 |
|
Financial derivatives |
22 833 |
3 640 |
19 192 |
178 |
19 013 |
17 719 |
27 |
- |
1 267 |
|
Total |
770 753 |
3 640 |
767 112 |
277 529 |
489 582 |
31 434 |
231 248 |
219 987 |
6 913 |
|
Amounts in NOK million, 31.12.2023 |
Amounts subject to enforceable master netting agreements |
||||||||
|
Description |
Gross financial liabilities recognised in the balance sheet |
Gross financial assets offset in the balance sheet |
Net financial liabilities in the balance sheet |
Liabilities not subject to enforceable netting agreements2 |
Liabilities in the balance sheet subject to netting |
Financial assets related to same counterparty |
Cash collateral posted (recognised as asset) |
Security collateral posted (not derecognised) |
Liabilities after netting and collateral |
|
Liabilities |
|||||||||
|
Secured borrowing |
911 548 |
- |
911 548 |
175 895 |
735 653 |
- |
231 221 |
501 947 |
2 484 |
|
Cash collateral received |
28 754 |
- |
28 754 |
24 771 |
3 983 |
2 859 |
- |
- |
1 123 |
|
Financial derivatives |
36 695 |
3 640 |
33 055 |
29 |
33 027 |
17 719 |
10 497 |
- |
4 810 |
|
Total |
976 997 |
3 640 |
973 357 |
200 695 |
772 663 |
20 578 |
241 718 |
501 947 |
8 417 |
|
Amounts in NOK million, 31.12.2022 |
Amounts subject to enforceable master netting agreements |
||||||||
|
Description |
Gross financial assets recognised in the balance sheet |
Gross financial liabilities offset in the balance sheet3 |
Net financial assets in the balance sheet |
Assets not subject to enforceable netting agreements1 |
Assets in the balance sheet subject to netting |
Financial liabilities related to same counterparty |
Cash collateral received (recognised as liability) |
Security collateral received (not recognised) |
Assets after netting and collateral |
|
Assets |
|||||||||
|
Secured lending |
462 982 |
- |
462 982 |
137 371 |
325 611 |
- |
151 451 |
174 150 |
10 |
|
Cash collateral posted |
21 601 |
- |
21 601 |
- |
21 601 |
18 699 |
- |
- |
2 901 |
|
Financial derivatives |
21 238 |
740 |
20 498 |
495 |
20 004 |
19 619 |
386 |
- |
- |
|
Total |
505 820 |
740 |
505 080 |
137 866 |
367 215 |
38 318 |
151 837 |
174 150 |
2 912 |
|
Amounts in NOK million, 31.12.2022 |
Amounts subject to enforceable master netting agreements |
||||||||
|
Description |
Gross financial liabilities recognised in the balance sheet |
Gross financial assets offset in the balance sheet3 |
Net financial liabilities in the balance sheet |
Liabilities not subject to enforceable netting agreements2 |
Liabilities in the balance sheet subject to netting |
Financial assets related to same counterparty |
Cash collateral posted (recognised as asset) |
Security collateral posted (not derecognised) |
Liabilities after netting and collateral |
|
Liabilities |
|||||||||
|
Secured borrowing |
796 082 |
- |
796 082 |
210 665 |
585 417 |
- |
151 451 |
431 960 |
2 006 |
|
Cash collateral received |
14 801 |
- |
14 801 |
- |
14 801 |
11 211 |
- |
- |
3 590 |
|
Financial derivatives |
40 899 |
740 |
40 159 |
34 |
40 124 |
19 619 |
15 170 |
- |
5 335 |
|
Total |
851 782 |
740 |
851 042 |
210 699 |
640 342 |
30 830 |
166 621 |
431 960 |
10 931 |
1 Secured lending includes amounts related to shares purchased in combination with equity swaps. In 2023, this amounted to NOK 250 billion (NOK 104 billion in 2022). See note 13 Secured lending and borrowing for further information.
2 Secured borrowing includes amounts related to shares sold in combination with equity swaps. In 2023, this amounted to NOK 132 billion (NOK 105 billion in 2022). See note 13 Secured lending and borrowing for further information.
3 Gross amounts offset in the balance sheet have been restated due to a reassessment of exchange traded futures contracts and associated cash collateral. Variation margin and exchange traded futures contracts are now recognised gross, but are considered to satisfy the criteria for offsetting in IAS 32 and are therefore presented net in the balance sheet. The change has no impact on the net amounts presented in the balance sheet.
GPFG Note 15 Related parties
Accounting policy
Norges Bank is owned by the Norwegian government and is, in line with IAS 24 Related party disclosures, exempt from the disclosure requirements pertaining to related party transactions and outstanding balances, including commitments, with the Norwegian government. This includes transactions with other entities that are related parties because the Norwegian government has control of, joint control of, or significant influence over both Norges Bank and the other entities.
Norges Bank, including the GPFG, is a separate legal entity that is wholly state-owned through the Ministry of Finance. See note 1 General information for information regarding the relationship between the Ministry of Finance, Norges Bank and the GPFG. The GPFG conducts all transactions at market terms.
Transactions with the government
The Ministry of Finance has placed funds for investment in the GPFG in the form of a Norwegian krone deposit with Norges Bank (the krone account). The krone deposit is subsequently placed with Norges Bank Investment Management for investment management. In accordance with the management mandate, transfers are made to and from the krone account. See additional information regarding the inflow/withdrawal for the period in the Statement of changes in owner’s capital.
Transactions with Norges Bank
Norges Bank does not bear any economic risk from the management of the GPFG.
Management fee
The Ministry of Finance reimburses Norges Bank for costs incurred in connection with the management of the GPFG in the form of a management fee. See note 12 Management costs for further information. The management fee is deducted from the krone account throughout the year based on forecasts. The difference between the total amount deducted and the final management fee for the year is presented in the balance sheet as Management fee receivable or Management fee payable and is settled in the following year. In 2023, NOK 6.5 billion was deducted from the krone account to pay the accrued management fee, while NOK 5.0 billion was deducted in 2022. Management fee receivable was NOK 168 million at the end of 2023, compared to a receivable of NOK 274 million at the end of 2022.
Inflows to or withdrawals from the krone account
Inflows to or withdrawals from the krone account are carried out through monthly transfers between the GPFG and Norges Bank. Five percent of the transferred amount is withheld until the following month, in order to adjust the transferred amount in transaction currency to the instructed amount stated in Norwegian kroner from the Ministry of Finance. Unsettled transfer constitutes an outstanding balance between the GPFG and Norges Bank, and is presented in the balance sheet line Other assets or Other liabilities. Unsettled inflow at the end of 2023 presented in Other assets amounted to NOK 2 365 million. At the end of 2022, NOK 1 468 million was presented in Other assets related to unsettled inflow.
Transactions between the GPFG and Norges Bank’s foreign exchange reserves
Internal trades in the form of money market lending or borrowing between the GPFG and Norges Bank’s foreign exchange reserves are presented as a net balance between the two portfolios in the balance sheet lines Other assets and Other liabilities. At the end of 2023, the net balance between the portfolios represented a receivable for the GPFG of NOK 59 million, compared to a receivable of NOK 302 million at the end of 2022. Related income and expense items are presented net in the income statement as Interest income/expense.
Transactions with subsidiaries
Subsidiaries of Norges Bank are established as part of the management of the GPFG’s investments in unlisted real estate and unlisted renewable energy infrastructure. For an overview of the companies that own and manage the investments, as well as consolidated subsidiaries, see note 16 Interests in other entities. For further information regarding transactions with subsidiaries, see note 6 Unlisted real estate and note 7 Unlisted renewable energy infrastructure.
GPFG Note 16 Interests in other entities
Investments in unlisted real estate and unlisted renewable energy infrastructure are made through subsidiaries of Norges Bank, exclusively established as part of the management of the GPFG. All subsidiaries are 100 percent owned. These subsidiaries invest, through holding companies, in entities that invest in properties and renewable energy infrastructure. These entities may be subsidiaries or jointly controlled entities.
The overall objective of the ownership structures used for investments in unlisted real estate and unlisted infrastructure is to safeguard the financial wealth under management and to ensure the highest possible net return after costs, in accordance with the management mandate issued by the Ministry of Finance. Key criteria when deciding the ownership structure are legal protection, governance and operational efficiency. Taxes may represent a significant cost for the unlisted investments. Expected tax expense for the fund is therefore one of the factors considered when determining the ownership structure.
Table 16.1 shows the companies that own and manage the properties and infrastructure assets, as well as consolidated subsidiaries.
Table 16.1 Real estate and infrastructure companies
|
Company |
Business address |
Property address1 |
Ownership share and voting right in percent |
Effective ownership share of underlying properties in percent |
Recognised from |
|
Non-consolidated companies |
|||||
|
United Kingdom |
|||||
|
NBIM George Partners LP2 |
London |
London |
100.00 |
25.00 |
2011 |
|
MSC Property Intermediate Holdings Limited |
London |
Sheffield |
50.00 |
50.00 |
2012 |
|
NBIM Charlotte Partners LP |
London |
London |
100.00 |
57.75 |
2014 |
|
NBIM Edward Partners LP |
London |
London |
100.00 |
100.00 |
2014 |
|
NBIM Caroline Partners LP |
London |
London |
100.00 |
100.00 |
2015 |
|
NBIM Henry Partners LP |
London |
London |
100.00 |
100.00 |
2016 |
|
NBIM Elizabeth Partners LP |
London |
London |
100.00 |
100.00 |
2016 |
|
NBIM Eleanor Partners LP |
London |
London |
100.00 |
100.00 |
2018 |
|
WOSC Partners LP |
London |
London |
75.00 |
75.00 |
2019 |
|
PELP UK Limited |
Solihull |
Multiple British cities |
50.00 |
50.00 |
2022 |
|
Longfellow Strategic Value UK I LP |
Bristol |
Cambridge |
48.75 |
48.75 |
2022 |
|
Luxembourg |
|||||
|
NBIM S.à r.l. |
Luxembourg |
N/A |
100.00 |
N/A |
2011 |
|
France |
|||||
|
NBIM Louis SAS |
Paris |
Paris |
100.00 |
50.00 |
2011 |
|
SCI 16 Matignon |
Paris |
Paris |
50.00 |
50.00 |
2011 |
|
Champs Elysées Rond-Point SCI |
Paris |
Paris |
50.00 |
50.00 |
2011 |
|
SCI PB 12 |
Paris |
Paris |
50.00 |
50.00 |
2011 |
|
SCI Malesherbes |
Paris |
Paris |
50.00 |
50.00 |
2012 |
|
SCI 15 Scribe |
Paris |
Paris |
50.00 |
50.00 |
2012 |
|
SAS 100 CE |
Paris |
Paris |
50.00 |
50.00 |
2012 |
|
SCI Daumesnil |
Paris |
Paris |
50.00 |
50.00 |
2012 |
|
SCI 9 Messine |
Paris |
Paris |
50.00 |
50.00 |
2012 |
|
SCI Pasquier |
Paris |
Paris |
50.00 |
50.00 |
2013 |
|
NBIM Marcel SCI |
Paris |
Paris |
100.00 |
100.00 |
2014 |
|
NBIM Victor SCI |
Paris |
Paris |
100.00 |
100.00 |
2016 |
|
NBIM Eugene SCI |
Paris |
Paris |
100.00 |
100.00 |
2017 |
|
NBIM Beatrice SCI |
Paris |
Paris |
100.00 |
100.00 |
2018 |
|
NBIM Jeanne SCI |
Paris |
Paris |
100.00 |
100.00 |
2019 |
|
Rodolphe Paris 1 SCI |
Paris |
Paris |
65.00 |
65.00 |
2022 |
|
Germany |
|||||
|
NKE Neues Kranzler Eck Berlin Immobilien GmbH & Co. KG |
Frankfurt |
Berlin |
50.00 |
50.00 |
2012 |
|
NBIM Helmut 2 GmbH & Co KG |
Berlin |
Berlin |
100.00 |
100.00 |
2020 |
|
Sochribel GmbH |
Berlin |
Berlin |
50.00 |
50.00 |
2022 |
|
Rodolphe Berlin 1 GmbH |
Berlin |
Berlin |
65.00 |
65.00 |
2023 |
|
He Dreith Investor GmbH |
Karlsruhe |
He Dreiht |
33.33 |
16.63 |
2023 |
|
Switzerland |
|||||
|
NBIM Antoine CHF S.à r.l. |
Luxembourg |
Zürich |
100.00 |
100.00 |
2012 |
|
Europe |
|||||
|
Prologis European Logistics Partners S.à r.l. |
Luxembourg |
Multiple European cities |
50.00 |
50.00 |
2013 |
|
United States |
|||||
|
T-C 1101 Pennsylvania Venture LLC |
Wilmington, DE |
Washington |
49.90 |
49.90 |
2013 |
|
T-C Franklin Square Venture LLC |
Wilmington, DE |
Washington |
49.90 |
49.90 |
2013 |
|
T-C 33 Arch Street Venture LLC |
Wilmington, DE |
Boston |
49.90 |
49.90 |
2013 |
|
No. 1 Times Square Development LLC |
Wilmington, DE |
New York |
45.00 |
45.00 |
2013 |
|
OFC Boston LLC |
Wilmington, DE |
Boston |
47.50 |
47.50 |
2013 |
|
425 MKT LLC |
Wilmington, DE |
San Francisco |
47.50 |
47.50 |
2013 |
|
555 12th LLC |
Wilmington, DE |
Washington |
47.50 |
47.50 |
2013 |
|
Prologis U.S. Logistics Venture LLC |
Wilmington, DE |
Multiple American cities |
46.30 |
44.96 |
2014 |
|
OBS Boston LLC |
Wilmington, DE |
Boston |
47.50 |
47.50 |
2014 |
|
100 Federal JV LLC |
Wilmington, DE |
Boston |
45.00 |
45.00 |
2014 |
|
Atlantic Wharf JV LLC |
Wilmington, DE |
Boston |
45.00 |
45.00 |
2014 |
|
BP/CG Center MM LLC |
Wilmington, DE |
New York |
45.00 |
45.00 |
2014 |
|
T-C 2 Herald Square Venture LLC |
Wilmington, DE |
New York |
49.90 |
49.90 |
2014 |
|
T-C 800 17th Street Venture NW LLC |
Wilmington, DE |
Washington |
49.90 |
49.90 |
2014 |
|
T-C Foundry Sq II Venture LLC |
Wilmington, DE |
San Francisco |
49.90 |
49.90 |
2014 |
|
T-C Hall of States Venture LLC |
Wilmington, DE |
Washington |
49.90 |
49.90 |
2014 |
|
SJP TS JV LLC |
Wilmington, DE |
New York |
45.00 |
45.00 |
2015 |
|
T-C Republic Square Venture LLC |
Wilmington, DE |
Washington |
49.90 |
49.90 |
2015 |
|
T-C 888 Brannan Venture LLC |
Wilmington, DE |
San Francisco |
49.90 |
49.90 |
2015 |
|
Hudson Square Properties, LLC |
Wilmington, DE |
New York |
48.00 |
48.00 |
2015 |
|
ConSquare LLC |
Wilmington, DE |
Washington |
47.50 |
47.50 |
2016 |
|
100 First Street Member LLC |
Wilmington, DE |
San Francisco |
44.00 |
44.00 |
2016 |
|
303 Second Street Member LLC |
Wilmington, DE |
San Francisco |
44.00 |
44.00 |
2016 |
|
900 16th Street Economic Joint Venture (DE) LP |
Wilmington, DE |
Washington |
49.00 |
49.00 |
2017 |
|
1101 NYA Economic Joint Venture (DE) LP |
Wilmington, DE |
Washington |
49.00 |
49.00 |
2017 |
|
375 HSP LLC |
Wilmington, DE |
New York |
48.00 |
48.00 |
2017 |
|
T-C 501 Boylston Venture LLC |
Wilmington, DE |
Boston |
49.90 |
49.90 |
2018 |
|
SVF Seaport JV LLC |
Wilmington, DE |
Boston |
45.00 |
45.00 |
2018 |
|
OMD Venture LLC |
Wilmington, DE |
Boston |
47.50 |
47.50 |
2021 |
|
ARE-MA Region No. 102 JV LLC |
Wilmington, DE |
Boston |
41.00 |
41.00 |
2021 |
|
JV 347 Madison LLC |
Wilmington, DE |
New York |
45.00 |
45.00 |
2023 |
|
300 Binney JV LLC |
Wilmington, DE |
Boston |
45.00 |
45.00 |
2023 |
|
Japan |
|||||
|
TMK Tokyo TN1 |
Tokyo |
Tokyo |
70.00 |
70.00 |
2017 |
|
Tokyo MN1 TMK |
Tokyo |
Tokyo |
100.00 |
39.90 |
2020 |
|
Netherlands |
|||||
|
Borssele Wind Farm C.V. |
The Hague |
Borssele 1&2 |
50.00 |
50.00 |
2021 |
|
Spain |
|||||
|
Energías Renovables Romeo, S.L |
Madrid |
Multiple locations |
49.00 |
49.00 |
2023 |
|
Consolidated subsidiaries |
|||||
|
Japan |
|||||
|
NBRE Management Japan Advisors K.K. |
Tokyo |
N/A |
100.00 |
N/A |
2015 |
|
United Kingdom |
|||||
|
NBRE Management Europe Limited |
London |
N/A |
100.00 |
N/A |
2016 |
1 For investments in unlisted real estate, the property address is shown. For investments in unlisted infrastructure, the project name is shown.
2 One property in this company, 20 Air Street, has an ownership share of 50 percent.
Activity in the consolidated subsidiaries consists of providing investment-related services to the GPFG. This activity is presented in the income statement line Other costs and included in the balance sheet lines Other assets and Other liabilities.
In addition to the companies shown in table 16.1, Norges Bank has wholly-owned holding companies established in connection with investments in unlisted real estate and unlisted renewable energy infrastructure. These holding companies do not engage in any operations and do not own any properties or infrastructure assets directly. The holding companies have their business address either in the same country as the investments, in connection with NBIM S.à r.l. in Luxembourg, or in Norway for the holding companies established for investments in Japan and continental Europe.
GPFG Note 17 Other assets and other liabilities
Table 17.1 Other assets
|
Amounts in NOK million |
31.12.2023 |
31.12.2022 |
|
Net balance Norges Bank's foreign exchange reserves1 |
59 |
302 |
|
Unsettled inflow krone account1 |
2 365 |
1 468 |
|
Accrued income from secured lending |
245 |
227 |
|
Other |
83 |
20 |
|
Other assets |
2 752 |
2 017 |
1 See note 15 Related parties for further information.
Table 17.2 Other liabilities
|
Amounts in NOK million |
31.12.2023 |
31.12.2022 |
|
Tax payable |
15 |
12 |
|
Other |
97 |
44 |
|
Other liabilities |
112 |
56 |
Independent auditor’s report
To the Supervisory Council of Norges Bank
Opinion
We have audited the financial statements of Norges Bank, which comprise the balance sheet as at 31 December 2023, the income statement, statement of changes in equity and statement of cash flows for the year then ended, and notes to the financial statements, including a summary of significant accounting policies.
In our opinion, the financial statements comply with applicable legal requirements and give a true and fair view of the financial position of Norges Bank as at 31 December 2023 and its financial performance and cash flows for the year then ended in accordance with the Regulation concerning annual financial reporting for Norges Bank. The Regulation requires the financial statements for Norges Bank to be prepared in accordance with IFRS Accounting Standards as adopted by the EU, with certain specific presentation requirements for the investment portfolio
Basis for opinion
We conducted our audit in accordance with International Standards on Auditing (ISAs). Our responsibilities under those standards are further described in the Auditor’s responsibilities for the audit of the financial statements section of our report. We are independent of Norges Bank in accordance with the requirements of the relevant laws and regulations in Norway and the International Ethics Standards Board for Accountants’ International Code of Ethics for Professional Accountants (including International Independence Standards) (IESBA Code), and we have fulfilled our other ethical responsibilities in accordance with these requirements. We believe that the audit evidence we have obtained is sufficient and appropriate to provide a basis for our opinion.
Key audit matters
Key audit matters are those matters that, in our professional judgment, were of most significance in our audit of the financial statements for 2023. These matters were addressed in the context of our audit of the financial statements as a whole, and in forming our opinion thereon, and we do not provide a separate opinion on these matters. For each matter below, our description of how our audit addressed the matter is provided in that context.
We have fulfilled the responsibilities described in the Auditor’s responsibilities for the audit of the financial statements section of our report, including in relation to these matters. Accordingly, our audit included the performance of procedures designed to respond to our assessment of the risks of material misstatement of the financial statements. The results of our audit procedures, including the procedures performed to address the matters below, provide the basis for our audit opinion on the financial statements.
Valuation of investments
Basis for the key audit matter
Listed investments measured at fair value in the equity and fixed income portfolios in the foreign exchange reserves in Norges Bank’s central banking operations and the investment portfolio of the Government Pension Fund Global (hereinafter “the GPFG”) are valued at market price if the investment is traded in what is considered to be an active market. These investments are classified as level 1 assets in the valuation hierarchy. Listed investments valued using models that use directly or indirectly observable market data are classified as level 2 assets. Investments classified in level 1 and 2 of the valuation hierarchy as of 31.12 amounts to NOK 689 781 million and NOK 15 444 244 million for the foreign exchange reserves and the GPFG, respectively.
Investments valued based on models which mainly use inputs that are not observable in the market place, are classified as level 3 assets in the valuation hierarchy. These valuations are to a larger extent influenced by judgmental assessments and therefore have a higher inherent risk of misstatement. As of 31.12 these assets in the GPFG amount to NOK 320 554 million.
Investments measured at fair value in the foreign exchange reserves and the GPFG constitute the most material share of assets as at 31.12. The material amount, the measurement at fair value with occasional use of judgments and the classification to levels 1, 2 or 3 respectively in the fair value hierarchy, and the fact that the GPFG’s return on investment measurement follows from these valuations, we have considered these investments to be a key audit matter.
The foreign exchange reserves measured at fair value are disclosed in note 6. The investments in the GPFG are disclosed in Note 20, "GPFG Note 8" and "GPFG Note 3".
Our audit response
For both listed and unlisted investments, we assessed the design and tested the operating effectiveness of internal controls over valuation processes, including controls over management’s determination and approval of the methodology and assumptions used for valuation. For listed investments, we furthermore compared the recognized value at the balance sheet date, against the external market price.
Our audit procedures for unlisted level 3 investments also comprised management’s use of external experts and valuations, including the experts’ expertise and objectivity. We have used EY’s internal valuation specialists to review assumptions and calculations of valuation reports on a sample basis.
We have furthermore evaluated the design and tested the operating effectiveness of internal controls over the classification in the fair value hierarchy. For a sample of investments, we have tested the detailed classification in levels 1, 2 and 3 in the fair value hierarchy.
IT systems that support financial reporting
Basis for the key audit matter
Norges Bank has a complex and automated IT environment and is dependent on IT processes for reporting financial information. To ensure complete and accurate processing and reporting of financial information, it is important that controls over access management and system changes are designed and operate effectively. Key IT processes are also dependent on a well-functioning control environment at external service providers. IT systems that support financial reporting are considered to be a key audit matter as the IT environment is important to ensure accuracy, completeness and reliable financial reporting.
Our audit response
We obtained an understanding of Norges Bank’s IT systems, IT environment and controls of importance to the financial reporting. We tested IT general controls over access management, system changes and IT operations. Further, we tested automated controls in the IT environment supporting financial reporting.
For relevant IT systems managed by external service providers, we evaluated third-party systems and organizations controls reports (ISAE 3402 reports) for the service provider’s control environment. We further assessed the design and tested the operating effectiveness of Norges Bank’s own controls relating to outsourced services. We have used our own IT specialists in our work to understand the organization’s IT environment as well as in assessing the design of control activities and conducting the testing of the operating effectiveness of controls.
Other information
Other information consists of the information included in the annual report other than the financial statements and our auditor’s report thereon. The Executive Board and the Governor (management) is responsible for the other information. Our opinion on the financial statements does not cover the other information, and we do not express any form of assurance conclusion thereon.
In connection with our audit of the financial statements, our responsibility is to read the other information, and, in doing so, consider whether the board of directors’ report and the statement on corporate social responsibility contain the information required by applicable legal requirements and whether the other information is materially inconsistent with the financial statements or our knowledge obtained in the audit, or otherwise appears to be materially misstated. If, based on the work we have performed, we conclude that the other information is materially inconsistent with the financial statements, there is a material misstatement in this other information or that the information required by applicable legal requirements is not included in the board of directors’ report or the statement on corporate social responsibility, we are required to report that fact.
We have nothing to report in this regard, and in our opinion, the board of directors’ report and the statement on corporate social responsibility are consistent with the financial statements and contain the information required by applicable legal requirements.
Responsibilities of management for the financial statements
Management is responsible for the preparation and fair presentation of the financial statements in accordance with the Regulation concerning annual financial reporting for Norges Bank. The regulation requires the financial statements for Norges Bank to be prepared in accordance with IFRS Accounting Standards as adopted by the EU, with certain specific presentation requirements for the investment portfolio of the Government Pension Fund Global, including subsidiaries being part of the investment portfolio. Management is also responsible for such internal control as it determines necessary to enable the preparation of financial statements that are free from material misstatement, whether due to fraud or error.
In preparing the financial statements, management is responsible for assessing Norges Bank’s ability to continue as a going concern, disclosing, as applicable, matters related to going concern and using the going concern basis of accounting unless management either intends to liquidate Norges Bank or to cease operations, or has no realistic alternative but to do so.
Auditor’s responsibilities for the audit of the financial statements
Our objectives are to obtain reasonable assurance about whether the financial statements as a whole are free from material misstatement, whether due to fraud or error, and to issue an auditor’s report that includes our opinion. Reasonable assurance is a high level of assurance, but is not a guarantee that an audit conducted in accordance with ISAs will always detect a material misstatement when it exists. Misstatements can arise from fraud or error and are considered material if, individually or in the aggregate, they could reasonably be expected to influence the economic decisions of users taken on the basis of these financial statements.
As part of an audit in accordance with ISAs, we exercise professional judgment and maintain professional scepticism throughout the audit. We also:
- Identify and assess the risks of material misstatement of the financial statements, whether due to fraud or error, design and perform audit procedures responsive to those risks, and obtain audit evidence that is sufficient and appropriate to provide a basis for our opinion. The risk of not detecting a material misstatement resulting from fraud is higher than for one resulting from error, as fraud may involve collusion, forgery, intentional omissions, misrepresentations, or the override of internal control.
- Obtain an understanding of internal control relevant to the audit in order to design audit procedures that are appropriate in the circumstances, but not for the purpose of expressing an opinion on the effectiveness of the Norges Bank’s internal control.
- Evaluate the appropriateness of accounting policies used and the reasonableness of accounting estimates and related disclosures made by management.
- Conclude on the appropriateness of management’s use of the going concern basis of accounting and, based on the audit evidence obtained, whether a material uncertainty exists related to events or conditions that may cast significant doubt on Norges Bank’s ability to continue as a going concern. If we conclude that a material uncertainty exists, we are required to draw attention in our auditor’s report to the related disclosures in the financial statements or, if such disclosures are inadequate, to modify our opinion. Our conclusions are based on the audit evidence obtained up to the date of our auditor’s report. However, future events or conditions may cause Norges Bank to cease to continue as a going concern.
- Evaluate the overall presentation, structure and content of the financial statements, including the disclosures, and whether the financial statements represent the underlying transactions and events in a manner that achieves fair presentation.
We communicate with the Executive board regarding, among other matters, the planned scope and timing of the audit and significant audit findings, including any significant deficiencies in internal control that we identify during our audit.
From the matters communicated with the Executive Board, we determine those matters that were of most significance in the audit of the financial statements of the current period and are therefore the key audit matters. We describe these matters in our auditor’s report unless law or regulation precludes public disclosure about the matter or when, in extremely rare circumstances, we determine that a matter should not be communicated in our report because the adverse consequences of doing so would reasonably be expected to outweigh the public interest benefits of such communication.
Oslo, 8 February 2024
ERNST & YOUNG AS
Kjetil Rimstad
State Authorised Public Accountant (Norway)
(This translation from Norwegian has been prepared for information purposes only.)
Independent accountant’s assurance report
To Norges Banks Representantskap
Scope
We have been engaged by Norges Bank to perform a limited assurance engagement, as defined by International Standards on Assurance Engagements, here after referred to as the engagement, to report on Norges Bank sustainability reporting as defined and presented in Norges Bank chapter “Limited assurance of sustainability indicators” in Norges Bank’s Annual report (the “Subject Matter”) as for the year ended 31 December 2023.
Other than as described in the preceding paragraph, which sets out the scope of our engagement, we did not perform assurance procedures on the remaining information included in the Annual report, and accordingly, we do not express a conclusion on this information.
Criteria applied by Norges Bank
In preparing the Subject Matter, Norges Bank applied the relevant criteria from the Global Reporting Initiative (GRI) sustainability reporting standards as well as its own defined published criteria (the “Criteria”). The Criteria can be accessed at globalreporting.org and in the Subject Matter. Such Criteria were specifically designed for companies and other organizations that want to report their sustainability impacts in a consistent and credible way. As a result, the Subject Matter information may not be suitable for another purpose.
Norges Bank’s responsibilities
The management is responsible for selecting the Criteria, and for presenting the Subject Matter in accordance with that Criteria, in all material respects. This responsibility includes establishing and maintaining internal controls, maintaining adequate records and making estimates that are relevant to the preparation of the Subject Matter, such that it is free from material misstatement, whether due to fraud or error.
EY’s responsibilities
Our responsibility is to express a conclusion on the presentation of the Subject Matter based on the evidence we have obtained.
We conducted our engagement in accordance with the International Standard for Assurance Engagements Other Than Audits or Reviews of Historical Financial Information (’ISAE 3000’). This standard requires that we plan and perform our engagement to obtain limited assurance about whether, in all material respects, the Subject Matter is presented in accordance with the Criteria, and to issue a report. The nature, timing, and extent of the procedures selected depend on our judgment, including an assessment of the risk of material misstatement, whether due to fraud or error.
We believe that the evidence obtained is sufficient and appropriate to provide a basis for our limited assurance conclusion.
Our Independence and Quality Control
We are independent of the Company and the Group in accordance with the requirements of the relevant laws and regulations in Norway and the International Ethics Standards Board for Accountants’ International Code of Ethics for Professional Accountants (including International Independence Standards) (IESBA Code), and we have fulfilled our other ethical responsibilities in accordance with these requirements.
EY also applies International Standard on Quality Management 1, Quality Management for Firms that Perform Audits or Reviews of Financial Statements, or Other Assurance or Related Services engagements, which requires that we design, implement and operate a system of quality management including policies or procedures regarding compliance with ethical requirements, professional standards and applicable legal and regulatory requirements.
Description of procedures performed
Procedures performed in a limited assurance engagement vary in nature and timing from, and are less in extent than for, a reasonable assurance engagement. Consequently, the level of assurance obtained in a limited assurance engagement is substantially lower than the assurance that would have been obtained if a reasonable assurance engagement had been performed. Our procedures were designed to obtain a limited level of assurance on which to base our conclusion and do not provide all the evidence that would be required to provide a reasonable level of assurance.
Although we considered the effectiveness of management’s internal controls when determining the nature and extent of our procedures, our assurance engagement was not designed to provide assurance on internal controls. Our procedures did not include testing controls or performing procedures relating to checking aggregation or calculation of data within IT systems.
A limited assurance engagement consists of making enquiries, primarily of persons responsible for preparing the Subject Matter and related information and applying analytical and other appropriate procedures.
Our procedures included:
- Interviews with key personnel to understand the business and the reporting process
- Interviews with key personnel to understand the process for collecting, collating and reporting the Subject Matter during the reporting period
- Test on a sample basis the calculation Criteria against the methodologies outlined in the Criteria
- Analytical review procedures of the data
- Comparison, on a sample basis, of data with the underlying source information
- Comparison of the presentation of the Subject Matter with the presentation requirements outlined in the Criteria.
We believe that our procedures provide us with an adequate basis for our conclusion. We also performed such other procedures as we considered necessary in the circumstances.
Conclusion
Based on our procedures and the evidence obtained, we are not aware of any material modifications that should be made to the Subject Matter as for the year then ended in order for it to be in accordance with the Criteria.
Oslo, 8 February 2024
ERNST & YOUNG AS
This translation from Norwegian has been made for information purposes only
Kjetil Rimstad
State Authorised Public Accountant
Information in accordance with the recommendations of the Task Force on Climate-Related Financial Disclosures (TCFD)
The Task Force on Climate-Related Financial Disclosures (TCFD) has drawn up a framework for climate risk reporting. Norges Bank supports the intention of the recommendations and considers that the framework will promote more universal and consistent reporting across jurisdictions. The recommendations specify the information that should be disclosed within four areas: governance, strategy, risk management and metrics and targets.
The table provides an overview of Norges Bank’s status for 2023 for Central Banking in accordance with the recommendations in the TCFD framework. See the section Work on climate and climate risk in Central Banking for more detailed information. See the report Responsible investment Government Pension Fund Global for information on TCFD and the Government Pension Fund Global.
Resolution of the Supervisory Council on the financial statements for 2023
Norges Bank´s Supervisory Council adopted the following decision at its meeting 22 February 2024:
- The Supervisory Council takes note of the Annual Report of the Executive Board for 2023.
- The Supervisory Council takes note of the auditor´s report for Norges Bank and independent accountant´s assurance report.
- The Supervisory Council approves Norges Bank´s financial statements for 2023.
- In accordance with the guidelines, the net profit of NOK 70.0 billion is to be transferred as follows: NOK 33.4 billion to the Adjustment Fund and NOK 36.6 billion to the Transfer Fund. From the Transfer Fund, one-third, or NOK 17.6 billion, will be transferred to the Treasury.
The Supervisory Council’s statements on the minutes of the meeting of the Executive Board and its supervision of the Bank
Under the Norges Bank Act, the Supervisory Council submits a separate report to the Storting concerning its supervision of the Bank. The report for 2023 will be adopted by the Supervisory Council on 22 March 2024 and published upon submission to the Storting.