
At its meeting on 20 March, Norges Bank’s Monetary Policy and Financial Stability Committee decided to keep the policy rate unchanged at 4.5 percent. Based on the Committee’s current assessment of the outlook and balance of risks, the policy rate will likely be kept at that level for some time ahead.
Lower international inflation
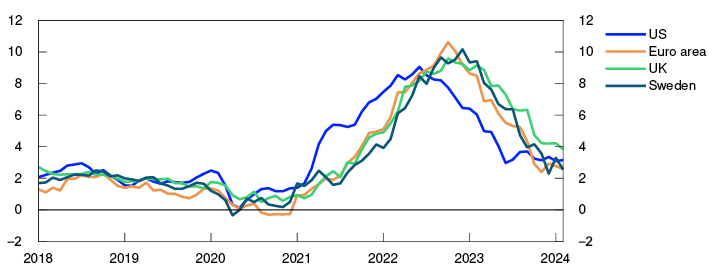
Consumer price inflation among Norway’s main trading partners slowed through 2023 but is still higher than central banks’ 2% target. Goods inflation has continued to fall since the December Report, while services inflation has remained elevated. Underlying inflation among trading partners has slowed broadly in line with projections. Gas and electricity prices have also declined, and futures prices are lower than in December. Oil prices, on the other hand, have risen since the December Report. Tensions in the Red Sea have led to an increase in freight rates for shipping goods from Asia to Europe, but rates are still appreciably lower than in the wake of the pandemic.
Overall economic growth among trading partners was low in 2023, and economic pressures receded. In 2023 Q4, activity was slightly higher than projected in the December Report. The US economy experienced strong growth, while growth was close to zero among a host of Norway’s European trading partners. Unemployment has remained low.
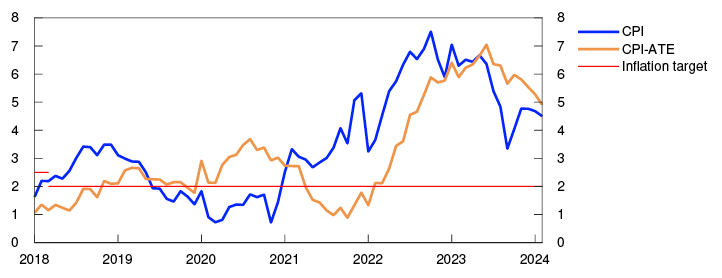
Consumer prices. Twelve-month change. Percent
Higher policy rate expectations and a stronger krone
Central banks among Norway’s main trading partners have held policy rates steady since December. The market expects the first policy rate cuts to occur somewhat later than anticipated earlier. Market pricing now indicates that central banks will begin lowering rates this summer. Long-term government bond yields have shown little change since the December Report, while equity indexes have increased in many countries.
Policy rate expectations in Norway have risen since December. Market pricing now indicates that the policy rate will be lowered in the course of autumn. Market interest rates have risen more in Norway than abroad. The krone has appreciated more than projected. Norwegian money market premiums have fallen and are lower than projected.
Import-weighted exchange rate index. I-44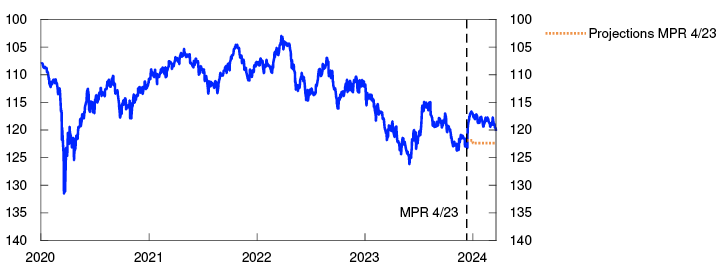
Less pressure in the Norwegian economy
Growth in the Norwegian economy is low. Economic growth slowed through 2023, reflecting a decline in household consumption and a sharp fall in housing investment. Mainland GDP has been stronger than projected in the December Report. Household consumption and public demand have both been higher than expected. On the other hand, housing investment has shown a steep fall and been lower than expected.
GDP for mainland Norway. Three-month moving average. Percent
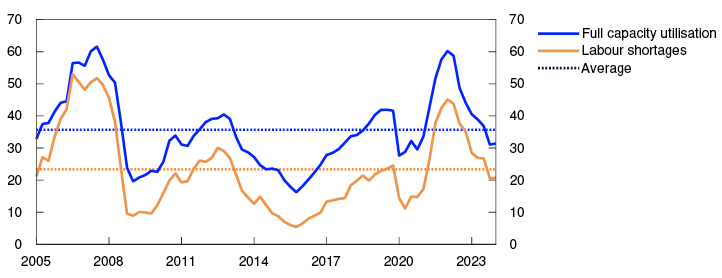
Pressures in the Norwegian economy have receded, and overall output is now likely close to potential. After having risen to a high level after the pandemic, the employment rate has edged down over the past year but the level of employment has been higher than projected in the December Report. Unemployment has ticked up slightly over the past year. Registered unemployment remained unchanged at 1.9% in February. The Labour Force Survey indicator has been weaker in recent months than other labour market indicators. Norges Bank’s Regional Network contacts report that recruitment difficulties have gradually diminished over the past two years. The share of enterprises reporting labour shortages as a constraint on production showed little change between Q4 and Q1.
Capacity utilisation and labour shortages according to the Regional Network. Percentage shares
Overall, Regional Network enterprises expect activity to remain broadly unchanged in the period to summer, but there are wide differences across industries. Vigorous investment in the petroleum industry is still underpinning growth in the oil services industry, and service industries expect activity to increase ahead. Both retail trade and the construction industry expect a further fall in activity in Q2, but a rising number of retail enterprises now signal slightly improved prospects. New home sales are still at a very low level. In the secondary market, house prices have risen and been higher than projected. The stock of unsold homes has declined but is still higher than a historical average.
In the projections, growth in the Norwegian economy is low through the first half of 2024, but activity appears to be slightly higher than projected in the December Report. Growth in household consumption remains weak through the latter half of the year, before picking up over summer. New home sales gradually pick up, and housing investment shows a renewed rise in the latter half of the year. Strong petroleum investment, a further rise in exports and high public demand contribute to sustaining activity in the Norwegian economy in 2024. Total output is expected to fall to somewhat below potential.
Inflation remains high
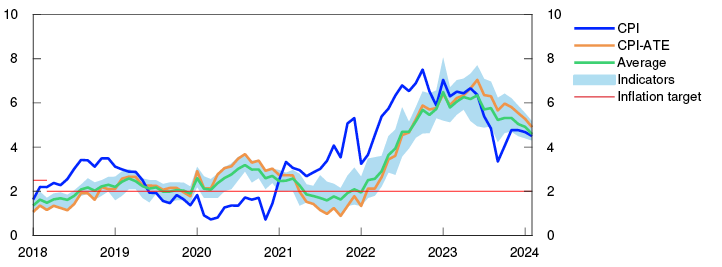
Inflation has slowed further since the December Report but is still high. In February, the 12-month rise in the overall consumer price index (CPI) was 4.5%, lower than projected. The average of different indicators of underlying inflation fell further between January and February. The 12-month rise in the CPI adjusted for tax changes and excluding energy products (CPI-ATE) was 4.9% in February, also lower than projected. Goods inflation has slowed, while services inflation has remained elevated in recent months.
Price inflation appears to be lower in 2024 than projected earlier, partly reflecting somewhat weaker international price impulses to Norwegian consumer goods. In addition, a stronger-than-projected krone and lower energy prices will push down inflation ahead.
Wage growth increased to 5.2% in 2023, lower than projected. Norges Bank’s Regional Network and Expectations Survey both indicate higher wage expectations for 2024, and the social partners expect average wage growth of around 5%. In the projections in this Report, annual wage growth is put at 4.9% in 2024.
According to the Expectations Survey, long-term inflation expectations are still higher than the inflation target of 2%, and expectations increased a little in Q1.
CPI and CPI-ATE. Twelve-month change. Percent
Unchanged policy rate at 4.5%
The objective of monetary policy is annual consumer price inflation of close to 2% over time. Inflation targeting shall be forward-looking and flexible so that it can contribute to high and stable output and employment and to counteracting the build-up of financial imbalances.
The Committee assesses that the policy rate needs to be maintained at the current level for some time ahead in order to bring inflation back to target within a reasonable time horizon. Monetary policy is having a tightening effect, and growth in the Norwegian economy is low. Price inflation is slowing but is still markedly above target. Business costs have increased sharply over the past years, and high wage growth and the krone depreciation last year will contribute to keeping inflation elevated ahead.
Since the December Report, activity in the Norwegian economy has been higher than projected, and price inflation has been lower than projected. In its assessment of the interest rate outlook, the Committee was concerned with the possibility that if the policy rate is lowered prematurely, inflation could remain high, among other things, because the krone might then weaken. On the other hand, an overly tight monetary policy could restrain the economy more than needed. The Committee judges that a policy rate path broadly consistent with the forecast in the previous Report provides a reasonable trade-off between the objectives of monetary policy.
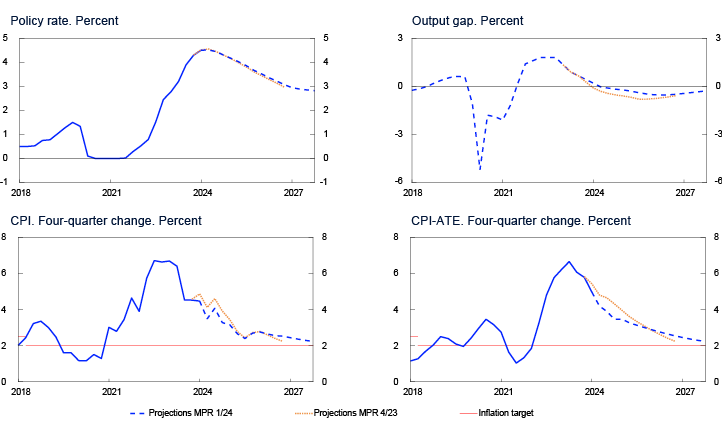
The forecast in this Report indicates that the policy rate will continue to lie at 4.5 percent in the period to autumn before gradually moving down. Economic growth is projected to remain low through the first half of 2024 before picking up. Unemployment will likely edge up, but a little less than anticipated in December. Inflation is projected to slow somewhat faster in 2024 than projected earlier and to approach 2% towards the end of 2027.
There is uncertainty about future developments in the Norwegian economy. In its discussion of the balance of risks, the Committee was concerned with the wide differences across industries, and their effect on the economic outlook. If cost inflation remains elevated or the krone turns out to be weaker than projected, inflation may remain high for longer than currently projected. In that case, the Committee is prepared to raise the policy rate again. If there is a more pronounced slowdown in the Norwegian economy or inflation declines more rapidly, the policy rate may be lowered earlier than currently envisaged.
The Committee decided unanimously to keep the policy rate unchanged at 4.5%. Based on the Committee’s current assessment of the outlook and balance of risks, the policy rate will likely be kept at that level for some time ahead.
Ida Wolden Bache
Pål Longva
Øystein Børsum
Ingvild Almås
Steinar Holden
20 March 2024
- 1 Period: January 2018 – February 2024
- 2 Period: 1 January 2020 – 19 March 2024. A higher I-44 index indicates a weaker krone exchange rate. The scales are inverted.
- 3 Period: January 2022 – January 2024.
- 4 Period: 2005 Q1 – 2024 Q1. Share of contacts that will face some or considerable difficulty meeting increased demand and share of contacts citing labour shortages as a constraint on production. The question about labour shortages is asked only of the enterprises reporting full capacity utilisation, but the series shows the share of all contacts included in the interview period.
- 5 Period: January 2018 – February 2024. CPI-ATE: CPI adjusted for tax changes and excluding energy products.
- 6 Period: 2018 Q1 – 2027 Q4. Projections from 2023 Q4 for MPR 4/23 and 2024 Q1 for MPR 1/24 for the policy rate, the CPI and the CPI-ATE. The output gap measures the percentage deviation between mainland GDP and estimated potential mainland GDP. CPI-ATE: the CPI adjusted for tax changes and excluding energy products.
1. The global economy
Consumer price inflation among Norway’s trading partners has slowed markedly after peaking, and underlying inflation is projected to slow further. In 2023, overall GDP growth among trading partners was sluggish but is projected to pick up in the course of 2024. Policy rate expectations among trading partners are slightly higher than in December, while long-term interest rates are little changed.
Core inflation expected to decline further
After peaking at the end of 2022, headline inflation has fallen considerably among all of Norway’s main trading partners but has shown little change in recent months. In February, headline inflation was 2.6% in the euro area and 3.2% in the US.
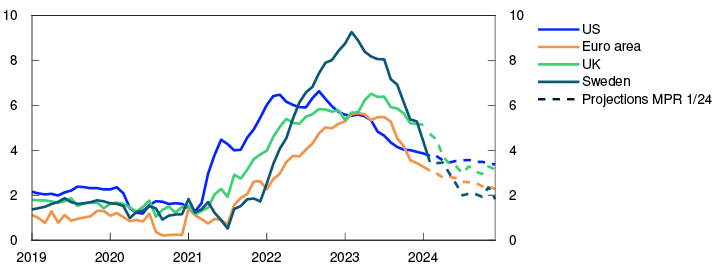
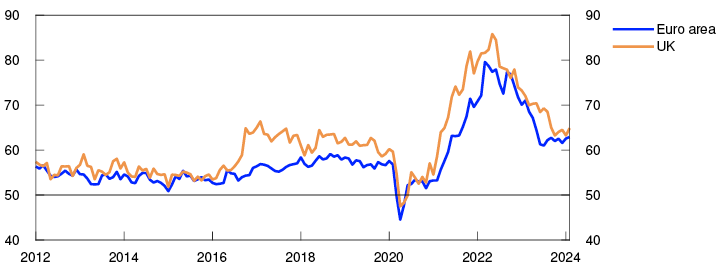
Core inflation has continued to decline in recent months, particularly in Europe. Twelve-month inflation has moved down to 3.1% in the euro area and to 3.8% in the US, while UK inflation is somewhat higher (Chart 1.1). Overall, underlying inflation among Norway’s main trading partners has been broadly as projected in the December 2023 Monetary Policy Report.
Core inflation. Twelve-month change. Percent
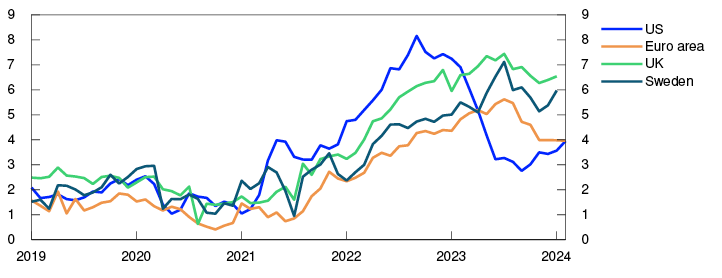
Goods inflation is well on its way down, while services inflation has remained elevated in a number of countries (Chart 1.2). In the US, the rise in rental prices is a main driver of inflation, but the rise in prices for other services has also accelerated recently. In Europe, indicators of the rise in input prices in the services sector are still above pre-pandemic levels and have edged up in recent months (Chart 1.3). Together with high wage growth and weak productivity growth, this suggests that services inflation will likely remain elevated in the near term.
Consumer prices. Services. Twelve-month change. Percent
PMI services. Input prices
Wage growth and price inflation are expected to gradually drift down in the years ahead on the back of lower capacity utilisation. In the coming years, wage growth will likely remain above the average for the decade preceding the pandemic, partly owing to continued low unemployment. Wage growth among Norway’s main trading partners is projected to decline from 4.9% in 2023 to 4% in 2024. Long-term market inflation expectations have shown little change since the December Report and are close to both US and euro area inflation targets. Overall underlying inflation among Norway’s main trading partners is projected to slow from 5.3% in 2023 to 3% in 2024 and to slightly above 2% in 2026. The projections for wage growth and price inflation are little changed since the December Report (see Annex Table 1).
Policy rate expectations abroad have risen slightly
Central banks among Norway’s main trading partner countries have kept policy rates on hold over the past six months. Several central banks have communicated that it will not be appropriate to lower policy rates until they are more confident that inflation is under control.
Market policy rate expectations indicate that the first policy rate cuts abroad will take place this summer. Compared with the December Report, policy rate expectations among Norway’s trading partners are slightly higher, pushing market expectations of the first policy rate cut somewhat further out in time (Chart 1.4). This reflects strong key figures, particularly in the US, and that the decline in inflation appears to be slightly slower than markets previously expected. Long-term government bond yields are little changed since December.
Policy rates and estimated forward rates. Percent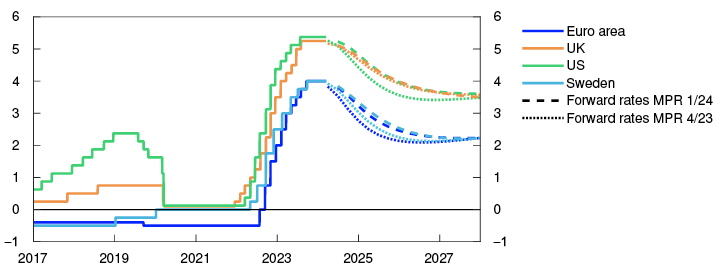
Equity indexes among main trading partner countries have risen since the December Report, at the same time as corporate bond risk premiums have fallen further.
Growth abroad projected to pick up
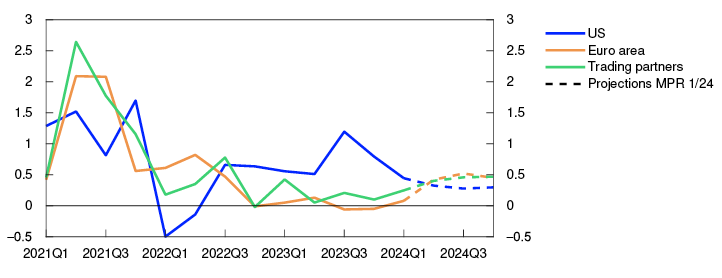
Output among Norway’s main trading partner countries appears to be slightly below potential, but unemployment remains low. After remaining weak through 2023, GDP growth is expected to pick up in the course of 2024 (Chart 1.5).
GDP. Quarterly change. Percent
Sources: LSEG Datastream and Norges Bank
For trading partners as a whole, GDP growth in 2023 Q4 was slightly higher than projected in the December Report. Among Norway’s main trading partners, GDP growth was strongest in the US and China. Activity showed little change in the euro area and Sweden and fell slightly in the UK.
In the US, low household saving, disinflation, fiscal stimulus and solid productivity growth have contributed to much higher GDP growth than in Europe. In addition, the high proportion of long-term fixed-rate loans has shielded many US households against increases in residential mortgage rates. Activity indicators point to slowing growth at the beginning of 2024, and household saving is expected to pick up, which will likely pull down GDP growth in 2024.
In Europe, high inflation and rising interest rates weighed on household purchasing power and consumption in 2023. Higher real wages will likely boost household purchasing power in 2024. In addition, lower European gas prices will contribute to lifting activity somewhat in 2024. Energy and commodity price developments are discussed further on «Decline in gas and electricity prices».
Commodity prices are assumed to move in line with futures prices. The Bank’s projections of policy rates are based on market policy rate expectations. Higher defence spending and energy investment in Europe are likely to boost activity over the projection horizon. Growth in China is expected to slow in the coming years on the back of a weak real estate market, low demand for Chinese goods and high debt levels facing the local government sector, real estate companies and state-owned firms. Trading partner GDP growth is projected to rise from 1% in 2023 to 1.1% in 2024 and to 1.8% in 2025 and 2026. On balance, the projections are little changed from the December Report.
Uncertainty surrounding the economic outlook
There is still uncertainty related to the response of households and firms to both substantial price increases and the rapid rise in interest rates that are now behind us. If wage earners are compensated for the high level of inflation to a larger extent than expected, or if inflation expectations were to rise, wage growth and price inflation could prove higher than currently projected. To bring inflation down to target, central banks may have to keep their policy rates elevated for longer than currently assumed. The ongoing wars in some parts of the world also add to the uncertainty about international developments ahead.
- 1 Period: January 2019 – December 2024. Projections from February for the UK and from March for the rest. Core CPI is consumer prices excluding energy and food products for the US. For the euro area and the UK, energy, food products, tobacco and alcohol are excluded, and for Sweden, energy prices are excluded.
- 2 Period: January 2019 – February 2024. Data up to January for the UK and Sweden. Consumer prices for services exclude owner-occupiers’ estimated housing costs.
- 3 Period: January 2012 – February 2024. Survey among purchasing managers. Diffusion index around 50.
- 4 Period: 1 January 2017 – 31 December 2027. Daily data through 15 March 2024. Quarterly data from 2024 Q1 for MPR 4/23 and 2024 Q2 for MPR 1/24. Estimated forward rates at 11 December 2023 for MPR 4/23 and at 15 March for MPR 1/24. For the euro area, ECB’s deposit facility rate is shown.
- 5 Period: 2021 Q1 – 2024 Q4. Projections from 2024 Q1 for MPR 1/24. Export weights. Five trading partners.
Decline in gas and electricity prices
Prices for gas, carbon allowances and electricity have fallen since December, while oil prices have risen. After peaking in 2022, energy prices have decreased considerably but may remain high compared with the period 2010–2019. Recently, the rise in the index of prices for imported intermediate goods has slowed and been negative and is expected to decline somewhat further before edging up again towards the end of 2024. The index of external price impulses to imported consumer goods (IPK) has also declined further and is expected to remain low through 2024.
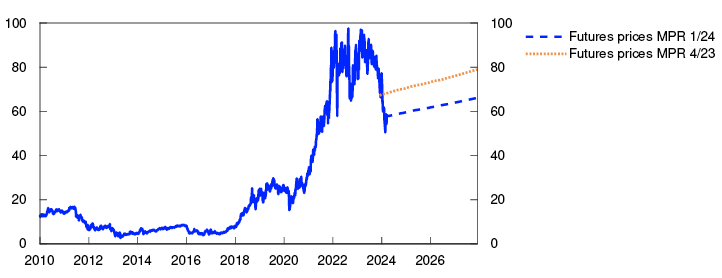
Oil prices have risen since the December Report, and futures prices have also risen somewhat, on the back of an extension of additional OPEC+ cuts to underpin prices. The war in Gaza and attacks on vessels in the Red Sea, with the risk of escalation to a wider conflict in the Middle East, have also contributed to the rise. Futures prices indicate that oil prices will edge down ahead (Table 1.A).
Prices for gas, carbon allowances and electricity have decreased considerably since December.1 Futures prices have also fallen. Mild weather, energy saving and weak performance in energy-intensive manufacturing industries have dampened demand. The supply of liquified natural gas (LNG) to Europe has been ample, and renewable energy and nuclear power production have increased. The decline in carbon allowance prices was also accelerated by the EU emissions trading system (ETS) increasing the supply of carbon allowances to finance the energy transition (Chart 1.A).
USD/tonne
In general, energy prices have come down considerably since peaking in 2022. OPEC+ countries increased production when prices rose sharply and have subsequently cut production to stabilise oil prices around current levels. LNG imports have risen markedly in response to the reduced flow of Russian pipeline gas to Europe. The reduction in French nuclear power production in 2022 has largely been reversed and high precipitation has increased hydroelectric power production. In addition, extensive energy-saving measures have been implemented in Europe, and the pace of wind and solar power development has accelerated.
At the same time, the decline in energy prices through 2023 and into 2024 reflects two mild winters. Weak global economic growth has also restrained the rise in energy consumption. The fall in carbon allowance prices since summer 2023 may be reversed if the EU once again limits the supply of ETS allowances to ensure sufficient emission reductions.
Energy futures indicate lower prices than observed in recent years. Weaker growth in global oil consumption related to the climate and energy transition may weigh on oil prices over time. Gas and electricity futures prices have declined owing to an expected increase in the global supply of LNG in the second half of this decade. Nevertheless, futures prices indicate levels that are still higher than in the ten-year period 2010–2019. The shift from fossil-based to renewable energy systems is proceeding at a slow pace. A large portion of energy consumption needs to be electrified, and electricity production needs to become emission free. Necessary investment in new energy production and greenhouse gas emission reductions probably mean that energy prices may remain high over a transition period. At the same time, energy prices will likely be more volatile, partly owing to more weather-dependent energy production without sufficient development of storage options, such as batteries and hydrogen, and well-developed demand flexibility, and partly owing to persistent geopolitical uncertainty related to fossil fuel-based production.
Metal prices are also well below previous peak levels, reflecting weak economic activity in major advanced economies, challenges in China’s housing sector and the reversal of supply disruptions for some metals. A fall in energy prices has also driven down production costs for energy-intensive metals. Futures prices indicate a modest rise ahead. An increased need for metals in the energy transition will underpin prices.
Oil, aluminium and steel prices are important for developments in imported intermediate prices. Since the December Report, Norges Bank’s indicator of international price impulses to intermediate goods (the IPI) has been lower than expected (Chart 1.B). The decline has been broad-based across subcomponents. The IPI is expected to decline somewhat more through 2024, before rising and remaining close to its historical average. The downward adjustment reflects both a lower index and somewhat lower futures prices for a number of key commodities.
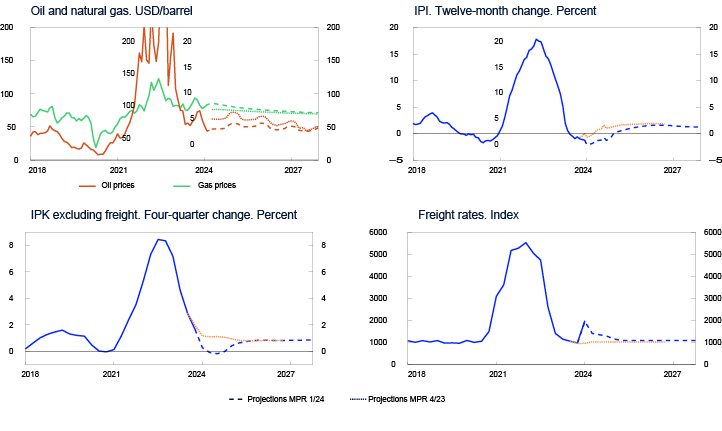

Norges Bank’s index of external price impulses to imported consumer goods (IPK) excluding freight rates has also been slightly lower than assumed in the December Report. Even though the IPK captures prices at the later stages of the value chain than the IPI, it is also affected by commodity price developments. For example, lower food prices (Table 1.A) slow the rise in the IPK. In addition, energy prices are important for many producer prices included in the IPK. Weaker price impulses from imported consumer goods are expected ahead than in the December Report.
Table 1.A Energy prices
|
Percentage change from projections in Monetary Policy Report 4/23 in brackets |
Average price (2010–2019) |
Actual prices and futures prices1 |
|||||
|---|---|---|---|---|---|---|---|
|
2022 |
2023 |
2024 |
2025 |
2026 |
2027 |
||
|
Oil, USD/barrel |
80 |
101 |
83 |
83 (9) |
78 (6) |
74 (4) |
72 (3) |
|
Dutch gas, USD/barrel |
40 |
205 |
70 |
48 (-24) |
52 (-19) |
49 (-14) |
46 (-8) |
|
Petroleum2, USD/barrel |
63 |
163 |
77 |
65 (-7) |
67 (-3) |
63 (-3) |
60 (-1) |
|
Coal, EUR/tonne |
66 |
290 |
118 |
98 (-3) |
100 (-3) |
102 (1) |
101 (-1) |
|
Carbon allowance prices, EUR/tonne |
10 |
81 |
84 |
59 (-15) |
61 (-16) |
63 (-16) |
66 (-16) |
|
German electricity, øre/kWh |
36 |
258 |
116 |
79 (-27) |
91 (-18) |
82 (-22) |
74 (-25) |
|
Nordic electricity, øre/kWh |
32 |
142 |
66 |
50 (-13) |
45 (-11) |
44 (-12) |
47 (-8) |
|
Electricity in South Norway, øre/kWh |
31 |
206 |
84 |
62 (-22) |
59 (-16) |
57 (-19) |
60 (-) |
|
Electricity in Northern Norway and Central Norway, øre/kWh |
32 |
38 |
43 |
37 (9) |
32 (3) |
31 (-14) |
34 (-) |
|
Aluminium, in thousands of USD/tonne |
2 |
2.7 |
2 |
2.3 (5) |
2.4 (5) |
2.5 (5) |
2.6 (4) |
|
Copper, in thousands of USD/tonne |
7 |
8.8 |
9 |
8.9 (6) |
9.2 (7) |
9.1 (5) |
9.1 (3) |
|
Steel, in thousands of USD/tonne |
0.5 |
0.7 |
1 |
0.6 (-4) |
0.6 (-2) |
- |
- |
|
Wheat, USD/tonne |
210 |
202 |
331 |
207 (-10) |
228 (-6) |
234 (-2) |
- |
|
Maize, USD/tonne |
183 |
143 |
271 |
176 (-11) |
192 (-6) |
192 (-5) |
- |
Since December, freight rates for routes between Asia and Europe have increased, primarily due to tensions in the Red Sea, which are pushing up freight rates and increasing delivery times. In recent weeks, freight rates ceased to increase, and the increase has been more moderate than in 2021 and 2022. The risk of a surge in freight rates ahead is likely smaller given lower growth in international trade and improved container capacity. The increase in freight rates is more than offset by the decline in global input price inflation and consumer price inflation.
- 1 There are a number of common demand-side factors for gas, carbon allowance and electricity prices. Moreover, electricity prices are often determined by the cost of gas production (and at times coal-based power production) where emission prices play an important role together with gas prices. At the same time, gas consumption in the energy sector is affected by the production of renewable energy. Electricity prices in Norway, in addition to being affected by energy prices in Norway’s neighbouring countries, are also dependent on hydrological conditions, such as water reservoir levels and snow conditions in the mountains, as well as precipitation, temperature and wind conditions.
- 2 Period: January 2010 – December 2027
- 3 Period: January 2018 – December 2027. For oil and gas prices, projections for MPR 1/24 and MPR 4/23 are futures prices. International price impulses to intermediate goods (the IPI). External price impulses to imported consumer goods (IPK).
2. Financial conditions
Market interest rates have increased, indicating expectations of a slower decline in the policy rate than at the time of the December Report. This has led to a tightening of financial conditions. The average residential mortgage rate is projected to rise to 5.7% this year before gradually declining. The krone exchange rate is stronger than projected in the December Report and is expected to remain broadly unchanged ahead.
The market expects the policy rate to remain high for longer
Market policy rate expectations increased after the policy rate was raised to 4.5% in December, and has continued to increase this year, which must also be seen against the background of the increase in policy rate expectations among Norway’s main trading partners. Market policy rate expectations for the coming years are close to the policy rate forecast in this Report.
Residential mortgage rates edge higher in the period to summer
The average interest rate on all outstanding floating- and fixed-rate mortgages was 5.5% at end-January, or 0.2 percentage point higher than three months earlier. In the period to summer, mortgage rates are expected to edge higher to 5.7%, as it takes time for the past policy rate rise to pass through fully. Mortgage rates are expected to move down gradually again later in the projection period (Chart 2.1).
Interest rates. Percent
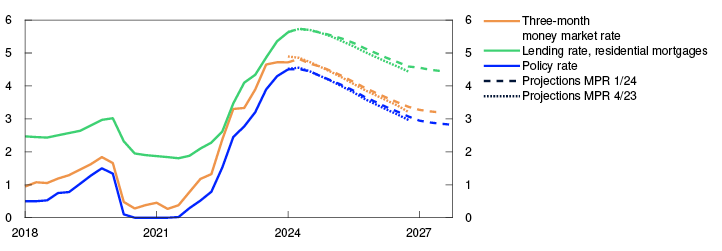
The average deposit rate has increased markedly less than the policy rate since autumn 2021, but since autumn 2023 the deposit rate and policy rate have moved more closely in tandem. In January, the average deposit rate stood at 2.9%, and is now projected to increase further and somewhat faster than the mortgage rate. Banks’ interest rate spread is now wider than the historical average but is projected to fall gradually later in the projection period.
Little change in corporate lending rates
The interest rate on new floating-rate corporate loans was 6.5% in January, measured as a weighted average of bank and bond debt, ie broadly unchanged compared with the rate three months earlier (Chart 2.2).
Interest rate on new floating-rate loans for non-financial corporates. Percent
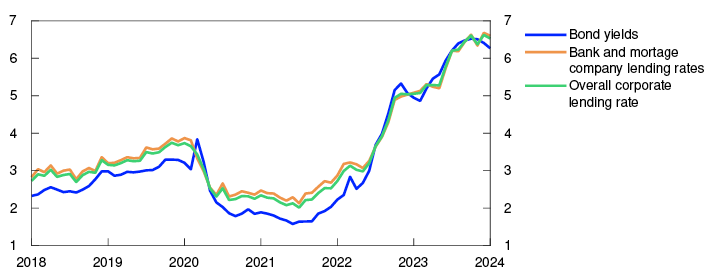
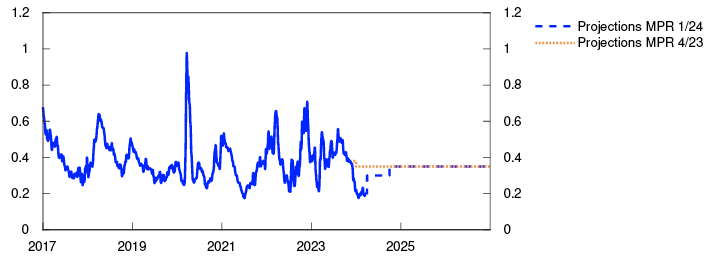
The interest rate on corporate bank loans is based on three-month Nibor, which has increased a little since the December Report. A higher expected policy rate has pushed up Nibor, but this has been counteracted by a fall in the risk premium above the expected policy rate. So far in 2024 Q1, the premium has been around 0.2 percentage point, which is markedly lower than its past 10-year average. Nibor is linked to USD interest rates, and the fall in the Nibor premium since December likely reflects lower US money market premiums. The Nibor premium is now projected to move up gradually towards 0.35 percentage point (Chart 2.3). The projections are close to the market’s pricing of forward premiums.
Money market premium. Percentage points
Sources: Bloomberg and Norges Bank
Firms pay a margin over Nibor, which partly reflects firms’ idiosyncratic credit risk. The average margin on new bank loans has edged up since last autumn and was at about the same level as before the interest rate tightening cycle started in autumn 2021. The risk premium on corporate bond issues has edged down since the December Report. The premium on bonds issued by commercial real estate (CRE) firms has shown the largest decline, but the excess premium relative to other sectors, such as manufacturing and banks, is still considerably higher than it was in autumn 2021. For manufacturing, banks and mortgage companies, bond premiums have shown little change since the December Report.
The interest rate rise will not affect firms with fixed-rate loans until refinancing occurs. New corporate loans are priced based on swap rates with the corresponding tenor. Swap rates have risen since the December Report, partly reflecting a general increase in long-term interest rates internationally while Norwegian rates have risen somewhat more. The ten-year swap rate differential between Norway and its main trading partners has widened by a good 0.2 percentage point since the December Report.
The Oslo Børs Benchmark Index has shown little change since the December Report. The energy sector has fallen by more than 10%, despite the rise in oil prices in the same period. This may, among other things, be attributable to profit risk relating to renewable energy projects.
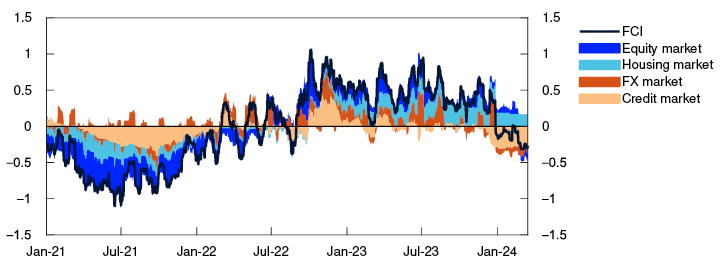
Since the December Report, the increase in policy rate expectations has contributed to tighter financial conditions. On the other hand, other financial conditions facing households, banks and other firms have loosened, as reflected in Norges Bank’s Financial Conditions Index (FCI) (Chart 2.4). The index now shows that other financial conditions are somewhat looser than the historical average, while they were somewhat tighter in the December Report. The decline in the FCI primarily reflects the fall in the Nibor premium.
Financial Conditions Index. Standard deviation from mean
Lower credit growth, but still ample access to credit
Twelve-month growth in credit to households and corporates has slowed further since the December Report and is appreciably lower than their historical averages. Slower household credit growth likely reflects reduced credit demand owing to higher interest rates and sagging new home sales, while slower growth in credit to non-financial corporates is probably ascribable to lower business investment.
According to Norges Bank’s bank lending survey, banks’ credit standards remained unchanged in 2023 Q4 and were expected to remain unchanged in 2024 Q1. Banks’ credit standards for the CRE sector remain stricter in terms of required equity capital and debt-servicing capacity for new loans than they were a year and a half ago. Overall, creditworthy households and firms appear to still have ample access to credit.
The krone has strengthened
The krone has appreciated against most trading partner currencies since the December Report. Most of the appreciation occurred directly following the monetary policy meeting in December. The rate hike to 4.5% led to an increase in Norwegian interest rates at the same time as interest rates among trading partners moved down. So far in Q1, the krone has depreciated somewhat again, but measured by the import-weighted index I-44 is still appreciably stronger than before the publication of the December Report. So far in Q1, the krone exchange rate is on average 3.3% stronger than projected in the December Report.
The policy rate forecast in this Report is close to market expectations. Over the next few years, the krone exchange rate is projected to remain close to the level obtaining at the time of publication of this Report (Chart 2.5). This implies some appreciation of the real krone exchange rate as inflation in Norway is projected to be somewhat higher than among trading partners over the next few years.
Import-weighted exchange rate index. (I-44)
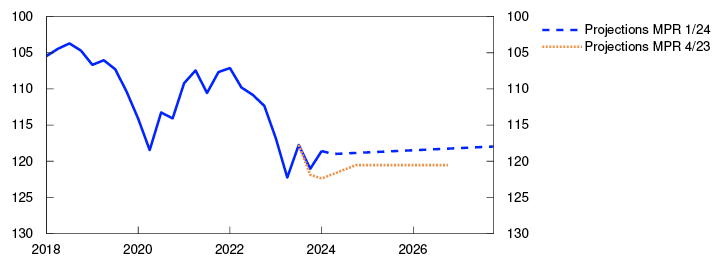
There is considerable uncertainty surrounding the projections for the krone exchange rate. Both changes in the expected interest rate differential against trading partners and shifting risk premia in the foreign exchange market may result in a different krone exchange rate path than assumed in this Report.
- 1 Period: 2018 Q1 – 2027 Q4. Projections from 2023 Q4 for MPR 4/23 and from 2024 Q1 for MPR 1/24. The residential mortgage rate is the average rate on outstanding mortgage loans to households from the sample of banks and mortgage companies included in Statistics Norway’s monthly interest rate statistics.
- 2 Period: January 2018 – January 2024.
- 3 Period: 1 January 2017 – 31 December 2026. Five-day moving average. Latest observation on 15 March 2024. Projections from 2023 Q4 for MPR 4/23 and 2024 Q1 for MPR 1/24. The premium in the Norwegian money market rate is the difference between the three-month money market rate and the expected policy rate.
- 4 Period: 1 January 2021 – 15 March 2024. The Financial Conditions Index (FCI) provides an overall picture of the price and availability of different types of financing beyond that indicated by the policy rate and policy rate expectations further out. The FCI provides an indication of how tight or how loose financial conditions are, compared with the average from 3 January 2003 – 15 March 2024. For more on the Norwegian FCI, see Monetary Policy Report 4/2022 and Bowe, F., K. R. Gerdrup, N. Maffei-Faccioli and H. Olsen (2023): “A high-frequency financial conditions index for Norway”, Norges Bank Staff Memo 1/2023.
- 5 Period: 2018 Q1 – 2027 Q4. Projections from 2023 Q4 for MPR 4/23 and 2024 Q1 for MPR 1/24. A higher index value for I-44 denotes a weaker krone exchange rate. Scales are inverted.
3. The Norwegian economy
Inflation is markedly above the target of 2%. Registered unemployment is low but has risen slightly since 2023. The employment-to-population ratio is high.
The interest rate rise is dampening activity in the Norwegian economy and, together with weaker international price impulses and lower energy prices, will contribute to pushing down inflation, with inflation expected to approach the target somewhat further out. At the same time, the krone depreciation last year and continued strong wage growth are restraining disinflation. Unemployment is expected to edge up somewhat.
3.1 Output and demand
Weak mainland economic growth
The Norwegian economy is assessed to have reached a cyclical peak towards end-2022, with growth slowing thereafter. Norwegian mainland GDP increased by 1.1% in 2023 and by 0.2% in 2023 Q4, which was slightly stronger than projected in the December 2023 Monetary Policy Report.
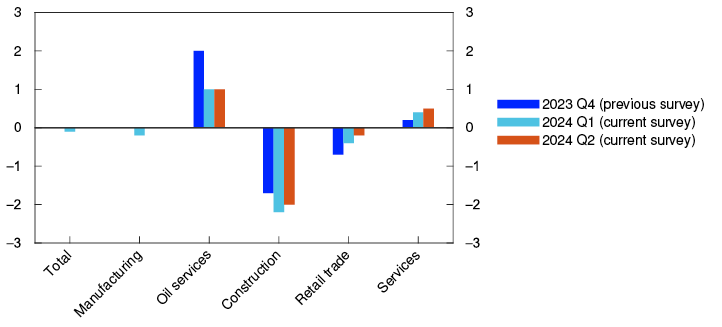
Overall, Norges Bank’s Regional Network contacts expect activity to hold steady in the period to summer (Chart 3.1), but there are still wide differences across industries. The decline in construction activity is expected to continue, reflecting weak new home sales. Activity in oil services is still high, but is expected to slacken as many companies are already operating at close to full capacity.
Expected output growth according to the Regional Network. Seasonally adjusted. Percent
Source: Norges Bank
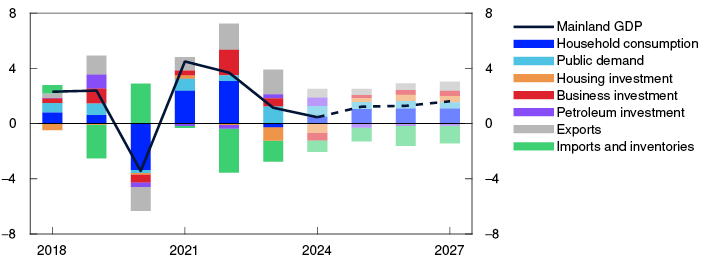
The interest rate rise and high inflation have dampened demand in the Norwegian economy. In the projections, housing investment continues to fall in 2024. Household consumption will likely rise this year, after declining in 2023. The cost competitiveness of the Norwegian business sector has improved on the back of the krone depreciation, but export growth likely edges down from the levels seen in 2023. Strong activity in petroleum-related industries and high public demand boost activity in 2024. In line with the Regional Network survey and the Bank’s System for Model Analysis in Real Time (SMART), economic activity remains unchanged in the period to summer. Growth picks up thereafter. Annual mainland GDP growth is put at 0.5% in 2024 (Chart 3.2). Growth picks up gradually further out in the projection period, primarily owing to higher private consumption. Higher public demand also lifts activity. The projection for annual growth for mainland GDP has been revised up slightly for 2024, but only minor revisions to the December projections have been made for the following years.
GDP for mainland Norway. Annual change. Contribution to annual change. Percentage points
Consumption likely to pick up in 2024 H2
Household consumption fell by 0.5% in 2023, mostly early in the year. Particularly high electricity and fuel consumption owing to cold weather towards the end of 2023 contributed to stronger overall consumption growth than projected in the December Report (Chart 3.3). Goods consumption fell in January and card transaction data indicate a further decline in February. Services consumption remained steady between Q3 and Q4 and continued to do so in January and February according to card transaction data.
Household consumption of goods and services. Constant 2021 prices. Seasonally adjusted. In billions of NOK
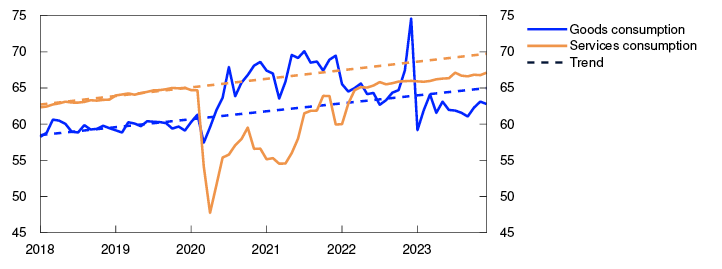
Sources: Statistics Norway and Norges Bank
The decline in real wages and higher interest rates led to a fall in household real disposable income in 2023. From 2024, purchasing power is expected to rebound on the back of positive real wage growth and lower interest rates further out. Higher expected employment will also improve total household purchasing power.
Consumption is expected to remain broadly unchanged in the period to summer before rising through autumn. The projection for 2024 has been revised up since the December Report, reflecting slightly stronger-than-expected developments. The upward revision is also consistent with new information from the Regional Network, where contacts in both household services and retail trade now expect higher growth than in December. Solid growth in real disposable income is expected to lift consumption throughout the projection period.
In 2023, the saving ratio was at a low level, albeit higher than assumed in the December Report (Chart 3.4), primarily reflecting increased pension saving. Excluding pension saving, the saving ratio was negative, which suggests that many households have maintained consumption either by drawing on savings or by borrowing. Household saving is projected to gradually increase somewhat as incomes rise.
Household saving ratio excluding dividends. Percent
Marked fall in housing investment
Activity in the market for existing homes has remained elevated. The stock of unsold homes increased in the period to autumn 2023. While having declined in recent months, the stock level still remains high. House prices fell in autumn 2023 but have risen rapidly so far this year and are expected to continue to do so ahead. Further out, house prices are set to rise further on the back of low residential construction activity and lower interest rates further out. The house price projections are higher than in the December Report throughout the projection period.
Housing investment growth has been weak in recent years, reflecting both low new home sales and weak profitability of new projects owing to higher interest rates and high construction costs. In 2023 Q4, the level of housing investment was 27% lower than the peak in 2021 Q2. This is a larger fall than during the financial crisis, but smaller than during the banking crisis of 1988–1993. Few housing starts and weak new home sales suggest a further decline in housing investment in the period ahead. The data collected so far in in 2024 suggests improvement in the market for new homes. Different sentiment indicators have shown a rise, figures for new home sales may suggest that the decline has slowed and a number of Regional Network contacts report higher sales figures for new housing construction projects. In line with more positive signs, housing investment is expected to pick up gradually from summer. Further out, housing investment is lifted by a faster rise in house prices, an increase in real income and higher population growth. The projection of annual growth in housing investment in 2024 has been revised down, but further out in the projection period, growth is expected to be higher than in the December Report (Chart 3.5).
Housing investment. Constant 2021 prices. Seasonally adjusted. In billions of NOK
Household interest burdens have risen substantially
The policy rate has been raised significantly over the past two years. Higher interest rates combined with heavier debt burdens, primarily at floating rates, have contributed to a marked rise in household interest expenses (Chart 3.6). This has reduced household disposable income, inducing a portion of households to tighten consumption. Norges Bank’s analyses nevertheless indicate that the vast majority of households have the financial means to cope with higher interest expenses.6 Interest burdens are expected to increase slightly further through 2024. Further out, lower debt burdens and policy rate reductions will contribute to a gradual easing of interest burdens.
Percent
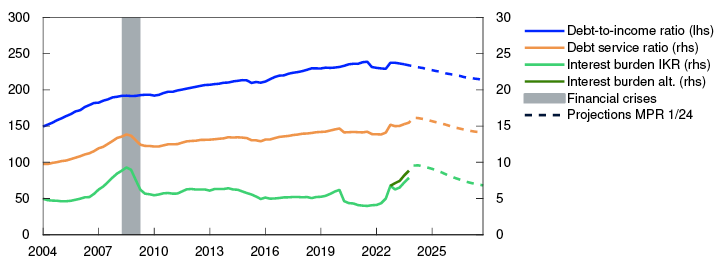
Household borrowing has declined since summer 2023. Owing to higher interest rates and lower residential construction activity, household income growth will exceed debt growth in the years ahead. This means that the debt burden on households is set to decline further out in the projection period. Given higher house prices, the projections for household borrowing and interest burdens have been revised up slightly since the December Report.
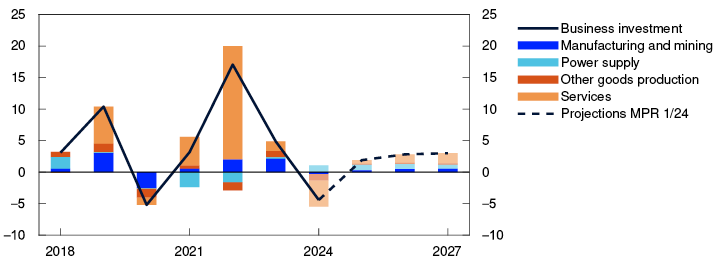
Lower business investment in 2024
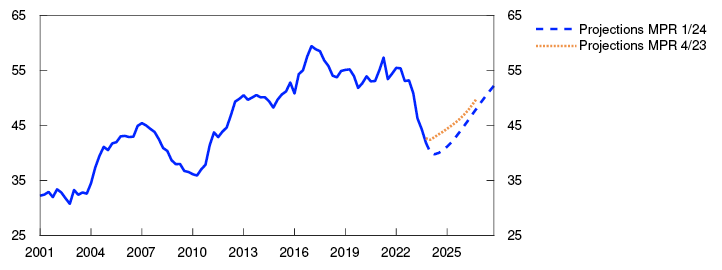
Mainland business investment has expanded rapidly since autumn 2020 but fell in 2023 Q3 and Q4 and is expected to continue to do so in 2024 H1 (Chart 3.7). The fall must be seen against the background of higher interest rates, faster cost growth, the recent years’ rapid expansion in investment and sluggish economic activity. Lower services investment is weighing particularly heavily on investment growth. Services investment is expected to pick up further ahead. Owing to the climate and energy transition, power sector investment is projected to rise. Lower interest rates further out will also provide an additional boost to investment.
Business investment in mainland Norway. Annual change. Contribution to annual change. Percentage points
Sources: Statistics Norway and Norges Bank
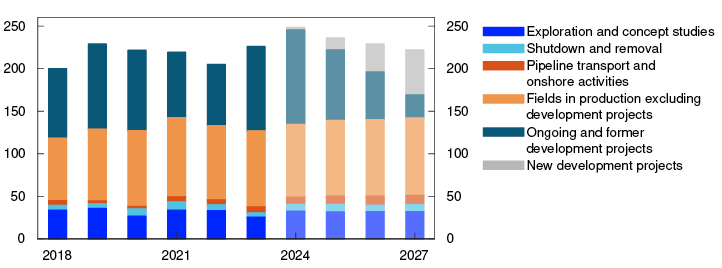
In 2023, investment in the oil and gas sector increased by 10.5%. In 2024, oil and gas sector investment is also projected to rise rapidly before drifting down through the remainder of the projection period (Chart 3.8). Rapid investment growth in 2023 and 2024 reflects the launch of a number of development projects in 2022 in response to the petroleum tax package and high energy prices. Some of these projects will be phased out in the coming years. The petroleum investment projection for 2024 has been revised up in line with the investment intentions survey for Q1. In terms of level, the projections are little changed for the remainder of the projection period.
Petroleum investment. Constant 2024 prices. In billions of NOK
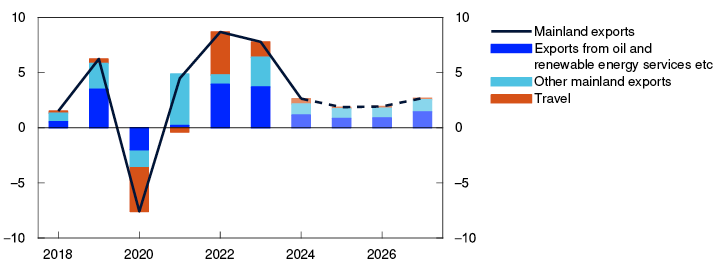
Weaker export growth ahead
Mainland exports have expanded rapidly over the past two years, driven in particular by increased exports of services suppliers to the oil, gas and renewable energy industries (Chart 3.9). The krone depreciation has boosted tourism and other exports. Slower export growth is expected in 2024 and in the coming years, owing in part to a stronger krone and weak economic growth among Norway’s trading partners. Many oil and gas service companies are also operating at close to full capacity.
Mainland exports. Annual change. Contribution to annual change. Percentage points
Sources: Statistics Norway and Norges Bank
Following strong growth in 2022, imports declined in much of 2023. Imports are projected to remain broadly unchanged in the period to summer, reflecting low activity in the Norwegian economy. Higher economic growth and a stronger krone are expected to lead to a gradual rise in imports thereafter. The Bank’s projections for import growth are broadly unchanged from the December Report, although the level is somewhat lower.
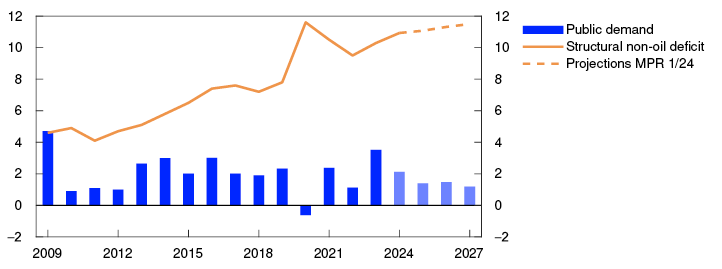
High public sector demand
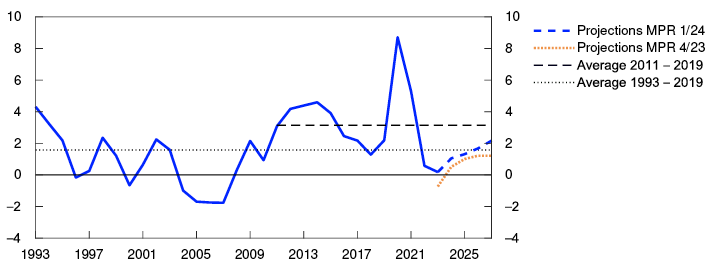
Growth in public demand was high in 2023. Public consumption rose substantially, both in central and local government, but particularly high public investment towards the end of 2023 contributed to stronger public demand growth than assumed in the December Report. Growth is assumed to slow in the years ahead (Chart 3.10). Prospects for lower capacity utilisation imply, in isolation, continued strong public demand. The structural non-oil deficit as a share of the Government Pension Fund Global (GPFG) is projected to decline in 2024 and remain at 2.7% of the value of the GPFG for the remainder of the projection period. As a result of a rising value of the GPFG, the structural non-oil deficit as a share of trend GDP is projected to increase gradually to the end of the projection period. The projection of the structural non-oil deficit has been revised up since the December Report.
Public demand. Annual change. Structural non-oil deficit. Share of trend mainland GDP. Percent
The projections are uncertain
Wide differences across industries make it difficult to interpret overall growth prospects for the economy. There is still uncertainty related to households’ response to higher interest rates. Household interest expenses rose sharply in 2023 and are expected to remain high in 2024. At the same time, the saving ratio is still low. Household consumption may therefore turn out to be weaker than the Bank’s analyses suggest. If the monetary policy tightening affects housing and business investment with a longer lag than assumed, mainland economic growth could prove lower than projected ahead. On the other hand, a steeper-than-expected rise in house prices may result in housing investment remaining higher than currently projected.
- 1 Surveys 4/23 and 1/24. Expected growth current and next quarter.
- 2 Period: 2018–2027. Projections from 2024. Here, the data for petroleum investment include investment in international shipping. Public demand = Public consumption + Public investment.
- 3 Period: January 2018 – December 2023. Linear trend based on developments in the period between January 2016 and December 2019.
- 4 Period: 1993–2027. Projections from 2023 for MPR 4/23 and from 2024 for MPR 1/24.
- 5 Period: Q1 2001 – Q4 2027. Projections from 2024 for MPR 1/24 and from 2023 for MPR 4/23.
- 6 See Financial Stability Report 2023 H2, Norges Bank, pages 23–24.
- 7 Period: 2004 Q1 – 2027 Q4. Projections from 2024 Q1 for MPR 1/24. Debt-to-income ratio is debt as share of disposable income. Disposable income is after-tax income less interest expenses. Debt service ratio is interest expenses and estimated principal payments on loan debt as a percentage of after-tax income. Interest burden is interest payments as a percentage of after-tax income. For 2023, there are unusually wide differences between different measures of household interest expenses. Estimates based on household interest rate data (Statistic Norway table 10745) and loans (Statistics Norway table 09560) indicate significantly higher interest expenses than preliminary data from income and capital accounts IKR. When calculating the interest burden and debt-to-income ratio, Norges Bank normally uses historical IKR data and estimates based on the relationship between estimated interest rates and the stock of household debt. The dark green line shows the alternative interest burden in 2023 if the relationship between lending rates and the stock of interest-bearing debt is used to estimate interest expenses.
- 8 Period: 2018–2027. Projections from 2024.
- 9 Period: 2018–2027. Projections from 2024. Data for 2018–2023 from Statistics Norway’s investment intentions survey, deflated by the price index for petroleum investment in the national accounts. The price index is projected to increase by 5 percent in 2024 and by 2 percent in 2025.
- 10 Period: 2018–2027. Projections from 2024.
- 11 Period: 2009–2027. Projections from 2024.
SMART – System for Model Analysis in Real Time
The System for Model Analysis in Real Time (SMART) is Norges Bank’s platform for forecasting models.1 In SMART, forecasts from a broad set of different models are averaged based on their historical forecasting properties. The SMART forecasts of mainland GDP have been revised up and the projections of the CPI adjusted for tax changes and excluding energy products (CPI-ATE) have been revised down since the December Report.
Model forecasts are an important tool for assessing the outlook for the Norwegian economy but will not necessarily be identical to the Bank’s final projections. For example, deviations may be due to judgement-based assessments of current drivers that differ from what the historical relationships imply.
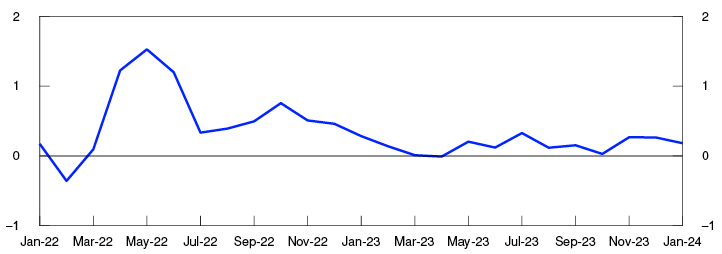
The SMART forecasts of four-quarter CPI-ATE inflation have been revised down compared with the December Report (Chart 3.A, left panel). SMART indicates that inflation will gradually decline ahead. The modelling system forecasts a four-quarter inflation rate of 5.0% in 2024 Q1 and 4.0% in 2024 Q2. Changes in the forecasts must be seen in light of actual inflation being lower than the SMART forecasts in the December Report.
Four-quarter change. Percent
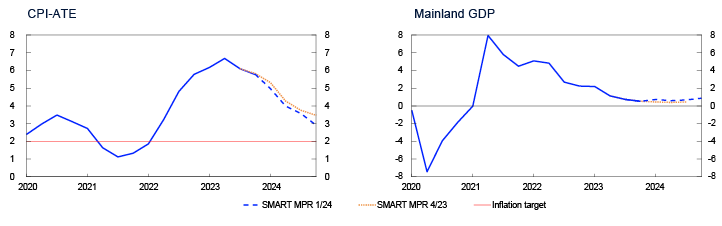
The SMART mainland GDP forecasts are slightly higher than in the December Report (Chart 3.A, right panel). SMART forecasts four-quarter growth of 0.7% in 2024 Q1 and 0.6% in 2024 Q2. The upward revision of the SMART mainland GDP forecasts largely reflects somewhat stronger activity in 2023 Q4 than the modelling system projected in the December Report.
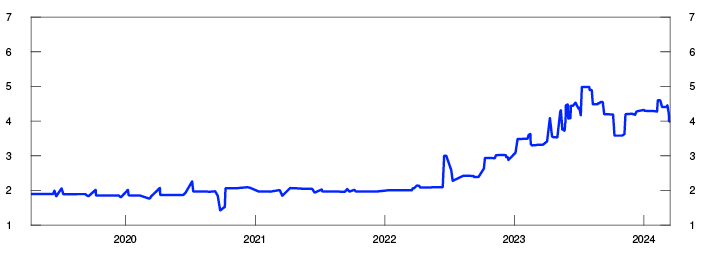
From the beginning of 2022, SMART revised up inflation forecasts for 2024 Q2 substantially in tandem with rising inflation (Chart 3.B). The forecast has declined since actual inflation started to moderate.
SMART forecasts for CPI-ATE in 2024 Q2 at different times. Four-quarter change. Percent
- 1 Bowe, F., I.N. Friis, A. Loneland, E. Njølstad, S.S. Meyer, K.S. Paulsen and Ø. Robstad (2023) “A SMARTer way to forecast”. Staff Memo 7/2023. Norges Bank.
- 2 Period: 2020 Q1 – 2024 Q4. CPI-ATE: CPI adjusted for tax changes and excluding energy products. Projections from 2023 Q4 for MPR 4/23 and from 2024 Q1 for MPR 1/24. The SMART modelling system for short-term projections is based on historical relationships. It averages empirical models based on previous forecasting properties.
- 3 Period: 10 April 2019 – 15 March 2024
3.2 Labour market
Employment is high
The employment-to-population ratio is high and registered unemployment remains low (Chart 3.11). At the same time, there are signs of easing labour market pressures. Unemployment has edged up over the past year. While employment rose further in 2023 Q4, employment growth slowed overall through 2023, and the employment rate moved down somewhat. This reflects the large inflow of Ukrainian refugees to Norway over the past two years, with about one in five now employed.
Employment to population ratio. 15–74 years. Percent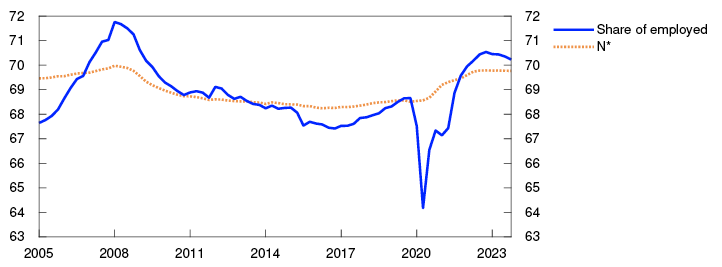
Many immigrants have eventually found work, raising the employment rate among immigrants (see box on «Increased immigrant employment lifts the employment trend»).
Unemployment has edged higher
Registered unemployment has risen gradually from its lowest level in summer 2022. The rise in unemployment was particularly pronounced in construction. In recent months, registered unemployment has shown little change and remained lower than projected in the December Report. In February, 62 900 persons were registered as fully unemployed, ie 1.9% of the labour force adjusted for normal seasonal variations.
Over the past year, the number of temporary foreign workers in Norway has declined. This has likely dampened the rise in unemployment as many of these worked in sectors where employment has fallen. At the same time, more Ukrainians have entered the labour market and applied for jobs.
The Labour Force Survey (LFS) indicates weaker developments than other labour market indicators. LFS unemployment has recently risen and was 3.9% in January. This is approximately the same level prevailing at the beginning of the pandemic, following a slightly steeper rise than registered unemployment. LFS unemployment over the past year has largely increased among the young, many of whom are pupils and students seeking part-time work. LFS data also indicate a somewhat smaller rise in employment than indicated by registered data.
Solid labour demand
Labour demand remains high, and according to the Norwegian Labour and Welfare Administration (NAV), the number of new job vacancies has increased somewhat in recent months. The stock of vacancies in Statistics Norway’s sample survey is also at a high level despite a decline in 2023 Q4.
In 2024 Q1, approximately one in five Regional Network contacts reported shortages of qualified labour (Chart D), broadly the same as before the turn of the new year, following a marked decline in the share through 2023. However, there are wide differences across industries. Most contacts in oil services reported difficulty recruiting qualified labour. In construction, the share reporting labour shortages has fallen to the lowest level since end-2015. According to Norges Bank’s Regional Network, many construction companies have chosen to retain a large portion of their workforce pending a pickup in order volumes.
Prospects for weak employment growth
Registered data indicate that employment rose further in January, and Regional Network contacts expect employment to edge up in the period to summer. At the same time, business leaders in Norges Bank’s Expectations Survey expect employment to remain virtually unchanged over the next twelve months. Weak growth prospects for the Norwegian economy also point to weak employment growth in 2024 and 2025 (Chart 3.12).
Employed in 1000s of persons. Seasonally adjusted
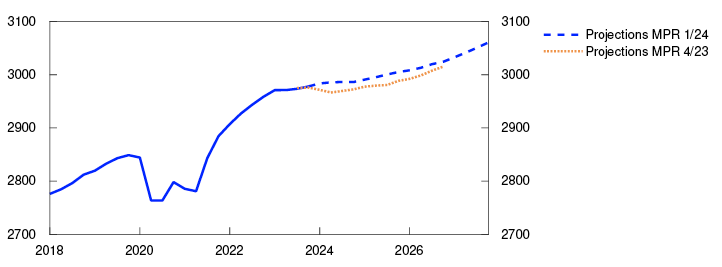
Further ahead, employment growth is also expected to pick up on the back of higher activity growth. The number of temporary foreign workers is projected to rise slightly in the coming year, in pace with some rebound in construction activity.
Unemployment is projected to edge up amid weak employment growth in the coming years (Chart 3.13). Registered unemployment increases gradually to around 2.2% in the beginning of 2025, remaining close to that level through 2026 and 2027. Unemployment will then be broadly at pre-pandemic levels. Compared with the December Report, the unemployment projections have been revised down slightly.
Unemployed as share of the labour force. Seasonally adjusted. Percent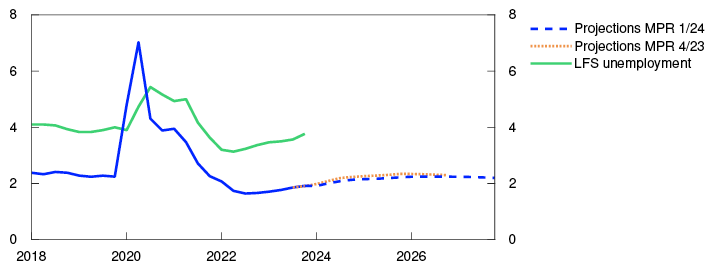
- 1 Period: 2005 Q1 – 2023 Q4. N* is an estimate of the highest level of employment that can be maintained over time without driving up wage and price inflation.
- 2 Period: 2018 Q1 – 2027 Q4. Projections for employment from 2023 Q4 for MPR 4/23 and from 2024 Q1 for MPR 1/24.
- 3 Period: 2018 Q1 – 2027 Q4. Projections from 2023 Q4 for MPR 4/23 and from 2024 Q1 for MPR 1/24.
Positive output gap is narrowing
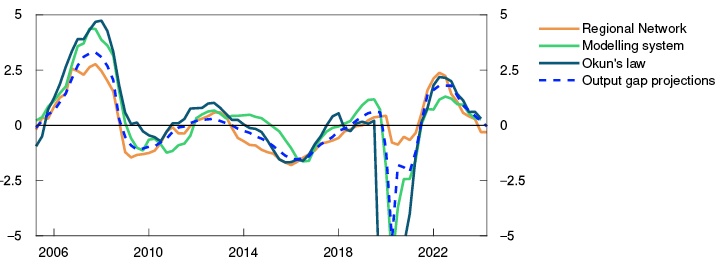
The positive output gap has narrowed over the past year with output now close to potential. The gap is expected to turn negative ahead and lie somewhat below potential throughout the projection period. The projections have been revised up somewhat since the December Report.
The output gap is a measure of the percentage difference between actual output (mainland GDP) and potential mainland output. Potential output is determined by productivity growth and the highest level of employment that can be maintained over time without driving up wage growth and inflation, hereinafter referred to as N*. Many of the variables used to estimate the output gap cannot be observed and are therefore uncertain. The Bank estimates the output gap based on an overall assessment of various indicators and models, where particular weight is given to labour market developments.
Output declined through 2023, after having remained well above potential in 2022 (Chart 3.C). Growth in the Norwegian economy was weak in 2023 and unemployment edged up. Through 2023, the share of Norges Bank’s Regional Network enterprises reporting capacity constraints and labour shortages fell.
Percent
In 2024 Q1, the share of enterprises reporting capacity constraints and labour shortages is little changed, below the average for the period since 2005. Registered unemployment has remained at a low level and lower than the level estimated to be consistent with output at potential. In addition, the number of unemployed has remained stable. On the whole, this may indicate a slower decline in capacity utilisation in the period to summer than previously envisaged.
Norges Bank’s modelling system for estimating the output gap, which is based on information about such variables as mainland GDP, unemployment, wage growth and domestic inflation, indicates a slight decline in capacity utilisation in 2024 Q1. In the Bank’s overall assessment, the output gap has narrowed to 0.2% in Q1, bringing the output close to potential. The estimate is a little higher than in the December Report.
Looking ahead, mainland GDP growth is set to slow and capacity utilisation to decline further. The output gap is projected to bottom out at a negative 0.5% at the end of 2025. Compared with the December Report, the output gap projections have been revised up somewhat throughout the projection period.
The projection of potential output growth has been revised up slightly for 2024 and 2025 against the background of a stronger-than-projected rise in employment and reports from Regional Network enterprises indicating reduced recruitment difficulties over time. Since the December Report, the population has increased slightly more than expected and pulled up N*. On the other hand, the number of temporary foreign workers has declined and been lower than projected. In isolation, this contributes to lowering the level of employment that can be maintained over time without driving up wage growth and price inflation, N*. On balance, N* is assessed to have increased and is somewhat higher than projected in December (see box on «Increased immigrant employment lifts the employment trend» for a further discussion of N* and employment trends).
The inflow of Ukrainian refugees is expected to continue in 2024 and 2025, in line with official projections. It is assumed that it will take some time for Ukrainian refugees to enter the labour market but that they will contribute to the rise in N* further out. In the coming years, the inflow of temporary foreign workers is also expected to increase somewhat, but the number will be slightly lower than assumed in December.
In recent years, there has been weak growth in productivity in aggregate and across most sectors (Chart 3.D). Regional Network enterprises expect continued weak productivity growth in 2024 Q1 and Q2. The projections for trend productivity growth are little changed since the December Report.
Productivity. Quarterly change. Moving average. Percent
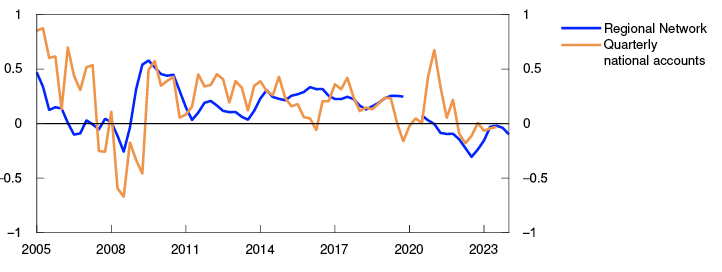
Table 3.A Output and potential output3
|
Change from projections in Monetary Policy Report 4/23 in brackets |
Percentage change from previous year |
|||||
|---|---|---|---|---|---|---|
|
1995–2009 |
2010–2023 |
2024 |
2025 |
2026 |
2027 |
|
|
GDP, mainland Norway |
3.1 |
1.9 |
0.5 (0.4) |
1.2 (0.0) |
1.3 (-0.2) |
1.6 |
|
Potential output |
3.1 |
1.8 |
1.3 (0.1) |
1.6 (0.1) |
1.5 (0.0) |
1.4 |
|
N* |
0.8 |
1.1 |
0.8 (0.1) |
1.0 (0.1) |
0.9 (0.0) |
0.8 |
|
Trend productivity |
2.3 |
0.7 |
0.5 (0.0) |
0.6 (0.0) |
0.6 (0.0) |
0.6 |
- 1 Period: 2005 Q2 –2024 Q2. Regional Network is the average of the capacity utilisation indicators in the Regional Network after they have been converted to output gaps using a simple model estimation.The modelling system for the output gap includes information about GDP, employment, unemployment, wage growth, inflation, investment, house prices and credit. For a more detailed description of the models, see Furlanetto, F., Hagelund, F. Hansen and Ø. Robstad (2022) “Norges Bank Output Gap Estimates: Forecasting Properties, Reliability, Cyclical Sensitivity and Hysteresis.” Oxford Bulletin of Economics and Statistics, 85(1), pp 238–267. Okun’s law is based on estimated deviation from the trend in registered unemployment as a percentage of the labour force.
- 2 Period: 2005 Q1 – 2024 Q1. Productivity growth in the Regional Network is calculated as enterprises’ reported output growth less employment growth. The observation for 2024 Q2 is based on contacts’ expectations. A three-quarter centered moving average is then calculated. Observations from the Regional Network in 2020 have been removed due to challenges with scale for the pandemic observations (see Regional Network report 2/2020). Productivity growth in the quarterly national accounts is given as mainland GDP per employed person. A five-quarter centered moving average is then calculated. Employment figures are adjusted for furloughs during the pandemic.
- 3 The contributions from N* and trend productivity do not necessarily sum exactly to the annual change in potential output due to rounding.
3.3 Prices and wages
Continued high inflation
Consumer price inflation has slowed since end-2022 but is still high. The consumer price index (CPI) was 4.5% higher in February than in the same month one year earlier. Underlying inflation, as measured by the CPI adjusted for tax changes and excluding energy products (CPI-ATE), has also fallen over the past six months. In February, the 12-month rise dropped to 4.9%, 0.6 percentage point lower than projected in the December Report. Other indicators of underlying inflation have fallen in pace with the decline in CPI-ATE inflation (Chart 3.14).
CPI and underlying inflation indicators. Twelve-month change. Percent
Inflation is still broad-based, and both goods and services inflation is high. In the grocery sector, prices are normally raised in February, but the first fall in prices since 2001 was recorded in February this year, resulting in a decline in overall price inflation in the same month. The rise in prices for other goods has also slowed over the past six months, contributing to a decline in 12-month CPI inflation. The contribution from high services price inflation has remained persistent, however (Chart 3.15).
CPI. Twelve-month change. Percent. CPI subcomponents. Percentage points
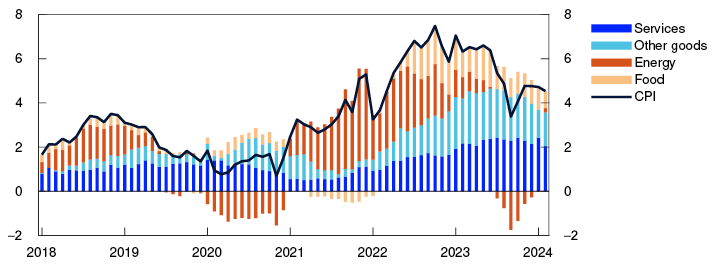
Sources: Statistics Norway and Norges Bank
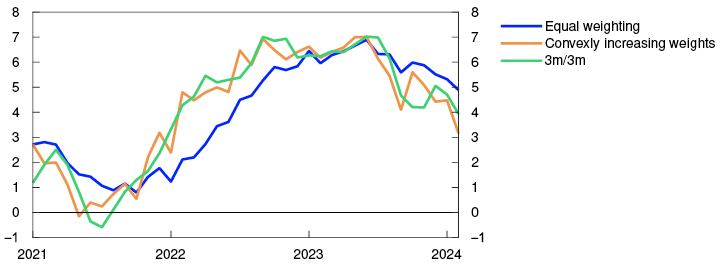
Norges Bank’s measure of inflation is normally the 12-month change in the CPI, with equal weight given to the change in each of the past 12 months. Month-on-month inflation can vary considerably, and using 12-month change limits noise from these movements. At the same time, this also lags the change in measured inflation. A more up-to-date picture of recent inflation developments is obtained if more weight is given instead to inflation over the past few months. Measured by this method, CPI-ATE inflation is also above the 2% target, but the rate has declined more than measured by the 12-month rate (Chart 3.16).
CPI-ATE. Annualised change. Seasonally adjusted. Percent
Lower energy prices curb inflation
Since 2023, energy prices have fallen and pulled down CPI inflation. The contribution from energy prices to 12-month CPI inflation has recently been low (Chart 3.15). Energy prices in the CPI have been slightly lower than expected since the December Report. The projections for consumer energy prices are based on futures prices for electricity and petroleum products and also take into account other factors such as electricity distribution charges and indirect taxes. Electricity futures prices are now lower than in December, which partly accounts for the downward revision of the projection of energy prices ahead. Lower energy prices are also expected to dampen CPI-ATE inflation somewhat further out.
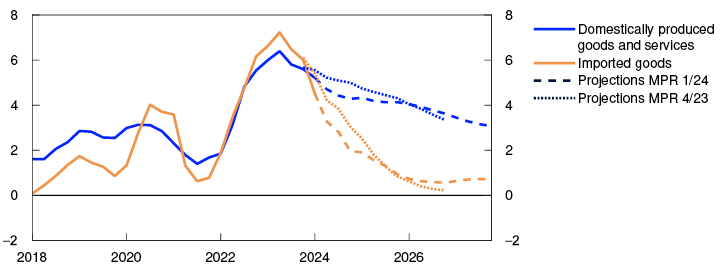
Prospects for lower imported goods inflation
The rise in prices for imported consumer goods has slowed in recent months and been somewhat lower than projected in the December Report. The Bank’s projection of imported inflation in the months ahead has therefore been revised down (Chart 3.17).
Domestically produced goods and services and imported goods in the CPI-ATE. Four-quarter change. Percent
The rise in the index of international price impulses for imported consumer goods (IPK) has slowed and been lower than expected in December (see box on «Decline in gas and electricity prices»). If the increase in freight rates is also taken into account, the decline is somewhat less pronounced. At the same time, the krone has appreciated since December and remained stronger than projected in the December Report. A stronger krone is dampening imported consumer goods inflation. Price impulses for imported consumer goods overall are expected to diminish ahead and to lie lower than in the December Report (Chart 3.18), pulling down imported inflation further out in the projection period.
International price impulses for imported consumer goods (IPK) with freight rates in NOK and foreign currency terms. Annual change. Percent

Domestic conditions keep inflation elevated
The rise in prices for domestically produced goods and services fell in February and was slower than projected in the December Report, pulling down inflation in the near-term projection period (Chart 3.17). Further out, domestic inflation is still expected to retreat more slowly than imported inflation, mainly because it takes time for wage growth to slow and because productivity growth is low. Even so, domestic inflation will be pulled down by a gradual fall in wage growth and overall capacity utilisation ahead.
Over the past year, imported intermediate goods inflation fell sharply and the 12-month change in the index of international price impulses for intermediate imports (IPI) is now negative. Futures prices for a number of key commodities are lower than in December, which partly accounts for the downward revision of the IPI projection in 2024 (see box on commodities on «Decline in gas and electricity prices»). It takes time before international price impulses to intermediate goods pass through to domestic inflation (see box in Monetary Policy Report 4/2023). In the projection, a slower rise in intermediate goods prices also curbs the rise in prices for domestically produced goods and services ahead (Chart 3.17).
Inflation is projected to moderate over the coming quarters, primarily due to the fading impact of the sharp rise in prices for electricity and imported intermediate and consumer goods. Even so, it will take time for inflation to come all the way down to the 2% target. High unit labour costs (ULC) are the primary reason why inflation remains elevated ahead (Chart 3.19). The krone depreciation through 2023 has pushed up inflation over the past year. The full pass-through of the krone depreciation will occur after a long lag, and last year’s depreciation will therefore result in a positive, but waning, contribution to underlying inflation further out in the projection period.
Contribution to four-quarter change in CPI-ATE. Percentage points.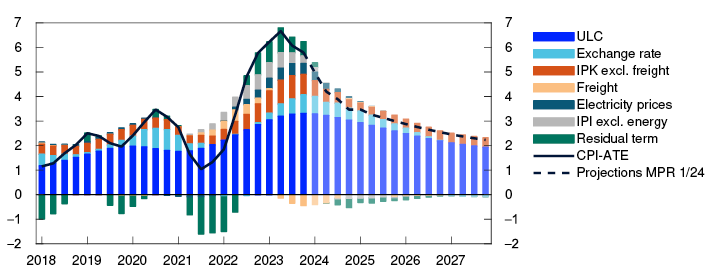
The projection of overall CPI-ATE inflation is revised down over the next two years compared with the December Report. On the other hand, projections are somewhat higher towards the end of the projection period. In isolation, lower energy futures prices pull down overall CPI inflation, especially in 2024.
- 1 Period: January 2018 – February 2024. CPI-ATE: CPI adjusted for tax changes and excluding energy products. Average: Average value of 12-month change for other underlying inflation indicators (CPIM, CPIXE, 20 percent trimmed mean, weighted median, CPIXV and CPI-sticky prices and CPIF) and CPI-ATE. Indicators: Highest and lowest 12-month change for other underlying inflation indicators.
- 2 Period: January 2018 – February 2024. Contributions estimated based on the CPI by consumption categories (group level). In the statistics, some differences occur between the sum of the components and overall inflation.
- 3 Period: January 2021 – February 2024. “Equal weighting” corresponds to the ordinary 12-month change in the CPI-ATE, where all the previous 12 months are given equal weight. With weights increasing convexly, months further back in time will be given less weight than more recent months. This means that the indicators capture changes in the rate of increase in the CPI-ATE earlier than the conventional 12-month change. At the same time, they will be more volatile. Calculations follows Eeckhout (2023) “Instantaneous inflation”. 3m/3m refers to annualised change over the past three months compared with the preceding three-month period.
- 4 Period: 2018 Q1 – 2027 Q4. CPI-ATE: CPI adjusted for tax changes and excluding energy products. Projections from 2023 Q4 for MPR 4/23 and from 2024 Q1 for MPR 1/24.
- 5 Period: 2023–2027. Prices of imported consumer goods. Projections from 2024.
- 6 Period: 2018 Q1 – 2027 Q4. Projections from 2024 Q1 for MPR 1/24. Decomposition of individual contributions from different cost components.
Higher inflation in Norway than in the euro area owing to last year’s krone depreciation
Since the inflation peak in 2023, underlying inflation has receded rapidly in many countries. In Norway, inflation has also moved down over the past six months, albeit at a slower pace than among most of Norway’s trading partners. As measured by indicators of underlying inflation, inflation in Norway has been higher than in the euro area. Some of the divergence is due to differences in the indicators used, both in terms of the goods and services components included and their assigned weights. In the euro area, harmonised indexes of consumer prices (HICP) excluding food and energy are ordinarily used as an indicator of underlying inflation, while the consumer price index adjusted for tax changes and excluding energy products (CPI-ATE) is used in Norway.
If we instead compare HICP excluding energy, the inflation trajectories in Norway and the euro area have been more similar than shown by the indicators normally used for purposes of comparison. These indexes show that the overall rise in prices in Norway and the euro area has been about the same over the past three years. But these indicators also show that inflation has been higher in Norway than in the euro area over the past year. A decomposition of the divergence based on different goods and services components indicates that the rapid rise in food and beverage prices was behind the higher level of inflation in the euro area than in Norway in 2021 and 2022. Over the past year, inflation has been higher in Norway than in the euro area mainly due to the strong increase in prices of exchange-rate sensitive goods (Chart 3.E).
Contribution to change in price levels. Difference between Norway and the euro area. Harmonised index of consumer prices, excluded energy. Percentage points.
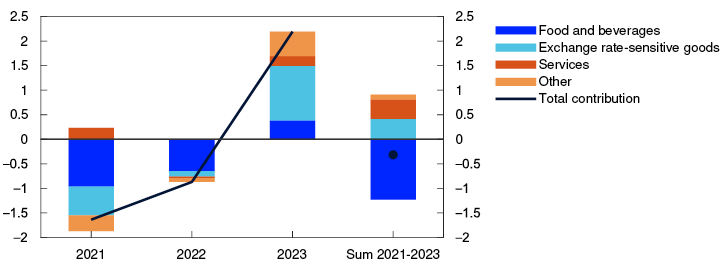
The substantial krone depreciation in 2023 accelerated the rise in prices for goods that are normally sensitive to exchange rate fluctuations. While the exchange rate contribution is expected to fade ahead (Chart 3.19), it is still likely to contribute to higher inflation in Norway than among trading partners in the coming years. Prospects for higher wage growth in Norway than in the euro area will also contribute to keeping inflation elevated ahead.
- 1 Period: 2021–2023. The illustration isolates subcomponents contributing to differences in changes in price levels between Norway and the euro area. The price indexes are based on Norwegian harmonised weights. “Exchange rate-sensitive goods” contribute the most to differences in inflation in 2023. “Total contribution” refers to the total difference in price level changes.
Continued high wage growth
Wage growth has increased in recent years, reflecting among other things high inflation, a tight labour market and strong profitability in some business sectors. In 2023, wage growth reached 5.2%, which was in line with the wage norm and lower than projected in the December Report.
In 2024, wage growth is projected to slow to 4.9%, which is slightly lower than the projection in the December Report. The projection is consistent with the wage expectations among Regional Network contacts but somewhat lower than in Norges Bank’s Expectations Survey. The Bank’s empirical models indicate wage growth of just under 5% (see box on «Models for forecasting wage growth»).
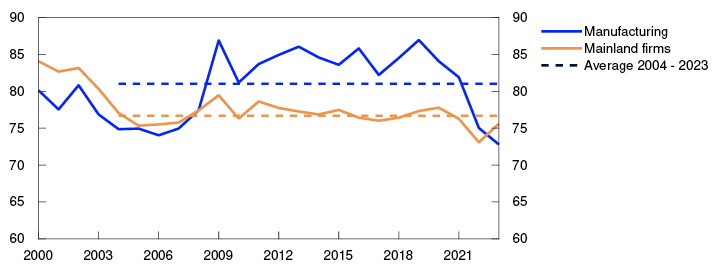
Since 2020, Norwegian export prices have risen rapidly, reflecting in part the krone depreciation. This has contributed to profitability gains in manufacturing and a sharp decline in the labour share (Chart 3.20). This is likely to push up wage growth somewhat in 2024 and subsequent years. On the other hand, lower profitability in some segments of manufacturing and other business sectors is expected to pull down somewhat on wage growth, in addition to lower inflation and falling capacity utilisation.
Labour costs as a proportion of factor income. Percent
In the projections, wage growth decelerates to 4.3% in 2025, and inflation continues to ease. The wage projection for 2025 is unchanged from the December Report.
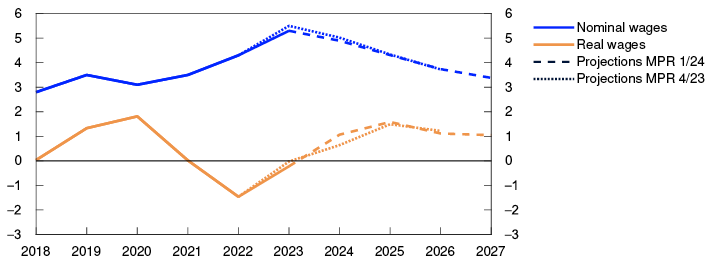
Real wage growth is put at 1.1% in 2024, which is somewhat higher than projected in the December Report (Chart 3.21). This partly reflects prospects for lower energy prices, which push down inflation. Real wage growth moves up to around 1.6% thereafter as productivity growth picks up somewhat and the labour share rises.
Annual change. Percent
Sources: Statistics Norway and Norges Bank
Uncertainty surrounding price and wage inflation
The wage growth projections in this Report are uncertain given the wide differences in profitability both within manufacturing and across different industries. Strong profitability for the manufacturing industry as a whole may mean a high wage norm and higher overall wage growth than currently projected. On the other hand, lower profitability in other economic sectors may dampen wage growth to a further extent than currently envisaged.
Several uncertainty indicators imply little change in inflation uncertainty in the near and medium term since the December Report (see box on «Indicators of uncertainty in the near and medium term»). According to the Bank’s expectations survey, inflation expectations are still above the inflation target both two and five years ahead, and inflation expectations five years ahead rose slightly in 2024 Q1.
There is considerable uncertainty related to productivity growth ahead. Productivity growth has been weak in recent years (Chart 3.D) and is projected to rise gradually in the course of the projection period. Productivity growth may prove to be weaker than envisaged and contribute to inflation remaining elevated for a longer period than currently expected. On the other hand, a sharper rise in productivity growth could lead to lower inflation and higher real wage growth.
Indicators of uncertainty in the near and medium term
Expectations and projections of future economic developments will always be subject to considerable uncertainty. As an aid in understanding macroeconomic uncertainty, Norges Bank uses a model framework to quantify the uncertainty surrounding developments in three key macroeconomic variables: mainland GDP growth, house price inflation and consumer price inflation.1 The models help shed light on uncertainty around a set of point estimates but do not give us any information about the most probable developments ahead. The simple model framework provides us with one of several forward-looking risk indicators. Our overall assessment of risk ahead will always be based on a combination of judgement and model estimates.
In this box, we use the difference between the median and the 95th and 5th percentiles, respectively, in the model framework’s estimated range of outcomes ahead as a measure of upside and downside risk. The illustrations show the changes in estimated upside and downside risk for the different variables over time. They show both changes in the size of the estimated range of outcomes, as measured by the difference between the 95th and 5th percentiles, and whether there is significant asymmetry between upside and downside risk.
According to the models, inflation uncertainty has risen considerably in recent years. Both near-term and medium-term uncertainty are broadly unchanged compared with the December Report (Chart 3.F). Uncertainty is still high compared with the historical average. The uncertainty surrounding inflation has also recently become somewhat more balanced along both horizons. In the medium-term, there is still a slightly greater risk of significantly higher-than-expected inflation than of significantly lower-than-expected inflation.
Spread between percentiles and median from quantile regressions. Four-quarter change in CPI-ATE. Percentage points
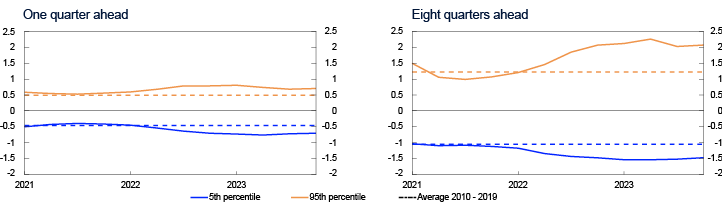
For mainland GDP growth, the model indicates that the uncertainty surrounding developments is balanced and near normal levels (Chart 3.G). Since the December Report, near-term and medium-term uncertainty have remained virtually unchanged. In the medium term, uncertainty is still slightly skewed to the upside, largely reflecting weaker growth in household credit. Historically, the rapid build-up of credit increases the probability of a financial crisis. Low credit growth may therefore contribute to reducing the downside risk related to output growth.
Spread between percentiles and median from quantile regressions. Four-quarter change in mainland GDP. Percentage points
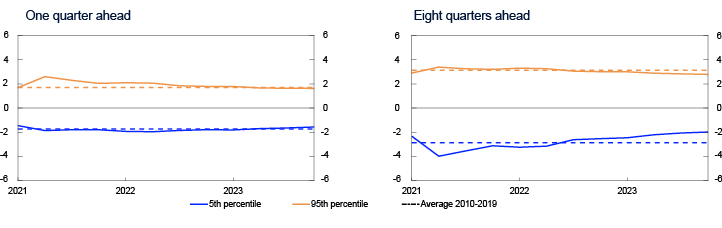
In both the near and medium term, there are minor changes in the indicators of uncertainty surrounding house price inflation. The models indicate that near-term uncertainty is close to its historical average (Chart 3.H, left panel). In the medium term, it is still slightly skewed to the downside, unchanged since the December Report (Chart 3.H, right panel), partly owing to a fall in real household disposable income and weaker growth in household credit.
Spread between percentiles and median from quantile regressions. Four-quarter change in house prices. Percentage points
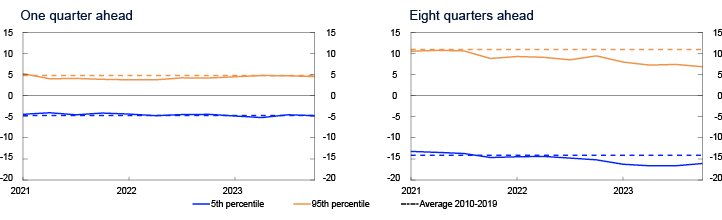
- 1 The models use quantile regressions with different indicators to estimate the distribution of output growth, house price inflation and consumer price inflation ahead. See further description in Bowe, F., S.J. Kirkeby, I.H. Lindalen, K.A. Matsen, S.S. Meyer and Ø. Robstad (2023) “Quantifying macroeconomic uncertainty in Norway”. Staff Memo 13/2023. Norges Bank.
- 2 Period: 2021 Q1 – 2023 Q4. The charts show developments in the difference between the 5th and 95th percentiles from the median for the model estimated distribution of consumer price inflation one and eight quarters ahead, respectively. Broken lines indicates average 5th and 95th percentiles between 2010 and 2019.
- 3 Period: 2021 Q1 – 2023 Q4. The charts show developments in the difference between the 5th and 95th percentiles from the median for the model-estimated distribution of GDP growth one and eight quarters ahead, respectively. Broken lines indicate average 5th and 95th percentiles in the period between 2010 and 2019.
- 4 Period: 2021 Q1 – 2023 Q4. The charts show developments in the difference between the 5th and 95th percentiles from the median for the model-estimated distribution of house price growth one and eight quarters ahead, respectively. Broken lines indicate average 5th and 95th percentiles between 2010 and 2019.
- 1 Period: 2000–2023. By mainland firms we mean labour share in mainland Norway excluding the public sector and housing services, adjusted for the self-employed.
- 2 Period: 2018–2027. Projections from 2023 for MPR 4/23 and projections from 2024 for MPR 1/24. Real wages: Nominal annual wage growth adjusted for CPI inflation.
Increased immigrant employment lifts the employment trend
In recent years, employment has risen considerably, and more than projected in Norges Bank’s Monetary Policy Reports. The increase reflects a substantial increase in employment among immigrants. In order to increase our understanding of what lies behind this development, we use detailed data and have a closer look at employment trends, with a focus on immigrant employment. We find that the immigrant employment rate has increased over time, particularly driven by labour immigration and increased employment among women with an immigrant background. We also show that immigrant employment tends to vary relatively more over business cycles and that high activity in the Norwegian economy has probably contributed to the upturn in recent years.
Since the pandemic, the Norwegian economy has experienced solid growth and labour demand has been high. The employment rate has increased considerably, especially for immigrants (Chart 3.I).1 The chart also shows that the immigrant employment rate has increased over time and has diverged from that of the wider population.
Employment to population ratio. 16–74 years. Percent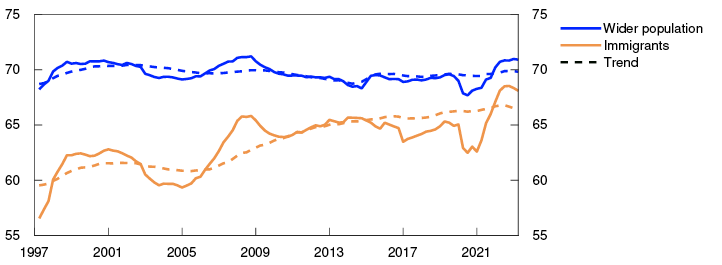
In this box, employment information is disaggregated by different population groups to better understand developments. Previously, we have calculated trends in employment, taking into account the population composition by age, gender and education.3 The composition now includes immigrants to enable us to distinguish between immigrants and the wider population. Information on reason for immigration4 and number of years of residency in Norway is also taken into account.
Based on the demographic variables, the population is divided into groups. A trend employment rate is estimated for each group, before aggregating up.5 Chart 3.J shows the aggregate trends for Norwegian-born persons and immigrants. The trend immigrant employment rate has increased over time and contributes to pulling up the total employment share. At the same time, the average level of the immigrant employment rate is lower than that of the wider population. The increasingly larger share of immigrants in the population has therefore in itself reduced the total employment share (compositional effect).
Contribution to the change in the trend in the employment share since 2003. Percentage points
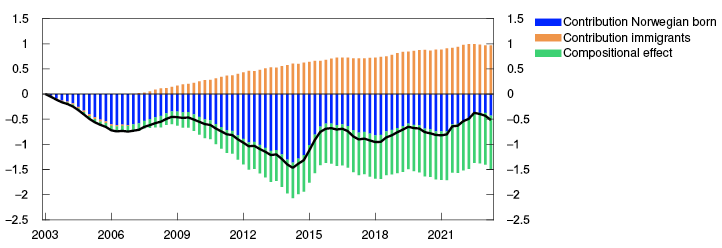
Chart 3.K illustrates the contribution of different factors to the trend immigrant employment rate. Two factors stand out. In the 2000s, the main reason immigrants came to Norway was to work. This has boosted the average immigrant employment rate and is reflected in the contribution from compositional effects in the chart. The second is that a large part of the increase can be explained by an increase in the employment rates for the various immigrant groups. The panel on the right shows that this is mainly due to increased employment among women with an immigrant background in the age group 25–61 years. The analysis shows that the increase has largely occurred among women who have lived in Norway for several years and who have immigrated for reasons other than work (for example family reunification or displacement). In addition, the chart indicates that the rise in immigrant employment in recent years has been broader based than previously.
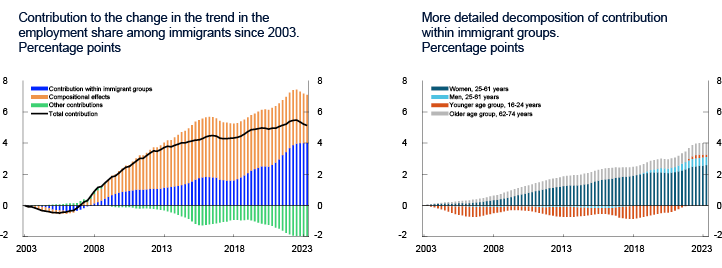
Chart 3.L shows that employment has increased more than the estimated trends in recent years, and that the increase has been greater for immigrants than for the wider population. Our calculations indicate that immigrants have responded more than the rest of the population to the high level of activity in the economy. The calculations also indicate that immigrant employment in the past has varied more than for the wider population over the business cycle.8 This may, for example, be because a large share of immigrants work in cyclically sensitive sectors.
Employment rate less an estimated trend. Percentage points
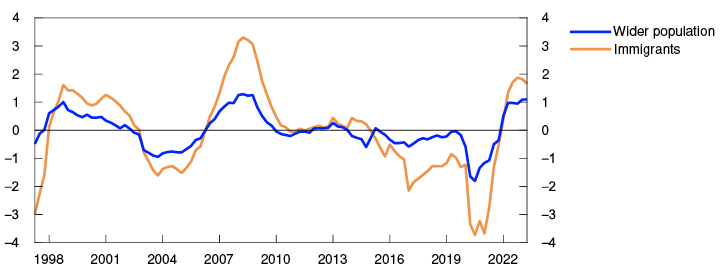
In our conduct of monetary policy, we seek to stabilise employment around the highest level that is consistent with price stability over time (N*). N* is estimated based on an overall assessment of overall capacity utilisation in the economy and various labour market indicators, including employment rate trends. When we explicitly account for immigrant employment, the estimated trend employment rate is higher than previously estimated.10 In recent years, we have revised up the estimate of N* (see also Chart 3.11). Our analysis of employment rates based on more detailed information therefore supports our adjustments to the estimate of N*.
- 1 Immigrants are defined as persons who have immigrated to Norway by themselves, and who are born abroad of foreign-born parents and four foreign-born grandparents. This is the same definition used by Statistics Norway in official statistics. Refugees during the first two years after arrival in Norway are excluded as most refugees are not active in the labour market in the initial period after arrival.
- 2 Period: 1997 Q2 – 2023 Q2. Figures are based on microdata from Statistics Norway and the Bank’s calculations. The population is limited to residents aged 16–74.
- 3 See box in Monetary Policy Report 3/2021 and Ellingsen, N., L. Fosso and S. M. Galaasen (2024)“Employment trends in Norway”. Staff Memo 1/2024. Norges Bank
- 4 Reason why a given person immigrated to Norway. Statistics Norway distinguishes between work, family, refugee, education, unknown and other reasons.
- 5 The trends are estimated using VAR models with time-varying trends, as in Ellingsen, N., L. Fosso and S. M. Galaasen (2024) “Employment trends in Norway”. Staff Memo 1/2024.Norges Bank. In addition, registered unemployment is included as an additional explanatory variable in the models
- 6 Period: 2003 Q1 – 2023 Q2. Figures are based on microdata from Statistics Norway and the Bank’s calculations. The population is limited to resident aged 16–74.
- 7 Period: 2003 Q1 – 2023 Q2. Figures are based on microdata from Statistics Norway and the Bank’s calculations. The population is limited to residents aged 16–74. “Other contributions” in the left panel are contributions that cannot be separated in the other two categories because employment rates and population rates are periodically correlated for some of the groups. The right panel shows a more detailed decomposition of “contribution within groups of immigrants” from the left panel.
- 8 This is in line with what we find if we use other methods and analyse the relationship between total unemployment, interest rates, inflation and employment rates. We then find that employment among immigrants responds more than the rest of the population to both booms and recessions.
- 9 Period: 1997 Q2 – 2023 Q2. Figures are based on microdata from Statistics Norway and the Bank’s calculations. The population is limited to residents aged 16–74.
- 10 See box in Monetary Policy Report 3/2021 and Ellingsen, N., L. Fosso and S. M. Galaasen (2024) “Employment trends in Norway”. Staff Memo 1/2024. Norges Bank
Models for forecasting wage growth
Norges Bank’s forecasts of wage growth in Norway are based on a wide set of information. In addition to the Bank’s core model, NEMO, the wage growth forecasts are derived from survey-based wage expectations and other empirical models that include key wage formation variables. This box discusses the framework for forecasting and analysing wage growth beyond NEMO and considers advantages and disadvantages of the different empirical models used.
When we make forecasts for wage growth and other variables, we seek to use all available information and apply models that give the lowest possible forecast error over time. Our core model NEMO is based on a simplified representation of Norwegian wage formation where the workers’ share of value added in the economy – the labour share – is stable in the long term. Important factors such as price expectations, the output gap, the oil price, GDP for mainland Norway and past wage trends affect the wage forecasts from the model, but current figures for the labour share are not explicitly included. By using the alternative empirical models described below, the direct effects of changes in the labour share are captured in the projections. These models also capture profitability and the labour share in manufacturing.
In the first quarter of the year, we have limited information about the year’s wage settlement. The wage growth forecast for the current year is based on expected wage growth derived from Norges Bank’s Expectations Survey and Regional Network, in addition to empirical models. Later in the year, the outcome of the wage negotiations is also incorporated in the forecast. The empirical models contain key variables for wage negotiations, such as TBU’s1 inflation forecasts and employers’ ability to pay wages. The different empirical models contain much of the same information set but have different structures. The relationships highlighted by the models reflect key features of the Norwegian wage formation model. The models are also used to cross-check projections from NEMO further out in the projection period.
The Norwegian system of wage negotiations is set up in such a way that the tradeable sector’s ability to pay wages provides a norm for total wage growth.2 The labour share in manufacturing is expected to be stable over time. In principle, the profitability of non-tradable sectors does not matter for wage growth in this model. Instead, firms in the non-tradable sector maintain profitability by adjusting prices. However, in practice it seems that profitability within one’s own sector is also important to wage growth in non-tradable sectors (see Staff Memo 5/2022).3 In our wage models we therefore consider both profitability in manufacturing and more aggregated figures.
To measure the labour share we use labour costs as a share of factor income.4 We consider the labour share in manufacturing and in mainland Norway, respectively, as a measure of the ability to pay wages. The past few years the labour share in manufacturing has declined markedly and been lower than the 20-year average (Chart 3.20). Overall, the labour share in firms in mainland Norway has also been somewhat below the historical average, but the gap is smaller than in manufacturing.5 Some measure of the labour share enters all empirical models discussed below.
One of the wage growth models used is an error correction model (ECM) containing the labour share for mainland Norway (ω) as an error correction term.6 This means that the labour share will tend to move towards its historical average after a period of deviations. All else equal, a period of low labour share will lead to higher wage growth in the following years. Adjustment is gradual, and deviations from equilibrium will not be fully eliminated in the short term. The model also accounts for inflation expectations (πe) measured by TBU’s inflation forecast where available, real price gains, measured by the GDP deflator for mainland Norway relative to the CPI (Ʈ), productivity growth (z) and an unemployment gap (û).

We base the ECM on variables for mainland Norway. The explanatory power, measured by R2, is good and close to 0.9. The explanatory power of the model deteriorates if we only use variables for the manufacturing sector.7
In addition to the ECM, we use two VAR models estimated using Bayesian methods (BVAR).8 The models use many of the same variables that enter into the ECM, see equation below:9

A key advantage of using a BVAR model is that the model forecasts all variables that enter the system of equations. This makes it easier to construct alternative versions of the model and to evaluate their forecasting properties. We use two versions of the BVAR model: One based on data for mainland Norway and one based on data for the manufacturing sector. Both models forecast total annual wage growth, but the manufacturing version uses explanatory variables that are more relevant to the manufacturing sector. In periods where profitability has evolved differently across manufacturing and all businesses, having two versions can be especially useful.
In a BVAR model it is more challenging to interpret the linkages between the explanatory variables than in an ECM as BVARs are less structural. However, it is possible to conduct some simple exercises to isolate the effect of changing one of the explanatory variables. Chart 3.M shows the change in projected wage growth in 2025 when conditioning on a lower labour share in 2024 using the BVAR model for mainland Norway. The exercise indicates that a 1 percentage point lower labour share raises wage growth by just below 0.2 percentage point the following year. This is slightly lower than the corresponding effect in the ECM model, which lies between 0.2 and 0.3 percentage point. All else equal, the BVAR model for mainland Norway indicates that the effect peaks the year after the decline in the labour share, but the effect is also long-lasting.
Isolated effect of a 1 percentage point lower labour share in 2024. Annual wage growth. Percent
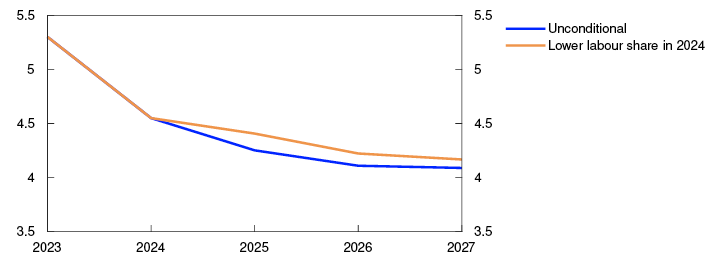
In addition to the empirical models, wage growth expectations in Norges Bank’s Expectations Survey and Regional Network also provide valuable information. A comparison of the forecasting properties across the different surveys and models suggests that the wage expectations of the social partners have historically provided the most accurate wage growth projections (Table 3.B). The values in the table indicate the root mean square error of the forecasts. Historically, the near-term forecasting accuracy of the empirical models has been lower. However, it should be noted that this evaluation is based on the BVAR’s own forecasts for other explanatory variables, and that these forecasts may differ from Norges Bank’s forecasts. In the forecasting process we will normally condition on Norges Bank’s other forecasts. This will probably improve the accuracy of the forecasts.
Table 3.B RMSE. Forecast properties measured by RMSE. Projection given in Q1. Evaluated 2005–202311
|
Model/indicator |
RMSE |
||
|---|---|---|---|
|
Current year |
Next year |
In two years |
|
|
Expectations survey – social partners |
0.5 |
0.9 |
- |
|
Expectations survey – business leaders |
0.8 |
1.2 |
- |
|
Regional Network |
0.6 |
- |
- |
|
BVAR – mainland Norway |
0.7 |
1.1 |
1.1 |
|
BVAR – manufacturing |
0.8 |
1.2 |
1.2 |
For 2024, several of the models and the survey indicators forecast wage growth of 4.9 or 5.0 percent (Chart 3.N). The forecasts are conditioned on the Bank’s forecasts of the relevant explanatory variables, in addition to TBU’s inflation projection for 2024. The BVAR model for mainland Norway gives the lowest forecast, whereas the wage expectations of the social partners are a bit higher than the model forecasts. Despite the better short-term performance of the survey indicators, the model projections are important for considering the effect of the explanatory variables on the wage outlook, as well as for cross-checking forecasts further out.
Percent
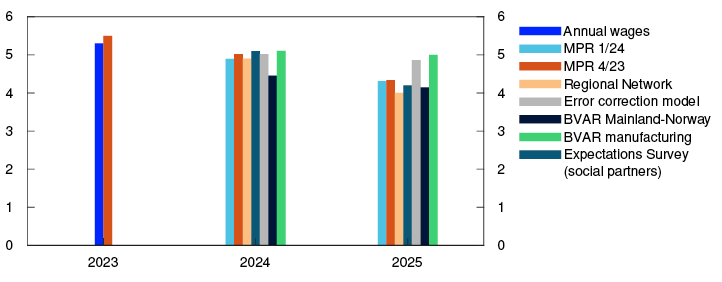
- 1 TBU is the abbreviation for the Norwegian Technical Calculation Committee for Wage Settlements
- 2 See Aukrust, O. (1977) “Inflation in an open economy: a Norwegian model”. Artikler fra Statistisk sentralbyrå, 96.
- 3 See Brubakk, L. and K. Hagelund (2022) “Frontfagets betydning for lønnsdannelsen i private tjenestenæringer”. Staff Memo 5/2022. Norges Bank (Norwegian only).
- 4 Factor income is the sum of labour costs and operating profits.
- 5 The public sector and housing services are excluded in the calculation of the labour share for mainland Norway. Furthermore, both the labour share in manufacturing and mainland Norway are adjusted for self-employment.
- 6 The model is documented in Brubakk, L., K. Hagelund and E. Husabø (2018) “The Phillips curve and beyond – Why has wage growth been so low?”. Staff Memo 10/2018. Norges Bank.
- 7 In addition, figures for manufacturing are more prone to revision. From 2011 to 2021 the labour share in manufacturing was on average revised by 3.9 percentage points whereas the labour share in the mainland economy was revised by 1.1 percentage points.
- 8 The models are estimated from 1980 to 2023. The models are documented in a forthcoming Staff Memo.
- 9 The models contain annual wage growth (W), value of productivity (Zi = zi × pyi), expected inflation (πe), production gap (ŷ) and a measure of the labour share (ωi).
- 10 Period: 2023–2027. The unconditional path shows wage forecasts from the BVAR model for mainland Norway without conditioning on any exogenous forecasts further ahead. The orange line shows alternative model forecasts when conditioned on a 1 percentage point lower labour share in 2024. Since wage inflation and labour share are interdependent in the current period, it is also conditioned on wage inflation in 2024. The chart shows in isolation the impact on wage inflation in the years ahead, as forecasted in the BVAR model.
- 11 The ECM model is not included in the evaluation as it must be conditioned on exogenous variables in order to provide wage forecasts. Evaluation requires recursive estimates for all explanatory variables that the model does not itself produce. This is not available for the entire period from 2005 to 2023.
- 12 Period: 2023–2025
4. Monetary policy analysis
On balance, Norges Bank’s analyses indicate a policy rate path that is little changed from the December 2023 Monetary Policy Report. According to the model analysis, the path is pushed down by a stronger krone, lower energy prices and weaker international price impulses. Somewhat higher-than-projected domestic demand and higher petroleum investment in isolation pull in the direction of a higher policy rate path.
4.1 The policy rate forecast and monetary policy objectives
The operational target of monetary policy is annual consumer price inflation of close to 2% over time. Inflation targeting shall be forward-looking and flexible so that it can contribute to high and stable output and employment and to countering the build-up of financial imbalances. The Committee’s monetary policy strategy is discussed further in the box on «Norges Bank’s monetary policy strategy».
Compared with the December Report, the policy rate forecast is little changed. The policy rate was kept unchanged at 4.5% at the meeting of the Monetary Policy and Financial Stability Committee on 20 March. The forecast indicates that it will remain at this level until autumn before gradually declining. At the end of the forecast horizon, the policy rate is projected to be about 2.8%.
The projections are uncertain. The uncertainty surrounding the inflation projections is especially high now that inflation is high, and inflation expectations lie above the inflation target. The Bank’s forecasts have undergone much revision over the past year. If the economic outlook, the balance of risks or the assessment of the functioning of the economy change, the policy rate may prove to be different from the one projected.
4.2 New information and new assessments
New information suggests a policy rate path that is little changed
To shed light on how new information affects the economic outlook, new information and assessments of the economic situation are incorporated into the modelling system, while conditioning on the policy rate path from the December Report. This exercise shows the forecasts that the model ling system would have produced with the policy rate path from December. Here the main focus is on the output gap and inflation outlook.
In the exercise with the rate path from December, the capacity utilisation projection has been revised up somewhat compared with the December Report (Chart 4.1). CPI-ATE inflation has been lower than projected. Looking ahead, inflation is projected to be lower in the near term and slightly higher towards the end of the projection period. The exercise indicates a policy rate path that is little changed compared with the December Report.
Chart 4.1 Lower inflation and somewhat higher capacity utilisation1
Projections conditioned on new information concerning economic developments and the policy rate forecast in Monetary Policy Report 4/23
CPI-ATE. Four-quarter change. Percent Estimated output gap. Percent
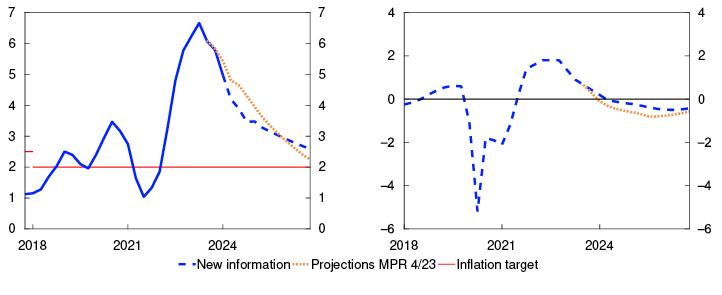
Higher market policy rate expectations
Market policy rate expectations further out can provide an indication of how market participants have interpreted new information and how they believe Norges Bank will react.
Market interest rates rose considerably at the time of the publication of the December Report and have since risen further. The policy rate path is broadly consistent with market pricing in the coming years. Market expectations indicate a policy rate of approximately 4.0% at the end of the year (Chart 4.2).
Policy rate. Percent
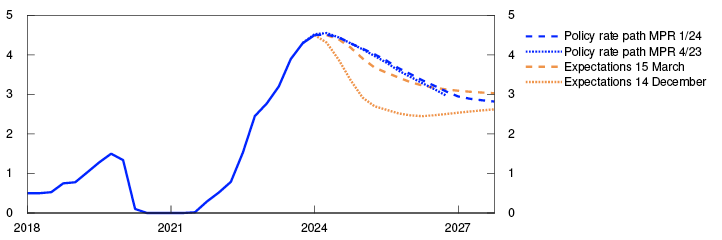
Sources: Bloomberg and Norges Bank
Some of the rise in Norwegian market interest rates may reflect the modest rise in market policy rate expectations among Norway’s main trading partners since the December Report (Chart 4.3). As the Bank’s policy rate path has since shown little change, the difference between the policy rate path and market interest rate expectations abroad has narrowed slightly.
Policy rates in Norway and among Norway’s main trading partners. Percent
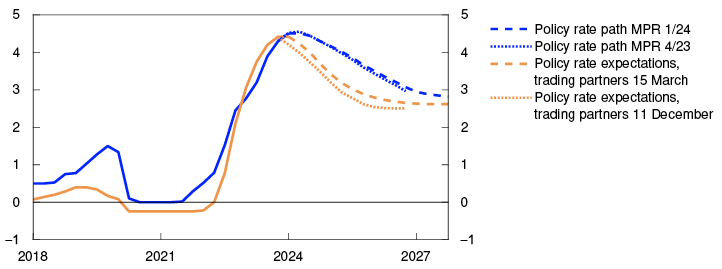
The simple rule indicates a slightly lower policy rate than in December
A simple policy rate rule shows the monetary policy reaction to changes in the output gap and inflation (see Monetary Policy Report 2/2022). The estimated rule is based on data for the period 2009–2021. The short-term projection of the output gap has been revised up slightly, while the short-term inflation projection has been revised down. The simple rule indicates a slightly lower policy rate now than in the December Report, but the level is still higher than the policy rate projection (Chart 4.4).
Three-month money market rate. Percent
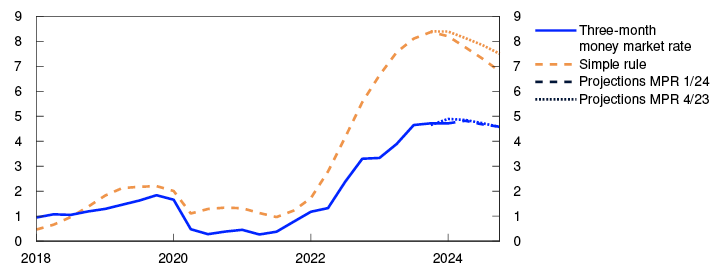
- 1 Period: 2018 Q1 – 2027 Q4. Projections from 2023 Q4 for MPR 4/23 and 2024 Q1 for MPR 1/24.CPI-ATE: CPI adjusted for tax changes and excluding energy products.The output gap is a measure of the percentage difference between mainland GDP and projected potential mainland GDP.
- 2 Period: 2018 Q1 – 2027 Q4. Expectations from 14 December for MPR 4/23. Expectations from 15 March for MPR 1/24.
- 3 Period: 2018 Q1 – 2027 Q4. Estimated forward rates from 11 December for MPR 4/23 and 15 March for MPR 1/24. The international policy rate is a trade-weighted average of the policy rates of the Bank of England, the ECB, the Federal Reserve and Sveriges Riksbank.
- 4 Period: 2018 Q1 – 2024 Q4. Projections from 2023 Q4 for MPR 4/23 and 2024 Q1 for MPR 1/24.
4.3 Monetary policy stance and drivers behind the changes in the policy rate path
Interest rates have risen substantially over the past two years. This has had a tightening effect on the economy. The average residential mortgage rate has risen broadly in pace with the policy rate, which reduces household disposable income and provides incentives to save rather than consume. Both of these effects suggest lower consumption. Higher interest rates also pull down business investment through increased financing costs.
Compared with the December Report, the policy rate forecast has been revised down less than the inflation projections for the coming year, with an associated increase in the expected real money market rate in the coming quarters (Chart 4.5). The real interest rate is projected to lie above the level that has a neutral effect on the economy.5 This means that monetary policy, as measured by the real interest rate, is assessed to have a tightening effect on the economy.
Estimate of the expected real money market rate. Percent
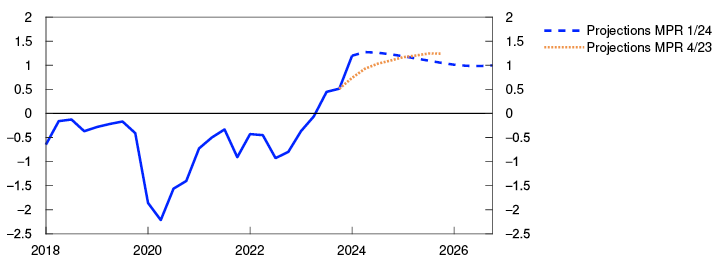
The model-based analysis implies a policy rate path that is little changed
The Committee’s reasoning for the policy rate decision and forward guidance on the policy rate are presented in the «Monetary policy assessment». In the decomposition in Chart 4.6, we use our main model NEMO to break down the main drivers behind the change in the policy rate path since the previous Report. The bars show contributions to changes in the model-based path, and the broken line shows the sum of the bars. The solid line shows the actual change in the rate path.
Cumulative contributions. Percentage points
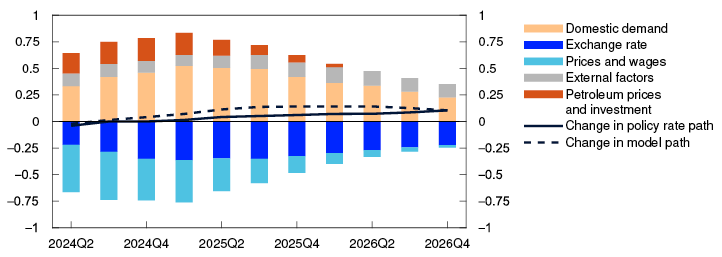
The interest rate differential will be lower than previously assumed, reflecting a rise in market rates abroad. This pulls in isolation in the direction of a weaker krone. Mainland exports have been higher than projected. The projections for economic growth among Norway’s trading partners are broadly unchanged. Overall, external factors suggest a higher model-based path (grey bars).
Since the December Report, oil spot and futures prices have risen somewhat. Gas prices have fallen. Petroleum investment has been higher than projected, boosting both activity in oil-related industries and wage growth. Overall, factors relating to petroleum prices and petroleum investment pull up the model-based path (red bars).
The krone exchange rate has been stronger than projected in the December Report and stronger than implied by the change in the interest rate differential in the model framework. A stronger krone leads to lower imported goods inflation and weakens Norwegian firms’ cost competitiveness. This dampens Norwegian net exports and overall activity and contributes to lower wage growth. Overall, the exchange rate pulls down the model-based path (dark blue bars).
Capacity utilisation is projected to be somewhat higher than envisaged in December. Developments in private consumption and public demand have been stronger than expected. The projections for public demand have been revised up further out. Overall, domestic demand contributes to a higher model-based path throughout the projection period (orange bars).
Core inflation has been lower than projected in December. Lower energy prices ahead pull down the projections for core inflation. Weaker international price impulses contribute to curbing imported inflation. Wage growth has been lower than expected and the projection has been revised down somewhat for 2024. Price and wage factors on the whole suggest a lower model-based path (light blue bars).
The model-based path and the policy rate path are little changed since the December Report.
- 5 See Monetary Policy Report 2/2023 for further discussion of the neutral real interest rate.
- 6 Period: 2018 Q1 – 2026 Q4. The expected real interest rate is the projected money market rate over the next four quarters less expected CPI-ATE inflation over the same period. For Q1 and in the projection period, the expected real interest rate is estimated based on the projections in this Report. For all previous periods, the expected real interest rate is based on the most up-to-date Monetary Policy Report at the time in question.
- 7 Period: 2024 Q2 – 2026 Q4. Projections. The contributions are based on model estimates from the NEMO model, but there is no mechanistic link between news and changes in the bars. The effects of news feed through with a lag and the interaction between economic variables may result in a reversal of the effects over time. In addition, projections for the near term may entail news with different signs at different times. The effect on the rate path is therefore shown most clearly by the cumulative contributions.
Monetary policy trade-offs illustrated by the forecasts of inflation and the output gap
In the long term, there is no conflict between low and stable inflation and high and stable employment. Price stability is a precondition for the economy to function efficiently. But in the short term, shocks will occur that give rise to a conflict between the two considerations, which requires monetary policy trade-offs to be made. The trade-offs we make are expressed in our forecasts of inflation and the output gap1.
In monetary policy theory, the trade-offs are usually represented by a loss function:
(1) L = (π – π*)2 + λy2,
where L is the loss, π is inflation, π* is the inflation target and y is the output gap. Lambda (λ) indicates how much weight the central bank places on output stability in relation to inflation stability. If lambda is 1, a deviation from the target is considered to be just as costly as a corresponding deviation of the output gap from zero. If lambda is ½, a deviation in inflation will be considered to be twice as costly as a corresponding deviation of the output gap. The loss function includes inflation and the output gap quadratically, which means that the costs of deviations are as high on the upper side as on the lower side.2 The central bank is assumed to set an interest rate that minimises L given the functioning of the economy (the "model").3
The central bank’s trade-offs, represented by the loss function, cannot be observed directly. Only the actual policy choices can be observed.4 If the loss function (1) is used as a basis, the actual policy choices will be represented by the first-order condition for minimising the loss. In simple models, it will look like this:5
(2) π – π* + αy = 0,
where α= λ/γ, where γ is the slope of the Phillips curve (ie how much inflation increases when the output gap widens). In models with more realistic dynamics, the first-order condition becomes more complicated. Equation (2) can then be interpreted as a simple target criterion, which is an approximation of optimal trade-offs given the model.6
The target criterion (2) states that the central bank shall set the interest rate so that a weighted sum of the inflation gap (π – π*) and the output gap is zero. It implies that the two gaps should have opposite signs.7 For example, if both the inflation gap and the output gap are negative, the central bank will achieve better goal attainment with a lower interest rate, since this will bring both inflation closer to target and higher output and employment. When the two gaps have opposite signs, there will be a conflict between the two objectives; it is not possible to bring inflation closer to target without adversely affecting output and employment.
The weight on output and employment in relation to inflation is expressed in alpha (α). However, it is not obvious what a correct value for alpha is. If we start from the optimal value of alpha in simple models (α = λ/γ), it depends on what is a reasonable value of lambda and the estimated slope of the Phillips curve. The Federal Reserve (Fed) has interpreted a dual mandate to mean that lambda is 1 in a loss function with an inflation and unemployment gap.8 9 Lars Svensson, often referred to as "the father of inflation targeting" because of his influence on inflation targeting, also argues that inflation and unemployment should have approximately equal weight in the loss function under flexible inflation targeting, also when the mandate is hierarchical in the sense that low and stable inflation takes precedence in the trade-offs.10 11
In the monetary policy literature, it is more common to use the output gap than the unemployment gap as an indicator of the real economy, but they represent the same consideration. When comparing loss functions with the output gap and the unemployment gap respectively, one must take into account the relationship between the two, often referred to as "Okun’s Law", in order to obtain a lambda that represents the same weight on the real economy. In the United States, Okun’s Law is approximately u = –0.5y, which implies that a weight on the unemployment gap of 1, as argued by the Fed and Svensson, implies the same emphasis as λ = 0.25 in equation (1).12 Statistics Norway has estimated Okun’s Law for Norway to be u = –0.31y, which is also in line with our estimates.13 Given this estimate, an equal weight on unemployment and inflation in the loss function implies that lambda in equation (1) is λ ≈ 0.1.14
In order to obtain an estimate of γ, ie how much inflation increases when the output gap increases, we have based our analysis on the relationship in our macroeconomic model NEMO. A temporary decline in the interest rate leads to an increase in inflation that is just over half of the increase in the output gap, which implies a value of γ just above 0.5.15 This means that an ’equality’ between inflation and unemployment, based on the Fed’s and Svensson’s interpretation, implies α ≈ 0.2 in the target criterion (2).
However, when applied in a purely operational context, interpreting ’equality’ between inflation and unemployment is not obvious. While the Fed and Svensson interpreted that as assigning equal weight to inflation and unemployment in the loss function, it can also be interpreted as giving equal weight to inflation and the output gap, or inflation and employment, in the respective loss functions. The latter interpretations would have given a significantly higher alpha and thereby a significantly higher degree of stabilisation of the real economy relative to inflation.
In an earlier analysis, we used an indicator of trade-offs based on a target criterion as in equation (2), where alpha is set at 1.16 Even though it is also not obvious that alpha should be close to 1, we find that it gives a more reasonable weight on output and employment than an alpha of 0.2, which would have been consistent with the Fed’s and Svensson’s proposition.
Our mandate states that Norges Bank shall maintain low and stable inflation and contribute to high and stable output and employment. However, the emphasis to be placed on the respective considerations in the practical conduct of monetary policy is not specified. Our interpretation of the mandate is that considerable emphasis should be placed on employment – also in the current situation with price inflation markedly above target.
The target criterion (2) is based on current inflation and output, as most commonly formulated in simple theory models. In reality, monetary policy influences inflation and output with a lag. Given that lag, it is impossible in practice for monetary policy to satisfy a target criterion based on inflation and output in the current period because shocks occur that change inflation and the level of activity, and that monetary policy does not have time to counteract in the very short term. It is therefore more appropriate to focus on the forecasts of inflation and the output gap one to three years ahead. Over this horizon, the central bank is able to satisfy a target criterion such as (2).
Chart 4.A shows the combination of forecasts of the inflation gap and the output gap in various Monetary Policy Reports since Norges Bank began publishing interest rate forecasts in 2005.17 The chart is related to the so-called "Bullseye Chart" of the Fed, where the goal is for the dots to be as close to the bullseye as possible.18 The dots will deviate from the bullseye when disturbances arise that give rise to short-term conflict between the two objectives.
Chart 4.A Forecasts of the inflation gap and the output gap in various Monetary Policy Reports
Average 1–3 years ahead
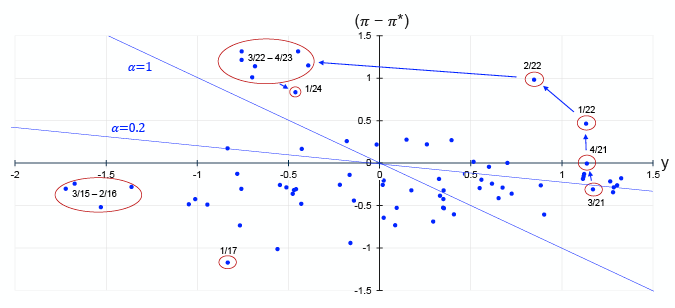
TThe blue lines in the chart represent two versions of the target criterion – one that represents the Fed’s and Svensson’s interpretation of equal considerations (α = 0.2) and one that represents the indicator in our earlier analysis mentioned above (α = 1).
As the chart shows, neither of the two target criteria provides a good description of the various forecasts. It can therefore be concluded that the assessments are more complex than can be summarised in a simple target criterion. Nor is it the case that the Committee only considers the forecasts of inflation and the output gap when assessing the interest rate path. For example, the Committee may place weight on risk factors that are relevant to the conduct of monetary policy, but which cannot easily be incorporated into the actual forecasts. This may at times generate substantial deviations from a simple linear relationship between the inflation and output gap forecasts, as implied by simple theoretical models.
It is also worth noting that in many of the Reports, the inflation gap and output gap forecasts have the same sign. It is, seemingly, a violation of one of the conditions for optimal policy. In particular, the cases where both gaps are negative, ie the points are located in the southwestern quadrant of the chart, have occurred frequently.
One important reason why Norges Bank has in many cases set up an interest rate path that results in inflation below target while the output gap is negative in its forecasts is the consideration of counteracting the build-up of financial imbalances. Even though a lower interest rate would have brought inflation further up to target and resulted in a less negative output gap, a very low interest rate may contribute to increased borrowing, higher property prices and thereby possible financial imbalances. This may in turn increase the risk of severe downturns further ahead. The consideration of mitigating the build-up of financial imbalances was a stated consideration in many monetary policy reports, particularly in the years following the financial crisis. When financial imbalances are represented in the loss function, in addition to the inflation and output gap, the inflation gap and output gap do not necessarily have the opposite sign for optimal trade-offs.19
Uncertainty surrounding the effects of monetary policy is also relevant to the trade-offs. An important result, shown by William Brainard in 1967, is that monetary policy should respond more cautiously to shocks when there is uncertainty about the effects of the interest rate.20 When, due to this uncertainty, the central bank changes the interest rate less than would otherwise have been the case when disturbances occur, it may in some situations be the correct trade-off that both inflation and output gap forecasts have the same sign. If, for example, an inflation shock brings inflation above target while the output gap is positive, uncertainty about the effect of the interest rate may in theory imply that it may not be optimal to increase the interest rate to the extent that one of the gaps turns negative.
While in most cases both gaps are negative in chart 4.A, there are also some cases where both are positive. This was most pronounced in the first two Monetary Policy Reports of 2022, where forecasts in isolation indicate that goal attainment could have been better with a higher interest rate path. During this period, the Committee gave weight to the fact that the objective of stabilising inflation around the target somewhat further out implied a higher policy rate, but that uncertainty surrounding economic developments and households’ response to a higher interest rate level suggested that the policy rate should be raised gradually.
In the last seven reports, the inflation gap has been positive over the forecast horizon, while the output gap has been negative on average. The forecasts therefore satisfy the requirement of different signs in the target criterion (2). However, the weight on the real economy has been somewhat higher than implied by both versions of the target criterion.
- 1 The output gap is an estimate of the percentage difference between actual output and the highest level that is consistent with price stability over time. See Norges Bank (2022) “Norges Bank’s Monetary Policy Handbook”, Staff Memo 1/2022, for a more detailed description of how we estimate the output gap.
- 2 A quadratic loss function is a simplification. In reality, deviations on the upper and lower sides need not be symmetrical. In Norges Bank (2021) “Norges Bank’s monetary policy strategy” we argue that the costs of cyclical fluctuations are asymmetrical, which implies that the output gap is not actually included squarely. However, because quadratic loss functions have some computational advantages, the policy implications of asymmetry are made discretionary "outside" the model apparatus.
- 3 More precisely, the central bank seeks to minimise the discounted sum of expected losses today and in the future.
- 4 The loss function included in Norges Bank’s main model NEMO cannot be interpreted directly as the Committee’s emphasis on the various considerations. See pp.41–43 in Norges Bank (2022) “Norges Bank’s Monetary Policy Handbook”, Staff Memo 1/2022, for a description of the loss function in NEMO and how it should be interpreted.
- 5 See eg Røisland and Sveen (2018) "Monetary Policy under Inflation Targeting". Occasional Papers No 53. Norges Bank.
- 6 The difference between a simple target criterion and the first-order criterion in more complicated models is related to the difference between a simple interest rate rule, such as the Taylor rule, and a more complicated optimal interest rate reaction function. Even if they are not optimal, simple rules and criteria can be more robust to the model being misspecified than optimal rules and criteria. See Giannoni M.P. and M. Woodford (2017) "Optimal target criteria for stabilization policy". Journal of Economic Theory 168, pp 55–106 for an analysis of optimal target criteria.
- 7 This is sometimes referred to as the "Qvigstad rule" after Qvigstad, J.F. (2006) "When does an interest rate path look good? Criteria for an appropriate future interest rate path". Working Papers 5/2006. Norges Bank.
- 8 The unemployment gap is the deviation of unemployment from the lowest level consistent with price stability over time.
- 9 See Federal Reserve Bank of Chicago (2020) “The Bullseye Chart”. October 20th. See also Debortoli, D. J. Kim, J. Lindé and R. Nunes (2019) "Designing a Simple Loss Function for Central Banks: Does a Dual Mandate Make Sense?" Economic Journal 129 (621), pp 2010–2038
- 10 Svensson, L.E.O. (2014) "How to weigh unemployment relative to inflation in monetary policy". Journal of Money, Credit and Banking 46 (52), pp 183–188.
- 11 See Norges Bank (2022) “Norges Bank’s Monetary Policy Handbook”. Staff Memo 1/2022 for a discussion of the difference between an equal (dual) mandate and a hierarchical mandate.
- 12 To see it, one can start from the Fed’s loss function L = (π – π*)2 + u2 and replace u by u = –0.31y, which gives L = (π – π*)2 + 0.25y2.
- 13 See Statistics Norway (2022) Økonomiske analyser 4/2022, pp 16–17 (Norwegian only).
- 14 By replacing u in Fed’s loss function with –0.31y, we obtain the following loss function which is equivalent to the Fed’s "dual" loss function: L = (π – π*)2 + 0.096y2.
- 15 See Kravik, E.M. and Y. Mimir (2019) "Navigating with NEMO". Staff Memo 5/2019, p. 45. Norges Bank.
- 16 The indicator is documented in Norges Bank (2022) “Norges Bank’s Monetary Policy Handbook”. Norges Bank Papers 1/2022, pp. 44–46. The indicator is called LOC (Leaning and Other Considerations), where the name alludes to the fact that deviations from the LOC indicator may represent weighting of considerations other than the pure forecasts for the inflation gap and the output gap, such as the consideration of counteracting the build-up of financial imbalances and caution as a result of uncertainty about the effects of interest rate changes.
- 17 Forecasts based on technical assumptions, such as market interest rate expectations, published before 2005, do not necessarily reflect the central bank’s assessments, since market expectations may deviate from the policy rate path envisaged by the central bank.
- 18 See Federal Reserve Bank of Chicago (2020) “The Bullseye Chart”. October 20th. The Bank of England has conducted a similar analysis based on the projections, but these projections are conditional on market participants’ interest rate expectations and not on the central bank’s own interest rate forecasts. They will therefore not fully reflect central banks’ assessments. See Carney, M. (2017) Lambda. Bank of England, January 16th.
- 19 See Røisland, Ø. and T. Sveen (2018) "Monetary Policy under Inflation Targeting". Occasional Papers No 53, pp. 23–29. Norges Bank.
- 20 Brainard, W. (1967) "Uncertainty and the Effectiveness of Policy". American Economic Review, 57(2), pp. 411–425.
Annex
Detailed tables of projections
TABLe 1 International projections
|
Change from projections in Monetary Policy Report 4/23 in brackets |
Weights1 Percent |
Percentage change from previous year |
||||
|---|---|---|---|---|---|---|
|
2023 |
2024 |
2025 |
2026 |
2027 |
||
|
GDP |
||||||
|
US |
12 |
2.5 (0.1) |
2.2 (0.7) |
1.6 (0.1) |
1.6 (-0.1) |
1.5 |
|
Euro area |
47 |
0.5 (0.1) |
0.7 (-0.2) |
1.6 (-0.3) |
1.6 (0) |
1.6 |
|
UK |
15 |
0.1 (-0.4) |
0.3 (-0.2) |
1.2 (0.1) |
1.5 (0) |
1.3 |
|
Sweden |
18 |
0 (0.3) |
0.3 (0.1) |
2 (-0.2) |
2 (0) |
1.8 |
|
China |
8 |
5.3 (-0.2) |
4.5 (0.2) |
4.1 (0.2) |
3.7 (0.1) |
3.6 |
|
5 trading partners1 |
100 |
1 (0) |
1.1 (0) |
1.8 (-0.1) |
1.8 (0) |
1.7 |
|
Prices |
||||||
|
Underlying inflation2 |
5.3 (0) |
3 (0.1) |
2.3 (0) |
2.2 (0.1) |
2.1 |
|
|
Wage growth2 |
4.9 (-0.1) |
4 (0) |
3.5 (0.1) |
3.1 (0) |
3.0 |
|
|
Prices for consumer goods imported to Norway3 |
-0.5 (-0.1) |
0.5 (-0.4) |
0.1 (-0.8) |
0.8 (0) |
0.8 |
|
Sources: LSEG Datastream and Norges Bank
Table 2a Consumer prices. Twelve-month change. Percent
|
2023 |
2024 |
||||||
|---|---|---|---|---|---|---|---|
|
Dec |
Jan |
Feb |
Mar |
Apr |
May |
Jun |
|
|
Consumer price index (CPI) |
|||||||
|
Actual |
4.8 |
4.7 |
4.5 |
||||
|
Projections MPR 4/23 |
4.9 |
4.8 |
5.3 |
4.6 |
|||
|
Projections MPR 1/24 |
4.2 |
3.9 |
3.3 |
3.3 |
|||
|
CPI-ATE |
|||||||
|
Actual |
5.5 |
5.3 |
4.9 |
||||
|
Projections MPR 4/23 |
5.6 |
5.4 |
5.5 |
5.2 |
|||
|
Projections MPR 1/24 |
4.7 |
4.5 |
4.2 |
3.9 |
|||
|
Imported consumer goods in the CPI-ATE |
|||||||
|
Actual |
5.7 |
4.3 |
5.0 |
||||
|
Projections MPR 4/23 |
5.8 |
5.4 |
5.5 |
5.0 |
|||
|
Projections MPR 1/24 |
4.3 |
3.9 |
3.5 |
2.7 |
|||
|
Domestically produced goods and services in the CPI-ATE |
|||||||
|
Actual |
5.3 |
5.8 |
4.8 |
||||
|
Projections MPR 4/23 |
5.6 |
5.5 |
5.6 |
5.5 |
|||
|
Projections MPR 1/24 |
4.9 |
4.9 |
4.6 |
4.6 |
|||
Sources: Statistics Norway and Norges Bank
Table 2b House prices. Monthly change. Seasonally adjusted. Percent
|
2023 |
2024 |
||||||
|---|---|---|---|---|---|---|---|
|
Dec |
Jan |
Feb |
Mar |
Apr |
May |
Jun |
|
|
Actual |
0.0 |
0.7 |
0.7 |
||||
|
Projections MPR 4/23 |
0.0 |
-0.2 |
-0.2 |
-0.1 |
|||
|
Projections MPR 1/24 |
0.3 |
0.4 |
0.3 |
0.3 |
|||
Sources: Eiendomsverdi, Finn.no, Real Estate Norway and Norges Bank
Table 2c Registered unemployment (rate). Percent of labour force. Seasonally adjusted
|
2023 |
2024 |
||||||
|---|---|---|---|---|---|---|---|
|
Dec |
Jan |
Feb |
Mar |
Apr |
May |
Jun |
|
|
Actual |
1.9 |
1.9 |
1.9 |
||||
|
Projections MPR 4/23 |
1.9 |
1.9 |
2.0 |
2.0 |
|||
|
Projections MPR 1/24 |
1.9 |
2.0 |
2.0 |
2.0 |
|||
Sources: Norwegian Labour and Welfare Administration (NAV) and Norges Bank
Table 2d GDP for mainland Norway. Monthly change. Seasonally adjusted. Percent
|
2023 |
2024 |
||||||
|---|---|---|---|---|---|---|---|
|
Dec |
Jan |
Feb |
Mar |
Apr |
May |
Jun |
|
|
Actual |
-0.1 |
||||||
|
Projections MPR 4/23 |
-0.2 |
-0.2 |
0.1 |
0.2 |
|||
|
Projections MPR 1/24 |
0.1 |
0.1 |
0.0 |
0.0 |
0.0 |
0.0 |
|
Sources: Statistics Norway and Norges Bank
Table 2e GDP for mainland Norway. Quarterly change.1 Seasonally adjusted. Percent
|
2023 |
2024 |
|||
|---|---|---|---|---|
|
Q3 |
Q4 |
Q1 |
Q2 |
|
|
Actual |
0.1 |
0.2 |
||
|
Projections MPR 4/23 |
0.0 |
-0.3 |
0.1 |
|
|
Projections MPR 1/24 |
0.0 |
0.0 |
||
- 1 Quarterly figures based on monthly national accounts.
Sources: Statistics Norway and Norges Bank
Table 3 Projections for main economic aggregates
|
Change from projections in Monetary Policy Report 4/23 in brackets |
Percentage change from previous year (unless otherwise stated) |
|||||
|---|---|---|---|---|---|---|
|
In billions of NOK 2023 |
2023 |
Projections |
||||
|
2024 |
2025 |
2026 |
2027 |
|||
|
Prices and wages |
||||||
|
CPI |
5.5 (0.0) |
3.8 (-0.6) |
2.7 (-0.1) |
2.6 (0.1) |
2.3 |
|
|
CPI-ATE |
6.2 (0.0) |
4.1 (-0.7) |
3.2 (-0.3) |
2.7 (0.2) |
2.3 |
|
|
Annual wages |
5.2 (-0.3) |
4.9 (-0.1) |
4.3 (0.0) |
3.7 (0.0) |
3.4 |
|
|
Real economy1 |
||||||
|
Gross domestic product (GDP) |
5141 |
0.8 (0.2) |
0.4 (-0.4) |
1.8 (0.6) |
0.5 (-0.2) |
0.7 |
|
GDP, mainland Norway2 |
3859 |
1.1 (0.1) |
0.5 (0.4) |
1.2 (0.0) |
1.3 (-0.2) |
1.6 |
|
Output gap, mainland Norway (level) |
0.8 (0.0) |
0.0 (0.4) |
-0.3 (0.4) |
-0.5 (0.2) |
-0.4 |
|
|
Employment, persons, QNA |
1.3 (0.0) |
0.4 (0.5) |
0.4 (0.0) |
0.6 (-0.1) |
1.0 |
|
|
Registered unemployment (rate, level) |
1.8 (0.0) |
2.0 (-0.1) |
2.2 (-0.1) |
2.2 (-0.1) |
2.2 |
|
|
Demand1 |
||||||
|
Mainland demand2 |
4021 |
0.6 (0.9) |
0.0 (0.2) |
2.0 (0.2) |
2.3 (0.1) |
2.3 |
|
– Household consumption |
1925 |
-0.5 (0.4) |
1.0 (0.8) |
2.1 (0.3) |
2.1 (-0.6) |
2.1 |
|
– Business investment |
503 |
4.9 (1.5) |
-4.4 (-1.2) |
1.9 (-0.3) |
2.8 (1.8) |
3.0 |
|
– Housing investment |
208 |
-15.6 (-0.5) |
-12.5 (-6.1) |
5.9 (0.9) |
9.6 (2.7) |
9.0 |
|
– Public demand |
1386 |
3.5 (1.4) |
2.1 (0.9) |
1.4 (0.0) |
1.5 (0.4) |
1.2 |
|
Petroleum investment2 |
216 |
10.5 (2.5) |
10.0 (3.0) |
-5.0 (-4.0) |
-3.0 (-1.0) |
-3.0 |
|
Mainland exports2 |
1043 |
7.8 (1.2) |
2.6 (0.5) |
1.9 (-0.5) |
1.9 (-1.9) |
2.7 |
|
Imports |
1668 |
1.4 (-0.6) |
-1.7 (-1.4) |
2.0 (-0.2) |
1.9 (-0.5) |
2.1 |
|
House prices and debt |
||||||
|
House prices |
-0.3 (-0.1) |
2.9 (1.9) |
6.2 (1.1) |
7.7 (1.2) |
6.5 |
|
|
Household credit (C2) |
3.3 (-0.1) |
2.7 (-0.1) |
2.6 (0.1) |
2.6 (-0.1) |
2.9 |
|
|
Interest rate, exchange rate and oil price |
||||||
|
Policy rate (level) |
3.5 (0.0) |
4.4 (-0.1) |
3.9 (0.0) |
3.3 (0.1) |
2.9 |
|
|
Import-weighted exchange rate (I-44) (level) |
119.5 (-0.2) |
118.8 (-2.7) |
118.7 (-1.8) |
118.4 (-2.1) |
118.1 |
|
|
Policy rate, trading partners (level) |
3.9 (0.0) |
4.1 (0.2) |
3.1 (0.2) |
2.7 (0.2) |
2.6 |
|
|
Oil price, Brent Blend. USD per barrel |
82.5 (0.6) |
83.6 (7.7) |
78.0 (4.4) |
74.4 (2.9) |
72.1 |
|
|
Household income and saving1 |
||||||
|
Real disposable income excl. dividend income |
-1.5 (0.0) |
1.6 (0.8) |
2.6 (0.1) |
2.7 (-0.4) |
2.7 |
|
|
Saving ratio excl. dividend income (rate, level) |
0.2 (0.9) |
1.0 (0.5) |
1.3 (0.3) |
1.7 (0.5) |
2.2 |
|
|
Fiscal policy |
||||||
|
Structural non-oil deficit as a percentage of GPFG3 |
3.1 (0.1) |
2.8 (0.1) |
2.7 (0.1) |
2.7 (0.1) |
2.7 |
|
|
Structural non-oil deficit as a percentage of trend GDP |
10.3 (0.4) |
10.9 (0.6) |
11.1 (0.9) |
11.3 (1.1) |
11.5 |
|
Sources: Eiendomsverdi, Finn.no, LSEG Datastream, Ministry of Finance, Norwegian Labour and Welfare Administration (NAV), Real Estate Norway, Statistics Norway and Norges Bank